dmic development in gujarat
DESCRIPTION
Presentation made by Mr Dilip Brahmbhatt, Sr Manager, GIDB, Gujarat at the India LAC Investment Conclave. The conclave is being organised by FICCI in New Delhi. More details at indialacconclave.comTRANSCRIPT

Dholera Special Investment Region
under DMICDC
October 16 , 2014
DSIR - PCPIR
INVEST INDIA
DMIC Development in Gujarat

Page 2
OUTLINE
DSIR Overview and Planning
Activation Area Implementation strategy
Activation Area Trunk Infrastructure
Activation Area Schedule
Activation Area Budgetary Cash Flow

Delhi Mumbai Industrial Corridor
MUMBAI
• Delhi to Mumbai - High axle load 1499 km
• Influence area 150 km on both sides of the corridor
• Covering 6 states with 24 proposed nodes
• Length in Gujarat– 553 km (37%) with 6 nodes including Ahmedabad - Dholera node
Page 3
DFC Western corridor at a glance
Current status of DFC Western corridor
Project Schedule of DFC Western corridor
• Under construction, approved in Rail Budget 2014-15
• Phase I (Rewari – Vadodara) 920kms – 2011 – 2017
• Phase II (Vadodara – JNPT) 430kms – 2012 – 2018
• Phase III (Rewari – Dadri) 140kms – 2013 - 2018
DFC western corridor
Area under DMIC

It is Nation Building.
Most ambitious kind of an opportunity
Dholera SIR is not a project…
Page 4

Development (Master ) Plan is the Basis for DSIR Implementation
N
Total DSIR Area – 920 sqkm
Developable Area – 580 sqkm
Page 5

Residential &
Mixed Use
14%
Industrial
14%
Infrastructure
5%
Recreational &
Tourism
11%
CRZ & Non
Developable
Land
56%
DSIR Development Plan Sanctioned Land Use Pattern
LANDUSE TYPES TOTAL DP AREA
Ha
Residential 9,780
High Access Corridor 2,645
City Centre 679
Mixed Use
TOTAL – 13104 Ha
Industrial 11,457
Knowledge and IT 1,230
TOTAL – 12687 Ha
Solar Park 1,346
Strategic Infrastructure
3,554
Public Facilities
250 Mt. Express Road
55 Mt. DP Road
Logistics
TOTAL – 4900 Ha
Recreation, Sports and Entertainment 4,500
Green Spaces 1,960
Tourism: Resorts 3,889
TOTAL – 10349 Ha
Gamtal 1,772
Village Buffer
Agriculture
15,272
Notified Forest Land
Water Body
River
River Buffer Zone
Coastal Regulation Zone (CRZ) 33,885
TOTAL – 50929 Ha
GRAND TOTAL 91,969
Page 6

Dholera SIR: Key Indicators
91,970 Ha (920 sq km)
Total Area 58085 Ha
(580 sq. Kms)
Area outside CRZ
33,885 Ha (340 sq. Kms)
Area under CRZ
As per Development Plan for 2042
Page 7
22 Villages of Ahmedabad District Existing Population 37000 (Census – 2001)
Population of Dholera Village 2637 (Census – 2001)

Dholera SIR: Development Plan Projections
2.0 million
Resident population in DSIR
Supported Jobs
484,000
Industrial, Tourism
& other Jobs
343,000
Total Jobs
827,000
Page 8
As per Development Plan for 2042

Phase TP Scheme Area (Sq.km)
Time line
1 1 51.40
2012 – 2022 2 102.34
2 3 66.60
2023 – 2032 4 60.00
3 5 74.75
2033 – 2042 6 67.33
Total 422. 42 30 years
DSIR Town Planning Schemes are Phased over 3 Decades
TP-4
TP-2
TP-3
TP-1
TP-5
TP-6
Page 9
• All 6 Draft TP Schemes notified
• Final TP Schemes in process
• 422 sq.km. area will be
developed from 580 sq.km
available (158 sq. km. is
agriculture)
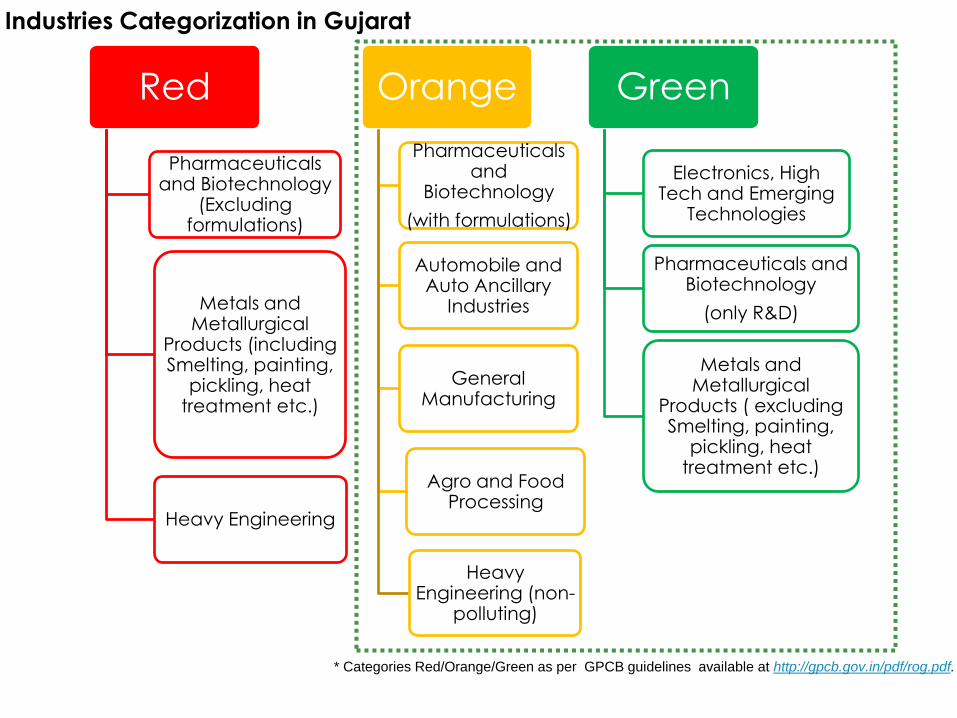
Industries Categorization in Gujarat
Page 10
Red
Pharmaceuticals and Biotechnology
(Excluding formulations)
Metals and Metallurgical
Products (including Smelting, painting,
pickling, heat treatment etc.)
Heavy Engineering
Orange
Pharmaceuticals and
Biotechnology
(with formulations)
Automobile and Auto Ancillary
Industries
General Manufacturing
Agro and Food Processing
Heavy Engineering (non-
polluting)
Green
Electronics, High Tech and Emerging
Technologies
Pharmaceuticals and Biotechnology
(only R&D)
Metals and Metallurgical
Products ( excluding Smelting, painting,
pickling, heat treatment etc.)
* Categories Red/Orange/Green as per GPCB guidelines available at http://gpcb.gov.in/pdf/rog.pdf.

Page 11
Allowed Industries in DSIR
Electronics, High-tech Emerging
Technologies
Pharmaceuticals and
Biotechnology Heavy Engineering
Automobile and Auto
Ancillary Industries
General
Manufacturing
Agro and Food
Processing
Metals and
Metallurgical Products Tourism IT & ITES Education
Only Non polluting industries are allowed in DSIR – as per DP
Source: Development Plan

Major Milestones – Completed and Planned
• SIR Act enacted – Jan 2009
• Declaration of Dholera SIR – May 22, 2009
• Constitution of Dholera SIR Development Authority – Feb 16, 2010
• Development plan sanctioned – Sep 10, 2012
• Draft Town Planning (1 & 2) Scheme sanctioned – Oct 3, 2012
• Draft Town Planning (3 to 6) Scheme sanctioned – Oct 24, 2013
• Environmental clearance notification received – Aug 22, 2014
• Activation Area Pre-Design (Roads & Services) – Nov 2014
• Activation Area Tender Issue (Roads and Services) – Jan, 2015
• Activation Area Roads & Services Contract Award – June, 2015
• Anchor Tenant (land)Possession – Q4, 2015 to Q4, 2018
Page 12

Page 13
OUTLINE
DSIR Overview and Planning
Activation Area Implementation Strategy
Activation Area Trunk Infrastructure
Activation Area Schedule
Activation Area Budgetary Cash Flow

TP1
TP2E
TP2W
TP1
TP2E
TP2W
DSIR (TP1 to TP6) Phase 1 (TP1 & TP2) Activation area
580 sqkm 153 sqkm 22.54 sqkm
Page 14
Development Strategy

Area with highest percentage of
Government Land
Future expansion of development on
private parcels
Original government holdings in Dholera DSIR sanction Development Plan
Page 15
Activation Area Implementation Strategy – Site Identification

• Connectivity to existing roads (SH6 and Coastal
Highway)
• Proximity to Dholera Village
• Maximum use of Govt. land (Survey no 18)
• Optimum land mix for self-sustaining township
• Quick implementation of engineering solutions
• Existing MOUs with developers
• Implementation Area = 2254ha (22.54 sqkm)
Govt + Public purpose - 1960ha
Private - 294ha
Criteria to Ensure a Successful Activation Area
Page 16
Implementation area
Survey no 18
Dholera
Bhimtalav

Implementation area
Page 17
Activation area - Road Network
Implementation area – 2254ha
ABCD
Building
Dholera
Bhimtalav

Total area – 2254 Ha
Industrial
48%
Mixed use -high
access corridor
4%
Residential
28%
Recreation and
Tourism
8%
Roads
12%
Activation Area Land Use Distribution
Page 18

92,600
Resident population in
Activation Area
Supported Jobs
37,800
Industrial, Tourism
& other Jobs
40,800
Total Jobs
78,600
Page 19
Activation Area Population Projections
2254 Ha (22.54 sq km)
Total Area

Page 20
OUTLINE
DSIR Overview and Planning
Activation Area Implementation strategy
Activation Area Trunk Infrastructure
Activation Area Schedule
Activation Area Budgetary Cash Flow
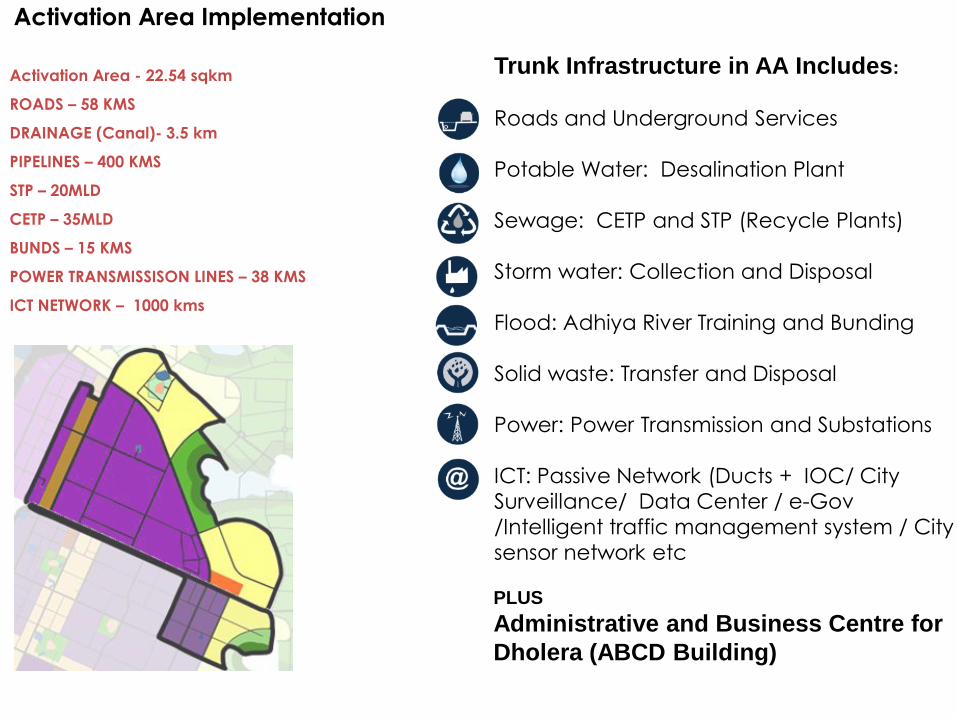
Activation Area Implementation
Trunk Infrastructure in AA Includes:
Roads and Underground Services
Potable Water: Desalination Plant
Sewage: CETP and STP (Recycle Plants)
Storm water: Collection and Disposal
Flood: Adhiya River Training and Bunding
Solid waste: Transfer and Disposal
Power: Power Transmission and Substations
ICT: Passive Network (Ducts + IOC/ City
Surveillance/ Data Center / e-Gov
/Intelligent traffic management system / City
sensor network etc
Activation Area - 22.54 sqkm
ROADS – 58 KMS
DRAINAGE (Canal)- 3.5 km
PIPELINES – 400 KMS
STP – 20MLD
CETP – 35MLD
BUNDS – 15 KMS
POWER TRANSMISSISON LINES – 38 KMS
ICT NETWORK – 1000 kmss
Page 21
PLUS
Administrative and Business Centre for
Dholera (ABCD Building)

Activation Area Roads
Road RoW Length
A 70 8
B 55 7.3
C 55 3.4
D 30 3.3
E 30 3.9
F 30 2.2
G 20 1.6
H 20 2.2
I 20 3.75
J 20 1.5
K 20 1.4
L 18 3.4
M 18 11.1
N (ABCD Road) 20 1
O 55 3.5
TOTAL 57.55
TP Level Roads: - 58 Km
Plot level Roads: – 15Km ( required for social infra)
Underground services – Both sides of the roads
Page 22
Activation area – Roads & Services
ABCD
Building
C D
E F
G
L
H
I
J
K
B
M
A
O
N Dholera
Bhimtalav

ROADS & UTILITIY SERVICES - Storm Water Collection, Reuse and Disposal
Page 23
Length & cost are approximate
MAIN outfall
OF - 1
OF - 2
OF - 3
Sustainable Canal System (PDR cost estimate)
Canal drain range 0.5m – 12m
Canal drain system cost 330 Crores
Conventional RCC drain system 600 Crores
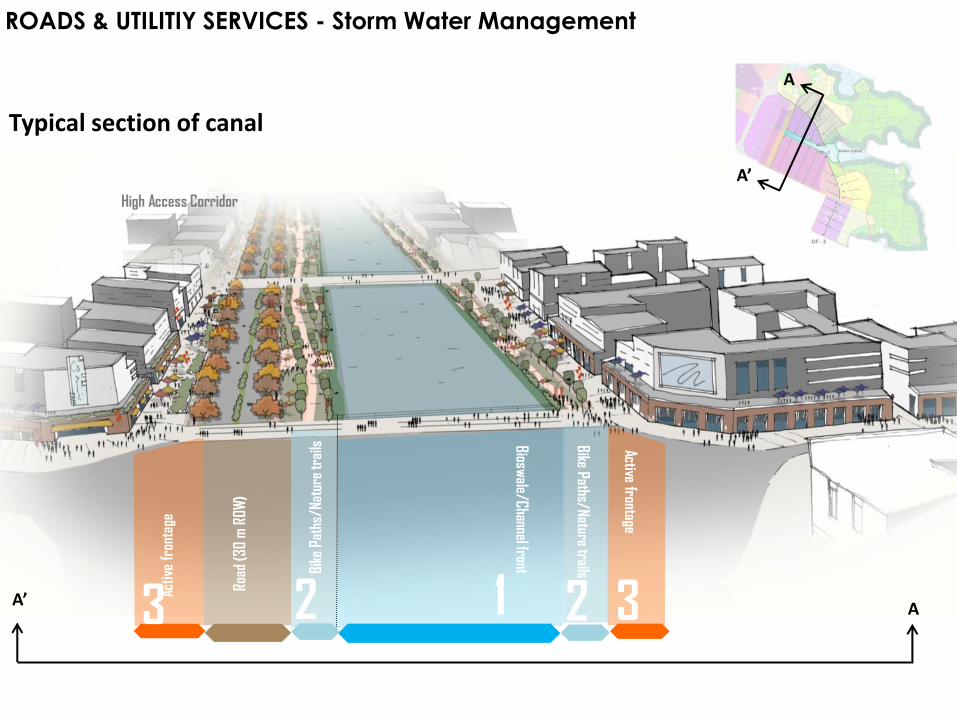
ROADS & UTILITIY SERVICES - Storm Water Management
Page 24
3
Activ
e fr
onta
ge
1 3
Active frontage
High Access Corridor
Bioswale/Channel front
Bike Paths/Nature trails
2 1 Road
(30
m R
OW)
Bike
Pat
hs/N
atur
e tr
ails
2
Typical section of canal
A
A’
A’ A

Page 25
Urban Street Guidelines Enhances Functionality, Uniformity and Consistency
• Identify the sub-zones within streetside designated for different activities based on IRC -103-2012.
• STREETSIDE =
(DEAD WIDTH + FOOTPATH +
FURNISHING + EDGE ZONE)
EDGE
ZONE
FURN-
ISHING
ZONE
FOOT
PATH DEAD
WIDTH
Source: IRC -103-2012
FOOT
PATH
DEAD
WIDTH
FURN-ISHING
ZONE
EDGE
ZONE
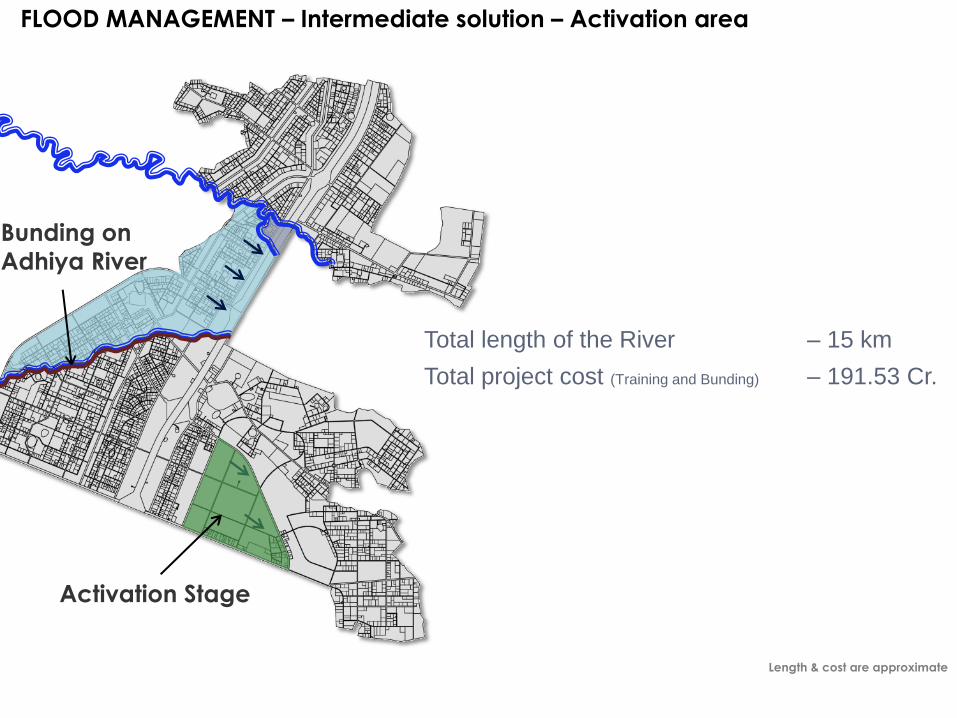
Activation Stage
Bunding on
Adhiya River
Page 26
FLOOD MANAGEMENT – Intermediate solution – Activation area
Total length of the River – 15 km
Total project cost (Training and Bunding) – 191.53 Cr.
Length & cost are approximate

Activation Area Potable Water: Brackish Ground Water Desalination
Desal Plant 40MLD
Desalination
Plant
40 MLD
Receiving
Chamber of
Bore wells
Desalination Brine disposal (HDPE Pipe) Length 15 Km
Est. cost of 120 bore well with >200 depth
Transmission main to MBR (630MM) Length – 5 km
MBR
Note: Numbers and Locations of Bore well are tentative
Desalination Plant
Transmission main from Bore well to Desalination Plant (HDPE pipe) Length – 15 Km
Page 27
Total Capacity – 40MLD
Total project cost – 499.16 Cr.
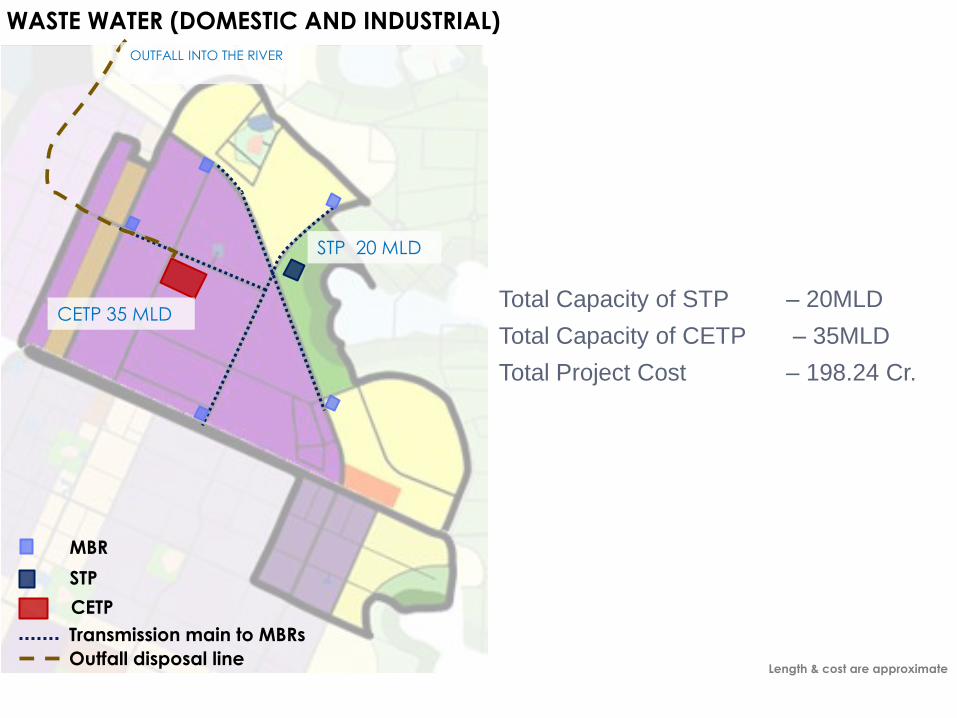
WASTE WATER (DOMESTIC AND INDUSTRIAL)
Page 28
STP
CETP
MBR
STP 20 MLD
CETP 35 MLD
Transmission main to MBRs
Outfall disposal line Length & cost are approximate
Total Capacity of STP – 20MLD
Total Capacity of CETP – 35MLD
Total Project Cost – 198.24 Cr.
OUTFALL INTO THE RIVER

Page 29
Solid Waste Management
Source of waste generation
Construction Phase
Operation Phase
Solid waste transfer station
Total project cost – 21 Cr.
Project completion target- 2020
Industrial Waste Municipal Waste
Biomedical Waste Electronics Waste
Waste Management
Activities The anticipated date of completion of detailed
design for the solid waste management for the
land fill site development is May 2016

POWER
Pipli
Fedara
400 KV Sub Station
400kV overhead Transmission Line length 27 Km
400kV underground Transmission Line length 11 Km
Other substations and cable works
Substation at Fedara
Page 30
Length & cost are approximate
Transmission lines – 38 km
Total project cost – 1106.68 Cr.

Page 31
Information Communication & Technology (ICT)
Integrated
Operations Center
e/m-Governance /
Applications Networks City’s Dash Board Data Center
Command and
Control Center
City Surveillance /
Video Analytics
Traffic
Management incl
traffic violation
monitoring
Intelligent Transport
System
City Wide Signage
Emergency
Response Center
(incl first point of
contact)
Healthcare
Public Safety and Security
Education
Local Administration and
Public Facilitation
Transportation
Intelligent Utility
Management (Power,
Water, Waste, Street
Lighting)
Citizens and authority
interaction
City Portal
Combined services help
desk
Smart City network for
all ICT enabled city
provided services
City wide Wi Fi
network
City wide sensors
network for utilities
Duct and Dark Fibre
for Telcos
Smart metering
network for electricity,
gas and water
Fire (sensors) / Intrusion
(burglary)alarm
network
Visibility to city’s
mayor on all major
operating metrics on
real time basis
spanning utilities
(power, gas, water,
waste, transport),
functions over m-
Governance for local
administration and
public facilitation
and data on air, CO,
noise level
(mapping)etc
Centralized
processing and
repository for DSIR
Total project cost – 465 Cr.

Page 32
ABCD Building
Length & cost are approximate
Built-up area (Phase –I) – 14000 sqm
Total project cost – 54.82 Cr.

EXTERNAL CONNECTIVITY
Page 33

Botad
Railway Junction
Existing Meter gauge line
Botad to Bhimnath
Proposed Broad Gauge line
Bhimnath to Dholera
Dholera International
Airport
DFC Alignment
AHMEDABAD
Kheda
Bhimnath
Railway Station
MRTS Terminal at
CBD in DSIR
Existing broad gauge line
Botad to Ahmedabad via
Surendranagar
DSIR
Surendra Nagar
Railway Station
Sanand
MRTS Terminal at Visalpur
Village on SP Ring Road,
in Ahmedabad
Page 34
Proposed External Connectivity

MRT-Yellow line
MRT-Blue Line
MRT-Green Line
RRT
FUTURE RRT
N
Page 35
Proposed External Connectivity

Proposed airport
location
Proposed airport is situated at the
northern side of the DSIR
Approximately 7 km from the DSIR
boundary and 20 km from the
proposed activation area.
Page 36
Proposed Airport Location

External connectivity – Port Connectivity
Page 37
Mundra
Pipavav
Dahej
Private Ports – all GMB ports
Other minor ports
Quay Length 690m
No. of Berths 3
Coal & Mineral Static Capacity 700,000 mt
Fertilizer Static Capacity 100,000 mt
Conveyor system for coal 1.2 km, 2000 mt/hr
Rail Sidings with in-motion weighbridge 5
Quay Length 632m
No. of Berths 2
Draft for Multi Purpose Terminal –14.5 mtrs (maintained) &
Bulk port 16 mtrs draft, all weather port
Capacity: 1.1 million TEUs p.a
diverse cargo base including dry, bulk, break bulk, liquid,
crude oil, project cargo, cars and containers.
Rail Sidings with in-motion weighbridge 3
Quay Length 260m
No. of Berths 2
Capacity: 6 million metric ton per year
Import: Coal, Chemicals, LNG, Rock Phosphate
Export: POL, Chemicals
Rail Sidings with in-motion weighbridge 1
Major Govt. Ports
Kandla
Quay Length 2532m
No. of Berths 10
Capacity: 46.28 million metric ton per year
Bulk import–fertiliser and food grains crud oil , Timber
Bulk export: Castor oil, salt, agro products, marble
Rail Sidings with in-motion weighbridge 11
Dholera
SIR

PROJECT TIMELINE ( tentative)
Q1 Q2 Q3 Q4 Q1 Q2 Q3 Q4 Q1 Q2 Q3 Q4 Q1 Q2 Q3 Q4 Q1 Q2 Q3 Q4
Road & services
Flood management
Desalination plant
Raw water Transmission + WTP
Power
ABCD Building
Solid Waste
Waste water treatment (STP & CETP)
2014-15 2015-16 2016-17 2017-18 2018-19
Pre Construction including Design & Bid Construction phase excluding closeout * Dates are indicative only
Anchor Tenants
2020
Page 38


PCPIR A Snapshot
Dahej, Bharuch district Location
453 sq. km. Area
INR 10,994 crores
(USD 2 billion)
Investment on
Infrastructure Development
INR 1,65,596 crores
(USD 28 billion)
Investment Made &
Committed (Manufacturing)
Location
INR 58,627 crores
(USD 10 billion)
Units Commenced
Production
INR 1,06,969 crores
(USD 18 billion)
Units Under
Implementation
Proposed Investment:
INR 27,110 crores (USD 4.5 billion)
Actual Investment as on 31.03.2014:
INR 18,837 crores (USD 3.1 billion)
Tentative commissioning: Q1 2015
Anchor Tenant
ONGC Petro additions
Limited (OPaL)
Currency Rate : 1 USD = 59 INR

PCPIR Development Plan

PCPIR Advantage
Gujarat accounts for only 0.5% of mandays lost in the country while having 16% of
industrial production
Concentration of Petroleum, Chemical and Petrochemical estates around PCPIR
Rich natural resources and feedstock
All infrastructure - road, rail, port, power, gas, water - in place, with planned up-gradation
Chemical Port and Storage Facility
LNG terminal
PCPIR specific infrastructure - effluent disposal pipelines, solid waste disposal sites
Quality Work Force, Peaceful Labour

Leading Companies in the Dahej PCPIR
Commissioned Under Implementation
Not an exhaustive List

Major Units in PCPIR

THANK YOU
DSIRDA GICC DMICDC