diwali top picks october 2017 5 - angel broking top picks october 2017.pdf · diwali special -...
TRANSCRIPT

www.angelbroking.comResearch Team
TOP PICKS REPORTDiwali Special - October 2017
Happy Diwali


Dear Friends,
Let me wish you all a very Happy Diwali and a
Prosperous New Year!
This has been an eventful year for the markets
with Sensex and Nifty trading above 32,000 and
10,000 levels respectively.
As I expected last year, interest rates have come
down and with weak inflationary forces, I do not
see any reason why interest rates should go up. The monsoons have been
satisfactory for last two years and oil price has remained stable at the low level
since January-2015. RBI's foreign exchange reserves have crossed $400bn
mark and rupee has been strengthening, for the most part, since December-
2016. Even on the reforms front too, government has implemented GST
which will be a long term positive for our economy.
Overall, our macro environment has continued to strengthen and I believe
that Indian economy should start doing well from the second half of this year.
It should be noted that reforms are not quick fix of the economy, but long
term solution to our problems. I have no doubts that our vibrant economy has
potential to grow at 8-9% rate in the coming years. I continue to believe that
we have rich demographics that can deliver this growth.
Consumption remains a key sector which has an immense potential. We are
talking of building 1.2cr affordable houses over next five years which will
create huge consumption demand. And what about the rural economy which
is strengthening since last year's normal monsoon. There will be a great
consumption story unfolding in the coming years. Look at the automobile
numbers which are reflecting this.
Globally too, growth is stable with 2-3% GDP growth expectations. This I
believe will drive the global demand which will also be positive for Indian
companies from commodity and exports sector. Together consumption,
housing and infrastructure sectors are setting a stage for double digit growth
in corporate earnings.
This makes equities even more attractive as interest rates are slated to remain
low for long. This is a positive atmosphere for the equity investing which has
been correctly identified by the retail investors who have been continually
putting their faith the Indian equities. Our MF inflows in this year have crossed
`61,000cr mark by August-2017 and I am confident that this year too, our MF
inflows will remain better like previous three years. Cumulatively, domestic
investors have put 3.3x more money in the Indian markets than the foreign
investors since FY15. This is a very exciting opportunity to invest in equities
and maximize the wealth.
So, this Diwali, let's continue this exciting journey while celebrating the
auspicious occasion. Happy Diwali one again!
Best regards,
Dinesh Thakkar
Angel Top Picks - October 2017
Diwali Special
1Please refer to important disclosures at the end of this report
May this auspicious
festival bring you
Crackers if Joy,
Chants of Bliss,
Lights of Success &
Colors of Prosperity
Happy
Diwali
Company CMP (`) TP (`)
Banking/NBFC
Dewan Housing 526 650
GIC Housing Finance 516 655
Karur Vysa Bank 143 180
Consumption
Asian Granito 473 570
Blue Star 748 850
Siyaram Silk Mill 2,179 2,500
Media/Automobiles
Maruti Suzuki 7,734 8,658
Music Broadcast 379 434
TV Today 340 402
Real Estate/Infra/Logistics/Power
KEI Industries 312 371
Navkar Corp. 183 265
Pharma
Alkem Labs 1,846 2,079
Source: Angel Research;
Note: CMP as of Sep. 27, 2017
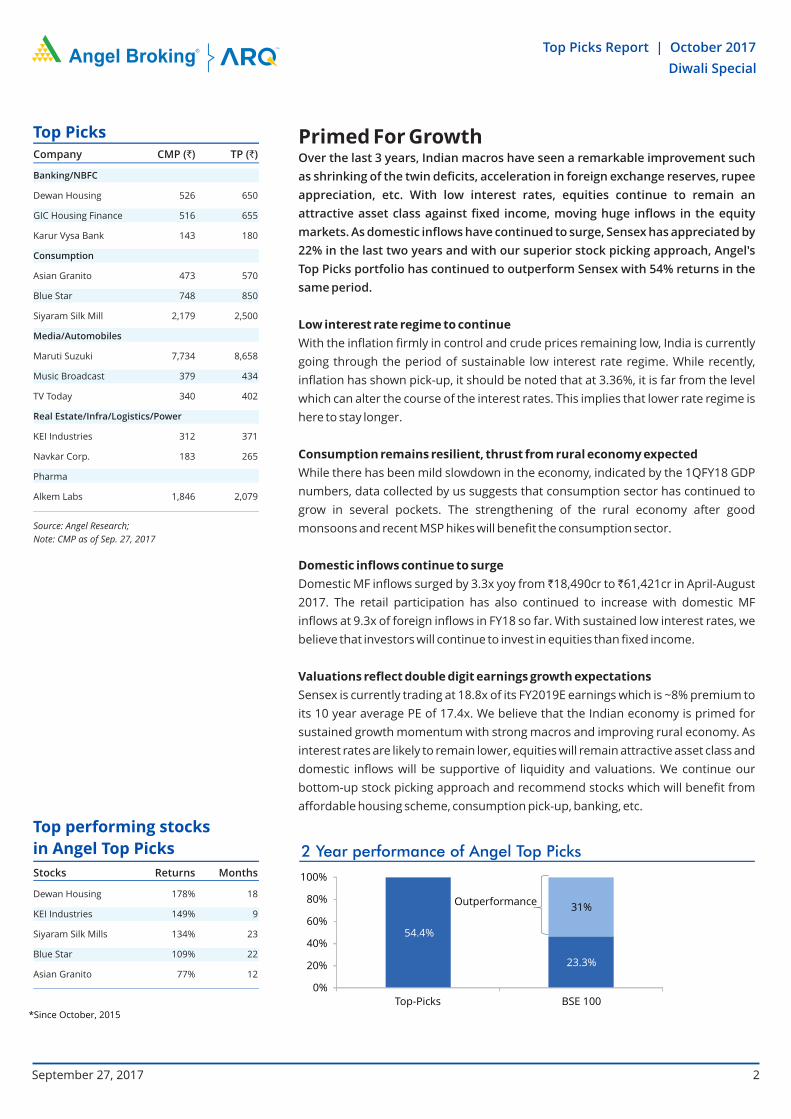
Primed For Growth Over the last 3 years, Indian macros have seen a remarkable improvement such
as shrinking of the twin deficits, acceleration in foreign exchange reserves, rupee
appreciation, etc. With low interest rates, equities continue to remain an
attractive asset class against fixed income, moving huge inflows in the equity
markets. As domestic inflows have continued to surge, Sensex has appreciated by
22% in the last two years and with our superior stock picking approach, Angel's
Top Picks portfolio has continued to outperform Sensex with 54% returns in the
same period.
Low interest rate regime to continue
With the inflation firmly in control and crude prices remaining low, India is currently
going through the period of sustainable low interest rate regime. While recently,
inflation has shown pick-up, it should be noted that at 3.36%, it is far from the level
which can alter the course of the interest rates. This implies that lower rate regime is
here to stay longer.
Consumption remains resilient, thrust from rural economy expected
While there has been mild slowdown in the economy, indicated by the 1QFY18 GDP
numbers, data collected by us suggests that consumption sector has continued to
grow in several pockets. The strengthening of the rural economy after good
monsoons and recent MSP hikes will benefit the consumption sector.
Domestic inflows continue to surge
Domestic MF inflows surged by 3.3x yoy from 18,490cr to 61,421cr in April-August ` `
2017. The retail participation has also continued to increase with domestic MF
inflows at 9.3x of foreign inflows in FY18 so far. With sustained low interest rates, we
believe that investors will continue to invest in equities than fixed income.
Valuations reflect double digit earnings growth expectations
Sensex is currently trading at 18.8x of its FY2019E earnings which is ~8% premium to
its 10 year average PE of 17.4x. We believe that the Indian economy is primed for
sustained growth momentum with strong macros and improving rural economy. As
interest rates are likely to remain lower, equities will remain attractive asset class and
domestic inflows will be supportive of liquidity and valuations. We continue our
bottom-up stock picking approach and recommend stocks which will benefit from
affordable housing scheme, consumption pick-up, banking, etc.
Top Picks
Top Picks Report | October 2017
September 27, 2017 2
Diwali Special
Stocks Returns Months
Dewan Housing 178% 18
KEI Industries 149% 9
Siyaram Silk Mills 134% 23
Blue Star 109% 22
Asian Granito 77% 12
Top performing stocks
in Angel Top Picks 2 Year performance of Angel Top Picks
54.4%
23.3%
31%
0%
20%
40%
60%
80%
100%
Top-Picks BSE 100
Outperformance
*Since October, 2015
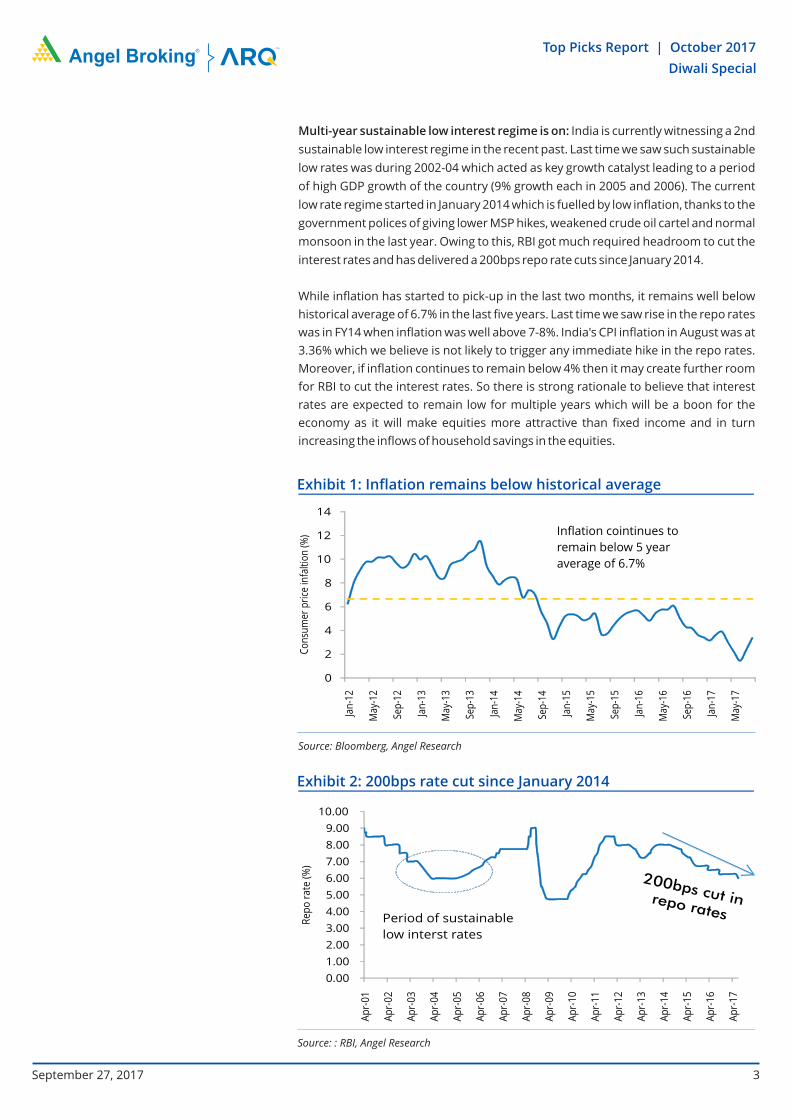
Multi-year sustainable low interest regime is on: India is currently witnessing a 2nd
sustainable low interest regime in the recent past. Last time we saw such sustainable
low rates was during 2002-04 which acted as key growth catalyst leading to a period
of high GDP growth of the country (9% growth each in 2005 and 2006). The current
low rate regime started in January 2014 which is fuelled by low inflation, thanks to the
government polices of giving lower MSP hikes, weakened crude oil cartel and normal
monsoon in the last year. Owing to this, RBI got much required headroom to cut the
interest rates and has delivered a 200bps repo rate cuts since January 2014.
While inflation has started to pick-up in the last two months, it remains well below
historical average of 6.7% in the last five years. Last time we saw rise in the repo rates
was in FY14 when inflation was well above 7-8%. India's CPI inflation in August was at
3.36% which we believe is not likely to trigger any immediate hike in the repo rates.
Moreover, if inflation continues to remain below 4% then it may create further room
for RBI to cut the interest rates. So there is strong rationale to believe that interest
rates are expected to remain low for multiple years which will be a boon for the
economy as it will make equities more attractive than fixed income and in turn
increasing the inflows of household savings in the equities.
3
Exhibit 1: Inflation remains below historical average
0
2
4
6
8
10
12
14
Co
nsu
mer
pri
ce in
falt
ion
(%) Inflation cointinues to
remain below 5 year
average of 6.7%
Source: Bloomberg, Angel Research
Exhibit 2: 200bps rate cut since January 2014
Source: : RBI, Angel Research
0.00
1.00
2.00
3.00
4.00
5.00
6.00
7.00
8.00
9.00
10.00
Ap
r-0
1
Ap
r-0
2
Ap
r-0
3
Ap
r-0
4
Ap
r-0
5
Ap
r-0
6
Ap
r-0
7
Ap
r-0
8
Ap
r-0
9
Ap
r-1
0
Ap
r-1
1
Ap
r-1
2
Ap
r-1
3
Ap
r-1
4
Ap
r-1
5
Ap
r-1
6
Ap
r-1
7
Re
po
rat
e (%
)
Period of sustainable
low interst rates
200bps cut in repo rates
Jan
-12
May
-12
Sep
-12
Jan
-13
May
-13
Sep
-13
Jan
-14
May
-14
Sep
-14
Jan
-15
May
-15
Sep
-15
Jan
-16
May
-16
Sep
-16
Jan
-17
May
-17
Top Picks Report | October 2017
Diwali Special
September 27, 2017
Recent reforms are likely to accelerate the formalization of the economy: While
the short term benefits of demonetisation are questionable, it has helped the
economy by increasing the tax base. This is reflected in the 17.5% yoy growth in the
direct tax collection for 5MFY18 to `2.24 lakh crore. The number of tax return filers
have also grew by 24.7% compared to March-2017 showing widening tax base. The
GST regime too is expected to improve tax compliance as more businesses will come
under the tax net. Overall, in our view, recent reforms are helping to formalize the
economy by increasing the tax base which will increase the government revenue.
The GST regime is also expected to benefit the organized sector as with the higher
tax compliance, cost advantage enjoyed by the unorganized players over organized
players will vanish. This will help the branded and tax compliant players to gain the
market share.
Rural economy set for revival: The rural economy was impacted due to the poor
monsoon in FY15 and FY16. This scenario is however set to change with the normal
monsoon season in 2016. While the 2017 monsoon has been slightly below (~6%) the
normal level, the southwest monsoon is expected to be heavy which is expected to
fill-up the 6% deficit. Even if we consider the 94% to the normal in 2017, a draught like
situation is averted which will help to strengthen the rural economy.
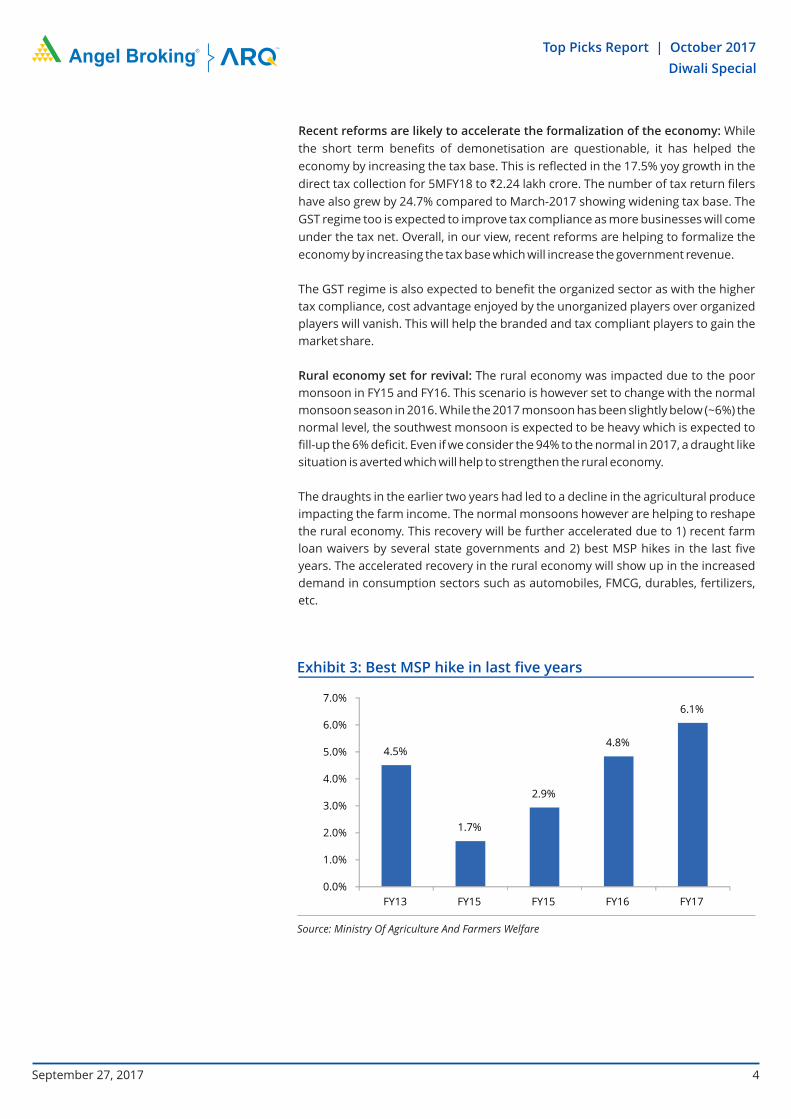
The draughts in the earlier two years had led to a decline in the agricultural produce
impacting the farm income. The normal monsoons however are helping to reshape
the rural economy. This recovery will be further accelerated due to 1) recent farm
loan waivers by several state governments and 2) best MSP hikes in the last five
years. The accelerated recovery in the rural economy will show up in the increased
demand in consumption sectors such as automobiles, FMCG, durables, fertilizers,
etc.
4
Exhibit 3: Best MSP hike in last five years
Source: Ministry Of Agriculture And Farmers Welfare
4.5%
1.7%
2.9%
4.8%
6.1%
0.0%
1.0%
2.0%
3.0%
4.0%
5.0%
6.0%
7.0%
FY13 FY15 FY15 FY16 FY17
Top Picks Report | October 2017
Diwali Special
September 27, 2017
5
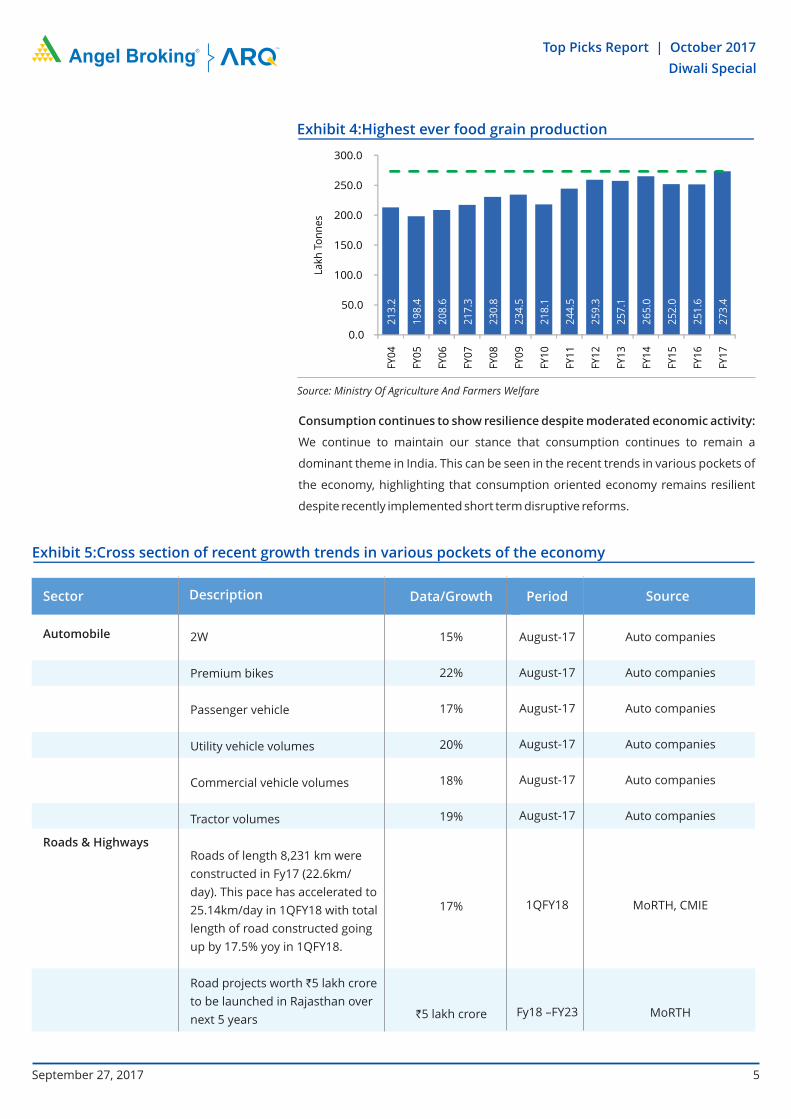
Exhibit 4: Highest ever food grain production
Source: Ministry Of Agriculture And Farmers Welfare2
13
.2
19
8.4
20
8.6
21
7.3
23
0.8
23
4.5
21
8.1
24
4.5
25
9.3
25
7.1
26
5.0
25
2.0
25
1.6
27
3.4
0.0
50.0
100.0
150.0
200.0
250.0
300.0
FY0
4
FY0
5
FY0
6
FY0
7
FY0
8
FY0
9
FY1
0
FY1
1
FY1
2
FY1
3
FY1
4
FY1
5
FY1
6
FY1
7
Lak
h T
on
ne
s
Consumption continues to show resilience despite moderated economic activity:
We continue to maintain our stance that consumption continues to remain a
dominant theme in India. This can be seen in the recent trends in various pockets of
the economy, highlighting that consumption oriented economy remains resilient
despite recently implemented short term disruptive reforms.
Exhibit 5: Cross section of recent growth trends in various pockets of the economy
Automobile
Roads & Highways
Sector Description Data/Growth Period Source
2W
Premium bikes
Passenger vehicle
Utility vehicle volumes
Commercial vehicle volumes
Tractor volumes
Roads of length 8,231 km were
constructed in Fy17 (22.6km/
day). This pace has accelerated to
25.14km/day in 1QFY18 with total
length of road constructed going
up by 17.5% yoy in 1QFY18.
Road projects worth `5 lakh crore
to be launched in Rajasthan over
next 5 years
15%
22%
17%
20%
18%
19%
17%
`5 lakh crore
August-17
August-17
August-17
August-17
August-17
August-17
1QFY18
Fy18 –FY23
Auto companies
Auto companies
Auto companies
Auto companies
Auto companies
Auto companies
MoRTH, CMIE
MoRTH
Top Picks Report | October 2017
Diwali Special
September 27, 2017
6
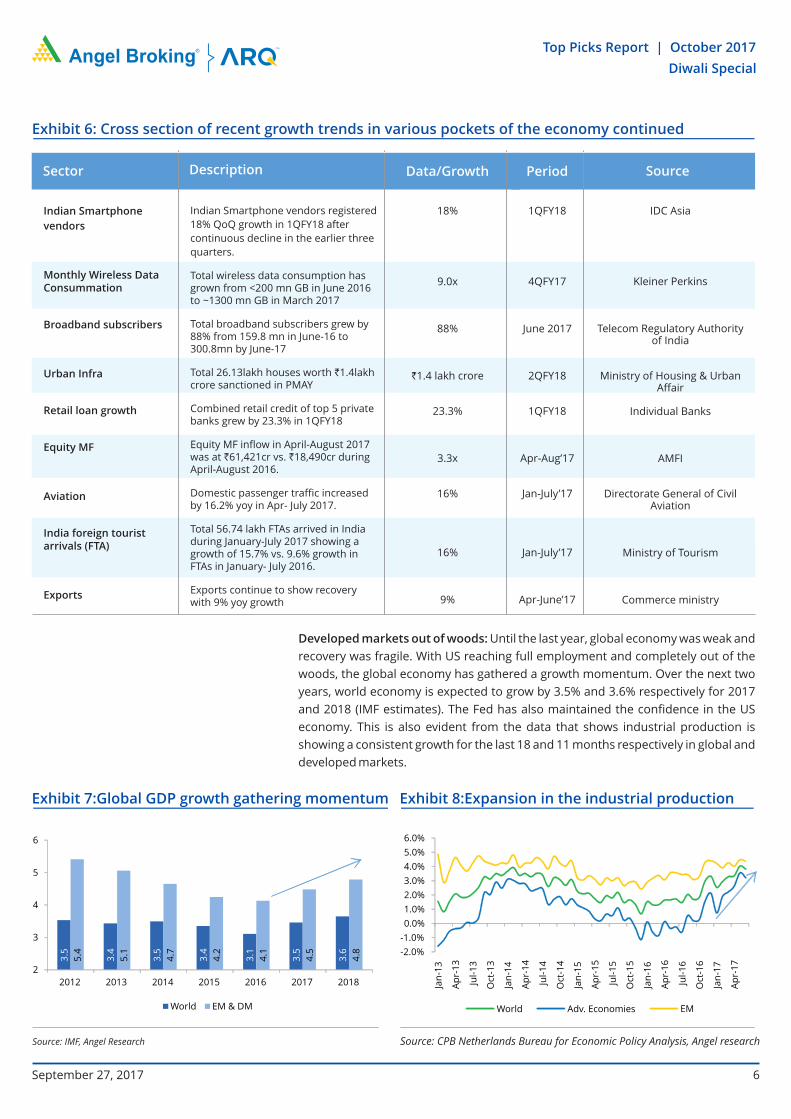
Exhibit 6: Cross section of recent growth trends in various pockets of the economy continued
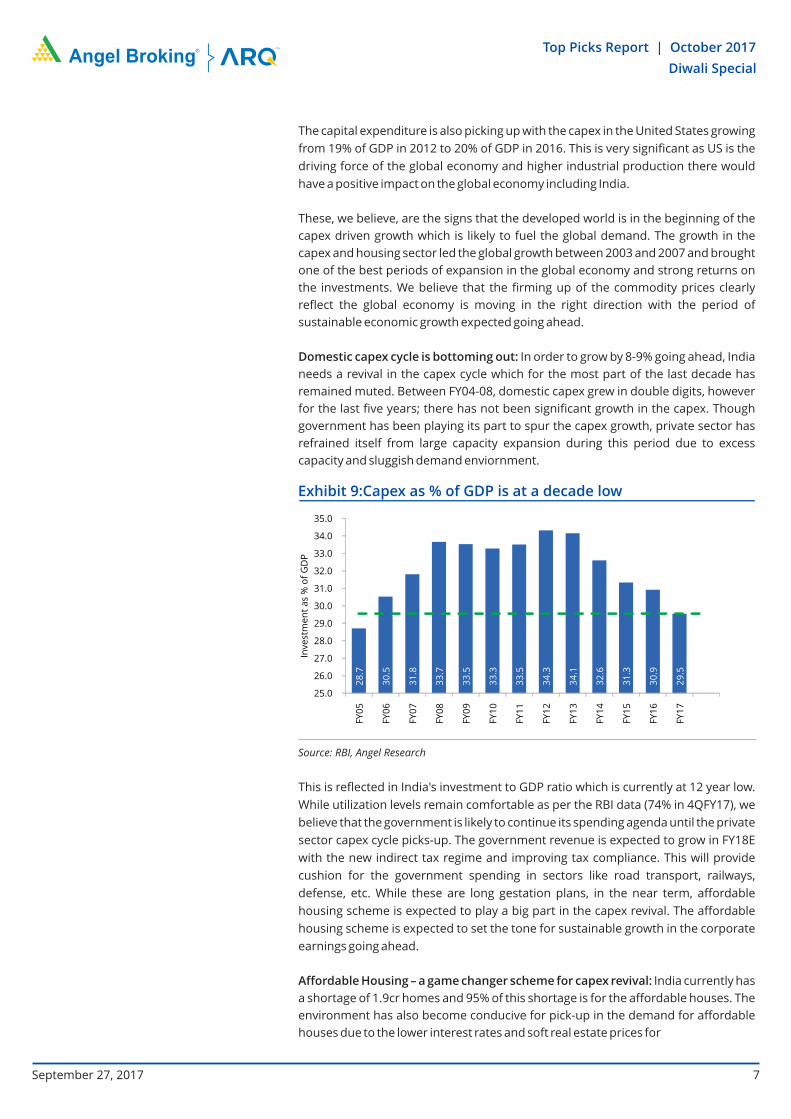
Developed markets out of woods: Until the last year, global economy was weak and
recovery was fragile. With US reaching full employment and completely out of the
woods, the global economy has gathered a growth momentum. Over the next two
years, world economy is expected to grow by 3.5% and 3.6% respectively for 2017
and 2018 (IMF estimates). The Fed has also maintained the confidence in the US
economy. This is also evident from the data that shows industrial production is
showing a consistent growth for the last 18 and 11 months respectively in global and
developed markets.
Exhibit 7: Global GDP growth gathering momentum
Source: IMF, Angel Research
Exhibit 8: Expansion in the industrial production
Source: CPB Netherlands Bureau for Economic Policy Analysis, Angel research
3.5
3.4
3.5
3.4
3.1
3.5
3.6
5.4
5.1
4.7
4.2
4.1
4.5
4.8
2
3
4
5
6
2012 2013 2014 2015 2016 2017 2018
World EM & DM
-2.0%
-1.0%
0.0%
1.0%
2.0%
3.0%
4.0%
5.0%
6.0%
Jan
-13
Ap
r-1
3
Jul-
13
Oct
-13
Jan
-14
Ap
r-1
4
Jul-
14
Oct
-14
Jan
-15
Ap
r-1
5
Jul-
15
Oct
-15
Jan
-16
Ap
r-1
6
Jul-
16
Oct
-16
Jan
-17
Ap
r-1
7
World Adv. Economies EM
Sector Description Data/Growth Period Source
Indian Smartphone
vendors
Monthly Wireless Data Consummation
Broadband subscribers
Urban Infra
Retail loan growth
Equity MF
Aviation
India foreign tourist arrivals (FTA)
Exports
Indian Smartphone vendors registered
18% QoQ growth in 1QFY18 after
continuous decline in the earlier three
quarters.
Total wireless data consumption has grown from <200 mn GB in June 2016 to ~1300 mn GB in March 2017
Total broadband subscribers grew by 88% from 159.8 mn in June-16 to 300.8mn by June-17 Total 26.13lakh houses worth `1.4lakh crore sanctioned in PMAY
Combined retail credit of top 5 private banks grew by 23.3% in 1QFY18
Equity MF inflow in April-August 2017 was at `61,421cr vs. `18,490cr during April-August 2016.
Domestic passenger traffic increased by 16.2% yoy in Apr- July 2017.
Total 56.74 lakh FTAs arrived in India during January-July 2017 showing a growth of 15.7% vs. 9.6% growth in FTAs in January- July 2016.
Exports continue to show recovery with 9% yoy growth
18%
9.0x
88%
`1.4 lakh crore
23.3%
3.3x
16%
16%
9%
1QFY18
4QFY17
June 2017
2QFY18
1QFY18
Apr-Aug’17
Jan-July’17
Jan-July’17
Apr-June’17
IDC Asia
Kleiner Perkins
Telecom Regulatory Authority of India
Ministry of Housing & Urban Affair
Individual Banks
AMFI
Directorate General of Civil Aviation
Ministry of Tourism
Commerce ministry
Top Picks Report | October 2017
Diwali Special
September 27, 2017
7
The capital expenditure is also picking up with the capex in the United States growing
from 19% of GDP in 2012 to 20% of GDP in 2016. This is very significant as US is the
driving force of the global economy and higher industrial production there would
have a positive impact on the global economy including India.
These, we believe, are the signs that the developed world is in the beginning of the
capex driven growth which is likely to fuel the global demand. The growth in the
capex and housing sector led the global growth between 2003 and 2007 and brought
one of the best periods of expansion in the global economy and strong returns on
the investments. We believe that the firming up of the commodity prices clearly
reflect the global economy is moving in the right direction with the period of
sustainable economic growth expected going ahead.
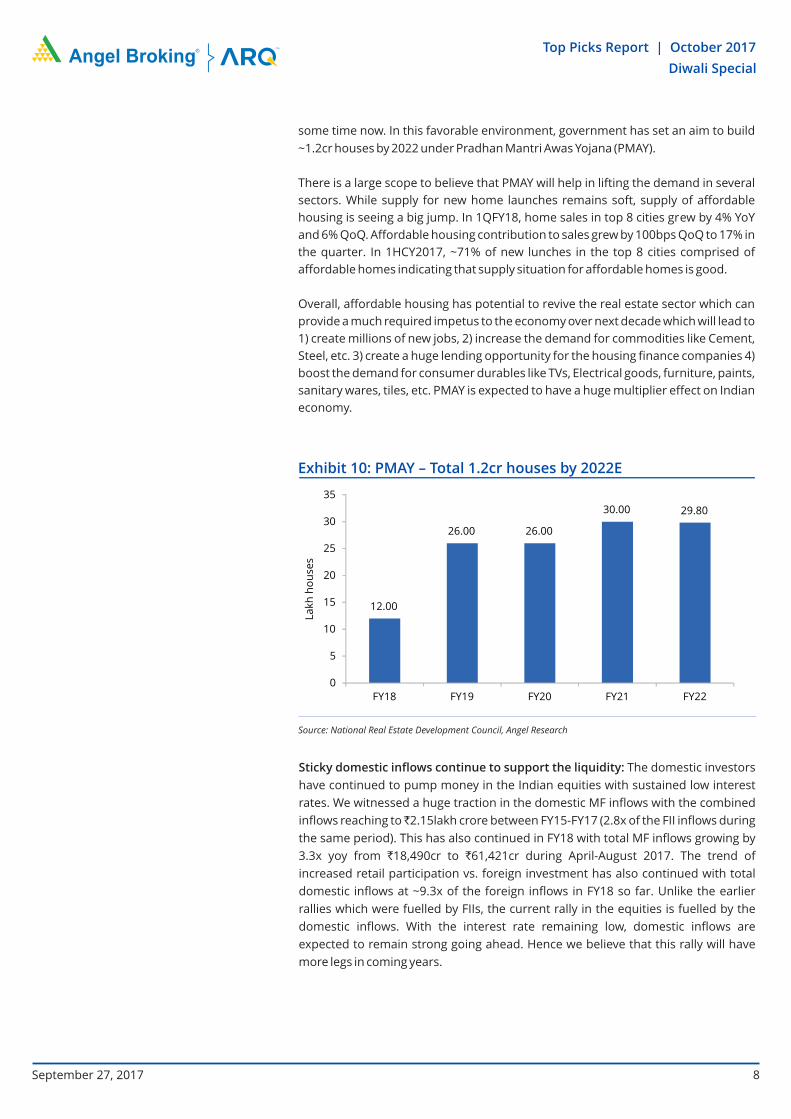
Domestic capex cycle is bottoming out: In order to grow by 8-9% going ahead, India
needs a revival in the capex cycle which for the most part of the last decade has
remained muted. Between FY04-08, domestic capex grew in double digits, however
for the last five years; there has not been significant growth in the capex. Though
government has been playing its part to spur the capex growth, private sector has
refrained itself from large capacity expansion during this period due to excess
capacity and sluggish demand enviornment.
Exhibit 9: Capex as % of GDP is at a decade low
Source: RBI, Angel Research
28
.7
30
.5
31
.8
33
.7
33
.5
33
.3
33
.5
34
.3
34
.1
32
.6
31
.3
30
.9
29
.5
25.0
26.0
27.0
28.0
29.0
30.0
31.0
32.0
33.0
34.0
35.0
FY
05
FY
06
FY
07
FY
08
FY
09
FY
10
FY
11
FY
12
FY
13
FY
14
FY
15
FY
16
FY
17
Inve
stm
en
t a
s %
of
GD
P
This is reflected in India's investment to GDP ratio which is currently at 12 year low.
While utilization levels remain comfortable as per the RBI data (74% in 4QFY17), we
believe that the government is likely to continue its spending agenda until the private
sector capex cycle picks-up. The government revenue is expected to grow in FY18E
with the new indirect tax regime and improving tax compliance. This will provide
cushion for the government spending in sectors like road transport, railways,
defense, etc. While these are long gestation plans, in the near term, affordable
housing scheme is expected to play a big part in the capex revival. The affordable
housing scheme is expected to set the tone for sustainable growth in the corporate
earnings going ahead.
Affordable Housing – a game changer scheme for capex revival: India currently has
a shortage of 1.9cr homes and 95% of this shortage is for the affordable houses. The
environment has also become conducive for pick-up in the demand for affordable
houses due to the lower interest rates and soft real estate prices for
Top Picks Report | October 2017
Diwali Special
September 27, 2017
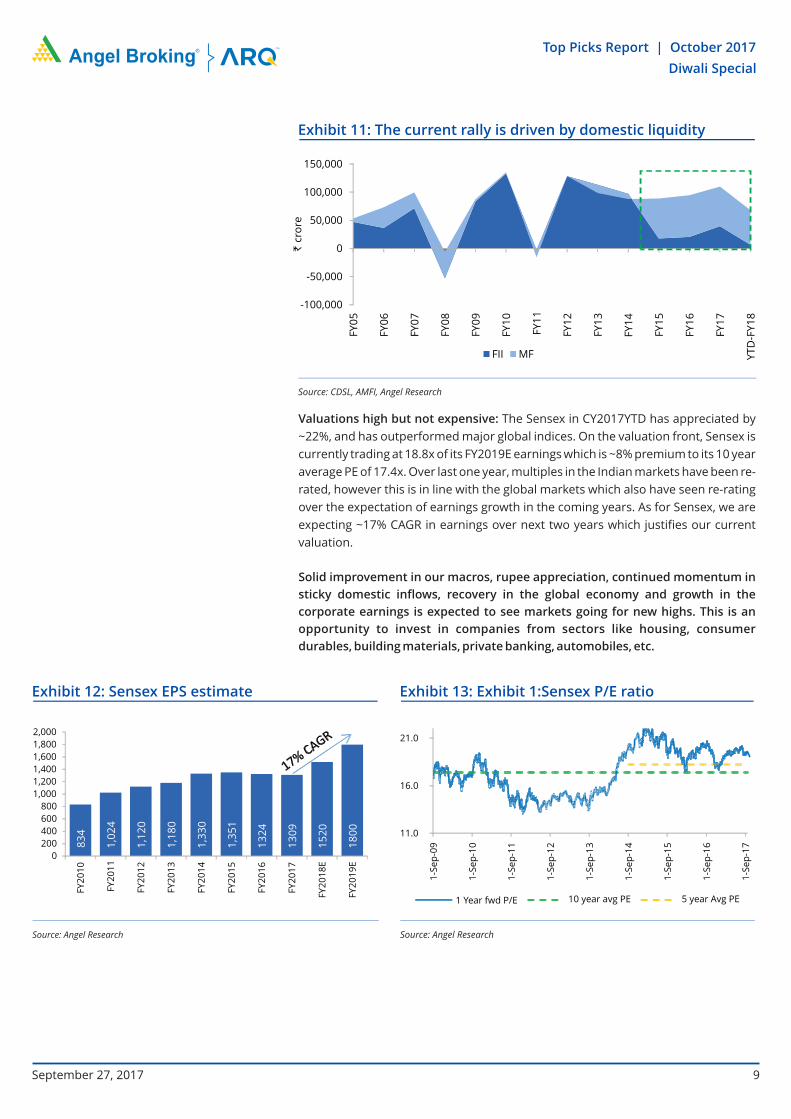
some time now. In this favorable environment, government has set an aim to build
~1.2cr houses by 2022 under Pradhan Mantri Awas Yojana (PMAY).
There is a large scope to believe that PMAY will help in lifting the demand in several
sectors. While supply for new home launches remains soft, supply of affordable
housing is seeing a big jump. In 1QFY18, home sales in top 8 cities grew by 4% YoY
and 6% QoQ. Affordable housing contribution to sales grew by 100bps QoQ to 17% in
the quarter. In 1HCY2017, ~71% of new lunches in the top 8 cities comprised of
affordable homes indicating that supply situation for affordable homes is good.
Overall, affordable housing has potential to revive the real estate sector which can
provide a much required impetus to the economy over next decade which will lead to
1) create millions of new jobs, 2) increase the demand for commodities like Cement,
Steel, etc. 3) create a huge lending opportunity for the housing finance companies 4)
boost the demand for consumer durables like TVs, Electrical goods, furniture, paints,
sanitary wares, tiles, etc. PMAY is expected to have a huge multiplier effect on Indian
economy.
8
Exhibit 10: PMAY – Total 1.2cr houses by 2022E
Source: National Real Estate Development Council, Angel Research
12.00
26.00 26.00
30.00 29.80
0
5
10
15
20
25
30
35
FY18 FY19 FY20 FY21 FY22
La
kh
ho
use
s
Sticky domestic inflows continue to support the liquidity: The domestic investors
have continued to pump money in the Indian equities with sustained low interest
rates. We witnessed a huge traction in the domestic MF inflows with the combined
inflows reaching to ̀ 2.15lakh crore between FY15-FY17 (2.8x of the FII inflows during
the same period). This has also continued in FY18 with total MF inflows growing by
3.3x yoy from `18,490cr to `61,421cr during April-August 2017. The trend of
increased retail participation vs. foreign investment has also continued with total
domestic inflows at ~9.3x of the foreign inflows in FY18 so far. Unlike the earlier
rallies which were fuelled by FIIs, the current rally in the equities is fuelled by the
domestic inflows. With the interest rate remaining low, domestic inflows are
expected to remain strong going ahead. Hence we believe that this rally will have
more legs in coming years.
Top Picks Report | October 2017
Diwali Special
September 27, 2017
9
Exhibit 11: The current rally is driven by domestic liquidity
Source: CDSL, AMFI, Angel Research
-100,000
-50,000
0
50,000
100,000
150,000
FY
05
FY
06
FY
07
FY
08
FY
09
FY
10
FY
11
FY
12
FY
13
FY
14
FY
15
FY
16
FY
17
YT
D-F
Y1
8
` c
rore
FII MF
Valuations high but not expensive: The Sensex in CY2017YTD has appreciated by
~22%, and has outperformed major global indices. On the valuation front, Sensex is
currently trading at 18.8x of its FY2019E earnings which is ~8% premium to its 10 year
average PE of 17.4x. Over last one year, multiples in the Indian markets have been re-
rated, however this is in line with the global markets which also have seen re-rating
over the expectation of earnings growth in the coming years. As for Sensex, we are
expecting ~17% CAGR in earnings over next two years which justifies our current
valuation.
Solid improvement in our macros, rupee appreciation, continued momentum in
sticky domestic inflows, recovery in the global economy and growth in the
corporate earnings is expected to see markets going for new highs. This is an
opportunity to invest in companies from sectors like housing, consumer
durables, building materials, private banking, automobiles, etc.
Exhibit 12: Sensex EPS estimate
Source: Angel Research
Exhibit 13: Exhibit 1: Sensex P/E ratio
Source: Angel Research
83
4
1,0
24
1,1
20
1,1
80
1,3
30
1,3
51
13
24
13
09
15
20
18
00
0
200
400
600
800
1,000
1,200
1,400
1,600
1,800
2,000
FY
20
10
FY
20
11
FY
20
12
FY
20
13
FY
20
14
FY
20
15
FY
20
16
FY
20
17
FY
20
18
E
FY
20
19
E
11.0
16.0
21.0
1-S
ep
-09
1-S
ep
-10
1-S
ep
-11
1-S
ep
-12
1-S
ep
-13
1-S
ep
-14
1-S
ep
-15
1-S
ep
-16
1-S
ep
-17
1 Year fwd P/E 10 year avg PE 5 year Avg PE
Top Picks Report | October 2017
Diwali Special
September 27, 2017

10
Top Picks
Top Picks Report | October 2017
Diwali Special
September 27, 2017
Stock Info
CMP 526
TP 650
Upside 23.6%
Sector Financials
Market Cap (` cr) 16,490
Beta 1.9
52 Week High / Low 651 / 214
11
n Loan growth to remain strong going ahead: Backed by healthy capital adequacy
and increasing demand for home loans DHFL’s loan book is expected to report
23% loan growth over next two three years.
n Strong Capital adequacy lends visibility for growth: DHFL sold 50% stake held
by it in DFHFL Pramerica Life Insurance Co Ltd which added `1,969 cr to its net
worth and increases its CAR by 400 bps, to 19.3% which should fuel growth for
next 2-3 years.
n Asset quality has been strong: Strong NIM on the back of lower cost of funds and
lower credit cost will ensure healthy return ratios for the company. Despite
strong growth the company has maintained stable asset quality and we expect
the trend to continue.
n Outlook: We expect the company’s loan growth to remain 23% over next two
years and earnings growth is likely to be more than 28%.The stock currently
trades at 1.6x FY2019E ABV. We maintain an Accumulate rating on the stock,
with a target price of ̀ 650.
Dewan Housing
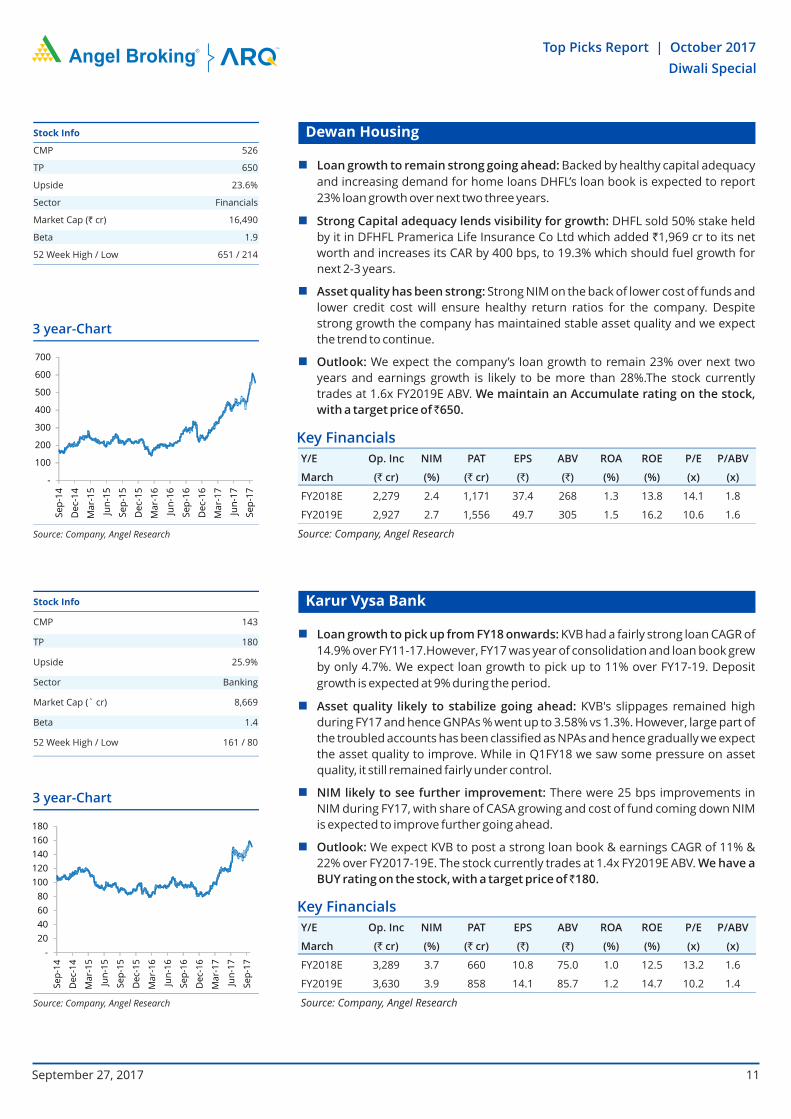
3 year-Chart
Source: Company, Angel Research
-
100
200
300
400
500
600
700
Se
p-1
4
De
c-1
4
Ma
r-1
5
Jun
-15
Se
p-1
5
De
c-1
5
Ma
r-1
6
Jun
-16
Se
p-1
6
De
c-1
6
Ma
r-1
7
Jun
-17
Se
p-1
7
Key Financials
Source: Company, Angel Research
Y/E Op. Inc NIM PAT EPS ABV ROA ROE P/E P/ABV
March (` cr) (%) (` cr) (`) (`) (%) (%) (x) (x)
FY2018E 2,279 2.4 1,171 37.4 268 1.3 13.8 14.1 1.8
FY2019E 2,927 2.7 1,556 49.7 305 1.5 16.2 10.6 1.6
Stock Info
CMP 143
TP 180
Upside 25.9%
Sector Banking
Market Cap (` cr) 8,669
Beta 1.4
52 Week High / Low 161 / 80
n Loan growth to pick up from FY18 onwards: KVB had a fairly strong loan CAGR of
14.9% over FY11-17.However, FY17 was year of consolidation and loan book grew
by only 4.7%. We expect loan growth to pick up to 11% over FY17-19. Deposit
growth is expected at 9% during the period.
n Asset quality likely to stabilize going ahead: KVB's slippages remained high
during FY17 and hence GNPAs % went up to 3.58% vs 1.3%. However, large part of
the troubled accounts has been classified as NPAs and hence gradually we expect
the asset quality to improve. While in Q1FY18 we saw some pressure on asset
quality, it still remained fairly under control.
n NIM likely to see further improvement: There were 25 bps improvements in
NIM during FY17, with share of CASA growing and cost of fund coming down NIM
is expected to improve further going ahead.
n Outlook: We expect KVB to post a strong loan book & earnings CAGR of 11% &
22% over FY2017-19E. The stock currently trades at 1.4x FY2019E ABV. We have a
BUY rating on the stock, with a target price of ̀ 18 0.
Karur Vysa Bank
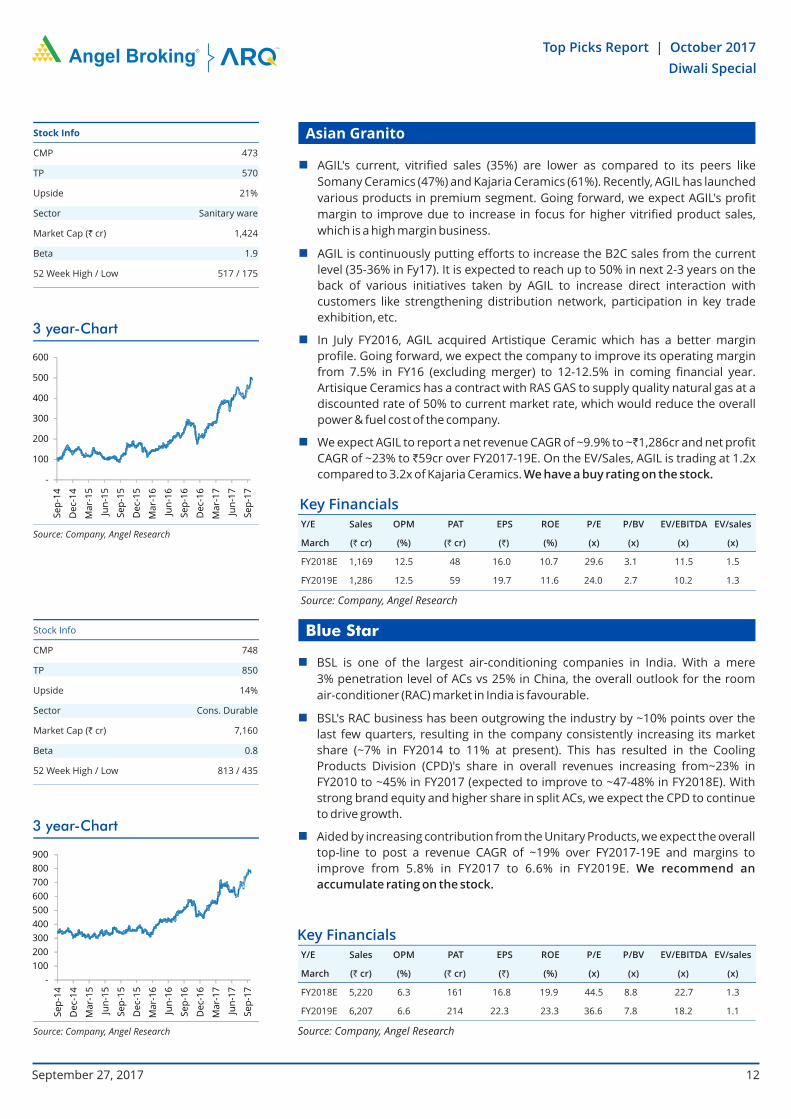
3 year-Chart
Source: Company, Angel Research
Key Financials
Source: Company, Angel Research
Y/E Op. Inc NIM PAT EPS ABV ROA ROE P/E P/ABV
March (` cr) (%) (` cr) (`) (`) (%) (%) (x) (x)
FY2018E 3,289 3.7 660 10.8 75.0 1.0 12.5 13.2 1.6
FY2019E 3,630 3.9 858 14.1 85.7 1.2 14.7 10.2 1.4
-
20
40
60
80
100
120
140
160
180
Se
p-1
4
De
c-1
4
Ma
r-1
5
Jun
-15
Se
p-1
5
De
c-1
5
Ma
r-1
6
Jun
-16
Se
p-1
6
De
c-1
6
Ma
r-1
7
Jun
-17
Se
p-1
7
Top Picks Report | October 2017
Diwali Special
September 27, 2017
Stock Info
CMP 473
TP 570
Upside 21%
Sector Sanitary ware
Market Cap (` cr) 1,424
Beta 1.9
52 Week High / Low 517 / 175
12
n AGIL's current, vitrified sales (35%) are lower as compared to its peers like
Somany Ceramics (47%) and Kajaria Ceramics (61%). Recently, AGIL has launched
various products in premium segment. Going forward, we expect AGIL's profit
margin to improve due to increase in focus for higher vitrified product sales,
which is a high margin business.
n AGIL is continuously putting efforts to increase the B2C sales from the current
level (35-36% in Fy17). It is expected to reach up to 50% in next 2-3 years on the
back of various initiatives taken by AGIL to increase direct interaction with
customers like strengthening distribution network, participation in key trade
exhibition, etc.
n In July FY2016, AGIL acquired Artistique Ceramic which has a better margin
profile. Going forward, we expect the company to improve its operating margin
from 7.5% in FY16 (excluding merger) to 12-12.5% in coming financial year.
Artisique Ceramics has a contract with RAS GAS to supply quality natural gas at a
discounted rate of 50% to current market rate, which would reduce the overall
power & fuel cost of the company.
n We expect AGIL to report a net revenue CAGR of ~9.9% to ~`1,286cr and net profit
CAGR of ~23% to `59cr over FY2017-19E. On the EV/Sales, AGIL is trading at 1.2x
compared to 3.2x of Kajaria Ceramics. We have a buy rating on the stock.
Asian Granito
Key Financials
Source: Company, Angel Research
n BSL is one of the largest air-conditioning companies in India. With a mere
3% penetration level of ACs vs 25% in China, the overall outlook for the room
air-conditioner (RAC) market in India is favourable.
n BSL's RAC business has been outgrowing the industry by ~10% points over the
last few quarters, resulting in the company consistently increasing its market
share (~7% in FY2014 to 11% at present). This has resulted in the Cooling
Products Division (CPD)'s share in overall revenues increasing from~23% in
FY2010 to ~45% in FY2017 (expected to improve to ~47-48% in FY2018E). With
strong brand equity and higher share in split ACs, we expect the CPD to continue
to drive growth.
n Aided by increasing contribution from the Unitary Products, we expect the overall
top-line to post a revenue CAGR of ~19% over FY2017-19E and margins to
improve from 5.8% in FY2017 to 6.6% in FY2019E. We recommend an
accumulate rating on the stock.
Blue Star
3 year-Chart
Source: Company, Angel Research
Key Financials
Source: Company, Angel Research
Y/E Sales OPM PAT EPS ROE P/E P/BV EV/EBITDA EV/sales
March (` cr) (%) (` cr) (`) (%) (x) (x) (x) (x)
FY2018E 5,220 6.3 161 16.8 19.9 44.5 8.8 22.7 1.3
FY2019E 6,207 6.6 214 22.3 23.3 36.6 7.8 18.2 1.1
3 year-Chart
-
100
200
300
400
500
600
Source: Company, Angel Research
Se
p-1
4
De
c-1
4
Ma
r-1
5
Jun
-15
Se
p-1
5
De
c-1
5
Ma
r-1
6
Jun
-16
Se
p-1
6
De
c-1
6
Ma
r-1
7
Jun
-17
Se
p-1
7
Stock Info
CMP 748
TP 850
Upside 14%
Sector Cons. Durable
Market Cap (` cr) 7,160
Beta 0.8
52 Week High / Low 813 / 435
-
100
200
300
400
500
600
700
800
900
Se
p-1
4
De
c-1
4
Ma
r-1
5
Jun
-15
Se
p-1
5
De
c-1
5
Ma
r-1
6
Jun
-16
Se
p-1
6
De
c-1
6
Ma
r-1
7
Jun
-17
Se
p-1
7
Top Picks Report | October 2017
Diwali Special
September 27, 2017
Y/E Sales OPM PAT EPS ROE P/E P/BV EV/EBITDA EV/sales
March (` cr) (%) (` cr) (`) (%) (x) (x) (x) (x)
FY2018E 1,169 12.5 48 16.0 10.7 29.6 3.1 11.5 1.5
FY2019E 1,286 12.5 59 19.7 11.6 24.0 2.7 10.2 1.3
Stock Info
CMP 2,179
TP 2,500
Upside 15%
Sector Textile
Market Cap (` cr) 2,043
Beta 0.9
52 Week High / Low 2,499/1,135
13
n SSML has strong brands which cater to premium as well as popular mass
segments of the market. Further, SSML entered the ladies' salwar kameez and
ethnic wear segment. Going forward, we believe that the company would be able
to leverage its brand equity and continue to post strong performance.
n The company has a nationwide network of about 1,600 dealers and business
partners. It has a retail network of 160 stores and plans to add another 300-350
stores going forward. Further, the company's brands are sold across 3,00,000
multi brand outlets in the country.
n Going forward, we expect SSML to report a net sales CAGR of ~12% to ~`1,981cr
and adj.net profit CAGR of ~16% to `123cr over FY2017-19E on back of market
leadership in blended fabrics, strong brand building, wide distribution channel,
strong presence in tier II and tier III cities and emphasis on latest designs and
affordable pricing points. At the current market price, SSML trades at an
inexpensive valuation. We have a buy rating on the stock.
Siyaram Silk Mills
Key Financials
Source: Company, Angel Research
n The Automobile sector is expected to benefit from the lower interest rates and
recovery in rural economy. The sector has seen a pick up in the volumes in FY17
as there were several positive factors like normal monsoon and lower interest
rates.
n Maruti Suzuki continues to hold ~50% market share in the passenger vehicles.
The launch of exciting models has helped the company to ride on the
premiumization wave that is happening in the country. In the last two years,
company has seen improvement in the business mix with the pie of the utility
vehicles growing from ~4% to current 15%. With the 3-4 months of waiting period
on these models, strong demand and GST led price decrease; we believe that this
pie is expected to grow to ~20% in FY19E.
n Due to the favorable business mix, company has also been seeing improvement
in the margins. Company has already moved from ~11-12% EBITDA margin range
to current ~14-15% margin ranges. Together with higher operating leverage at
Gujarat plant and improving business mix, we believe that company has further
room to improve its margins. We have an accumulate rating on the stock.
Maruti Suzuki
3 year-Chart
Source: Company, Angel Research
Key Financials
Source: Company, Angel Research
Stock Info
CMP 7,734
TP 8,658
Upside 12 %
Sector Automobiles
Market Cap (` cr) 2,33,626
Beta 1.3
52 Week High / Low 8,200/4,769
-
1,000
2,000
3,000
4,000
5,000
6,000
7,000
8,000
9,000
Se
p-1
4
De
c-1
4
Ma
r-1
5
Jun
-15
Se
p-1
5
De
c-1
5
Ma
r-1
6
Jun
-16
Se
p-1
6
De
c-1
6
Ma
r-1
7
Jun
-17
Se
p-1
7
Top Picks Report | October 2017
Diwali Special
September 27, 2017
Y/E Sales OPM PAT EPS ROE P/E P/BV EV/EBITDA EV/sales
March (` cr) (%) (` cr) (`) (%) (x) (x) (x) (x)
FY2018E 1,769 12.7 106 113.1 15.5 19.3 3.0 10.4 1.3
FY2019E 1,981 12.7 123 131.1 15.5 16.6 2.6 9.1 1.2
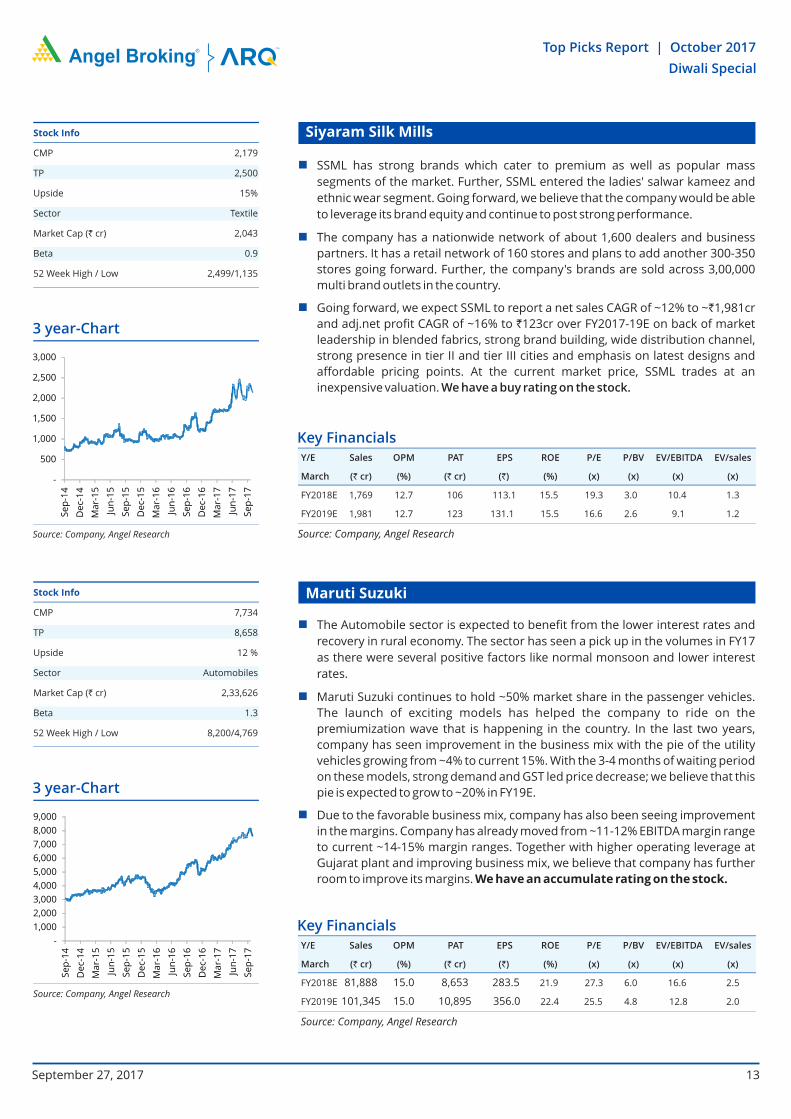
3 year-Chart
Source: Company, Angel Research
-
500
1,000
1,500
2,000
2,500
3,000
Se
p-1
4
De
c-1
4
Ma
r-1
5
Jun
-15
Se
p-1
5
De
c-1
5
Ma
r-1
6
Jun
-16
Se
p-1
6
De
c-1
6
Ma
r-1
7
Jun
-17
Se
p-1
7
Y/E Sales OPM PAT EPS ROE P/E P/BV EV/EBITDA EV/sales
March (` cr) (%) (` cr) (`) (%) (x) (x) (x) (x)
FY2018E 81,888 15.0 8,653 283.5 21.9 27.3 6.0 16.6 2.5
FY2019E 101,345 15.0 10,895 356.0 22.4 25.5 4.8 12.8 2.0
Stock Info
CMP 340
TP 402
Upside 18%
Sector Media
Market Cap (` cr) 2,028
Beta 0.7
52 Week High / Low 361 /211
14
n TTNL enjoys a strong viewership ranking in the Hindi and English news channel
categories. The company’s Hindi news channel – Aaj Tak has maintained its
market leadership position occupying the No.1 rank for several consecutive
years in terms of viewership. Its English news channel - India Today too has been
continuously gaining viewership; it has now captured the No. 2 ranking from No.
4 earlier. Its other channels like Dilli Aaj Tak and Tez are also popular among
viewers.
n TTNL is a play of higher operating leverage that would be visible as advertisement
revenues gain traction. Going ahead, we expect EBITDA margins would improve.
n We expect TTNL to report a net revenue CAGR of ~9% to ~`727cr and net profit
CAGR of ~14% to ̀ 121cr over FY2017-19E. We have a buy rating on the stock.
TV Today Network
Key Financials
Source: Company, Angel Research
n Radio Industry is protected by licenses for 15 years, thereby restricting the entry
of new players. This would support the existing companies to strengthen their
position and maintain a healthy growth rate.
n It has grabbed the Number 1 position in Mumbai, Bengaluru and Delhi in terms
of number of listener. This is helping MBL to charge premium rate, which
resulting into higher EBITDA margin (33.6%) compare to 22% of ENIL.
n MBL outperformed its closest peer with 18.4% CAGR in revenue over FY2013-17
(ENIL reported 13.2% CAGR in revenue). On the profitability front too, MBL, with
32.3% CAGR in PAT over FY2013-17, has performed much better than ENIL (-5.2%
CAGR in PAT). Moreover, Radio City posted a six year CAGR of 12.1% v/s. 9.1% of
industry owing to higher advertising volumes.
n Capex for 39 licenses have been done for the next 15 years, hence no heavy
incremental Capex requirement would emerge. Moreover, the maintenance
Capex would be as low as `5-10cr. This would leave sufficient cash flow to
distribute as dividend. We have a Buy recommendation on the stock and target
price of ̀ 434.
Music Broadcast
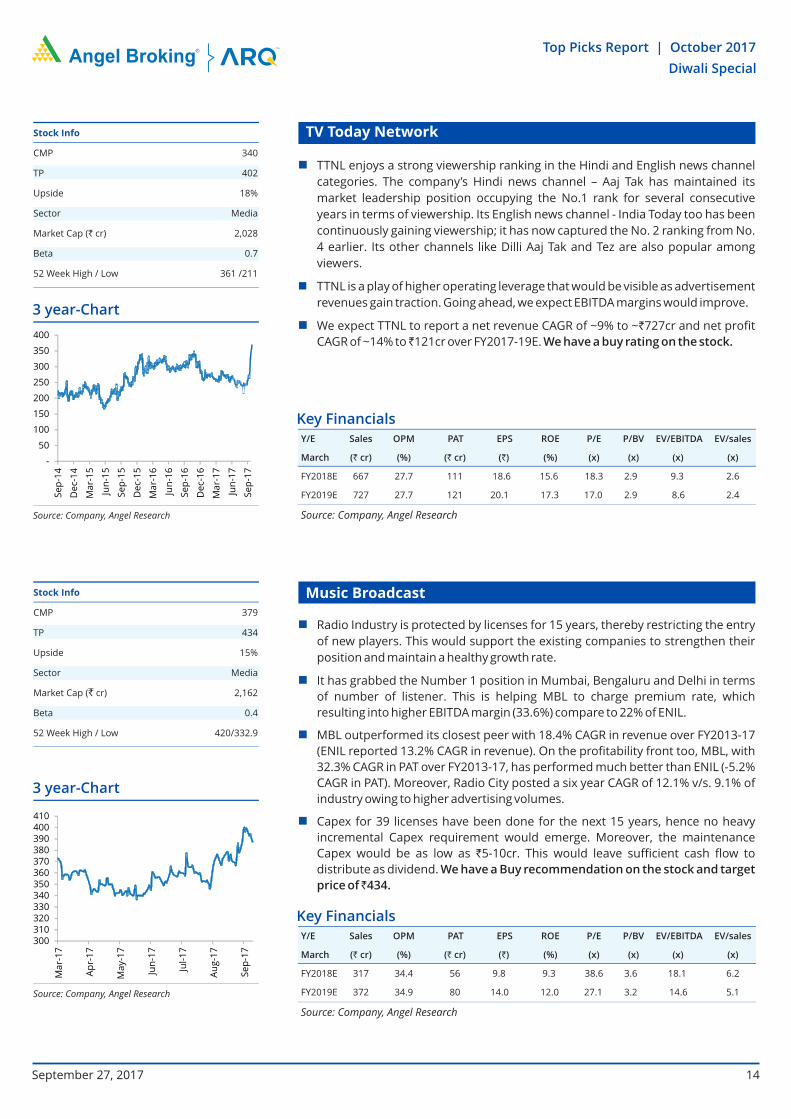
3 year-Chart
Source: Company, Angel Research
Key Financials
Source: Company, Angel Research
Stock Info
CMP 379
TP 434
Upside 15%
Sector Media
Market Cap (` cr) 2,162
Beta 0.4
52 Week High / Low 420/332.9
3 year-Chart
Source: Company, Angel Research
-
50
100
150
200
250
300
350
400
Se
p-1
4
De
c-1
4
Ma
r-1
5
Jun
-15
Se
p-1
5
De
c-1
5
Ma
r-1
6
Jun
-16
Se
p-1
6
De
c-1
6
Ma
r-1
7
Jun
-17
Se
p-1
7
300310320330340350360370380390400410
Ma
r-1
7
Ap
r-1
7
Ma
y-1
7
Jun
-17
Jul-
17
Au
g-1
7
Se
p-1
7
Top Picks Report | October 2017
Diwali Special
September 27, 2017
Y/E Sales OPM PAT EPS ROE P/E P/BV EV/EBITDA EV/sales
March (` cr) (%) (` cr) (`) (%) (x) (x) (x) (x)
FY2018E 667 27.7 111 18.6 15.6 18.3 2.9 9.3 2.6
FY2019E 727 27.7 121 20.1 17.3 17.0 2.9 8.6 2.4
Y/E Sales OPM PAT EPS ROE P/E P/BV EV/EBITDA EV/sales
March (` cr) (%) (` cr) (`) (%) (x) (x) (x) (x)
FY2018E 317 34.4 56 9.8 9.3 38.6 3.6 18.1 6.2
FY2019E 372 34.9 80 14.0 12.0 27.1 3.2 14.6 5.1
Stock Info
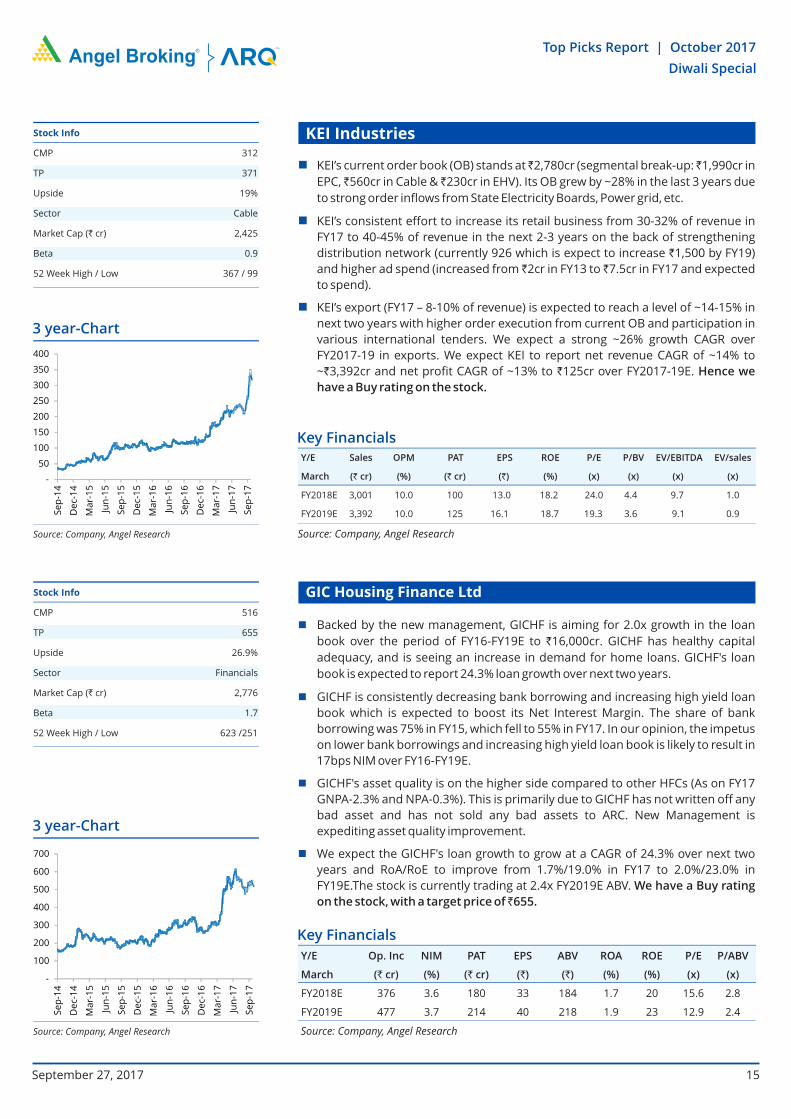
CMP 312
TP 371
Upside 19%
Sector Cable
Market Cap (` cr) 2,425
Beta 0.9
52 Week High / Low 367 / 99
15
n KEI’s current order book (OB) stands at ̀ 2,780cr (segmental break-up: ̀ 1,990cr in
EPC, ̀ 560cr in Cable & ̀ 230cr in EHV). Its OB grew by ~28% in the last 3 years due
to strong order inflows from State Electricity Boards, Power grid, etc.
n KEI’s consistent effort to increase its retail business from 30-32% of revenue in
FY17 to 40-45% of revenue in the next 2-3 years on the back of strengthening
distribution network (currently 926 which is expect to increase `1,500 by FY19)
and higher ad spend (increased from ̀ 2cr in FY13 to ̀ 7.5cr in FY17 and expected
to spend).
n KEI’s export (FY17 – 8-10% of revenue) is expected to reach a level of ~14-15% in
next two years with higher order execution from current OB and participation in
various international tenders. We expect a strong ~26% growth CAGR over
FY2017-19 in exports. We expect KEI to report net revenue CAGR of ~14% to
~`3,392cr and net profit CAGR of ~13% to `125cr over FY2017-19E. Hence we
have a Buy rating on the stock.
KEI Industries
Key Financials
Source: Company, Angel Research
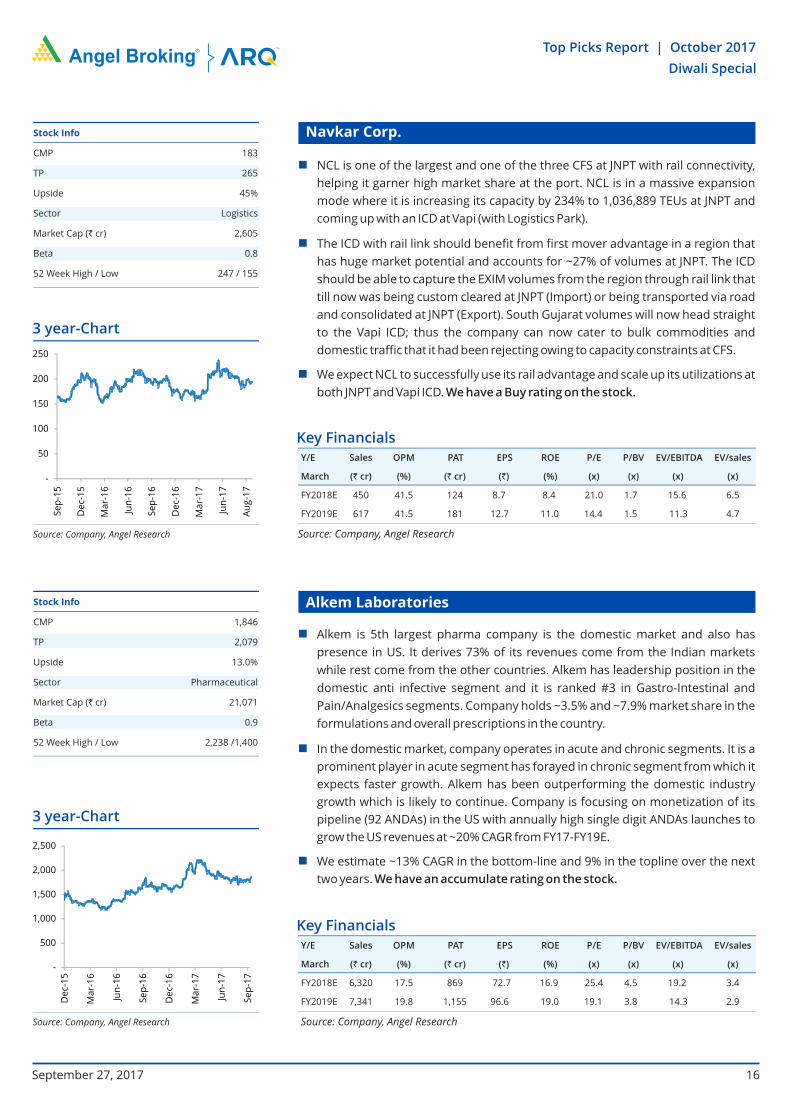
n Backed by the new management, GICHF is aiming for 2.0x growth in the loan
book over the period of FY16-FY19E to `16,000cr. GICHF has healthy capital
adequacy, and is seeing an increase in demand for home loans. GICHF's loan
book is expected to report 24.3% loan growth over next two years.
n GICHF is consistently decreasing bank borrowing and increasing high yield loan
book which is expected to boost its Net Interest Margin. The share of bank
borrowing was 75% in FY15, which fell to 55% in FY17. In our opinion, the impetus
on lower bank borrowings and increasing high yield loan book is likely to result in
17bps NIM over FY16-FY19E.
n GICHF's asset quality is on the higher side compared to other HFCs (As on FY17
GNPA-2.3% and NPA-0.3%). This is primarily due to GICHF has not written off any
bad asset and has not sold any bad assets to ARC. New Management is
expediting asset quality improvement.
n We expect the GICHF's loan growth to grow at a CAGR of 24.3% over next two
years and RoA/RoE to improve from 1.7%/19.0% in FY17 to 2.0%/23.0% in
FY19E.The stock is currently trading at 2.4x FY2019E ABV. We have a Buy rating
on the stock, with a target price of ̀ 655.
GIC Housing Finance Ltd
Key Financials
Source: Company, Angel Research
Stock Info
CMP 516
TP 655
Upside 26.9%
Sector Financials
Market Cap (` cr) 2,776
Beta 1.7
52 Week High / Low 623 /251
3 year-Chart
Source: Company, Angel Research
-
50
100
150
200
250
300
350
400
Se
p-1
4
De
c-1
4
Ma
r-1
5
Jun
-15
Se
p-1
5
De
c-1
5
Ma
r-1
6
Jun
-16
Se
p-1
6
De
c-1
6
Ma
r-1
7
Jun
-17
Se
p-1
7
3 year-Chart
Source: Company, Angel Research
-
100
200
300
400
500
600
700
Se
p-1
4
De
c-1
4
Ma
r-1
5
Jun
-15
Se
p-1
5
De
c-1
5
Ma
r-1
6
Jun
-16
Se
p-1
6
De
c-1
6
Ma
r-1
7
Jun
-17
Se
p-1
7
Top Picks Report | October 2017
Diwali Special
September 27, 2017
Y/E Sales OPM PAT EPS ROE P/E P/BV EV/EBITDA EV/sales
March (` cr) (%) (` cr) (`) (%) (x) (x) (x) (x)
FY2018E 3,001 10.0 100 13.0 18.2 24.0 4.4 9.7 1.0
FY2019E 3,392 10.0 125 16.1 18.7 19.3 3.6 9.1 0.9
Y/E Op. Inc NIM PAT EPS ABV ROA ROE P/E P/ABV
March (` cr) (%) (` cr) (`) (`) (%) (%) (x) (x)
FY2018E 376 3.6 180 33 184 1.7 20 15.6 2.8
FY2019E 477 3.7 214 40 218 1.9 23 12.9 2.4
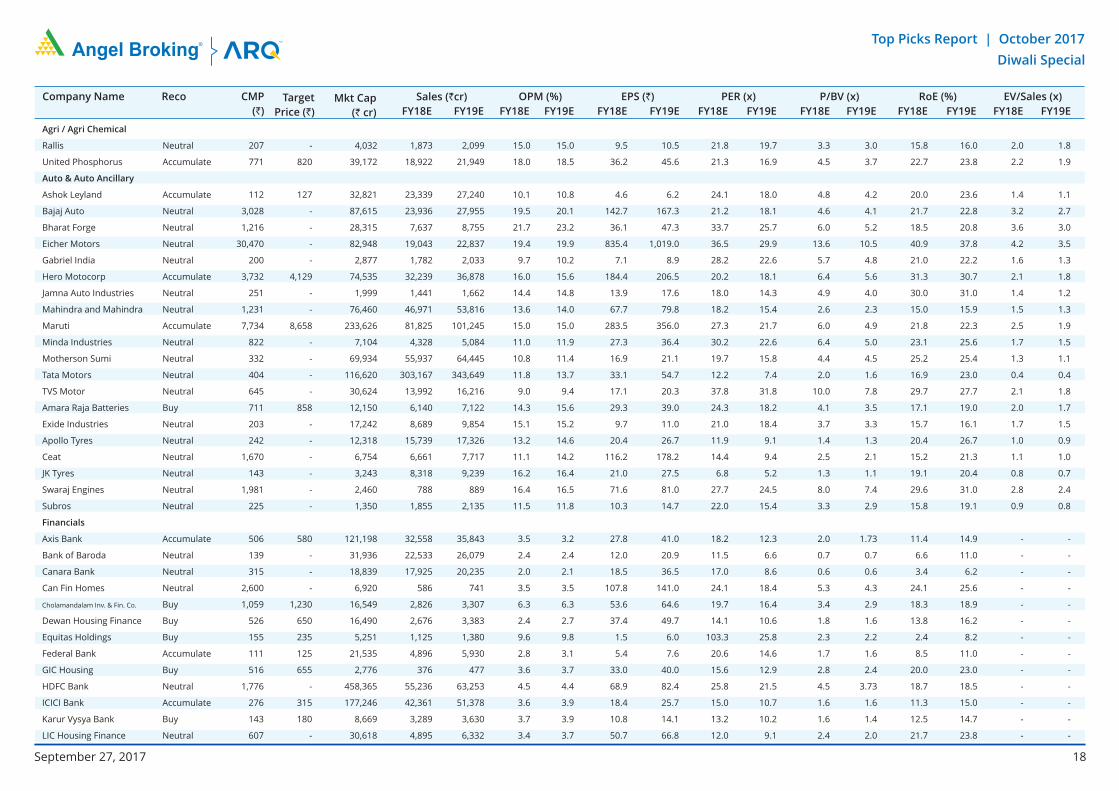
Stock Info
CMP 183
TP 265
Upside 45%
Sector Logistics
Market Cap (` cr) 2,605
Beta 0.8
52 Week High / Low 247 / 155
16
n NCL is one of the largest and one of the three CFS at JNPT with rail connectivity,
helping it garner high market share at the port. NCL is in a massive expansion
mode where it is increasing its capacity by 234% to 1,036,889 TEUs at JNPT and
coming up with an ICD at Vapi (with Logistics Park).
n The ICD with rail link should benefit from first mover advantage in a region that
has huge market potential and accounts for ~27% of volumes at JNPT. The ICD
should be able to capture the EXIM volumes from the region through rail link that
till now was being custom cleared at JNPT (Import) or being transported via road
and consolidated at JNPT (Export). South Gujarat volumes will now head straight
to the Vapi ICD; thus the company can now cater to bulk commodities and
domestic traffic that it had been rejecting owing to capacity constraints at CFS.
n We expect NCL to successfully use its rail advantage and scale up its utilizations at
both JNPT and Vapi ICD. We have a Buy rating on the stock.
Navkar Corp.
Key Financials
Source: Company, Angel Research
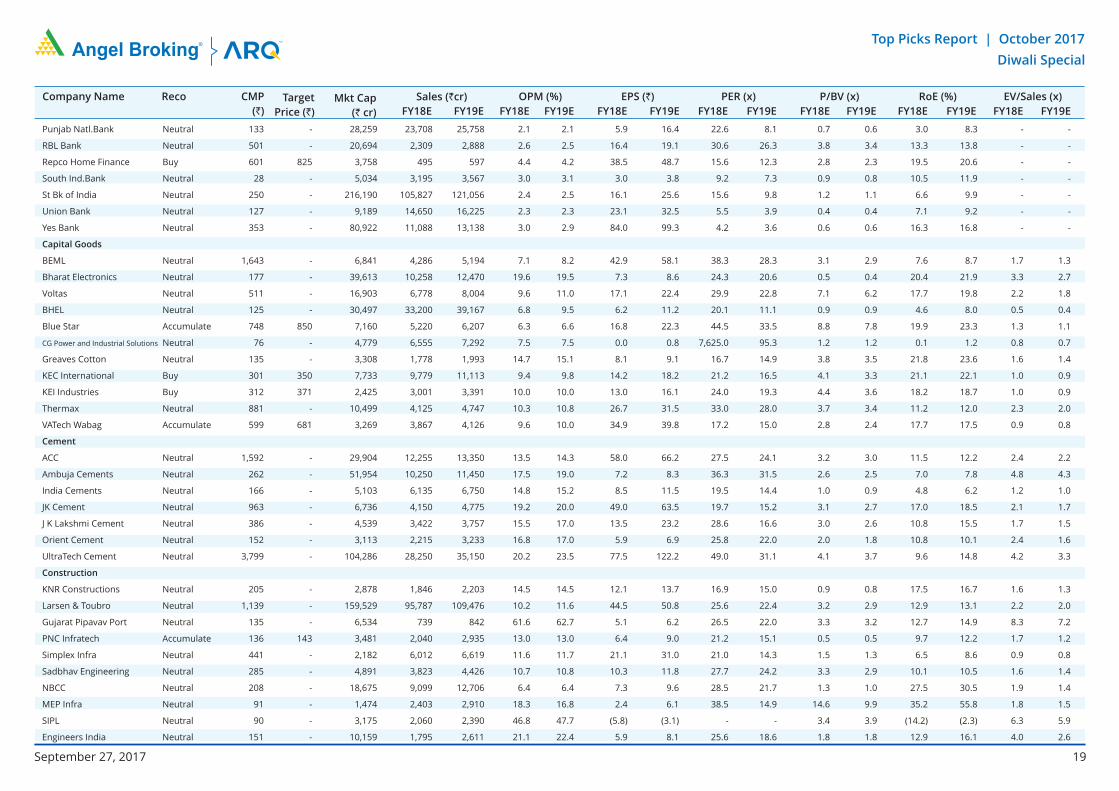
n Alkem is 5th largest pharma company is the domestic market and also has
presence in US. It derives 73% of its revenues come from the Indian markets
while rest come from the other countries. Alkem has leadership position in the
domestic anti infective segment and it is ranked #3 in Gastro-Intestinal and
Pain/Analgesics segments. Company holds ~3.5% and ~7.9% market share in the
formulations and overall prescriptions in the country.
n In the domestic market, company operates in acute and chronic segments. It is a
prominent player in acute segment has forayed in chronic segment from which it
expects faster growth. Alkem has been outperforming the domestic industry
growth which is likely to continue. Company is focusing on monetization of its
pipeline (92 ANDAs) in the US with annually high single digit ANDAs launches to
grow the US revenues at ~20% CAGR from FY17-FY19E.
n We estimate ~13% CAGR in the bottom-line and 9% in the topline over the next
two years. We have an accumulate rating on the stock.
Alkem Laboratories
Key Financials
Source: Company, Angel Research
Stock Info
CMP 1,846
TP 2,079
Upside 13.0%
Sector Pharmaceutical
Market Cap (` cr) 21,071
Beta 0.9
52 Week High / Low 2,238 /1,400
3 year-Chart
Source: Company, Angel Research
-
50
100
150
200
250
Se
p-1
5
De
c-1
5
Ma
r-1
6
Jun
-16
Se
p-1
6
De
c-1
6
Ma
r-1
7
Jun
-17
Au
g-1
7
3 year-Chart
Source: Company, Angel Research
-
500
1,000
1,500
2,000
2,500
De
c-1
5
Ma
r-1
6
Jun
-16
Se
p-1
6
De
c-1
6
Ma
r-1
7
Jun
-17
Se
p-1
7
Top Picks Report | October 2017
Diwali Special
September 27, 2017
Y/E Sales OPM PAT EPS ROE P/E P/BV EV/EBITDA EV/sales
March (` cr) (%) (` cr) (`) (%) (x) (x) (x) (x)
FY2018E 450 41.5 124 8.7 8.4 21.0 1.7 15.6 6.5
FY2019E 617 41.5 181 12.7 11.0 14.4 1.5 11.3 4.7
Y/E Sales OPM PAT EPS ROE P/E P/BV EV/EBITDA EV/sales
March (` cr) (%) (` cr) (`) (%) (x) (x) (x) (x)
FY2018E 6,320 17.5 869 72.7 16.9 25.4 4.5 19.2 3.4
FY2019E 7,341 19.8 1,155 96.6 19.0 19.1 3.8 14.3 2.9

17
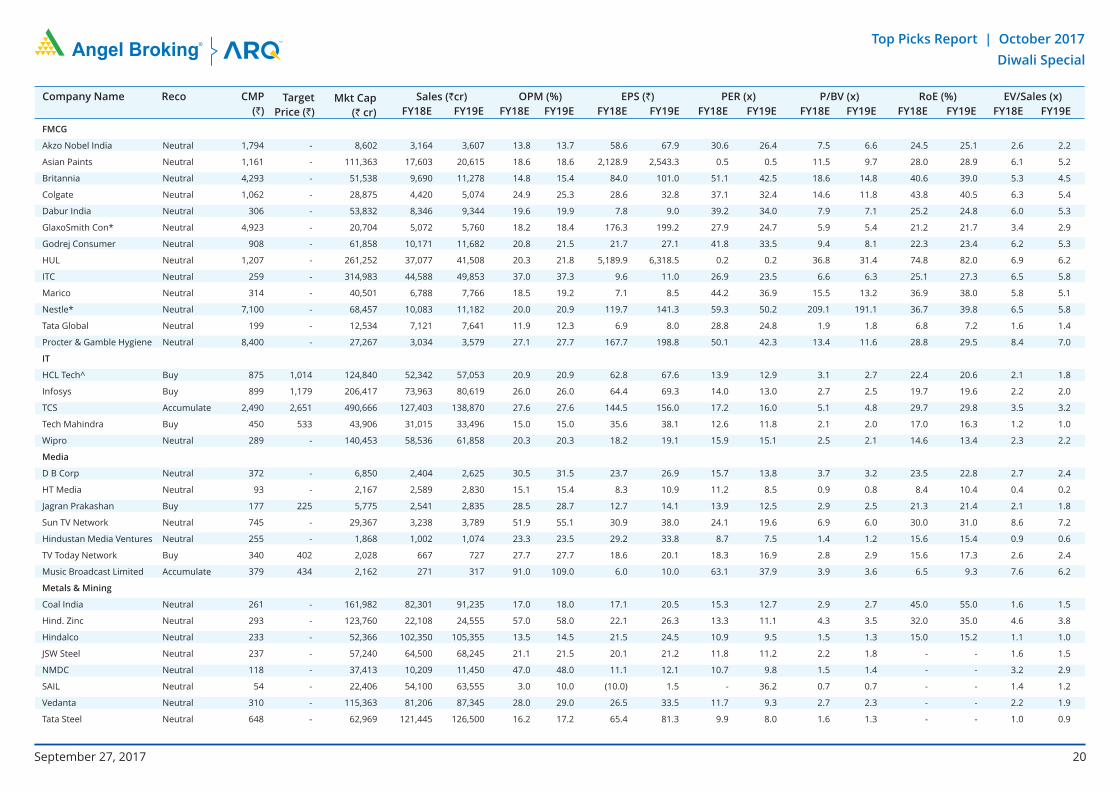
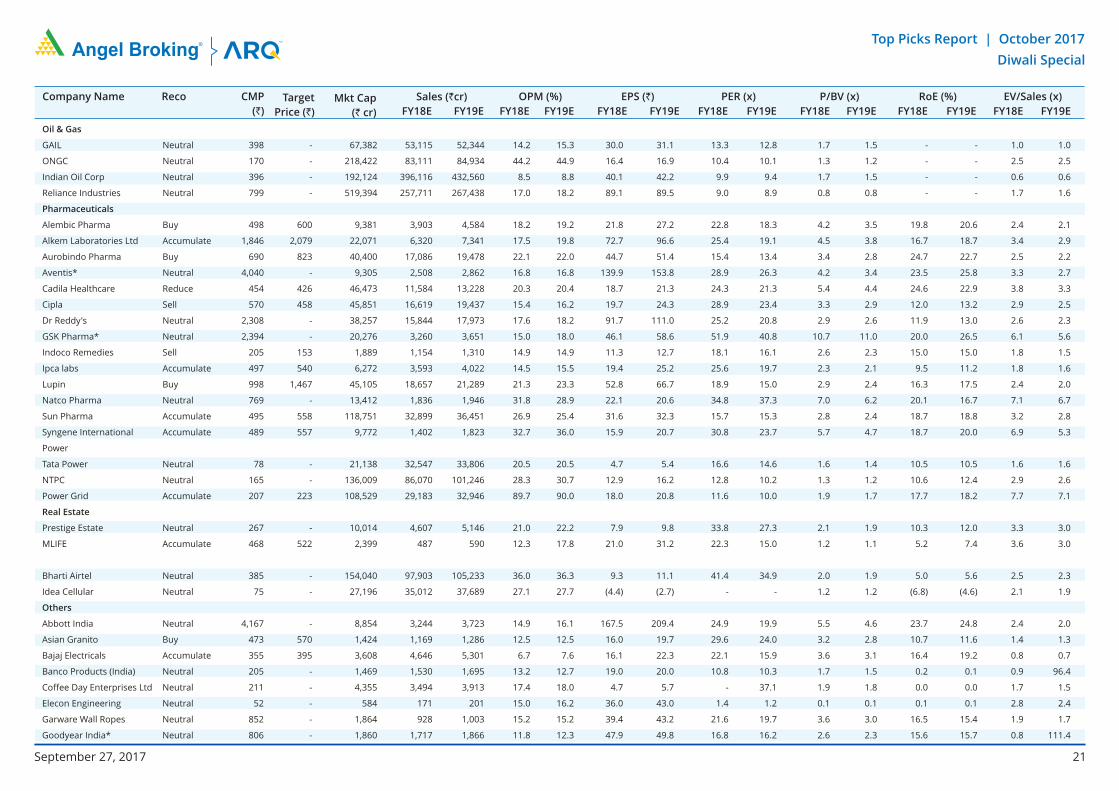
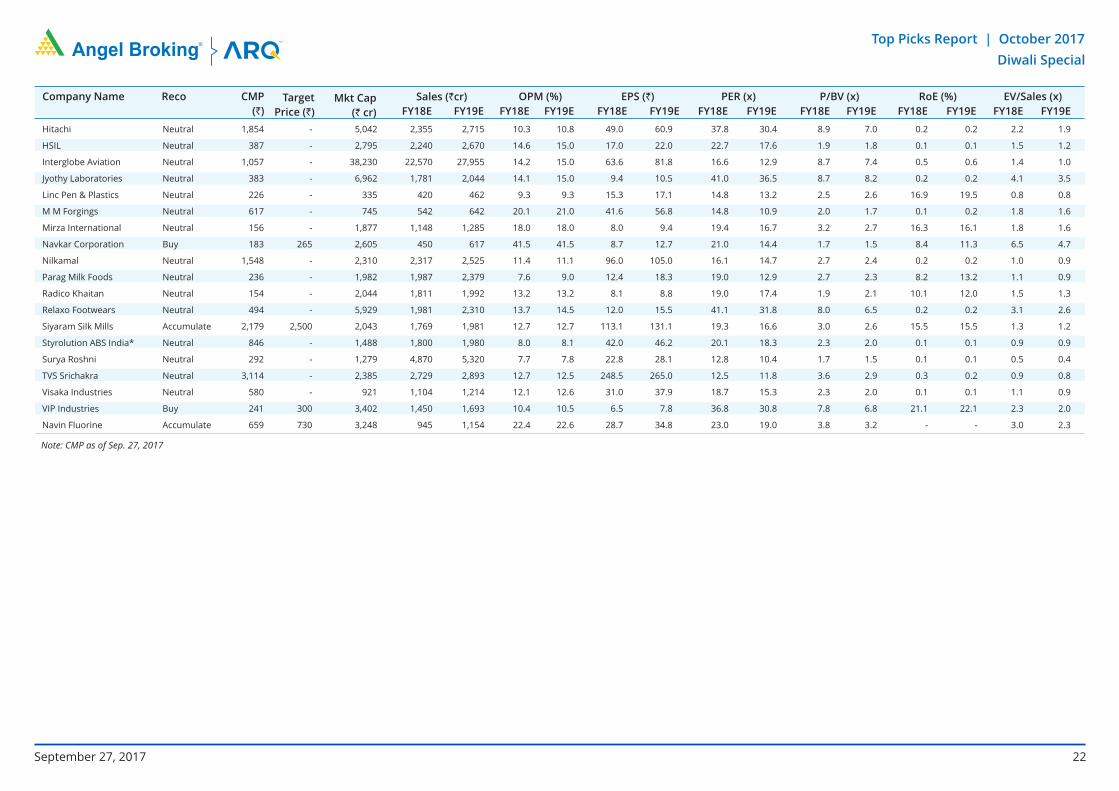
Stock Watch
Top Picks Report | October 2017
Diwali Special
September 27, 2017
18
Company Name Reco CMP
(`)
Target
Price (`)
Mkt Cap
(` cr)
Sales (`cr)
FY18E FY19E
OPM (%)
FY18E FY19E
EPS (`)
FY18E FY19E
PER (x)
FY18E FY19E
P/BV (x)
FY18E FY19E
RoE (%)
FY18E FY19E
EV/Sales (x)
FY18E FY19E
Top Picks Report | October 2017
Diwali Special
September 27, 2017
Agri / Agri Chemical
Rallis Neutral 207 - 4,032 1,873 2,099 15.0 15.0 9.5 10.5 21.8 19.7 3.3 3.0 15.8 16.0 2.0 1.8
United Phosphorus Accumulate 771 820 39,172 18,922 21,949 18.0 18.5 36.2 45.6 21.3 16.9 4.5 3.7 22.7 23.8 2.2 1.9
Auto & Auto Ancillary
Ashok Leyland Accumulate 112 127 32,821 23,339 27,240 10.1 10.8 4.6 6.2 24.1 18.0 4.8 4.2 20.0 23.6 1.4 1.1
Bajaj Auto Neutral 3,028 - 87,615 23,936 27,955 19.5 20.1 142.7 167.3 21.2 18.1 4.6 4.1 21.7 22.8 3.2 2.7
Bharat Forge Neutral 1,216 - 28,315 7,637 8,755 21.7 23.2 36.1 47.3 33.7 25.7 6.0 5.2 18.5 20.8 3.6 3.0
Eicher Motors Neutral 30,470 - 82,948 19,043 22,837 19.4 19.9 835.4 1,019.0 36.5 29.9 13.6 10.5 40.9 37.8 4.2 3.5
Gabriel India Neutral 200 - 2,877 1,782 2,033 9.7 10.2 7.1 8.9 28.2 22.6 5.7 4.8 21.0 22.2 1.6 1.3
Hero Motocorp Accumulate 3,732 4,129 74,535 32,239 36,878 16.0 15.6 184.4 206.5 20.2 18.1 6.4 5.6 31.3 30.7 2.1 1.8
Jamna Auto Industries Neutral 251 - 1,999 1,441 1,662 14.4 14.8 13.9 17.6 18.0 14.3 4.9 4.0 30.0 31.0 1.4 1.2
Mahindra and Mahindra Neutral 1,231 - 76,460 46,971 53,816 13.6 14.0 67.7 79.8 18.2 15.4 2.6 2.3 15.0 15.9 1.5 1.3
Maruti Accumulate 7,734 8,658 233,626 81,825 101,245 15.0 15.0 283.5 356.0 27.3 21.7 6.0 4.9 21.8 22.3 2.5 1.9
Minda Industries Neutral 822 - 7,104 4,328 5,084 11.0 11.9 27.3 36.4 30.2 22.6 6.4 5.0 23.1 25.6 1.7 1.5
Motherson Sumi Neutral 332 - 69,934 55,937 64,445 10.8 11.4 16.9 21.1 19.7 15.8 4.4 4.5 25.2 25.4 1.3 1.1
Tata Motors Neutral 404 - 116,620 303,167 343,649 11.8 13.7 33.1 54.7 12.2 7.4 2.0 1.6 16.9 23.0 0.4 0.4
TVS Motor Neutral 645 - 30,624 13,992 16,216 9.0 9.4 17.1 20.3 37.8 31.8 10.0 7.8 29.7 27.7 2.1 1.8
Amara Raja Batteries Buy 711 858 12,150 6,140 7,122 14.3 15.6 29.3 39.0 24.3 18.2 4.1 3.5 17.1 19.0 2.0 1.7
Exide Industries Neutral 203 - 17,242 8,689 9,854 15.1 15.2 9.7 11.0 21.0 18.4 3.7 3.3 15.7 16.1 1.7 1.5
Apollo Tyres Neutral 242 - 12,318 15,739 17,326 13.2 14.6 20.4 26.7 11.9 9.1 1.4 1.3 20.4 26.7 1.0 0.9
Ceat Neutral 1,670 - 6,754 6,661 7,717 11.1 14.2 116.2 178.2 14.4 9.4 2.5 2.1 15.2 21.3 1.1 1.0
JK Tyres Neutral 143 - 3,243 8,318 9,239 16.2 16.4 21.0 27.5 6.8 5.2 1.3 1.1 19.1 20.4 0.8 0.7
Swaraj Engines Neutral 1,981 - 2,460 788 889 16.4 16.5 71.6 81.0 27.7 24.5 8.0 7.4 29.6 31.0 2.8 2.4
Subros Neutral 225 - 1,350 1,855 2,135 11.5 11.8 10.3 14.7 22.0 15.4 3.3 2.9 15.8 19.1 0.9 0.8
Financials
Axis Bank Accumulate 506 580 121,198 32,558 35,843 3.5 3.2 27.8 41.0 18.2 12.3 2.0 1.73 11.4 14.9 - -
Bank of Baroda Neutral 139 - 31,936 22,533 26,079 2.4 2.4 12.0 20.9 11.5 6.6 0.7 0.7 6.6 11.0 - -
Canara Bank Neutral 315 - 18,839 17,925 20,235 2.0 2.1 18.5 36.5 17.0 8.6 0.6 0.6 3.4 6.2 - -
Can Fin Homes Neutral 2,600 - 6,920 586 741 3.5 3.5 107.8 141.0 24.1 18.4 5.3 4.3 24.1 25.6 - -
Cholamandalam Inv. & Fin. Co. Buy 1,059 1,230 16,549 2,826 3,307 6.3 6.3 53.6 64.6 19.7 16.4 3.4 2.9 18.3 18.9 - -
Dewan Housing Finance Buy 526 650 16,490 2,676 3,383 2.4 2.7 37.4 49.7 14.1 10.6 1.8 1.6 13.8 16.2 - -
Equitas Holdings Buy 155 235 5,251 1,125 1,380 9.6 9.8 1.5 6.0 103.3 25.8 2.3 2.2 2.4 8.2 - -
Federal Bank Accumulate 111 125 21,535 4,896 5,930 2.8 3.1 5.4 7.6 20.6 14.6 1.7 1.6 8.5 11.0 - -
GIC Housing Buy 516 655 2,776 376 477 3.6 3.7 33.0 40.0 15.6 12.9 2.8 2.4 20.0 23.0 - -
HDFC Bank Neutral 1,776 - 458,365 55,236 63,253 4.5 4.4 68.9 82.4 25.8 21.5 4.5 3.73 18.7 18.5 - -
ICICI Bank Accumulate 276 315 177,246 42,361 51,378 3.6 3.9 18.4 25.7 15.0 10.7 1.6 1.6 11.3 15.0 - -
Karur Vysya Bank Buy 143 180 8,669 3,289 3,630 3.7 3.9 10.8 14.1 13.2 10.2 1.6 1.4 12.5 14.7 - -
LIC Housing Finance Neutral 607 - 30,618 4,895 6,332 3.4 3.7 50.7 66.8 12.0 9.1 2.4 2.0 21.7 23.8 - -
19
Top Picks Report | October 2017
Diwali Special
Company Name Reco CMP
(`)
Target
Price (`)
Mkt Cap
(` cr)
Sales (`cr)
FY18E FY19E
OPM (%)
FY18E FY19E
EPS (`)
FY18E FY19E
PER (x)
FY18E FY19E
P/BV (x)
FY18E FY19E
RoE (%)
FY18E FY19E
EV/Sales (x)
FY18E FY19E
September 27, 2017
Punjab Natl.Bank Neutral 133 - 28,259 23,708 25,758 2.1 2.1 5.9 16.4 22.6 8.1 0.7 0.6 3.0 8.3 - -
RBL Bank Neutral 501 - 20,694 2,309 2,888 2.6 2.5 16.4 19.1 30.6 26.3 3.8 3.4 13.3 13.8 - -
Repco Home Finance Buy 601 825 3,758 495 597 4.4 4.2 38.5 48.7 15.6 12.3 2.8 2.3 19.5 20.6 - -
South Ind.Bank Neutral 28 - 5,034 3,195 3,567 3.0 3.1 3.0 3.8 9.2 7.3 0.9 0.8 10.5 11.9 - -
St Bk of India Neutral 250 - 216,190 105,827 121,056 2.4 2.5 16.1 25.6 15.6 9.8 1.2 1.1 6.6 9.9 - -
Union Bank Neutral 127 - 9,189 14,650 16,225 2.3 2.3 23.1 32.5 5.5 3.9 0.4 0.4 7.1 9.2 - -
Yes Bank Neutral 353 - 80,922 11,088 13,138 3.0 2.9 84.0 99.3 4.2 3.6 0.6 0.6 16.3 16.8 - -
Capital Goods
BEML Neutral 1,643 - 6,841 4,286 5,194 7.1 8.2 42.9 58.1 38.3 28.3 3.1 2.9 7.6 8.7 1.7 1.3
Bharat Electronics Neutral 177 - 39,613 10,258 12,470 19.6 19.5 7.3 8.6 24.3 20.6 0.5 0.4 20.4 21.9 3.3 2.7
Voltas Neutral 511 - 16,903 6,778 8,004 9.6 11.0 17.1 22.4 29.9 22.8 7.1 6.2 17.7 19.8 2.2 1.8
BHEL Neutral 125 - 30,497 33,200 39,167 6.8 9.5 6.2 11.2 20.1 11.1 0.9 0.9 4.6 8.0 0.5 0.4
Blue Star Accumulate 748 850 7,160 5,220 6,207 6.3 6.6 16.8 22.3 44.5 33.5 8.8 7.8 19.9 23.3 1.3 1.1
CG Power and Industrial Solutions Neutral 76 - 4,779 6,555 7,292 7.5 7.5 0.0 0.8 7,625.0 95.3 1.2 1.2 0.1 1.2 0.8 0.7
Greaves Cotton Neutral 135 - 3,308 1,778 1,993 14.7 15.1 8.1 9.1 16.7 14.9 3.8 3.5 21.8 23.6 1.6 1.4
KEC International Buy 301 350 7,733 9,779 11,113 9.4 9.8 14.2 18.2 21.2 16.5 4.1 3.3 21.1 22.1 1.0 0.9
KEI Industries Buy 312 371 2,425 3,001 3,391 10.0 10.0 13.0 16.1 24.0 19.3 4.4 3.6 18.2 18.7 1.0 0.9
Thermax Neutral 881 - 10,499 4,125 4,747 10.3 10.8 26.7 31.5 33.0 28.0 3.7 3.4 11.2 12.0 2.3 2.0
VATech Wabag Accumulate 599 681 3,269 3,867 4,126 9.6 10.0 34.9 39.8 17.2 15.0 2.8 2.4 17.7 17.5 0.9 0.8
Cement
ACC Neutral 1,592 - 29,904 12,255 13,350 13.5 14.3 58.0 66.2 27.5 24.1 3.2 3.0 11.5 12.2 2.4 2.2
Ambuja Cements Neutral 262 - 51,954 10,250 11,450 17.5 19.0 7.2 8.3 36.3 31.5 2.6 2.5 7.0 7.8 4.8 4.3
India Cements Neutral 166 - 5,103 6,135 6,750 14.8 15.2 8.5 11.5 19.5 14.4 1.0 0.9 4.8 6.2 1.2 1.0
JK Cement Neutral 963 - 6,736 4,150 4,775 19.2 20.0 49.0 63.5 19.7 15.2 3.1 2.7 17.0 18.5 2.1 1.7
J K Lakshmi Cement Neutral 386 - 4,539 3,422 3,757 15.5 17.0 13.5 23.2 28.6 16.6 3.0 2.6 10.8 15.5 1.7 1.5
Orient Cement Neutral 152 - 3,113 2,215 3,233 16.8 17.0 5.9 6.9 25.8 22.0 2.0 1.8 10.8 10.1 2.4 1.6
UltraTech Cement Neutral 3,799 - 104,286 28,250 35,150 20.2 23.5 77.5 122.2 49.0 31.1 4.1 3.7 9.6 14.8 4.2 3.3
Construction
KNR Constructions Neutral 205 - 2,878 1,846 2,203 14.5 14.5 12.1 13.7 16.9 15.0 0.9 0.8 17.5 16.7 1.6 1.3
Larsen & Toubro Neutral 1,139 - 159,529 95,787 109,476 10.2 11.6 44.5 50.8 25.6 22.4 3.2 2.9 12.9 13.1 2.2 2.0
Gujarat Pipavav Port Neutral 135 - 6,534 739 842 61.6 62.7 5.1 6.2 26.5 22.0 3.3 3.2 12.7 14.9 8.3 7.2
PNC Infratech Accumulate 136 143 3,481 2,040 2,935 13.0 13.0 6.4 9.0 21.2 15.1 0.5 0.5 9.7 12.2 1.7 1.2
Simplex Infra Neutral 441 - 2,182 6,012 6,619 11.6 11.7 21.1 31.0 21.0 14.3 1.5 1.3 6.5 8.6 0.9 0.8
Sadbhav Engineering Neutral 285 - 4,891 3,823 4,426 10.7 10.8 10.3 11.8 27.7 24.2 3.3 2.9 10.1 10.5 1.6 1.4
NBCC Neutral 208 - 18,675 9,099 12,706 6.4 6.4 7.3 9.6 28.5 21.7 1.3 1.0 27.5 30.5 1.9 1.4
MEP Infra Neutral 91 - 1,474 2,403 2,910 18.3 16.8 2.4 6.1 38.5 14.9 14.6 9.9 35.2 55.8 1.8 1.5
SIPL Neutral 90 - 3,175 2,060 2,390 46.8 47.7 (5.8) (3.1) - - 3.4 3.9 (14.2) (2.3) 6.3 5.9
Engineers India Neutral 151 - 10,159 1,795 2,611 21.1 22.4 5.9 8.1 25.6 18.6 1.8 1.8 12.9 16.1 4.0 2.6
20
Top Picks Report | October 2017
Diwali Special
Company Name Reco CMP
(`)
Target
Price (`)
Mkt Cap
(` cr)
Sales (`cr)
FY18E FY19E
OPM (%)
FY18E FY19E
EPS (`)
FY18E FY19E
PER (x)
FY18E FY19E
P/BV (x)
FY18E FY19E
RoE (%)
FY18E FY19E
EV/Sales (x)
FY18E FY19E
September 27, 2017
FMCG
Akzo Nobel India Neutral 1,794 - 8,602 3,164 3,607 13.8 13.7 58.6 67.9 30.6 26.4 7.5 6.6 24.5 25.1 2.6 2.2
Asian Paints Neutral 1,161 - 111,363 17,603 20,615 18.6 18.6 2,128.9 2,543.3 0.5 0.5 11.5 9.7 28.0 28.9 6.1 5.2
Britannia Neutral 4,293 - 51,538 9,690 11,278 14.8 15.4 84.0 101.0 51.1 42.5 18.6 14.8 40.6 39.0 5.3 4.5
Colgate Neutral 1,062 - 28,875 4,420 5,074 24.9 25.3 28.6 32.8 37.1 32.4 14.6 11.8 43.8 40.5 6.3 5.4
Dabur India Neutral 306 - 53,832 8,346 9,344 19.6 19.9 7.8 9.0 39.2 34.0 7.9 7.1 25.2 24.8 6.0 5.3
GlaxoSmith Con* Neutral 4,923 - 20,704 5,072 5,760 18.2 18.4 176.3 199.2 27.9 24.7 5.9 5.4 21.2 21.7 3.4 2.9
Godrej Consumer Neutral 908 - 61,858 10,171 11,682 20.8 21.5 21.7 27.1 41.8 33.5 9.4 8.1 22.3 23.4 6.2 5.3
HUL Neutral 1,207 - 261,252 37,077 41,508 20.3 21.8 5,189.9 6,318.5 0.2 0.2 36.8 31.4 74.8 82.0 6.9 6.2
ITC Neutral 259 - 314,983 44,588 49,853 37.0 37.3 9.6 11.0 26.9 23.5 6.6 6.3 25.1 27.3 6.5 5.8
Marico Neutral 314 - 40,501 6,788 7,766 18.5 19.2 7.1 8.5 44.2 36.9 15.5 13.2 36.9 38.0 5.8 5.1
Nestle* Neutral 7,100 - 68,457 10,083 11,182 20.0 20.9 119.7 141.3 59.3 50.2 209.1 191.1 36.7 39.8 6.5 5.8
Tata Global Neutral 199 - 12,534 7,121 7,641 11.9 12.3 6.9 8.0 28.8 24.8 1.9 1.8 6.8 7.2 1.6 1.4
Procter & Gamble Hygiene Neutral 8,400 - 27,267 3,034 3,579 27.1 27.7 167.7 198.8 50.1 42.3 13.4 11.6 28.8 29.5 8.4 7.0
IT
HCL Tech^ Buy 875 1,014 124,840 52,342 57,053 20.9 20.9 62.8 67.6 13.9 12.9 3.1 2.7 22.4 20.6 2.1 1.8
Infosys Buy 899 1,179 206,417 73,963 80,619 26.0 26.0 64.4 69.3 14.0 13.0 2.7 2.5 19.7 19.6 2.2 2.0
TCS Accumulate 2,490 2,651 490,666 127,403 138,870 27.6 27.6 144.5 156.0 17.2 16.0 5.1 4.8 29.7 29.8 3.5 3.2
Tech Mahindra Buy 450 533 43,906 31,015 33,496 15.0 15.0 35.6 38.1 12.6 11.8 2.1 2.0 17.0 16.3 1.2 1.0
Wipro Neutral 289 - 140,453 58,536 61,858 20.3 20.3 18.2 19.1 15.9 15.1 2.5 2.1 14.6 13.4 2.3 2.2
Media
D B Corp Neutral 372 - 6,850 2,404 2,625 30.5 31.5 23.7 26.9 15.7 13.8 3.7 3.2 23.5 22.8 2.7 2.4
HT Media Neutral 93 - 2,167 2,589 2,830 15.1 15.4 8.3 10.9 11.2 8.5 0.9 0.8 8.4 10.4 0.4 0.2
Jagran Prakashan Buy 177 225 5,775 2,541 2,835 28.5 28.7 12.7 14.1 13.9 12.5 2.9 2.5 21.3 21.4 2.1 1.8
Sun TV Network Neutral 745 - 29,367 3,238 3,789 51.9 55.1 30.9 38.0 24.1 19.6 6.9 6.0 30.0 31.0 8.6 7.2
Hindustan Media Ventures Neutral 255 - 1,868 1,002 1,074 23.3 23.5 29.2 33.8 8.7 7.5 1.4 1.2 15.6 15.4 0.9 0.6
TV Today Network Buy 340 402 2,028 667 727 27.7 27.7 18.6 20.1 18.3 16.9 2.8 2.9 15.6 17.3 2.6 2.4
Music Broadcast Limited Accumulate 379 434 2,162 271 317 91.0 109.0 6.0 10.0 63.1 37.9 3.9 3.6 6.5 9.3 7.6 6.2
Metals & Mining
Coal India Neutral 261 - 161,982 82,301 91,235 17.0 18.0 17.1 20.5 15.3 12.7 2.9 2.7 45.0 55.0 1.6 1.5
Hind. Zinc Neutral 293 - 123,760 22,108 24,555 57.0 58.0 22.1 26.3 13.3 11.1 4.3 3.5 32.0 35.0 4.6 3.8
Hindalco Neutral 233 - 52,366 102,350 105,355 13.5 14.5 21.5 24.5 10.9 9.5 1.5 1.3 15.0 15.2 1.1 1.0
JSW Steel Neutral 237 - 57,240 64,500 68,245 21.1 21.5 20.1 21.2 11.8 11.2 2.2 1.8 - - 1.6 1.5
NMDC Neutral 118 - 37,413 10,209 11,450 47.0 48.0 11.1 12.1 10.7 9.8 1.5 1.4 - - 3.2 2.9
SAIL Neutral 54 - 22,406 54,100 63,555 3.0 10.0 (10.0) 1.5 - 36.2 0.7 0.7 - - 1.4 1.2
Vedanta Neutral 310 - 115,363 81,206 87,345 28.0 29.0 26.5 33.5 11.7 9.3 2.7 2.3 - - 2.2 1.9
Tata Steel Neutral 648 - 62,969 121,445 126,500 16.2 17.2 65.4 81.3 9.9 8.0 1.6 1.3 - - 1.0 0.9
21
Top Picks Report | October 2017
Diwali Special
Company Name Reco CMP
(`)
Target
Price (`)
Mkt Cap
(` cr)
Sales (`cr)
FY18E FY19E
OPM (%)
FY18E FY19E
EPS (`)
FY18E FY19E
PER (x)
FY18E FY19E
P/BV (x)
FY18E FY19E
RoE (%)
FY18E FY19E
EV/Sales (x)
FY18E FY19E
September 27, 2017
Oil & Gas
GAIL Neutral 398 - 67,382 53,115 52,344 14.2 15.3 30.0 31.1 13.3 12.8 1.7 1.5 - - 1.0 1.0
ONGC Neutral 170 - 218,422 83,111 84,934 44.2 44.9 16.4 16.9 10.4 10.1 1.3 1.2 - - 2.5 2.5
Indian Oil Corp Neutral 396 - 192,124 396,116 432,560 8.5 8.8 40.1 42.2 9.9 9.4 1.7 1.5 - - 0.6 0.6
Reliance Industries Neutral 799 - 519,394 257,711 267,438 17.0 18.2 89.1 89.5 9.0 8.9 0.8 0.8 - - 1.7 1.6
Pharmaceuticals
Alembic Pharma Buy 498 600 9,381 3,903 4,584 18.2 19.2 21.8 27.2 22.8 18.3 4.2 3.5 19.8 20.6 2.4 2.1
Alkem Laboratories Ltd Accumulate 1,846 2,079 22,071 6,320 7,341 17.5 19.8 72.7 96.6 25.4 19.1 4.5 3.8 16.7 18.7 3.4 2.9
Aurobindo Pharma Buy 690 823 40,400 17,086 19,478 22.1 22.0 44.7 51.4 15.4 13.4 3.4 2.8 24.7 22.7 2.5 2.2
Aventis* Neutral 4,040 - 9,305 2,508 2,862 16.8 16.8 139.9 153.8 28.9 26.3 4.2 3.4 23.5 25.8 3.3 2.7
Cadila Healthcare Reduce 454 426 46,473 11,584 13,228 20.3 20.4 18.7 21.3 24.3 21.3 5.4 4.4 24.6 22.9 3.8 3.3
Cipla Sell 570 458 45,851 16,619 19,437 15.4 16.2 19.7 24.3 28.9 23.4 3.3 2.9 12.0 13.2 2.9 2.5
Dr Reddy's Neutral 2,308 - 38,257 15,844 17,973 17.6 18.2 91.7 111.0 25.2 20.8 2.9 2.6 11.9 13.0 2.6 2.3
GSK Pharma* Neutral 2,394 - 20,276 3,260 3,651 15.0 18.0 46.1 58.6 51.9 40.8 10.7 11.0 20.0 26.5 6.1 5.6
Indoco Remedies Sell 205 153 1,889 1,154 1,310 14.9 14.9 11.3 12.7 18.1 16.1 2.6 2.3 15.0 15.0 1.8 1.5
Ipca labs Accumulate 497 540 6,272 3,593 4,022 14.5 15.5 19.4 25.2 25.6 19.7 2.3 2.1 9.5 11.2 1.8 1.6
Lupin Buy 998 1,467 45,105 18,657 21,289 21.3 23.3 52.8 66.7 18.9 15.0 2.9 2.4 16.3 17.5 2.4 2.0
Natco Pharma Neutral 769 - 13,412 1,836 1,946 31.8 28.9 22.1 20.6 34.8 37.3 7.0 6.2 20.1 16.7 7.1 6.7
Sun Pharma Accumulate 495 558 118,751 32,899 36,451 26.9 25.4 31.6 32.3 15.7 15.3 2.8 2.4 18.7 18.8 3.2 2.8
Syngene International Accumulate 489 557 9,772 1,402 1,823 32.7 36.0 15.9 20.7 30.8 23.7 5.7 4.7 18.7 20.0 6.9 5.3
Power
Tata Power Neutral 78 - 21,138 32,547 33,806 20.5 20.5 4.7 5.4 16.6 14.6 1.6 1.4 10.5 10.5 1.6 1.6
NTPC Neutral 165 - 136,009 86,070 101,246 28.3 30.7 12.9 16.2 12.8 10.2 1.3 1.2 10.6 12.4 2.9 2.6
Power Grid Accumulate 207 223 108,529 29,183 32,946 89.7 90.0 18.0 20.8 11.6 10.0 1.9 1.7 17.7 18.2 7.7 7.1
Real Estate
Prestige Estate Neutral 267 - 10,014 4,607 5,146 21.0 22.2 7.9 9.8 33.8 27.3 2.1 1.9 10.3 12.0 3.3 3.0
MLIFE Accumulate 468 522 2,399 487 590 12.3 17.8 21.0 31.2 22.3 15.0 1.2 1.1 5.2 7.4 3.6 3.0
Bharti Airtel Neutral 385 - 154,040 97,903 105,233 36.0 36.3 9.3 11.1 41.4 34.9 2.0 1.9 5.0 5.6 2.5 2.3
Idea Cellular Neutral 75 - 27,196 35,012 37,689 27.1 27.7 (4.4) (2.7) - - 1.2 1.2 (6.8) (4.6) 2.1 1.9
Others
Abbott India Neutral 4,167 - 8,854 3,244 3,723 14.9 16.1 167.5 209.4 24.9 19.9 5.5 4.6 23.7 24.8 2.4 2.0
Asian Granito Buy 473 570 1,424 1,169 1,286 12.5 12.5 16.0 19.7 29.6 24.0 3.2 2.8 10.7 11.6 1.4 1.3
Bajaj Electricals Accumulate 355 395 3,608 4,646 5,301 6.7 7.6 16.1 22.3 22.1 15.9 3.6 3.1 16.4 19.2 0.8 0.7
Banco Products (India) Neutral 205 - 1,469 1,530 1,695 13.2 12.7 19.0 20.0 10.8 10.3 1.7 1.5 0.2 0.1 0.9 96.4
Coffee Day Enterprises Ltd Neutral 211 - 4,355 3,494 3,913 17.4 18.0 4.7 5.7 - 37.1 1.9 1.8 0.0 0.0 1.7 1.5
Elecon Engineering Neutral 52 - 584 171 201 15.0 16.2 36.0 43.0 1.4 1.2 0.1 0.1 0.1 0.1 2.8 2.4
Garware Wall Ropes Neutral 852 - 1,864 928 1,003 15.2 15.2 39.4 43.2 21.6 19.7 3.6 3.0 16.5 15.4 1.9 1.7
Goodyear India* Neutral 806 - 1,860 1,717 1,866 11.8 12.3 47.9 49.8 16.8 16.2 2.6 2.3 15.6 15.7 0.8 111.4
22
Hitachi Neutral 1,854 - 5,042 2,355 2,715 10.3 10.8 49.0 60.9 37.8 30.4 8.9 7.0 0.2 0.2 2.2 1.9
HSIL Neutral 387 - 2,795 2,240 2,670 14.6 15.0 17.0 22.0 22.7 17.6 1.9 1.8 0.1 0.1 1.5 1.2
Interglobe Aviation Neutral 1,057 - 38,230 22,570 27,955 14.2 15.0 63.6 81.8 16.6 12.9 8.7 7.4 0.5 0.6 1.4 1.0
Jyothy Laboratories Neutral 383 - 6,962 1,781 2,044 14.1 15.0 9.4 10.5 41.0 36.5 8.7 8.2 0.2 0.2 4.1 3.5
Linc Pen & Plastics Neutral 226 - 335 420 462 9.3 9.3 15.3 17.1 14.8 13.2 2.5 2.6 16.9 19.5 0.8 0.8
M M Forgings Neutral 617 - 745 542 642 20.1 21.0 41.6 56.8 14.8 10.9 2.0 1.7 0.1 0.2 1.8 1.6
Mirza International Neutral 156 - 1,877 1,148 1,285 18.0 18.0 8.0 9.4 19.4 16.7 3.2 2.7 16.3 16.1 1.8 1.6
Navkar Corporation Buy 183 265 2,605 450 617 41.5 41.5 8.7 12.7 21.0 14.4 1.7 1.5 8.4 11.3 6.5 4.7
Nilkamal Neutral 1,548 - 2,310 2,317 2,525 11.4 11.1 96.0 105.0 16.1 14.7 2.7 2.4 0.2 0.2 1.0 0.9
Parag Milk Foods Neutral 236 - 1,982 1,987 2,379 7.6 9.0 12.4 18.3 19.0 12.9 2.7 2.3 8.2 13.2 1.1 0.9
Radico Khaitan Neutral 154 - 2,044 1,811 1,992 13.2 13.2 8.1 8.8 19.0 17.4 1.9 2.1 10.1 12.0 1.5 1.3
Relaxo Footwears Neutral 494 - 5,929 1,981 2,310 13.7 14.5 12.0 15.5 41.1 31.8 8.0 6.5 0.2 0.2 3.1 2.6
Siyaram Silk Mills Accumulate 2,179 2,500 2,043 1,769 1,981 12.7 12.7 113.1 131.1 19.3 16.6 3.0 2.6 15.5 15.5 1.3 1.2
Styrolution ABS India* Neutral 846 - 1,488 1,800 1,980 8.0 8.1 42.0 46.2 20.1 18.3 2.3 2.0 0.1 0.1 0.9 0.9
Surya Roshni Neutral 292 - 1,279 4,870 5,320 7.7 7.8 22.8 28.1 12.8 10.4 1.7 1.5 0.1 0.1 0.5 0.4
TVS Srichakra Neutral 3,114 - 2,385 2,729 2,893 12.7 12.5 248.5 265.0 12.5 11.8 3.6 2.9 0.3 0.2 0.9 0.8
Visaka Industries Neutral 580 - 921 1,104 1,214 12.1 12.6 31.0 37.9 18.7 15.3 2.3 2.0 0.1 0.1 1.1 0.9
VIP Industries Buy 241 300 3,402 1,450 1,693 10.4 10.5 6.5 7.8 36.8 30.8 7.8 6.8 21.1 22.1 2.3 2.0
Navin Fluorine Accumulate 659 730 3,248 945 1,154 22.4 22.6 28.7 34.8 23.0 19.0 3.8 3.2 - - 3.0 2.3
Top Picks Report | October 2017
Diwali Special
Company Name Reco CMP
(`)
Target
Price (`)
Mkt Cap
(` cr)
Sales (`cr)
FY18E FY19E
OPM (%)
FY18E FY19E
EPS (`)
FY18E FY19E
PER (x)
FY18E FY19E
P/BV (x)
FY18E FY19E
RoE (%)
FY18E FY19E
EV/Sales (x)
FY18E FY19E
September 27, 2017
Note: CMP as of Sep. 27, 2017

Top Picks Report | October 2017
Diwali Special
23September 27, 2017

Top Picks Report | October 2017
Diwali Special
24September 27, 2017
Research Team Tel: 022 - 39357800 E-mail: [email protected] Website: www.angelbroking.com
DISCLAIMER
Angel Broking Private Limited (hereinafter referred to as “Angel”) is a registered Member of National Stock Exchange of India Limited,
Bombay Stock Exchange Limited and Metropolitan Stock Exchange Limited. It is also registered as a Depository Participant with CDSL
and Portfolio Manager and investment advisor with SEBI. It also has registration with AMFI as a Mutual Fund Distributor. Angel Broking
Private Limited is a registered entity with SEBI for Research Analyst in terms of SEBI (Research Analyst) Regulations, 2014 vide
registration number INH000000164. Angel or its associates has not been debarred/ suspended by SEBI or any other regulatory
authority for accessing /dealing in securities Market. Angel or its associates/analyst has not received any compensation / managed or
co-managed public offering of securities of the company covered by Analyst during the past twelve months.
This document is solely for the personal information of the recipient, and must not be singularly used as the basis of any investment
decision. Nothing in this document should be construed as investment or financial advice. Each recipient of this document should
make such investigations as they deem necessary to arrive at an independent evaluation of an investment in the securities of the
companies referred to in this document (including the merits and risks involved), and should consult their own advisors to determine
the merits and risks of such an investment.
Reports based on technical and derivative analysis center on studying charts of a stock's price movement, outstanding positions and
trading volume, as opposed to focusing on a company's fundamentals and, as such, may not match with a report on a company's
fundamentals. Investors are advised to refer the Fundamental and Technical Research Reports available on our website to evaluate
the contrary view, if any.
The information in this document has been printed on the basis of publicly available information, internal data and other reliable
sources believed to be true, but we do not represent that it is accurate or complete and it should not be relied on as such, as this
document is for general guidance only. Angel Broking Pvt. Limited or any of its affiliates/ group companies shall not be in any way
responsible for any loss or damage that may arise to any person from any inadvertent error in the information contained in this report.
Angel Broking Pvt. Limited has not independently verified all the information contained within this document. Accordingly, we cannot
testify, nor make any representation or warranty, express or implied, to the accuracy, contents or data contained within this
document. While Angel Broking Pvt. Limited endeavors to update on a reasonable basis the information discussed in this material,
there may be regulatory, compliance, or other reasons that prevent us from doing so.
This document is being supplied to you solely for your information, and its contents, information or data may not be reproduced,
redistributed or passed on, directly or indirectly. Neither Angel Broking Pvt. Limited, nor its directors, employees or affiliates shall be
liable for any loss or damage that may arise from or in connection with the use of this information.
Top Picks Report | October 2017
Diwali Special
Ratings (Based on expected returns
over 12 months investment period):But (<15%)
Accumulate (5% to 15%)
Reduce (-5% to 15%)
Neutral (-5% to 5%)
Sell (<-15%)
6th Floor, Ackruti Star, Central Road, MIDC, Andheri(E), Mumbai - 400 093. Tel: (022) 39357800
Research Team
Fundamental:
Vaibhav Agarwal
Sarabjit Kour Nangra
Amarjeet Maurya
Jaikishan Parmar
Shrikant Akolkar
Siddharth Purohit
Noel Vaz
Head of Research & ARQ
VP - Research (Pharmaceutical, IT)
Analyst (FMCG, Media, Mid - Cap)
Analyst (Midcap)
Analyst (Automobile)
Analyst (Banking & Cement)
Analyst (Mid - Cap)
Technical and Derivatives:
Sameet Chavan
Ruchit Jain
Rajesh Bhosle
Sneha Seth
Chief Technical & Derivatives Analyst
Technical Analyst
Technical Analyst
Derivatives Analyst
Angel Broking Private Limited, Register Office: G-1, Ackruti Trade Centre, Road No. 7, MIDC, Andheri (E), Mumbai - 400 093. Tel: (022)
3083 7700. Fax: (022) 2835 8811, website: wwww.angelbroking.com, CIN: U67120MH1996PTC101709, BSE Cash/F&Q: INB010996539
/INF0109965539, NSE Cash/F&Q: INB231279838/INF231279838/ INE231279838, MSEI: INE261279838, CDSL Regd. No.: IN - DP - CDSL
- 234 - 2004, PMS Regd. Code: PM/IN000001546, Compliance Officer: Mr. Anoop Goyal, Tel: (022) 39413940, Email:
[email protected] Angel Commodities Broking Private Ltd.: CIN: U67120MH1996PT100872, Compliance Officer: Mr.
Nirav Shah, MCX CODE NO: 12685, NCDEX CODE NO: 00220, SEBI Registration No: INZ000042935