district accountability system - …internet.savannah.chatham.k12.ga.us/dasremi/shared... · •...
TRANSCRIPT

DISTRICT ACCOUNTABILITY SYSTEM - REPORTING, EVALUATING, & MONITORING INSTRUMENT
EXECUTIVE SUMMARY REPORT
1
Goal 1 Key Performance Outcome
College and Career Ready Performance Index (CCRPI) SY 2016-17
As documented in the District Accountability System’s Reporting, Evaluating, & Monitoring Instrument (DAS-REMI), a Key Performance Outcome for Goal I is to increase the district’s CCRPI score. The CCRPI is a comprehensive school improvement and communication platform that serves as the overarching measure of school, district, and state performance for federal and state accountability purposes. The CCRPI includes multiple categories and indicators within the core components of Academic Achievement, Student Progress, and Achievement Gap, as well as opportunities to earn Challenge Points through student Subgroup Performance and attainment of specialized Exceeding the Bar indicator targets. Scores are reported for each of the K-5, 6-8, and 9-12 grade level bands, in addition to a single overall score. In SY 2014-15 the CCRPI was revised significantly from prior years, and additional adjustments to the calculation have been implemented in each subsequent year. Changes from SY 2015-16 to SY 2016-17 include the following:
• The former high school indicator measuring students completing work-based learning or a career-related Capstone project was moved from the Exceeding the Bar Challenge Points section to the Post-Readiness section of the Achievement component
• The elementary school indicator measuring 5th grade students with a complete career portfolio was moved from the Exceeding the Bar Challenge Points section to the Post-Readiness section of the Achievement component
• The high school Achievement Post-Readiness indicator that includes SAT performance was updated to align with the College Board’s College and Career Readiness benchmarks for the redesigned SAT
• The elementary and middle school Achievement Content Mastery indicators for science and social studies received a reduced weighting relative to ELA and math, in order to align with the number of tests given due to the elimination of science and social studies End of Grade tests in grades 3, 4, 6, and 7
• Science and Social Studies were eliminated from the Progress and Achievement Gap components for elementary, middle, and high schools
• The elementary, middle, and high school Exceeding the Bar Challenge Points indicator for STEM certification was updated to include STEAM certification
• Indicator wording was updated to provide additional clarity for three high school Achievement indicators, one middle school Achievement indicator, and one elementary school Achievement indicator
SY 2016-17 will mark the final year of data under the existing CCRPI formula, as a new calculation aligned to the requirements of the Every Student Succeeds Act (ESSA) will take effect in SY 2017-18. The DAS-REMI was adjusted to establish a new baseline and target based on the redesigned CCRPI. Under the district’s Georgia Flexibility Options SWSS/IE2 performance contract, each school is expected to annually improve the CCRPI score by at least 3% of the difference between the SY 2015-16 score and 100. Challenge Points are not counted within the performance contract score calculations, therefore, a Core Score that excludes challenge points is reported for each school and grade-level band. Highlighting is applied to the Core Score’s one-year change column to signify whether the annual improvement target was met.
DISTRICT ACCOUNTABILITY SYSTEM - REPORTING, EVALUATING, & MONITORING INSTRUMENT
EXECUTIVE SUMMARY REPORT
2
Key Points:
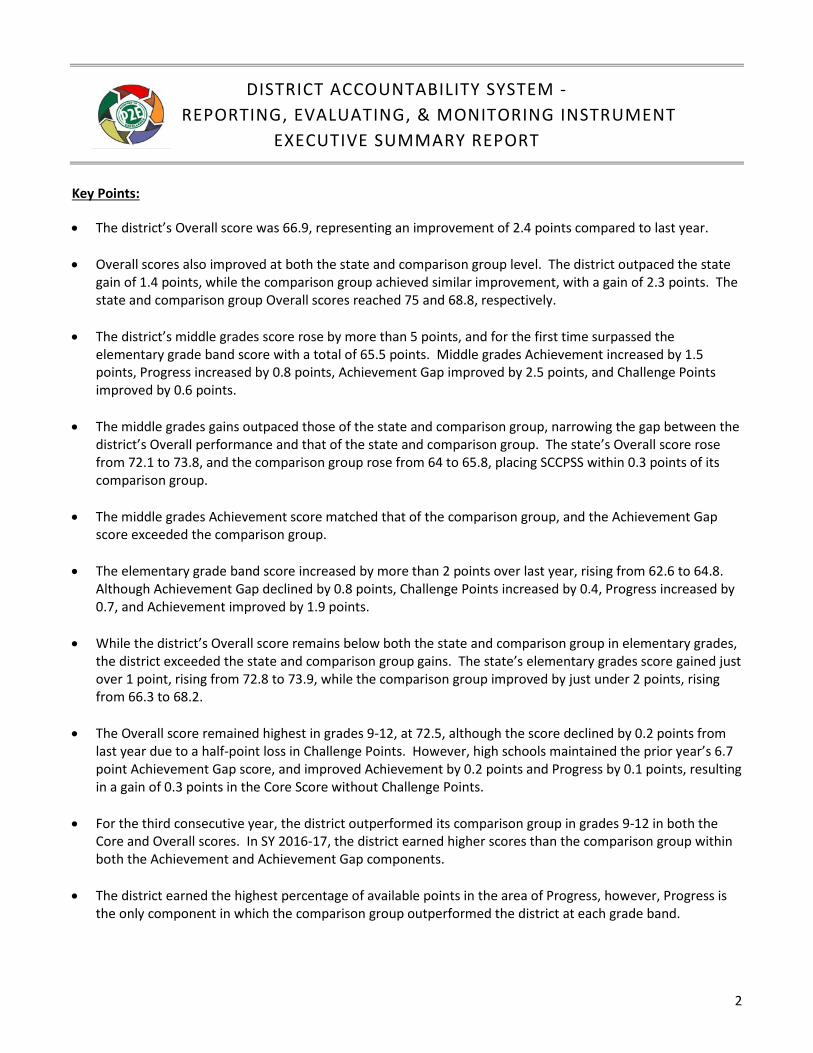
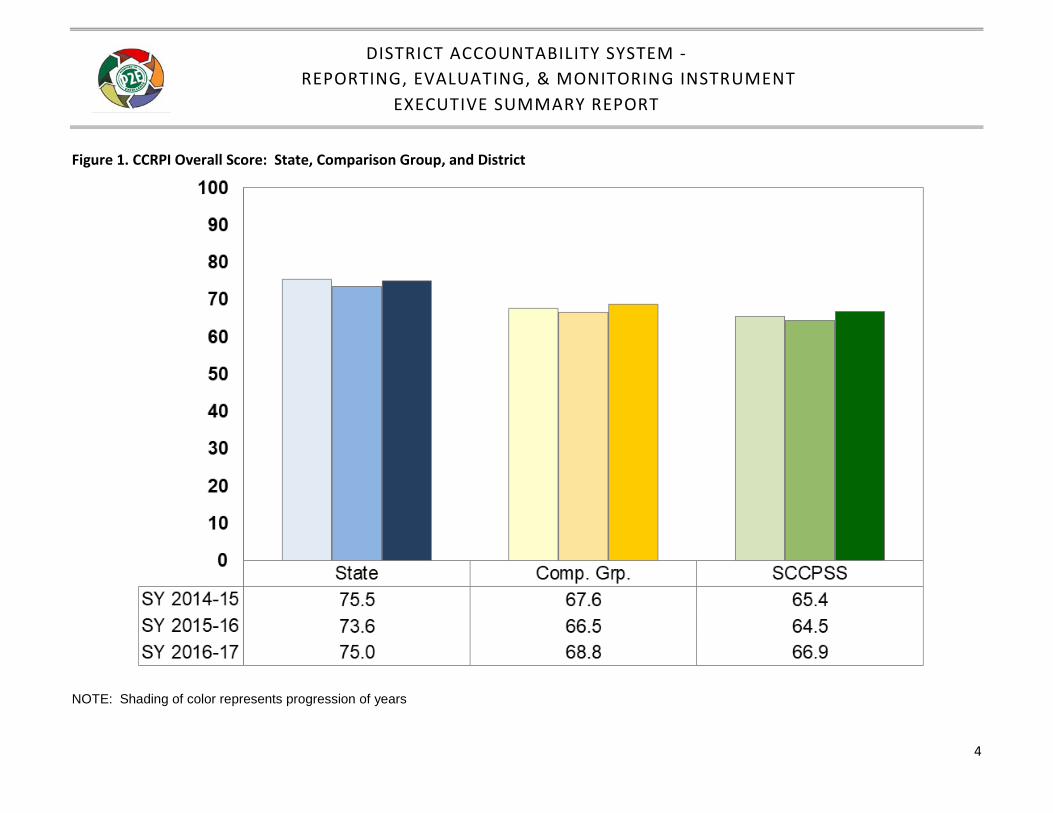
• The district’s Overall score was 66.9, representing an improvement of 2.4 points compared to last year.
• Overall scores also improved at both the state and comparison group level. The district outpaced the state gain of 1.4 points, while the comparison group achieved similar improvement, with a gain of 2.3 points. The state and comparison group Overall scores reached 75 and 68.8, respectively.
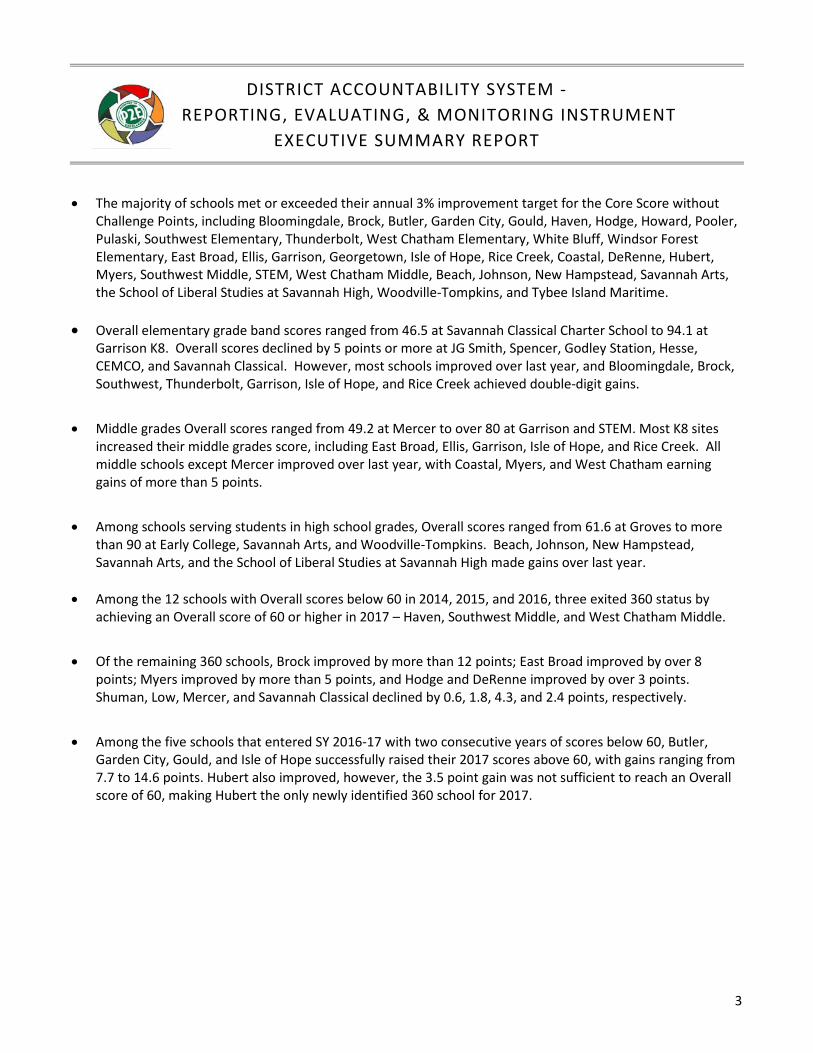
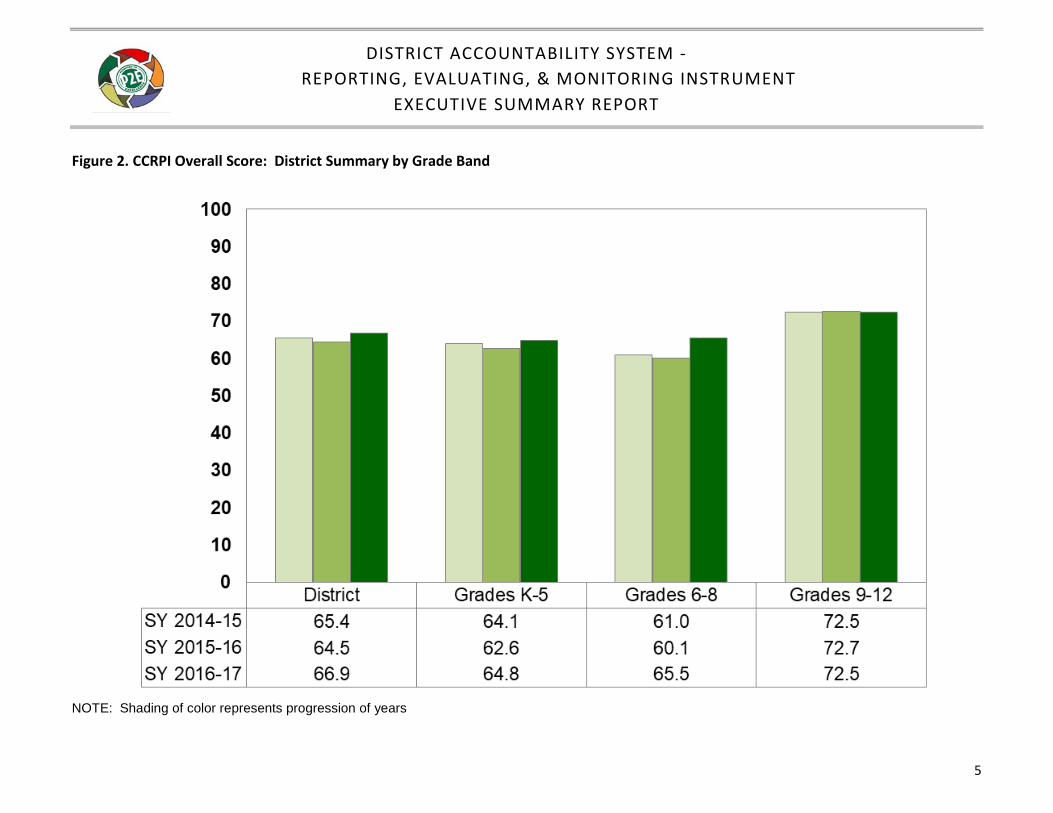
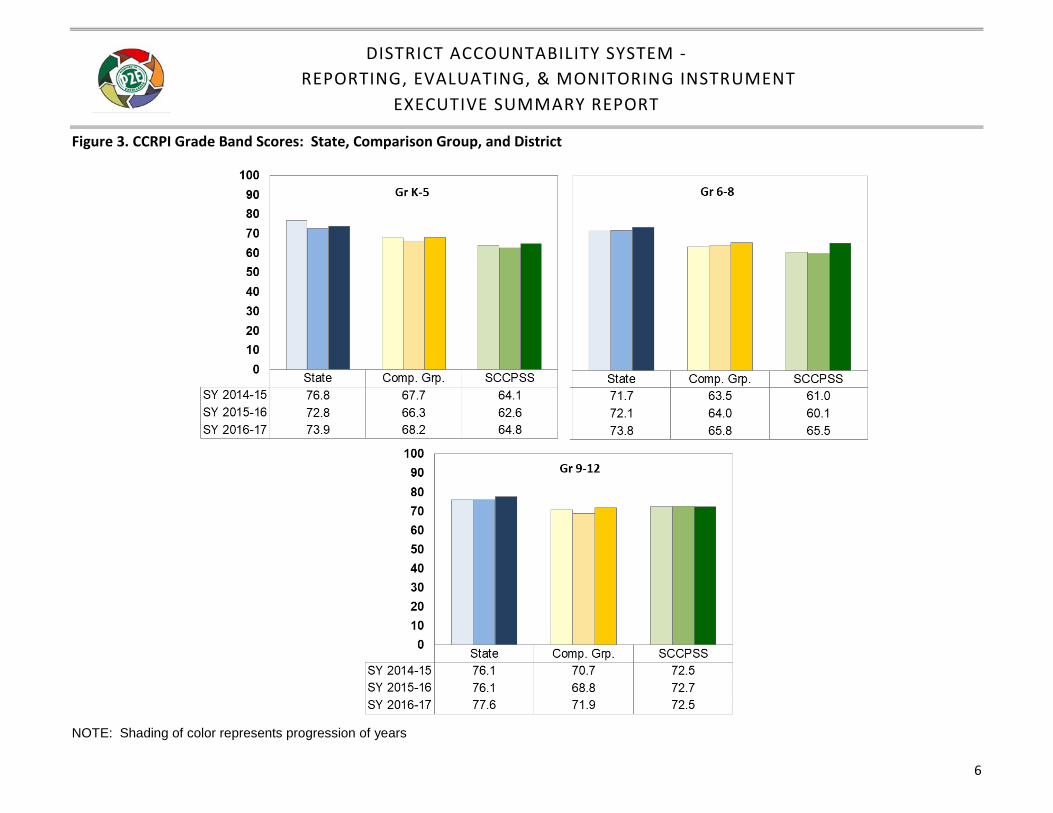
• The district’s middle grades score rose by more than 5 points, and for the first time surpassed the elementary grade band score with a total of 65.5 points. Middle grades Achievement increased by 1.5 points, Progress increased by 0.8 points, Achievement Gap improved by 2.5 points, and Challenge Points improved by 0.6 points.
• The middle grades gains outpaced those of the state and comparison group, narrowing the gap between the
district’s Overall performance and that of the state and comparison group. The state’s Overall score rose from 72.1 to 73.8, and the comparison group rose from 64 to 65.8, placing SCCPSS within 0.3 points of its comparison group.
• The middle grades Achievement score matched that of the comparison group, and the Achievement Gap
score exceeded the comparison group.
• The elementary grade band score increased by more than 2 points over last year, rising from 62.6 to 64.8. Although Achievement Gap declined by 0.8 points, Challenge Points increased by 0.4, Progress increased by 0.7, and Achievement improved by 1.9 points.
• While the district’s Overall score remains below both the state and comparison group in elementary grades,
the district exceeded the state and comparison group gains. The state’s elementary grades score gained just over 1 point, rising from 72.8 to 73.9, while the comparison group improved by just under 2 points, rising from 66.3 to 68.2.
• The Overall score remained highest in grades 9-12, at 72.5, although the score declined by 0.2 points from
last year due to a half-point loss in Challenge Points. However, high schools maintained the prior year’s 6.7 point Achievement Gap score, and improved Achievement by 0.2 points and Progress by 0.1 points, resulting in a gain of 0.3 points in the Core Score without Challenge Points.
• For the third consecutive year, the district outperformed its comparison group in grades 9-12 in both the
Core and Overall scores. In SY 2016-17, the district earned higher scores than the comparison group within both the Achievement and Achievement Gap components.
• The district earned the highest percentage of available points in the area of Progress, however, Progress is
the only component in which the comparison group outperformed the district at each grade band.
DISTRICT ACCOUNTABILITY SYSTEM - REPORTING, EVALUATING, & MONITORING INSTRUMENT
EXECUTIVE SUMMARY REPORT
3
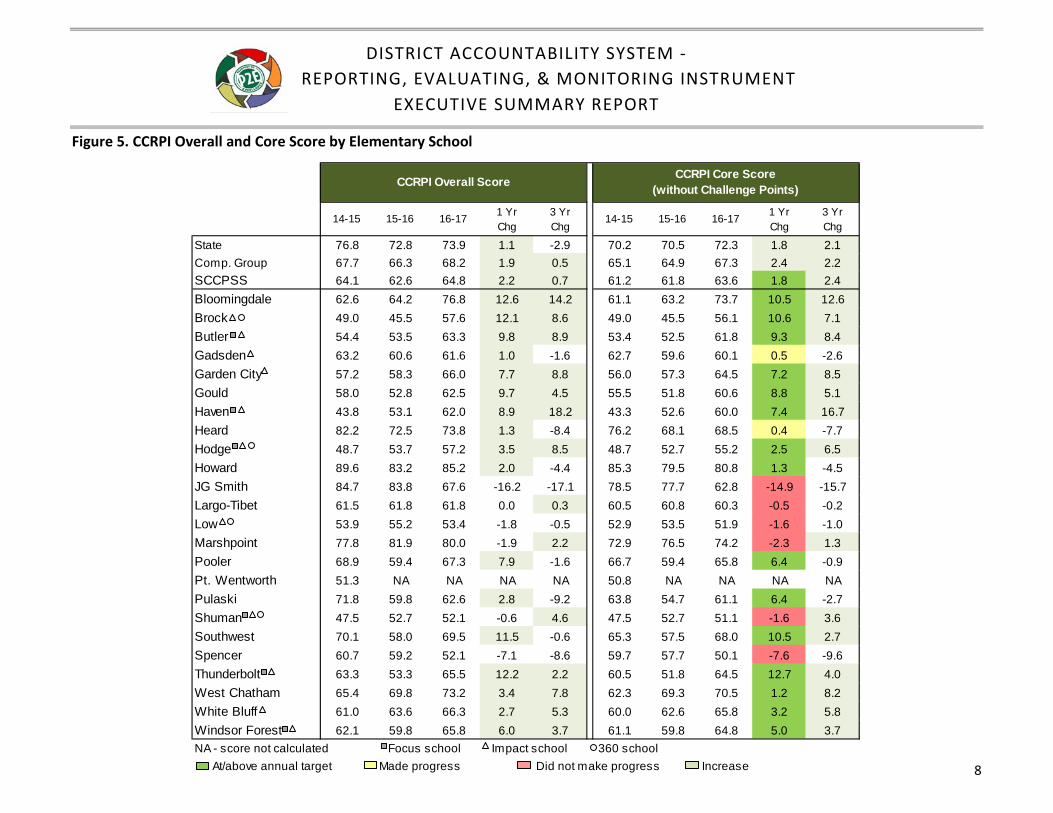
• The majority of schools met or exceeded their annual 3% improvement target for the Core Score without
Challenge Points, including Bloomingdale, Brock, Butler, Garden City, Gould, Haven, Hodge, Howard, Pooler, Pulaski, Southwest Elementary, Thunderbolt, West Chatham Elementary, White Bluff, Windsor Forest Elementary, East Broad, Ellis, Garrison, Georgetown, Isle of Hope, Rice Creek, Coastal, DeRenne, Hubert, Myers, Southwest Middle, STEM, West Chatham Middle, Beach, Johnson, New Hampstead, Savannah Arts, the School of Liberal Studies at Savannah High, Woodville-Tompkins, and Tybee Island Maritime.
• Overall elementary grade band scores ranged from 46.5 at Savannah Classical Charter School to 94.1 at
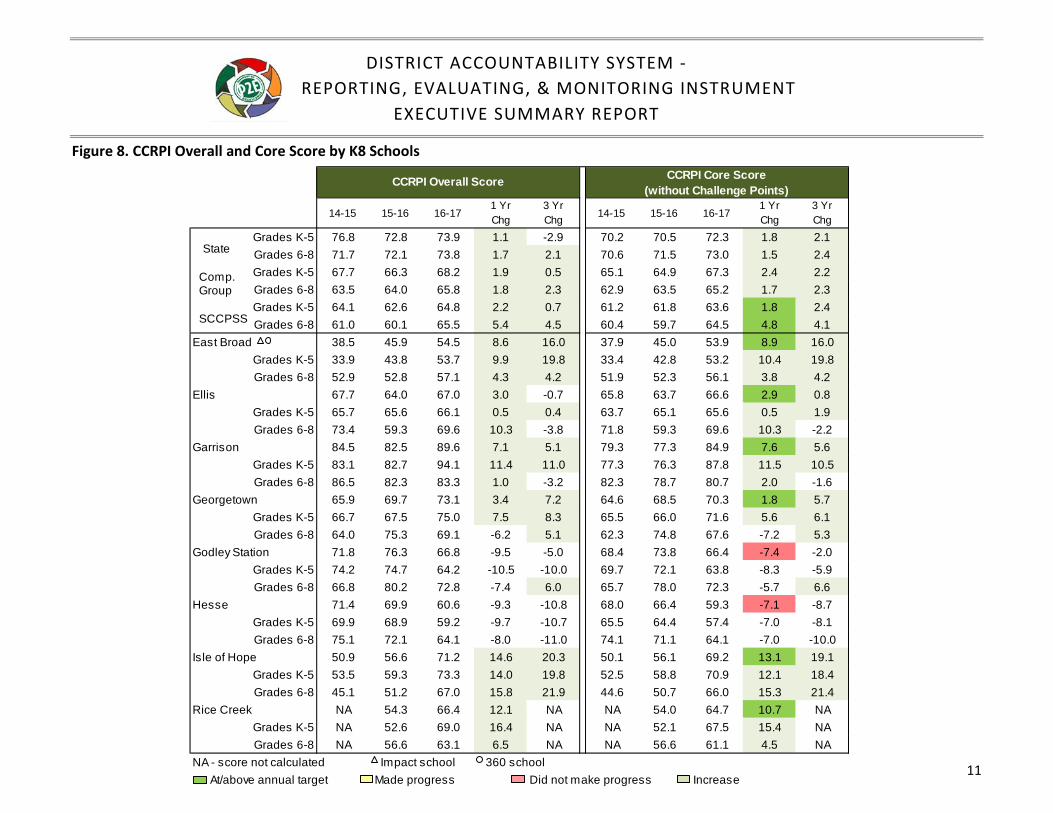
Garrison K8. Overall scores declined by 5 points or more at JG Smith, Spencer, Godley Station, Hesse, CEMCO, and Savannah Classical. However, most schools improved over last year, and Bloomingdale, Brock, Southwest, Thunderbolt, Garrison, Isle of Hope, and Rice Creek achieved double-digit gains.
• Middle grades Overall scores ranged from 49.2 at Mercer to over 80 at Garrison and STEM. Most K8 sites
increased their middle grades score, including East Broad, Ellis, Garrison, Isle of Hope, and Rice Creek. All middle schools except Mercer improved over last year, with Coastal, Myers, and West Chatham earning gains of more than 5 points.
• Among schools serving students in high school grades, Overall scores ranged from 61.6 at Groves to more
than 90 at Early College, Savannah Arts, and Woodville-Tompkins. Beach, Johnson, New Hampstead, Savannah Arts, and the School of Liberal Studies at Savannah High made gains over last year.
• Among the 12 schools with Overall scores below 60 in 2014, 2015, and 2016, three exited 360 status by
achieving an Overall score of 60 or higher in 2017 – Haven, Southwest Middle, and West Chatham Middle.
• Of the remaining 360 schools, Brock improved by more than 12 points; East Broad improved by over 8
points; Myers improved by more than 5 points, and Hodge and DeRenne improved by over 3 points. Shuman, Low, Mercer, and Savannah Classical declined by 0.6, 1.8, 4.3, and 2.4 points, respectively.
• Among the five schools that entered SY 2016-17 with two consecutive years of scores below 60, Butler,
Garden City, Gould, and Isle of Hope successfully raised their 2017 scores above 60, with gains ranging from 7.7 to 14.6 points. Hubert also improved, however, the 3.5 point gain was not sufficient to reach an Overall score of 60, making Hubert the only newly identified 360 school for 2017.
DISTRICT ACCOUNTABILITY SYSTEM - REPORTING, EVALUATING, & MONITORING INSTRUMENT
EXECUTIVE SUMMARY REPORT
4
Figure 1. CCRPI Overall Score: State, Comparison Group, and District NOTE: Shading of color represents progression of years
DISTRICT ACCOUNTABILITY SYSTEM - REPORTING, EVALUATING, & MONITORING INSTRUMENT
EXECUTIVE SUMMARY REPORT
5
Figure 2. CCRPI Overall Score: District Summary by Grade Band
Note: Shading of color represents the progression of years
NOTE: Shading of color represents progression of years
DISTRICT ACCOUNTABILITY SYSTEM - REPORTING, EVALUATING, & MONITORING INSTRUMENT
EXECUTIVE SUMMARY REPORT
6
Figure 3. CCRPI Grade Band Scores: State, Comparison Group, and District NOTE: Shading of color represents progression of years
DISTRICT ACCOUNTABILITY SYSTEM - REPORTING, EVALUATING, & MONITORING INSTRUMENT
EXECUTIVE SUMMARY REPORT
7
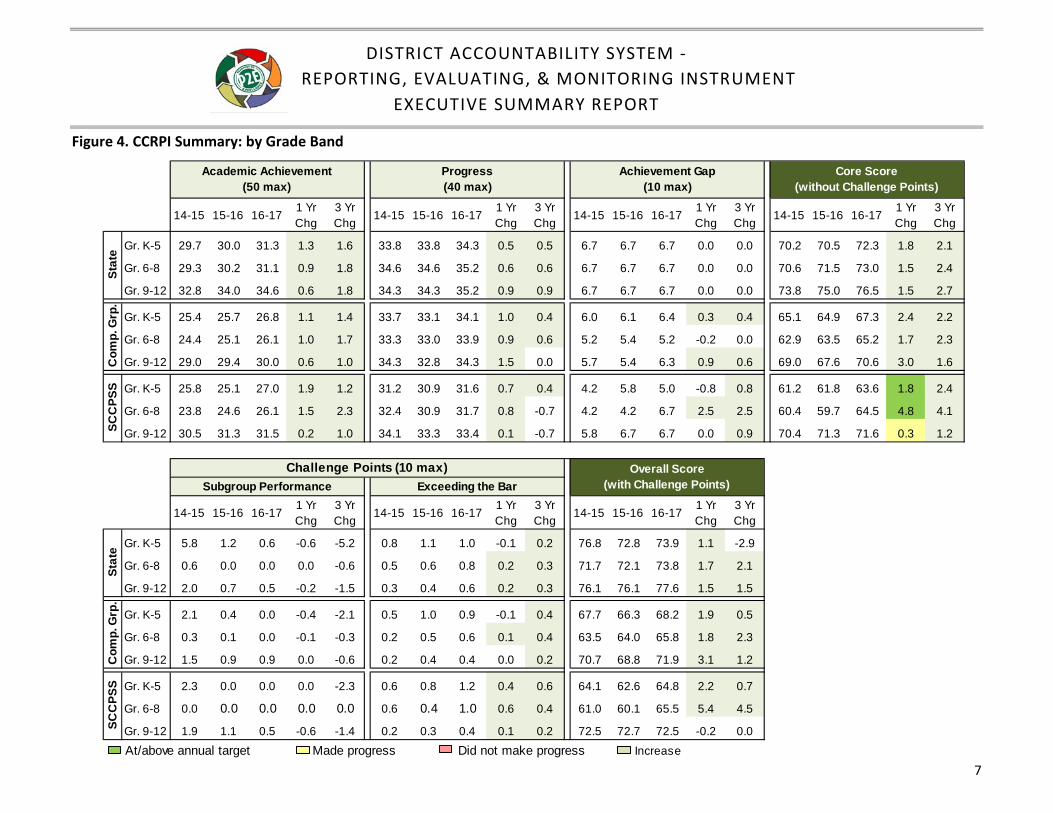
Figure 4. CCRPI Summary: by Grade Band
14-15 15-16 16-17 1 Yr Chg
3 Yr Chg 14-15 15-16 16-17 1 Yr
Chg3 Yr Chg 14-15 15-16 16-17 1 Yr
Chg3 Yr Chg 14-15 15-16 16-17 1 Yr
Chg3 Yr Chg
Gr. K-5 29.7 30.0 31.3 1.3 1.6 33.8 33.8 34.3 0.5 0.5 6.7 6.7 6.7 0.0 0.0 70.2 70.5 72.3 1.8 2.1
Gr. 6-8 29.3 30.2 31.1 0.9 1.8 34.6 34.6 35.2 0.6 0.6 6.7 6.7 6.7 0.0 0.0 70.6 71.5 73.0 1.5 2.4
Gr. 9-12 32.8 34.0 34.6 0.6 1.8 34.3 34.3 35.2 0.9 0.9 6.7 6.7 6.7 0.0 0.0 73.8 75.0 76.5 1.5 2.7
Gr. K-5 25.4 25.7 26.8 1.1 1.4 33.7 33.1 34.1 1.0 0.4 6.0 6.1 6.4 0.3 0.4 65.1 64.9 67.3 2.4 2.2
Gr. 6-8 24.4 25.1 26.1 1.0 1.7 33.3 33.0 33.9 0.9 0.6 5.2 5.4 5.2 -0.2 0.0 62.9 63.5 65.2 1.7 2.3
Gr. 9-12 29.0 29.4 30.0 0.6 1.0 34.3 32.8 34.3 1.5 0.0 5.7 5.4 6.3 0.9 0.6 69.0 67.6 70.6 3.0 1.6
Gr. K-5 25.8 25.1 27.0 1.9 1.2 31.2 30.9 31.6 0.7 0.4 4.2 5.8 5.0 -0.8 0.8 61.2 61.8 63.6 1.8 2.4
Gr. 6-8 23.8 24.6 26.1 1.5 2.3 32.4 30.9 31.7 0.8 -0.7 4.2 4.2 6.7 2.5 2.5 60.4 59.7 64.5 4.8 4.1
Gr. 9-12 30.5 31.3 31.5 0.2 1.0 34.1 33.3 33.4 0.1 -0.7 5.8 6.7 6.7 0.0 0.9 70.4 71.3 71.6 0.3 1.2
14-15 15-16 16-17 1 Yr Chg
3 Yr Chg 14-15 15-16 16-17 1 Yr
Chg3 Yr Chg 14-15 15-16 16-17 1 Yr
Chg3 Yr Chg
Gr. K-5 5.8 1.2 0.6 -0.6 -5.2 0.8 1.1 1.0 -0.1 0.2 76.8 72.8 73.9 1.1 -2.9
Gr. 6-8 0.6 0.0 0.0 0.0 -0.6 0.5 0.6 0.8 0.2 0.3 71.7 72.1 73.8 1.7 2.1
Gr. 9-12 2.0 0.7 0.5 -0.2 -1.5 0.3 0.4 0.6 0.2 0.3 76.1 76.1 77.6 1.5 1.5
Gr. K-5 2.1 0.4 0.0 -0.4 -2.1 0.5 1.0 0.9 -0.1 0.4 67.7 66.3 68.2 1.9 0.5
Gr. 6-8 0.3 0.1 0.0 -0.1 -0.3 0.2 0.5 0.6 0.1 0.4 63.5 64.0 65.8 1.8 2.3
Gr. 9-12 1.5 0.9 0.9 0.0 -0.6 0.2 0.4 0.4 0.0 0.2 70.7 68.8 71.9 3.1 1.2
Gr. K-5 2.3 0.0 0.0 0.0 -2.3 0.6 0.8 1.2 0.4 0.6 64.1 62.6 64.8 2.2 0.7
Gr. 6-8 0.0 0.0 0.0 0.0 0.0 0.6 0.4 1.0 0.6 0.4 61.0 60.1 65.5 5.4 4.5
Gr. 9-12 1.9 1.1 0.5 -0.6 -1.4 0.2 0.3 0.4 0.1 0.2 72.5 72.7 72.5 -0.2 0.0 At/above annual target Made progress Did not make progress Increase
Overall Score (with Challenge Points)
Academic Achievement (50 max)
Core Score (without Challenge Points)
Stat
eC
omp.
Grp
.SC
CPS
SSC
CPS
S
Progress (40 max)
Achievement Gap(10 max)
Stat
eC
omp.
Grp
.
Challenge Points (10 max)Subgroup Performance Exceeding the Bar
DISTRICT ACCOUNTABILITY SYSTEM - REPORTING, EVALUATING, & MONITORING INSTRUMENT
EXECUTIVE SUMMARY REPORT
8
Figure 5. CCRPI Overall and Core Score by Elementary School
14-15 15-16 16-17 1 Yr Chg
3 Yr Chg
14-15 15-16 16-17 1 Yr Chg
3 Yr Chg
State 76.8 72.8 73.9 1.1 -2.9 70.2 70.5 72.3 1.8 2.1Comp. Group 67.7 66.3 68.2 1.9 0.5 65.1 64.9 67.3 2.4 2.2SCCPSS 64.1 62.6 64.8 2.2 0.7 61.2 61.8 63.6 1.8 2.4Bloomingdale 62.6 64.2 76.8 12.6 14.2 61.1 63.2 73.7 10.5 12.6Brock 49.0 45.5 57.6 12.1 8.6 49.0 45.5 56.1 10.6 7.1Butler 54.4 53.5 63.3 9.8 8.9 53.4 52.5 61.8 9.3 8.4Gadsden 63.2 60.6 61.6 1.0 -1.6 62.7 59.6 60.1 0.5 -2.6Garden City 57.2 58.3 66.0 7.7 8.8 56.0 57.3 64.5 7.2 8.5Gould 58.0 52.8 62.5 9.7 4.5 55.5 51.8 60.6 8.8 5.1Haven 43.8 53.1 62.0 8.9 18.2 43.3 52.6 60.0 7.4 16.7Heard 82.2 72.5 73.8 1.3 -8.4 76.2 68.1 68.5 0.4 -7.7Hodge 48.7 53.7 57.2 3.5 8.5 48.7 52.7 55.2 2.5 6.5Howard 89.6 83.2 85.2 2.0 -4.4 85.3 79.5 80.8 1.3 -4.5JG Smith 84.7 83.8 67.6 -16.2 -17.1 78.5 77.7 62.8 -14.9 -15.7Largo-Tibet 61.5 61.8 61.8 0.0 0.3 60.5 60.8 60.3 -0.5 -0.2Low 53.9 55.2 53.4 -1.8 -0.5 52.9 53.5 51.9 -1.6 -1.0Marshpoint 77.8 81.9 80.0 -1.9 2.2 72.9 76.5 74.2 -2.3 1.3Pooler 68.9 59.4 67.3 7.9 -1.6 66.7 59.4 65.8 6.4 -0.9Pt. Wentworth 51.3 NA NA NA NA 50.8 NA NA NA NAPulaski 71.8 59.8 62.6 2.8 -9.2 63.8 54.7 61.1 6.4 -2.7Shuman 47.5 52.7 52.1 -0.6 4.6 47.5 52.7 51.1 -1.6 3.6Southwest 70.1 58.0 69.5 11.5 -0.6 65.3 57.5 68.0 10.5 2.7Spencer 60.7 59.2 52.1 -7.1 -8.6 59.7 57.7 50.1 -7.6 -9.6Thunderbolt 63.3 53.3 65.5 12.2 2.2 60.5 51.8 64.5 12.7 4.0West Chatham 65.4 69.8 73.2 3.4 7.8 62.3 69.3 70.5 1.2 8.2White Bluff 61.0 63.6 66.3 2.7 5.3 60.0 62.6 65.8 3.2 5.8Windsor Forest 62.1 59.8 65.8 6.0 3.7 61.1 59.8 64.8 5.0 3.7NA - score not calculated Focus school Impact school 360 school At/above annual target Made progress Did not make progress Increase
CCRPI Overall Score CCRPI Core Score (without Challenge Points)
DISTRICT ACCOUNTABILITY SYSTEM - REPORTING, EVALUATING, & MONITORING INSTRUMENT
EXECUTIVE SUMMARY REPORT
9
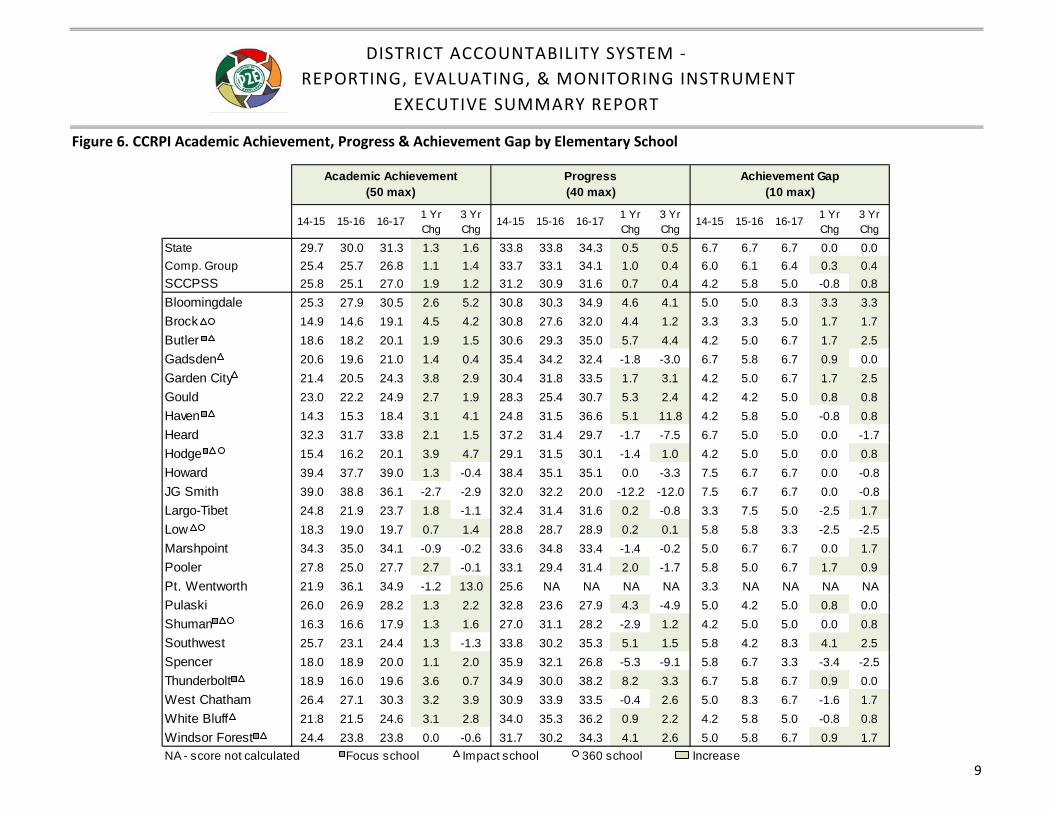
Figure 6. CCRPI Academic Achievement, Progress & Achievement Gap by Elementary School
14-15 15-16 16-17 1 Yr
Chg3 Yr Chg
14-15 15-16 16-17 1 Yr Chg
3 Yr Chg
14-15 15-16 16-17 1 Yr Chg
3 Yr Chg
State 29.7 30.0 31.3 1.3 1.6 33.8 33.8 34.3 0.5 0.5 6.7 6.7 6.7 0.0 0.0Comp. Group 25.4 25.7 26.8 1.1 1.4 33.7 33.1 34.1 1.0 0.4 6.0 6.1 6.4 0.3 0.4SCCPSS 25.8 25.1 27.0 1.9 1.2 31.2 30.9 31.6 0.7 0.4 4.2 5.8 5.0 -0.8 0.8Bloomingdale 25.3 27.9 30.5 2.6 5.2 30.8 30.3 34.9 4.6 4.1 5.0 5.0 8.3 3.3 3.3Brock 14.9 14.6 19.1 4.5 4.2 30.8 27.6 32.0 4.4 1.2 3.3 3.3 5.0 1.7 1.7Butler 18.6 18.2 20.1 1.9 1.5 30.6 29.3 35.0 5.7 4.4 4.2 5.0 6.7 1.7 2.5Gadsden 20.6 19.6 21.0 1.4 0.4 35.4 34.2 32.4 -1.8 -3.0 6.7 5.8 6.7 0.9 0.0Garden City 21.4 20.5 24.3 3.8 2.9 30.4 31.8 33.5 1.7 3.1 4.2 5.0 6.7 1.7 2.5Gould 23.0 22.2 24.9 2.7 1.9 28.3 25.4 30.7 5.3 2.4 4.2 4.2 5.0 0.8 0.8Haven 14.3 15.3 18.4 3.1 4.1 24.8 31.5 36.6 5.1 11.8 4.2 5.8 5.0 -0.8 0.8Heard 32.3 31.7 33.8 2.1 1.5 37.2 31.4 29.7 -1.7 -7.5 6.7 5.0 5.0 0.0 -1.7Hodge 15.4 16.2 20.1 3.9 4.7 29.1 31.5 30.1 -1.4 1.0 4.2 5.0 5.0 0.0 0.8Howard 39.4 37.7 39.0 1.3 -0.4 38.4 35.1 35.1 0.0 -3.3 7.5 6.7 6.7 0.0 -0.8JG Smith 39.0 38.8 36.1 -2.7 -2.9 32.0 32.2 20.0 -12.2 -12.0 7.5 6.7 6.7 0.0 -0.8Largo-Tibet 24.8 21.9 23.7 1.8 -1.1 32.4 31.4 31.6 0.2 -0.8 3.3 7.5 5.0 -2.5 1.7Low 18.3 19.0 19.7 0.7 1.4 28.8 28.7 28.9 0.2 0.1 5.8 5.8 3.3 -2.5 -2.5Marshpoint 34.3 35.0 34.1 -0.9 -0.2 33.6 34.8 33.4 -1.4 -0.2 5.0 6.7 6.7 0.0 1.7Pooler 27.8 25.0 27.7 2.7 -0.1 33.1 29.4 31.4 2.0 -1.7 5.8 5.0 6.7 1.7 0.9Pt. Wentworth 21.9 36.1 34.9 -1.2 13.0 25.6 NA NA NA NA 3.3 NA NA NA NAPulaski 26.0 26.9 28.2 1.3 2.2 32.8 23.6 27.9 4.3 -4.9 5.0 4.2 5.0 0.8 0.0Shuman 16.3 16.6 17.9 1.3 1.6 27.0 31.1 28.2 -2.9 1.2 4.2 5.0 5.0 0.0 0.8Southwest 25.7 23.1 24.4 1.3 -1.3 33.8 30.2 35.3 5.1 1.5 5.8 4.2 8.3 4.1 2.5Spencer 18.0 18.9 20.0 1.1 2.0 35.9 32.1 26.8 -5.3 -9.1 5.8 6.7 3.3 -3.4 -2.5Thunderbolt 18.9 16.0 19.6 3.6 0.7 34.9 30.0 38.2 8.2 3.3 6.7 5.8 6.7 0.9 0.0West Chatham 26.4 27.1 30.3 3.2 3.9 30.9 33.9 33.5 -0.4 2.6 5.0 8.3 6.7 -1.6 1.7White Bluff 21.8 21.5 24.6 3.1 2.8 34.0 35.3 36.2 0.9 2.2 4.2 5.8 5.0 -0.8 0.8Windsor Forest 24.4 23.8 23.8 0.0 -0.6 31.7 30.2 34.3 4.1 2.6 5.0 5.8 6.7 0.9 1.7NA - score not calculated Focus school Impact school 360 school Increase
Academic Achievement (50 max)
Progress (40 max)
Achievement Gap(10 max)

DISTRICT ACCOUNTABILITY SYSTEM - REPORTING, EVALUATING, & MONITORING INSTRUMENT
EXECUTIVE SUMMARY REPORT
10
Figure 7. CCRPI Challenge Points by Elementary School
14-15 15-16 16-171 Yr Chg
3 Yr Chg 14-15 15-16 16-17
1 Yr Chg
3 Yr Chg
State 5.8 1.2 0.6 -0.6 -5.2 0.8 1.1 1.0 -0.1 0.2Comp. Group 2.1 0.4 0.0 -0.4 -2.1 0.5 1.0 0.9 -0.1 0.4SCCPSS 2.3 0.0 0.0 0.0 -2.3 0.6 0.8 1.2 0.4 0.6Bloomingdale 0.0 0.0 1.1 1.1 1.1 1.5 1.0 2.0 1.0 0.5Brock 0.0 0.0 0.0 0.0 0.0 0.0 0.0 1.5 1.5 1.5Butler 0.0 0.0 0.0 0.0 0.0 1.0 1.0 1.5 0.5 0.5Gadsden 0.0 0.0 0.0 0.0 0.0 0.5 1.0 1.5 0.5 1.0Garden City 0.7 0.0 0.0 0.0 -0.7 0.5 1.0 1.5 0.5 1.0Gould 2.0 0.0 0.9 0.9 -1.1 0.5 1.0 1.0 0.0 0.5Haven 0.0 0.0 0.0 0.0 0.0 0.5 0.5 2.0 1.5 1.5Heard 6.0 3.9 4.3 0.4 -1.7 0.0 0.5 1.0 0.5 1.0Hodge 0.0 0.0 0.0 0.0 0.0 0.0 1.0 2.0 1.0 2.0Howard 3.8 3.2 2.9 -0.3 -0.9 0.5 0.5 1.5 1.0 1.0JG Smith 5.2 5.1 3.3 -1.8 -1.9 1.0 1.0 1.5 0.5 0.5Largo-Tibet 0.0 0.0 0.0 0.0 0.0 1.0 1.0 1.5 0.5 0.5Low 0.0 1.2 0.0 -1.2 0.0 1.0 0.5 1.5 1.0 0.5Marshpoint 3.9 4.4 4.3 -0.1 0.4 1.0 1.0 1.5 0.5 0.5Pooler 1.7 0.0 0.0 0.0 -1.7 0.5 0.0 1.5 1.5 1.0Pt. Wentworth 0.0 NA NA NA NA 0.5 1.0 1.0 0.0 0.5Pulaski 7.5 4.1 0.0 -4.1 -7.5 0.5 1.0 1.5 0.5 1.0Shuman 0.0 0.0 0.0 0.0 0.0 0.0 0.0 1.0 1.0 1.0Southwest 3.3 0.0 0.0 0.0 -3.3 1.5 0.5 1.5 1.0 0.0Spencer 0.0 0.0 0.0 0.0 0.0 1.0 1.5 2.0 0.5 1.0Thunderbolt 2.3 0.0 0.0 0.0 -2.3 0.5 1.5 1.0 -0.5 0.5West Chatham 2.1 0.0 1.7 1.7 -0.4 1.0 0.5 1.0 0.5 0.0White Bluff 0.0 0.0 0.0 0.0 0.0 1.0 1.0 0.5 -0.5 -0.5Windsor Forest 0.0 0.0 0.0 0.0 0.0 1.0 0.0 1.0 1.0 0.0NA - score not calculated Focus school Impact school 360 school Increase
Subgroup Performance Exceeding the BarChallenge Points (10 max)
DISTRICT ACCOUNTABILITY SYSTEM - REPORTING, EVALUATING, & MONITORING INSTRUMENT
EXECUTIVE SUMMARY REPORT
11
Figure 8. CCRPI Overall and Core Score by K8 Schools
14-15 15-16 16-171 Yr Chg
3 Yr Chg 14-15 15-16 16-17
1 Yr Chg
3 Yr Chg
Grades K-5 76.8 72.8 73.9 1.1 -2.9 70.2 70.5 72.3 1.8 2.1Grades 6-8 71.7 72.1 73.8 1.7 2.1 70.6 71.5 73.0 1.5 2.4Grades K-5 67.7 66.3 68.2 1.9 0.5 65.1 64.9 67.3 2.4 2.2Grades 6-8 63.5 64.0 65.8 1.8 2.3 62.9 63.5 65.2 1.7 2.3Grades K-5 64.1 62.6 64.8 2.2 0.7 61.2 61.8 63.6 1.8 2.4Grades 6-8 61.0 60.1 65.5 5.4 4.5 60.4 59.7 64.5 4.8 4.1
East Broad 38.5 45.9 54.5 8.6 16.0 37.9 45.0 53.9 8.9 16.0Grades K-5 33.9 43.8 53.7 9.9 19.8 33.4 42.8 53.2 10.4 19.8Grades 6-8 52.9 52.8 57.1 4.3 4.2 51.9 52.3 56.1 3.8 4.2
Ellis 67.7 64.0 67.0 3.0 -0.7 65.8 63.7 66.6 2.9 0.8Grades K-5 65.7 65.6 66.1 0.5 0.4 63.7 65.1 65.6 0.5 1.9Grades 6-8 73.4 59.3 69.6 10.3 -3.8 71.8 59.3 69.6 10.3 -2.2
Garrison 84.5 82.5 89.6 7.1 5.1 79.3 77.3 84.9 7.6 5.6Grades K-5 83.1 82.7 94.1 11.4 11.0 77.3 76.3 87.8 11.5 10.5Grades 6-8 86.5 82.3 83.3 1.0 -3.2 82.3 78.7 80.7 2.0 -1.6
Georgetown 65.9 69.7 73.1 3.4 7.2 64.6 68.5 70.3 1.8 5.7Grades K-5 66.7 67.5 75.0 7.5 8.3 65.5 66.0 71.6 5.6 6.1Grades 6-8 64.0 75.3 69.1 -6.2 5.1 62.3 74.8 67.6 -7.2 5.3
Godley Station 71.8 76.3 66.8 -9.5 -5.0 68.4 73.8 66.4 -7.4 -2.0Grades K-5 74.2 74.7 64.2 -10.5 -10.0 69.7 72.1 63.8 -8.3 -5.9Grades 6-8 66.8 80.2 72.8 -7.4 6.0 65.7 78.0 72.3 -5.7 6.6
Hesse 71.4 69.9 60.6 -9.3 -10.8 68.0 66.4 59.3 -7.1 -8.7Grades K-5 69.9 68.9 59.2 -9.7 -10.7 65.5 64.4 57.4 -7.0 -8.1Grades 6-8 75.1 72.1 64.1 -8.0 -11.0 74.1 71.1 64.1 -7.0 -10.0
Isle of Hope 50.9 56.6 71.2 14.6 20.3 50.1 56.1 69.2 13.1 19.1Grades K-5 53.5 59.3 73.3 14.0 19.8 52.5 58.8 70.9 12.1 18.4Grades 6-8 45.1 51.2 67.0 15.8 21.9 44.6 50.7 66.0 15.3 21.4
Rice Creek NA 54.3 66.4 12.1 NA NA 54.0 64.7 10.7 NAGrades K-5 NA 52.6 69.0 16.4 NA NA 52.1 67.5 15.4 NAGrades 6-8 NA 56.6 63.1 6.5 NA NA 56.6 61.1 4.5 NA
NA - score not calculated Impact school 360 school At/above annual target Made progress Did not make progress Increase
CCRPI Core Score (without Challenge Points)
CCRPI Overall Score
State
Comp. Group
SCCPSS
DISTRICT ACCOUNTABILITY SYSTEM - REPORTING, EVALUATING, & MONITORING INSTRUMENT
EXECUTIVE SUMMARY REPORT
12
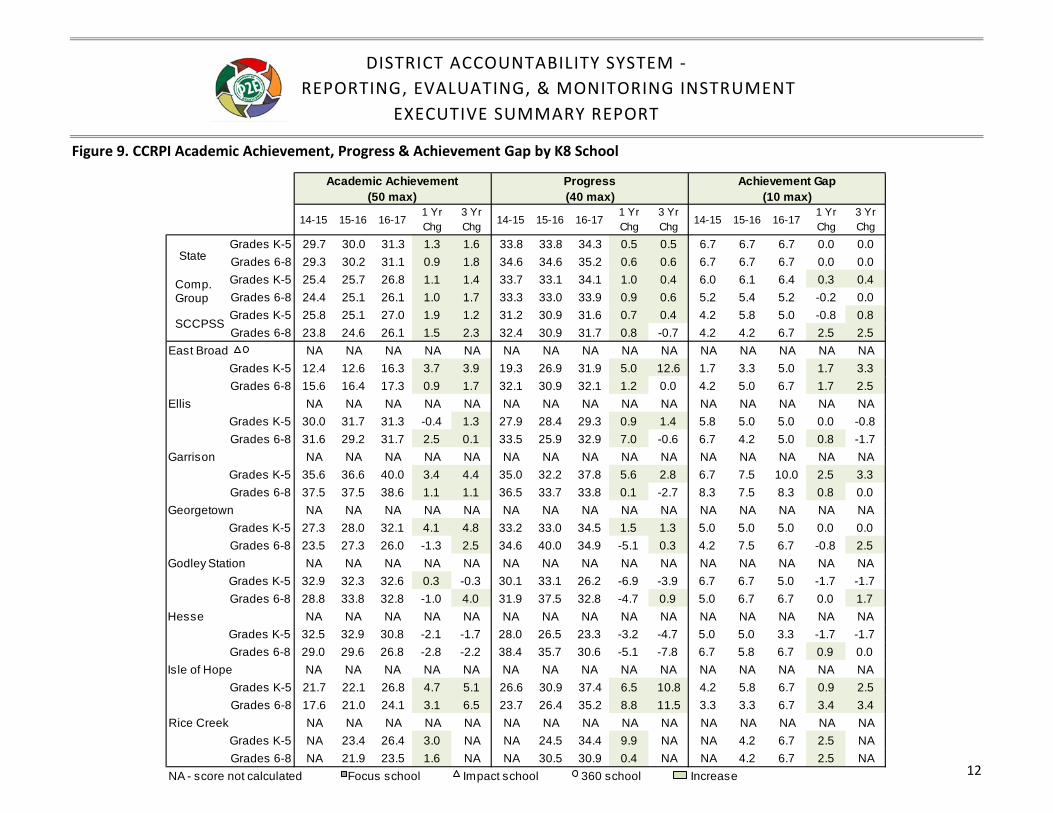
Figure 9. CCRPI Academic Achievement, Progress & Achievement Gap by K8 School
14-15 15-16 16-171 Yr Chg
3 Yr Chg 14-15 15-16 16-17
1 Yr Chg
3 Yr Chg 14-15 15-16 16-17
1 Yr Chg
3 Yr Chg
Grades K-5 29.7 30.0 31.3 1.3 1.6 33.8 33.8 34.3 0.5 0.5 6.7 6.7 6.7 0.0 0.0Grades 6-8 29.3 30.2 31.1 0.9 1.8 34.6 34.6 35.2 0.6 0.6 6.7 6.7 6.7 0.0 0.0Grades K-5 25.4 25.7 26.8 1.1 1.4 33.7 33.1 34.1 1.0 0.4 6.0 6.1 6.4 0.3 0.4Grades 6-8 24.4 25.1 26.1 1.0 1.7 33.3 33.0 33.9 0.9 0.6 5.2 5.4 5.2 -0.2 0.0Grades K-5 25.8 25.1 27.0 1.9 1.2 31.2 30.9 31.6 0.7 0.4 4.2 5.8 5.0 -0.8 0.8Grades 6-8 23.8 24.6 26.1 1.5 2.3 32.4 30.9 31.7 0.8 -0.7 4.2 4.2 6.7 2.5 2.5
East Broad NA NA NA NA NA NA NA NA NA NA NA NA NA NA NAGrades K-5 12.4 12.6 16.3 3.7 3.9 19.3 26.9 31.9 5.0 12.6 1.7 3.3 5.0 1.7 3.3Grades 6-8 15.6 16.4 17.3 0.9 1.7 32.1 30.9 32.1 1.2 0.0 4.2 5.0 6.7 1.7 2.5
Ellis NA NA NA NA NA NA NA NA NA NA NA NA NA NA NAGrades K-5 30.0 31.7 31.3 -0.4 1.3 27.9 28.4 29.3 0.9 1.4 5.8 5.0 5.0 0.0 -0.8Grades 6-8 31.6 29.2 31.7 2.5 0.1 33.5 25.9 32.9 7.0 -0.6 6.7 4.2 5.0 0.8 -1.7
Garrison NA NA NA NA NA NA NA NA NA NA NA NA NA NA NAGrades K-5 35.6 36.6 40.0 3.4 4.4 35.0 32.2 37.8 5.6 2.8 6.7 7.5 10.0 2.5 3.3Grades 6-8 37.5 37.5 38.6 1.1 1.1 36.5 33.7 33.8 0.1 -2.7 8.3 7.5 8.3 0.8 0.0
Georgetown NA NA NA NA NA NA NA NA NA NA NA NA NA NA NAGrades K-5 27.3 28.0 32.1 4.1 4.8 33.2 33.0 34.5 1.5 1.3 5.0 5.0 5.0 0.0 0.0Grades 6-8 23.5 27.3 26.0 -1.3 2.5 34.6 40.0 34.9 -5.1 0.3 4.2 7.5 6.7 -0.8 2.5
Godley Station NA NA NA NA NA NA NA NA NA NA NA NA NA NA NAGrades K-5 32.9 32.3 32.6 0.3 -0.3 30.1 33.1 26.2 -6.9 -3.9 6.7 6.7 5.0 -1.7 -1.7Grades 6-8 28.8 33.8 32.8 -1.0 4.0 31.9 37.5 32.8 -4.7 0.9 5.0 6.7 6.7 0.0 1.7
Hesse NA NA NA NA NA NA NA NA NA NA NA NA NA NA NAGrades K-5 32.5 32.9 30.8 -2.1 -1.7 28.0 26.5 23.3 -3.2 -4.7 5.0 5.0 3.3 -1.7 -1.7Grades 6-8 29.0 29.6 26.8 -2.8 -2.2 38.4 35.7 30.6 -5.1 -7.8 6.7 5.8 6.7 0.9 0.0
Isle of Hope NA NA NA NA NA NA NA NA NA NA NA NA NA NA NAGrades K-5 21.7 22.1 26.8 4.7 5.1 26.6 30.9 37.4 6.5 10.8 4.2 5.8 6.7 0.9 2.5Grades 6-8 17.6 21.0 24.1 3.1 6.5 23.7 26.4 35.2 8.8 11.5 3.3 3.3 6.7 3.4 3.4
Rice Creek NA NA NA NA NA NA NA NA NA NA NA NA NA NA NAGrades K-5 NA 23.4 26.4 3.0 NA NA 24.5 34.4 9.9 NA NA 4.2 6.7 2.5 NAGrades 6-8 NA 21.9 23.5 1.6 NA NA 30.5 30.9 0.4 NA NA 4.2 6.7 2.5 NA
NA - score not calculated Focus school Impact school 360 school Increase
Academic Achievement (50 max)
Progress (40 max)
Achievement Gap(10 max)
State
Comp. Group
SCCPSS
State
DISTRICT ACCOUNTABILITY SYSTEM - REPORTING, EVALUATING, & MONITORING INSTRUMENT
EXECUTIVE SUMMARY REPORT
13
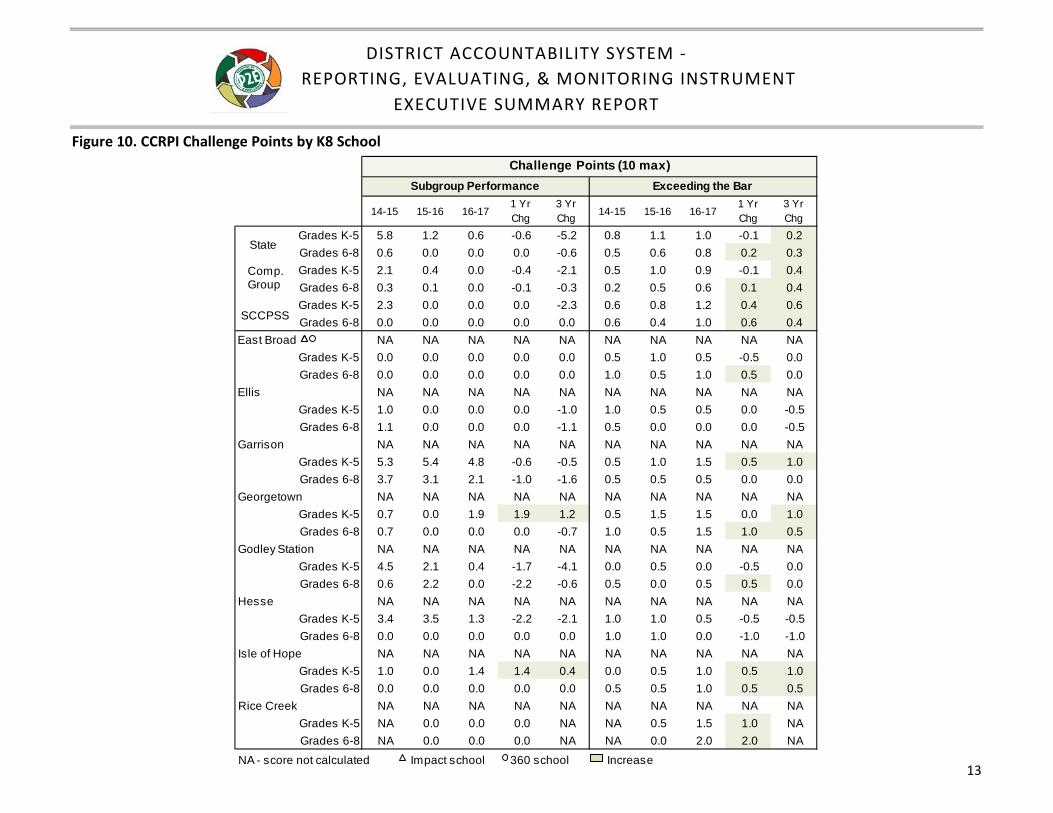
Figure 10. CCRPI Challenge Points by K8 School
14-15 15-16 16-171 Yr Chg
3 Yr Chg 14-15 15-16 16-17
1 Yr Chg
3 Yr Chg
Grades K-5 5.8 1.2 0.6 -0.6 -5.2 0.8 1.1 1.0 -0.1 0.2Grades 6-8 0.6 0.0 0.0 0.0 -0.6 0.5 0.6 0.8 0.2 0.3Grades K-5 2.1 0.4 0.0 -0.4 -2.1 0.5 1.0 0.9 -0.1 0.4Grades 6-8 0.3 0.1 0.0 -0.1 -0.3 0.2 0.5 0.6 0.1 0.4Grades K-5 2.3 0.0 0.0 0.0 -2.3 0.6 0.8 1.2 0.4 0.6Grades 6-8 0.0 0.0 0.0 0.0 0.0 0.6 0.4 1.0 0.6 0.4
East Broad NA NA NA NA NA NA NA NA NA NAGrades K-5 0.0 0.0 0.0 0.0 0.0 0.5 1.0 0.5 -0.5 0.0Grades 6-8 0.0 0.0 0.0 0.0 0.0 1.0 0.5 1.0 0.5 0.0
Ellis NA NA NA NA NA NA NA NA NA NAGrades K-5 1.0 0.0 0.0 0.0 -1.0 1.0 0.5 0.5 0.0 -0.5Grades 6-8 1.1 0.0 0.0 0.0 -1.1 0.5 0.0 0.0 0.0 -0.5
Garrison NA NA NA NA NA NA NA NA NA NAGrades K-5 5.3 5.4 4.8 -0.6 -0.5 0.5 1.0 1.5 0.5 1.0Grades 6-8 3.7 3.1 2.1 -1.0 -1.6 0.5 0.5 0.5 0.0 0.0
Georgetown NA NA NA NA NA NA NA NA NA NAGrades K-5 0.7 0.0 1.9 1.9 1.2 0.5 1.5 1.5 0.0 1.0Grades 6-8 0.7 0.0 0.0 0.0 -0.7 1.0 0.5 1.5 1.0 0.5
Godley Station NA NA NA NA NA NA NA NA NA NAGrades K-5 4.5 2.1 0.4 -1.7 -4.1 0.0 0.5 0.0 -0.5 0.0Grades 6-8 0.6 2.2 0.0 -2.2 -0.6 0.5 0.0 0.5 0.5 0.0
Hesse NA NA NA NA NA NA NA NA NA NAGrades K-5 3.4 3.5 1.3 -2.2 -2.1 1.0 1.0 0.5 -0.5 -0.5Grades 6-8 0.0 0.0 0.0 0.0 0.0 1.0 1.0 0.0 -1.0 -1.0
Isle of Hope NA NA NA NA NA NA NA NA NA NAGrades K-5 1.0 0.0 1.4 1.4 0.4 0.0 0.5 1.0 0.5 1.0Grades 6-8 0.0 0.0 0.0 0.0 0.0 0.5 0.5 1.0 0.5 0.5
Rice Creek NA NA NA NA NA NA NA NA NA NAGrades K-5 NA 0.0 0.0 0.0 NA NA 0.5 1.5 1.0 NAGrades 6-8 NA 0.0 0.0 0.0 NA NA 0.0 2.0 2.0 NA
NA - score not calculated Impact school 360 school Increase
Subgroup PerformanceChallenge Points (10 max)
Exceeding the Bar
State
Comp. Group
SCCPSS

DISTRICT ACCOUNTABILITY SYSTEM - REPORTING, EVALUATING, & MONITORING INSTRUMENT
EXECUTIVE SUMMARY REPORT
14
Figure 11. CCRPI Overall and Core Score by Middle School
14-15 15-16 16-171 Yr Chg
3 Yr Chg 14-15 15-16 16-17
1 Yr Chg
3 Yr Chg
State 71.7 72.1 73.8 1.7 2.1 70.6 71.5 73.0 1.5 2.4Comp. Group 63.5 64.0 65.8 1.8 2.3 62.9 63.5 65.2 1.7 2.3SCCPSS 61.0 60.1 65.5 5.4 4.5 60.4 59.7 64.5 4.8 4.1
Coastal 71.2 71.1 78.1 7.0 6.9 67.3 67.9 73.8 5.9 6.5
DeRenne 52.9 52.1 55.4 3.3 2.5 52.4 51.6 54.4 2.8 2.0
Hubert 47.6 46.6 50.1 3.5 2.5 47.1 46.6 49.6 3.0 2.5
Mercer 48.7 53.5 49.2 -4.3 0.5 48.2 53.0 47.2 -5.8 -1.0
Myers 57.1 47.1 52.5 5.4 -4.6 56.6 47.1 52.0 4.9 -4.6
Southwest 55.3 59.3 63.6 4.3 8.3 54.2 59.3 62.6 3.3 8.4
STEM Academy 84.5 79.4 82.5 3.1 -2.0 78.3 73.0 77.2 4.2 -1.1
West Chatham 58.9 55.9 65.0 9.1 6.1 58.4 55.9 63.5 7.6 5.1NA - score not calculated Focus school 360 school; shaded circle indicates new 360 school At/above annual target Made progress Did not make progress Increase
CCRPI Overall Score CCRPI Core Score (without Challenge Points)
DISTRICT ACCOUNTABILITY SYSTEM - REPORTING, EVALUATING, & MONITORING INSTRUMENT
EXECUTIVE SUMMARY REPORT
15
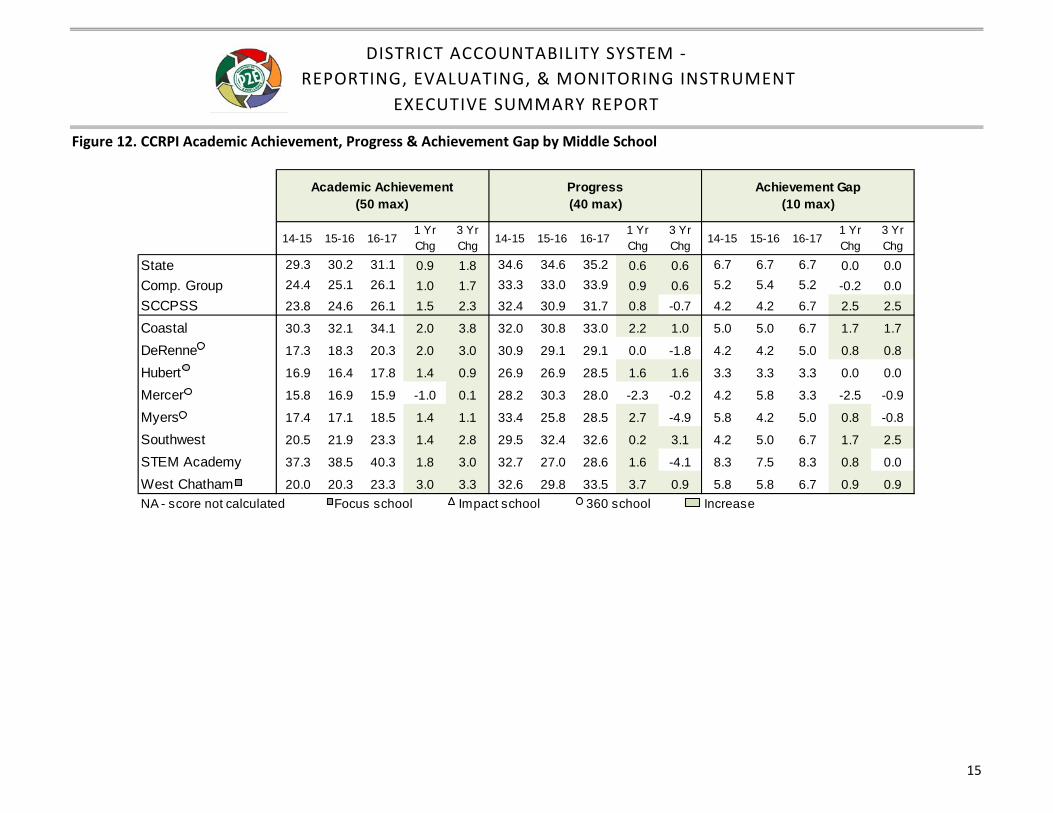
Figure 12. CCRPI Academic Achievement, Progress & Achievement Gap by Middle School
14-15 15-16 16-171 Yr Chg
3 Yr Chg 14-15 15-16 16-17
1 Yr Chg
3 Yr Chg 14-15 15-16 16-17
1 Yr Chg
3 Yr Chg
State 29.3 30.2 31.1 0.9 1.8 34.6 34.6 35.2 0.6 0.6 6.7 6.7 6.7 0.0 0.0Comp. Group 24.4 25.1 26.1 1.0 1.7 33.3 33.0 33.9 0.9 0.6 5.2 5.4 5.2 -0.2 0.0SCCPSS 23.8 24.6 26.1 1.5 2.3 32.4 30.9 31.7 0.8 -0.7 4.2 4.2 6.7 2.5 2.5
Coastal 30.3 32.1 34.1 2.0 3.8 32.0 30.8 33.0 2.2 1.0 5.0 5.0 6.7 1.7 1.7
DeRenne 17.3 18.3 20.3 2.0 3.0 30.9 29.1 29.1 0.0 -1.8 4.2 4.2 5.0 0.8 0.8
Hubert 16.9 16.4 17.8 1.4 0.9 26.9 26.9 28.5 1.6 1.6 3.3 3.3 3.3 0.0 0.0
Mercer 15.8 16.9 15.9 -1.0 0.1 28.2 30.3 28.0 -2.3 -0.2 4.2 5.8 3.3 -2.5 -0.9
Myers 17.4 17.1 18.5 1.4 1.1 33.4 25.8 28.5 2.7 -4.9 5.8 4.2 5.0 0.8 -0.8
Southwest 20.5 21.9 23.3 1.4 2.8 29.5 32.4 32.6 0.2 3.1 4.2 5.0 6.7 1.7 2.5
STEM Academy 37.3 38.5 40.3 1.8 3.0 32.7 27.0 28.6 1.6 -4.1 8.3 7.5 8.3 0.8 0.0
West Chatham 20.0 20.3 23.3 3.0 3.3 32.6 29.8 33.5 3.7 0.9 5.8 5.8 6.7 0.9 0.9NA - score not calculated Focus school Impact school 360 school Increase
Academic Achievement (50 max)
Progress (40 max)
Achievement Gap(10 max)
DISTRICT ACCOUNTABILITY SYSTEM - REPORTING, EVALUATING, & MONITORING INSTRUMENT
EXECUTIVE SUMMARY REPORT
16
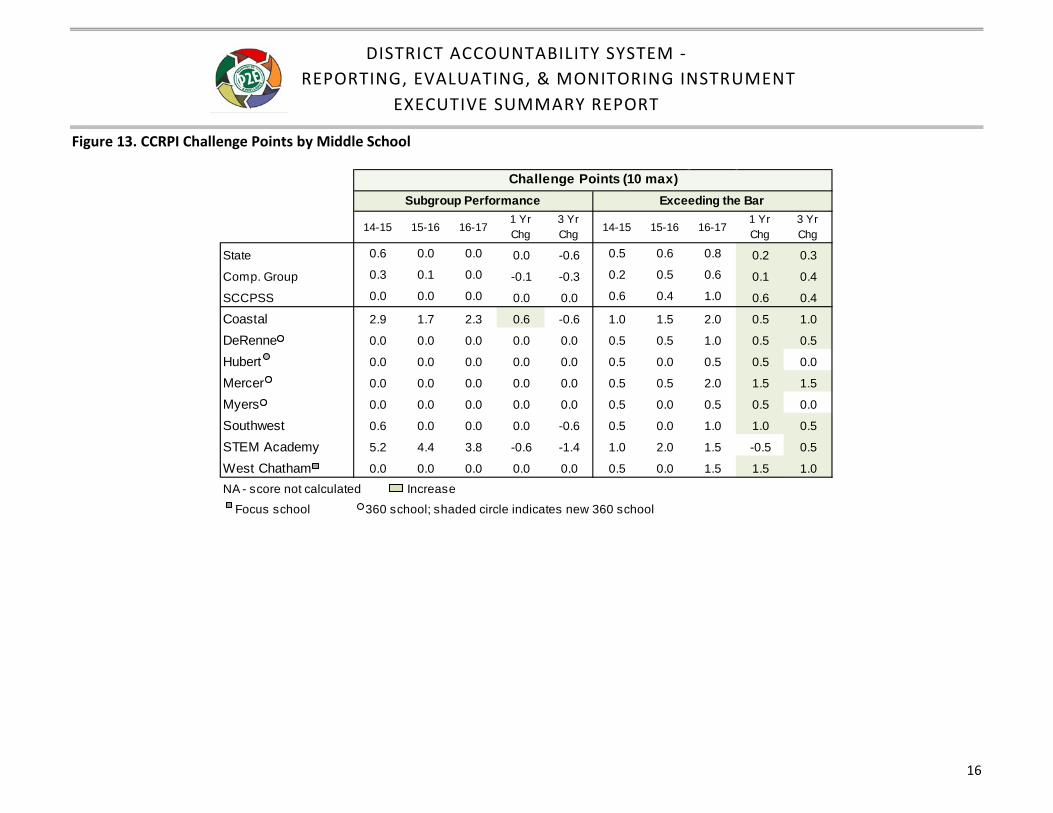
Figure 13. CCRPI Challenge Points by Middle School
14-15 15-16 16-171 Yr Chg
3 Yr Chg 14-15 15-16 16-17
1 Yr Chg
3 Yr Chg
State 0.6 0.0 0.0 0.0 -0.6 0.5 0.6 0.8 0.2 0.3
Comp. Group 0.3 0.1 0.0 -0.1 -0.3 0.2 0.5 0.6 0.1 0.4
SCCPSS 0.0 0.0 0.0 0.0 0.0 0.6 0.4 1.0 0.6 0.4
Coastal 2.9 1.7 2.3 0.6 -0.6 1.0 1.5 2.0 0.5 1.0
DeRenne 0.0 0.0 0.0 0.0 0.0 0.5 0.5 1.0 0.5 0.5
Hubert 0.0 0.0 0.0 0.0 0.0 0.5 0.0 0.5 0.5 0.0
Mercer 0.0 0.0 0.0 0.0 0.0 0.5 0.5 2.0 1.5 1.5
Myers 0.0 0.0 0.0 0.0 0.0 0.5 0.0 0.5 0.5 0.0
Southwest 0.6 0.0 0.0 0.0 -0.6 0.5 0.0 1.0 1.0 0.5
STEM Academy 5.2 4.4 3.8 -0.6 -1.4 1.0 2.0 1.5 -0.5 0.5
West Chatham 0.0 0.0 0.0 0.0 0.0 0.5 0.0 1.5 1.5 1.0NA - score not calculated Increase Focus school 360 school; shaded circle indicates new 360 school
Subgroup Performance Exceeding the BarChallenge Points (10 max)

DISTRICT ACCOUNTABILITY SYSTEM - REPORTING, EVALUATING, & MONITORING INSTRUMENT
EXECUTIVE SUMMARY REPORT
17
Figure 14. CCRPI Overall and Core Score by High School
14-15 15-16 16-171 Yr Chg
3 Yr Chg 14-15 15-16 16-17
1 Yr Chg
3 Yr Chg
State 76.1 76.1 77.6 1.5 1.5 73.8 75.0 76.5 1.5 2.7
Comp. Group 70.7 68.8 71.9 3.1 1.2 69.0 67.6 70.6 3.0 1.6
SCCPSS 72.5 72.7 72.5 -0.2 0.0 70.4 71.3 71.6 0.3 1.2
Beach 70.9 69.2 73.2 4.0 2.3 68.0 68.2 72.3 4.1 4.3
Early College NA 96.7 92.9 -3.8 NA NA 89.2 86.2 -3.0 NA
Groves 71.3 66.1 61.6 -4.5 -9.7 69.5 66.1 61.6 -4.5 -7.9
Islands 76.3 75.6 71.9 -3.7 -4.4 74.4 74.1 69.7 -4.4 -4.7
Jenkins 71.1 67.6 64.4 -3.2 -6.7 70.2 65.8 63.4 -2.4 -6.8
Johnson 69.8 70.7 74.6 3.9 4.8 68.4 69.3 73.0 3.7 4.6
New Hampstead 68.7 65.8 70.5 4.7 1.8 68.0 65.5 69.2 3.7 1.2
Savannah Arts 86.6 91.7 96.3 4.6 9.7 84.6 89.4 93.4 4.0 8.8
SLS at Sav. High 60.6 60.0 62.1 2.1 1.5 60.6 60.0 62.1 2.1 1.5
Windsor Forest 66.6 66.7 66.3 -0.4 -0.3 66.2 66.3 65.8 -0.5 -0.4
Woodville-Tompkins 92.3 92.5 92.4 -0.1 0.1 86.5 85.9 87.6 1.7 1.1NA - score not calculated Priority school At/above annual target Made progress Did not make progress Increase
CCRPI Overall Score CCRPI Core Score (without Challenge Points)
DISTRICT ACCOUNTABILITY SYSTEM - REPORTING, EVALUATING, & MONITORING INSTRUMENT
EXECUTIVE SUMMARY REPORT
18
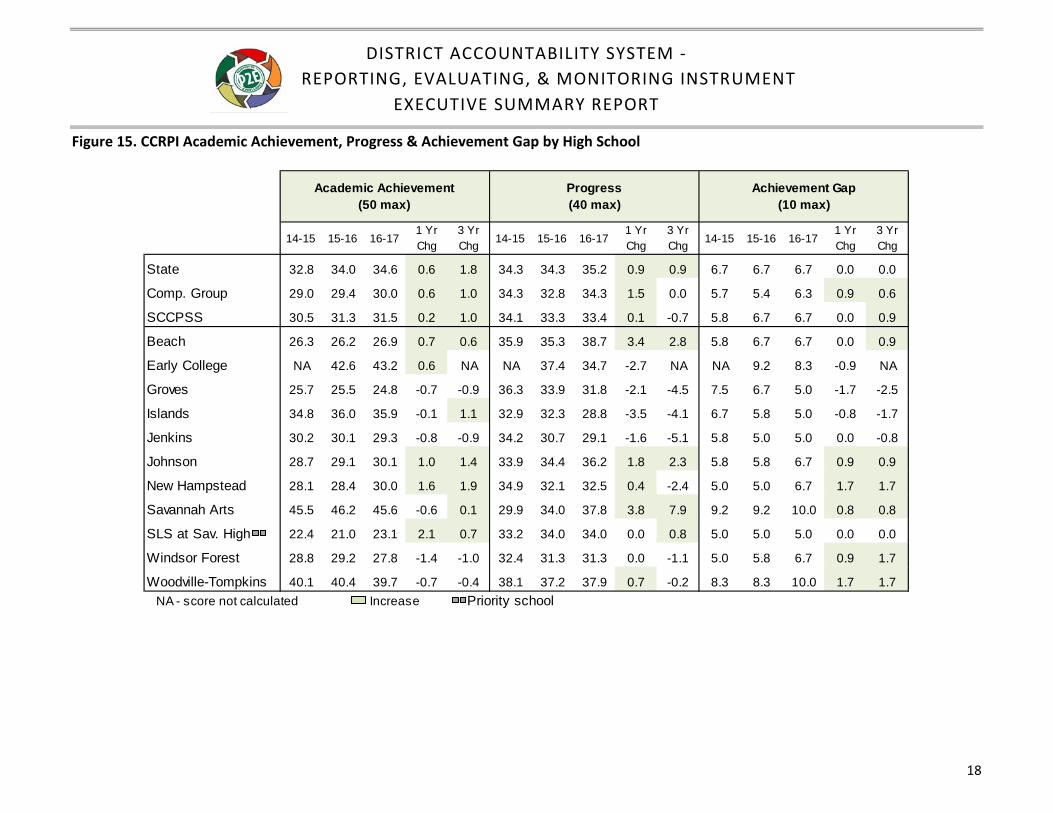
Figure 15. CCRPI Academic Achievement, Progress & Achievement Gap by High School
14-15 15-16 16-171 Yr Chg
3 Yr Chg 14-15 15-16 16-17
1 Yr Chg
3 Yr Chg 14-15 15-16 16-17
1 Yr Chg
3 Yr Chg
State 32.8 34.0 34.6 0.6 1.8 34.3 34.3 35.2 0.9 0.9 6.7 6.7 6.7 0.0 0.0
Comp. Group 29.0 29.4 30.0 0.6 1.0 34.3 32.8 34.3 1.5 0.0 5.7 5.4 6.3 0.9 0.6
SCCPSS 30.5 31.3 31.5 0.2 1.0 34.1 33.3 33.4 0.1 -0.7 5.8 6.7 6.7 0.0 0.9
Beach 26.3 26.2 26.9 0.7 0.6 35.9 35.3 38.7 3.4 2.8 5.8 6.7 6.7 0.0 0.9
Early College NA 42.6 43.2 0.6 NA NA 37.4 34.7 -2.7 NA NA 9.2 8.3 -0.9 NA
Groves 25.7 25.5 24.8 -0.7 -0.9 36.3 33.9 31.8 -2.1 -4.5 7.5 6.7 5.0 -1.7 -2.5
Islands 34.8 36.0 35.9 -0.1 1.1 32.9 32.3 28.8 -3.5 -4.1 6.7 5.8 5.0 -0.8 -1.7
Jenkins 30.2 30.1 29.3 -0.8 -0.9 34.2 30.7 29.1 -1.6 -5.1 5.8 5.0 5.0 0.0 -0.8
Johnson 28.7 29.1 30.1 1.0 1.4 33.9 34.4 36.2 1.8 2.3 5.8 5.8 6.7 0.9 0.9
New Hampstead 28.1 28.4 30.0 1.6 1.9 34.9 32.1 32.5 0.4 -2.4 5.0 5.0 6.7 1.7 1.7
Savannah Arts 45.5 46.2 45.6 -0.6 0.1 29.9 34.0 37.8 3.8 7.9 9.2 9.2 10.0 0.8 0.8
SLS at Sav. High 22.4 21.0 23.1 2.1 0.7 33.2 34.0 34.0 0.0 0.8 5.0 5.0 5.0 0.0 0.0
Windsor Forest 28.8 29.2 27.8 -1.4 -1.0 32.4 31.3 31.3 0.0 -1.1 5.0 5.8 6.7 0.9 1.7
Woodville-Tompkins 40.1 40.4 39.7 -0.7 -0.4 38.1 37.2 37.9 0.7 -0.2 8.3 8.3 10.0 1.7 1.7 NA - score not calculated Increase Priority school
Achievement Gap(10 max)
Academic Achievement (50 max)
Progress (40 max)
DISTRICT ACCOUNTABILITY SYSTEM - REPORTING, EVALUATING, & MONITORING INSTRUMENT
EXECUTIVE SUMMARY REPORT
19
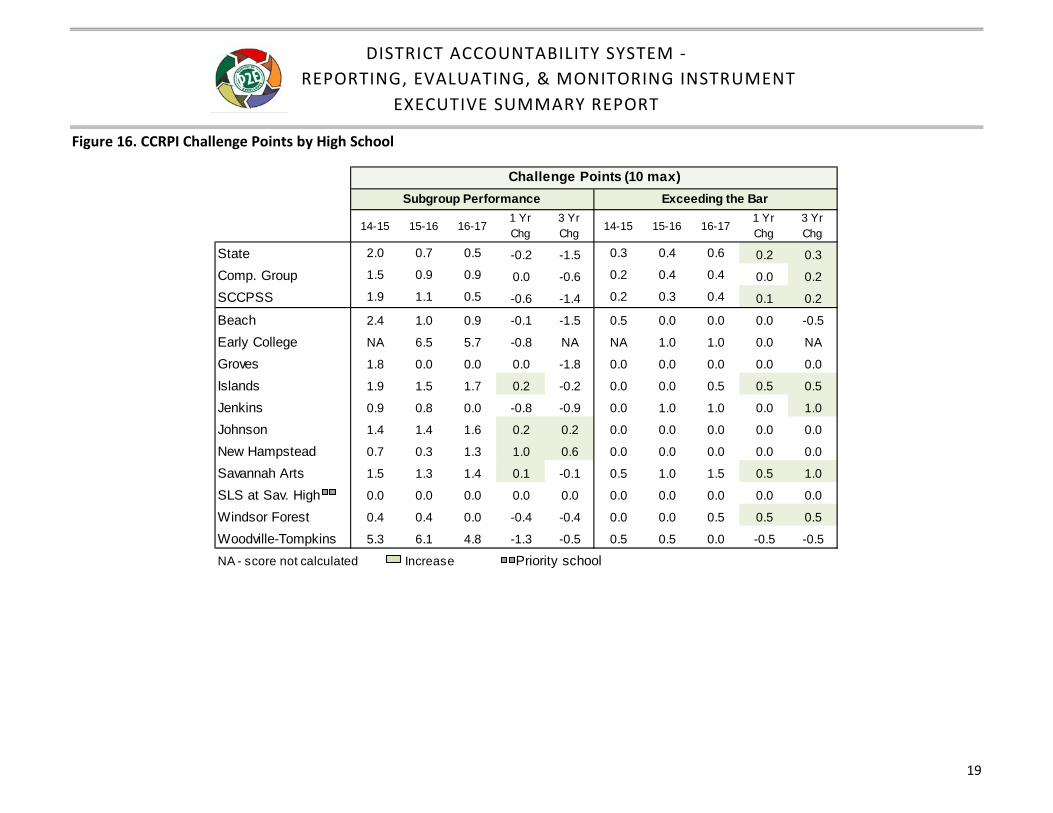
Figure 16. CCRPI Challenge Points by High School
14-15 15-16 16-17
1 Yr Chg
3 Yr Chg 14-15 15-16 16-17
1 Yr Chg
3 Yr Chg
State 2.0 0.7 0.5 -0.2 -1.5 0.3 0.4 0.6 0.2 0.3Comp. Group 1.5 0.9 0.9 0.0 -0.6 0.2 0.4 0.4 0.0 0.2SCCPSS 1.9 1.1 0.5 -0.6 -1.4 0.2 0.3 0.4 0.1 0.2
Beach 2.4 1.0 0.9 -0.1 -1.5 0.5 0.0 0.0 0.0 -0.5
Early College NA 6.5 5.7 -0.8 NA NA 1.0 1.0 0.0 NA
Groves 1.8 0.0 0.0 0.0 -1.8 0.0 0.0 0.0 0.0 0.0
Islands 1.9 1.5 1.7 0.2 -0.2 0.0 0.0 0.5 0.5 0.5
Jenkins 0.9 0.8 0.0 -0.8 -0.9 0.0 1.0 1.0 0.0 1.0
Johnson 1.4 1.4 1.6 0.2 0.2 0.0 0.0 0.0 0.0 0.0
New Hampstead 0.7 0.3 1.3 1.0 0.6 0.0 0.0 0.0 0.0 0.0
Savannah Arts 1.5 1.3 1.4 0.1 -0.1 0.5 1.0 1.5 0.5 1.0
SLS at Sav. High 0.0 0.0 0.0 0.0 0.0 0.0 0.0 0.0 0.0 0.0
Windsor Forest 0.4 0.4 0.0 -0.4 -0.4 0.0 0.0 0.5 0.5 0.5
Woodville-Tompkins 5.3 6.1 4.8 -1.3 -0.5 0.5 0.5 0.0 -0.5 -0.5
NA - score not calculated Increase Priority school
Subgroup Performance Exceeding the BarChallenge Points (10 max)
DISTRICT ACCOUNTABILITY SYSTEM - REPORTING, EVALUATING, & MONITORING INSTRUMENT
EXECUTIVE SUMMARY REPORT
20
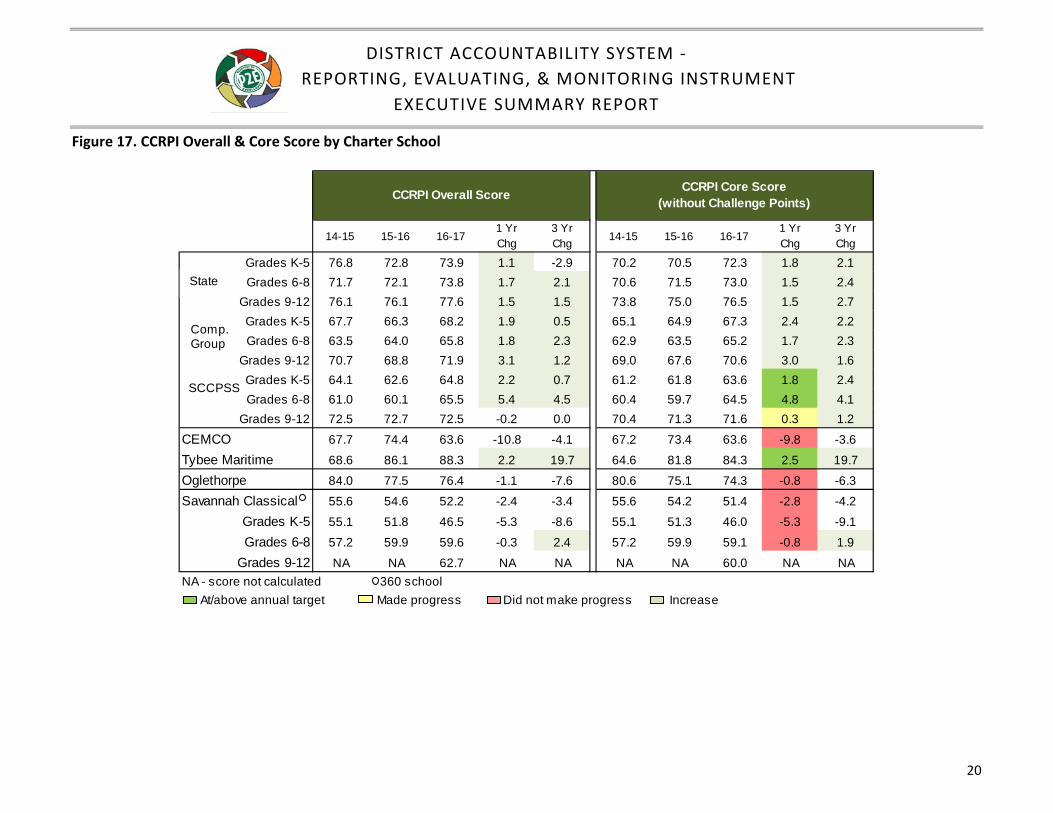
Figure 17. CCRPI Overall & Core Score by Charter School
14-15 15-16 16-171 Yr Chg
3 Yr Chg 14-15 15-16 16-17
1 Yr Chg
3 Yr Chg
Grades K-5 76.8 72.8 73.9 1.1 -2.9 70.2 70.5 72.3 1.8 2.1Grades 6-8 71.7 72.1 73.8 1.7 2.1 70.6 71.5 73.0 1.5 2.4
Grades 9-12 76.1 76.1 77.6 1.5 1.5 73.8 75.0 76.5 1.5 2.7Grades K-5 67.7 66.3 68.2 1.9 0.5 65.1 64.9 67.3 2.4 2.2Grades 6-8 63.5 64.0 65.8 1.8 2.3 62.9 63.5 65.2 1.7 2.3
Grades 9-12 70.7 68.8 71.9 3.1 1.2 69.0 67.6 70.6 3.0 1.6Grades K-5 64.1 62.6 64.8 2.2 0.7 61.2 61.8 63.6 1.8 2.4Grades 6-8 61.0 60.1 65.5 5.4 4.5 60.4 59.7 64.5 4.8 4.1
Grades 9-12 72.5 72.7 72.5 -0.2 0.0 70.4 71.3 71.6 0.3 1.2CEMCO 67.7 74.4 63.6 -10.8 -4.1 67.2 73.4 63.6 -9.8 -3.6Tybee Maritime 68.6 86.1 88.3 2.2 19.7 64.6 81.8 84.3 2.5 19.7Oglethorpe 84.0 77.5 76.4 -1.1 -7.6 80.6 75.1 74.3 -0.8 -6.3Savannah Classical 55.6 54.6 52.2 -2.4 -3.4 55.6 54.2 51.4 -2.8 -4.2
Grades K-5 55.1 51.8 46.5 -5.3 -8.6 55.1 51.3 46.0 -5.3 -9.1Grades 6-8 57.2 59.9 59.6 -0.3 2.4 57.2 59.9 59.1 -0.8 1.9
Grades 9-12 NA NA 62.7 NA NA NA NA 60.0 NA NANA - score not calculated 360 school At/above annual target Made progress Did not make progress Increase
CCRPI Overall Score CCRPI Core Score (without Challenge Points)
State
Comp. Group
SCCPSS
State
DISTRICT ACCOUNTABILITY SYSTEM - REPORTING, EVALUATING, & MONITORING INSTRUMENT
EXECUTIVE SUMMARY REPORT
21
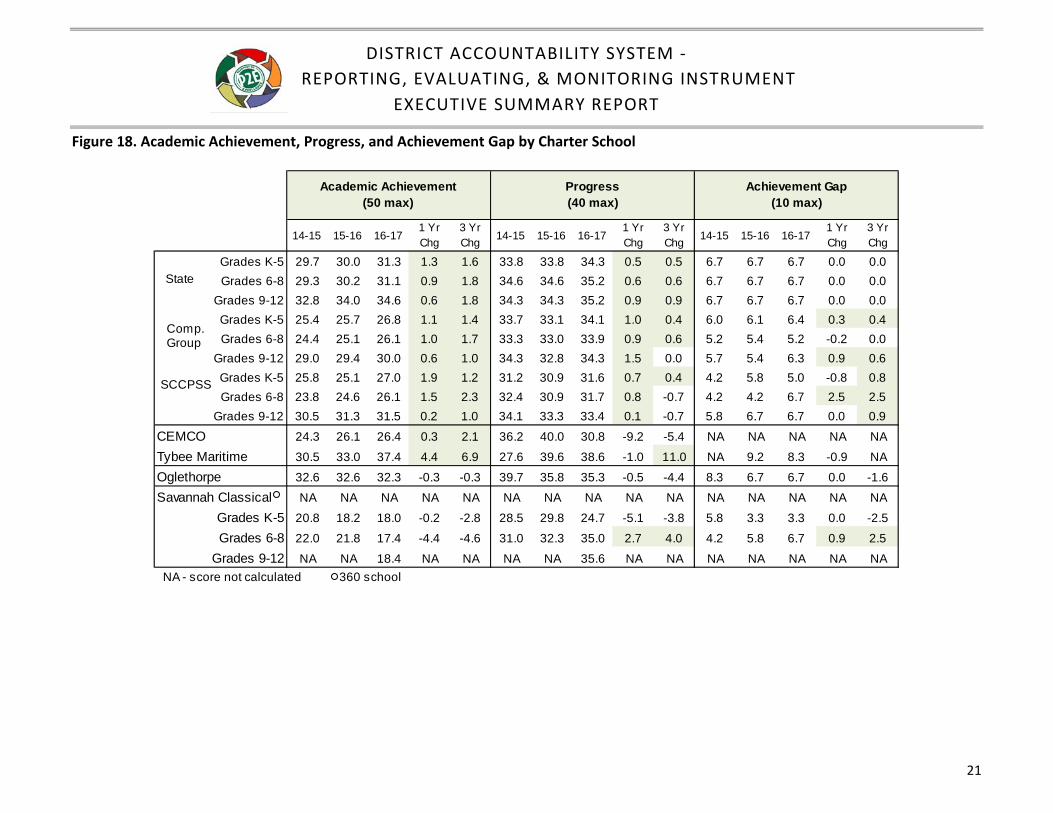
Figure 18. Academic Achievement, Progress, and Achievement Gap by Charter School
14-15 15-16 16-171 Yr Chg
3 Yr Chg 14-15 15-16 16-17
1 Yr Chg
3 Yr Chg 14-15 15-16 16-17
1 Yr Chg
3 Yr Chg
Grades K-5 29.7 30.0 31.3 1.3 1.6 33.8 33.8 34.3 0.5 0.5 6.7 6.7 6.7 0.0 0.0Grades 6-8 29.3 30.2 31.1 0.9 1.8 34.6 34.6 35.2 0.6 0.6 6.7 6.7 6.7 0.0 0.0
Grades 9-12 32.8 34.0 34.6 0.6 1.8 34.3 34.3 35.2 0.9 0.9 6.7 6.7 6.7 0.0 0.0Grades K-5 25.4 25.7 26.8 1.1 1.4 33.7 33.1 34.1 1.0 0.4 6.0 6.1 6.4 0.3 0.4Grades 6-8 24.4 25.1 26.1 1.0 1.7 33.3 33.0 33.9 0.9 0.6 5.2 5.4 5.2 -0.2 0.0
Grades 9-12 29.0 29.4 30.0 0.6 1.0 34.3 32.8 34.3 1.5 0.0 5.7 5.4 6.3 0.9 0.6Grades K-5 25.8 25.1 27.0 1.9 1.2 31.2 30.9 31.6 0.7 0.4 4.2 5.8 5.0 -0.8 0.8Grades 6-8 23.8 24.6 26.1 1.5 2.3 32.4 30.9 31.7 0.8 -0.7 4.2 4.2 6.7 2.5 2.5
Grades 9-12 30.5 31.3 31.5 0.2 1.0 34.1 33.3 33.4 0.1 -0.7 5.8 6.7 6.7 0.0 0.9CEMCO 24.3 26.1 26.4 0.3 2.1 36.2 40.0 30.8 -9.2 -5.4 NA NA NA NA NATybee Maritime 30.5 33.0 37.4 4.4 6.9 27.6 39.6 38.6 -1.0 11.0 NA 9.2 8.3 -0.9 NAOglethorpe 32.6 32.6 32.3 -0.3 -0.3 39.7 35.8 35.3 -0.5 -4.4 8.3 6.7 6.7 0.0 -1.6Savannah Classical NA NA NA NA NA NA NA NA NA NA NA NA NA NA NA
Grades K-5 20.8 18.2 18.0 -0.2 -2.8 28.5 29.8 24.7 -5.1 -3.8 5.8 3.3 3.3 0.0 -2.5Grades 6-8 22.0 21.8 17.4 -4.4 -4.6 31.0 32.3 35.0 2.7 4.0 4.2 5.8 6.7 0.9 2.5
Grades 9-12 NA NA 18.4 NA NA NA NA 35.6 NA NA NA NA NA NA NA NA - score not calculated 360 school
Academic Achievement (50 max)
Achievement Gap(10 max)
Progress (40 max)
State
Comp. Group
SCCPSS
StateState
DISTRICT ACCOUNTABILITY SYSTEM - REPORTING, EVALUATING, & MONITORING INSTRUMENT
EXECUTIVE SUMMARY REPORT
22
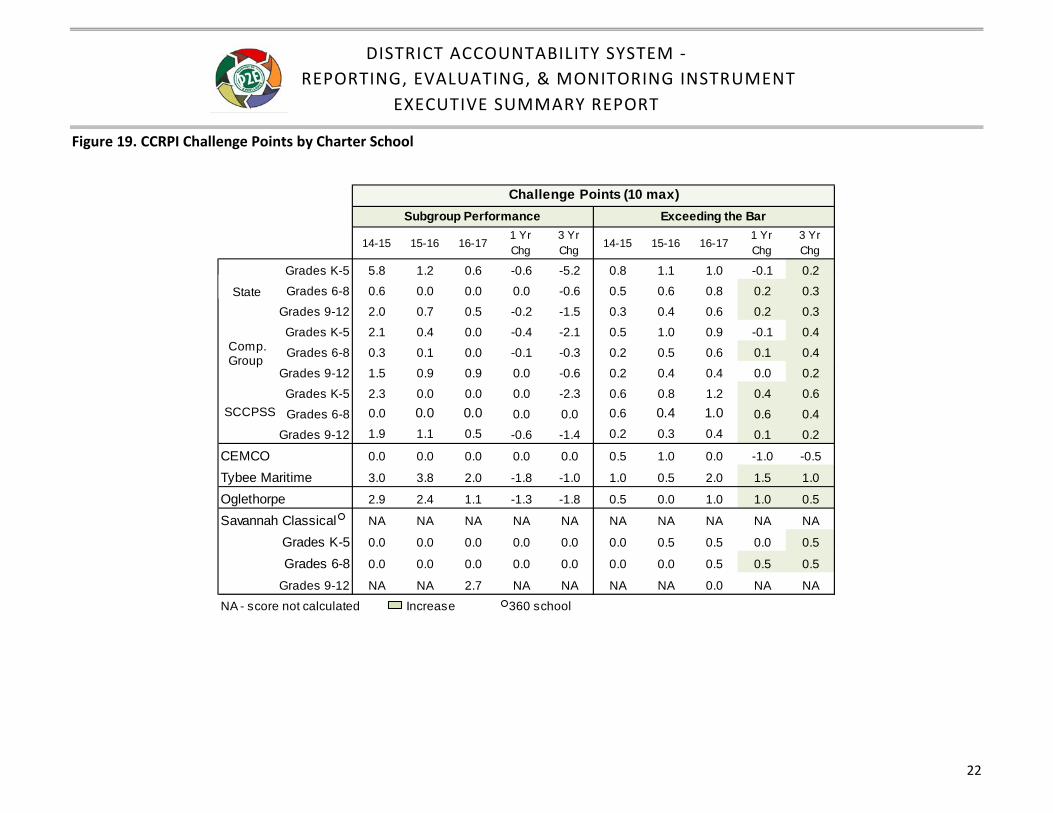
Figure 19. CCRPI Challenge Points by Charter School
14-15 15-16 16-171 Yr Chg
3 Yr Chg 14-15 15-16 16-17
1 Yr Chg
3 Yr Chg
Grades K-5 5.8 1.2 0.6 -0.6 -5.2 0.8 1.1 1.0 -0.1 0.2Grades 6-8 0.6 0.0 0.0 0.0 -0.6 0.5 0.6 0.8 0.2 0.3
Grades 9-12 2.0 0.7 0.5 -0.2 -1.5 0.3 0.4 0.6 0.2 0.3Grades K-5 2.1 0.4 0.0 -0.4 -2.1 0.5 1.0 0.9 -0.1 0.4Grades 6-8 0.3 0.1 0.0 -0.1 -0.3 0.2 0.5 0.6 0.1 0.4
Grades 9-12 1.5 0.9 0.9 0.0 -0.6 0.2 0.4 0.4 0.0 0.2Grades K-5 2.3 0.0 0.0 0.0 -2.3 0.6 0.8 1.2 0.4 0.6Grades 6-8 0.0 0.0 0.0 0.0 0.0 0.6 0.4 1.0 0.6 0.4
Grades 9-12 1.9 1.1 0.5 -0.6 -1.4 0.2 0.3 0.4 0.1 0.2
CEMCO 0.0 0.0 0.0 0.0 0.0 0.5 1.0 0.0 -1.0 -0.5
Tybee Maritime 3.0 3.8 2.0 -1.8 -1.0 1.0 0.5 2.0 1.5 1.0
Oglethorpe 2.9 2.4 1.1 -1.3 -1.8 0.5 0.0 1.0 1.0 0.5
Savannah Classical NA NA NA NA NA NA NA NA NA NA
Grades K-5 0.0 0.0 0.0 0.0 0.0 0.0 0.5 0.5 0.0 0.5
Grades 6-8 0.0 0.0 0.0 0.0 0.0 0.0 0.0 0.5 0.5 0.5
Grades 9-12 NA NA 2.7 NA NA NA NA 0.0 NA NANA - score not calculated Increase 360 school
Challenge Points (10 max)Subgroup Performance Exceeding the Bar
State
SCCPSS
State
Comp. Group