distribution of chloride, ph, resistivity, and sulfate ... · • minimum resistivity. water...
TRANSCRIPT
Distribution of Chloride, pH, Resistivity, and Sulfate Levels in Backfill for MSE Walls and Implications for Corrosion TestingPresentation for the 2015 Geotechnical Research in ProgressBDV 25 TWO 977-03Ivan Sokolic, Project Manager
Noreen Poor, Thilanki Rajaguru, and Manjriker Gunaratne
June 3, 2013 through May 31, 2015
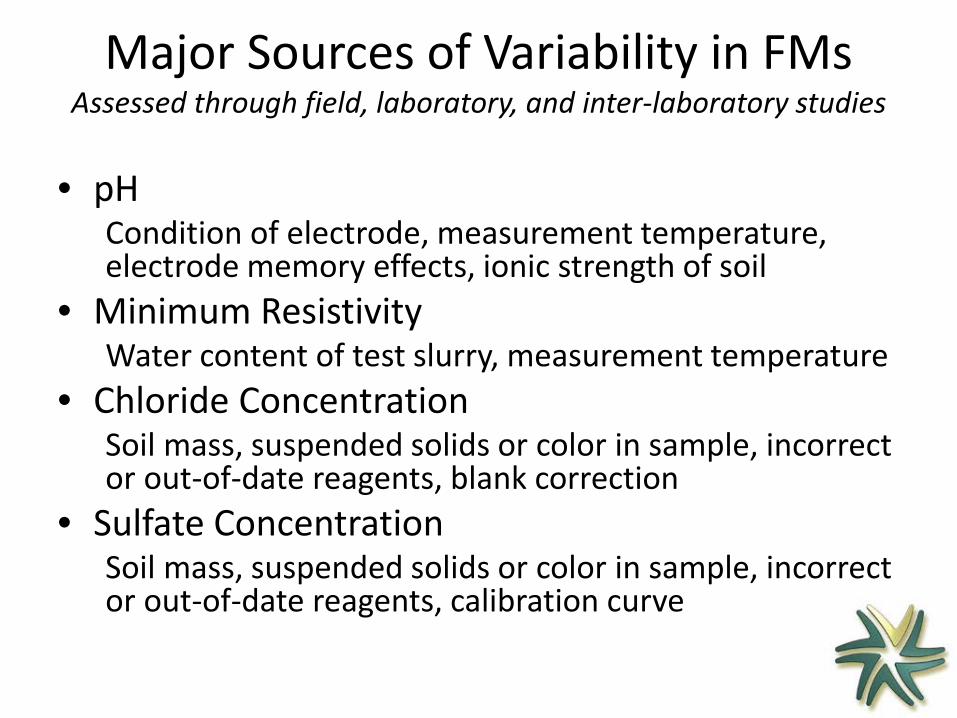
• pHCondition of electrode, measurement temperature, electrode memory effects, ionic strength of soil
• Minimum ResistivityWater content of test slurry, measurement temperature
• Chloride ConcentrationSoil mass, suspended solids or color in sample, incorrect or out-of-date reagents, blank correction
• Sulfate ConcentrationSoil mass, suspended solids or color in sample, incorrect or out-of-date reagents, calibration curve
Major Sources of Variability in FMsAssessed through field, laboratory, and inter-laboratory studies
www.six-sigma-material.comwww.statstodo.com
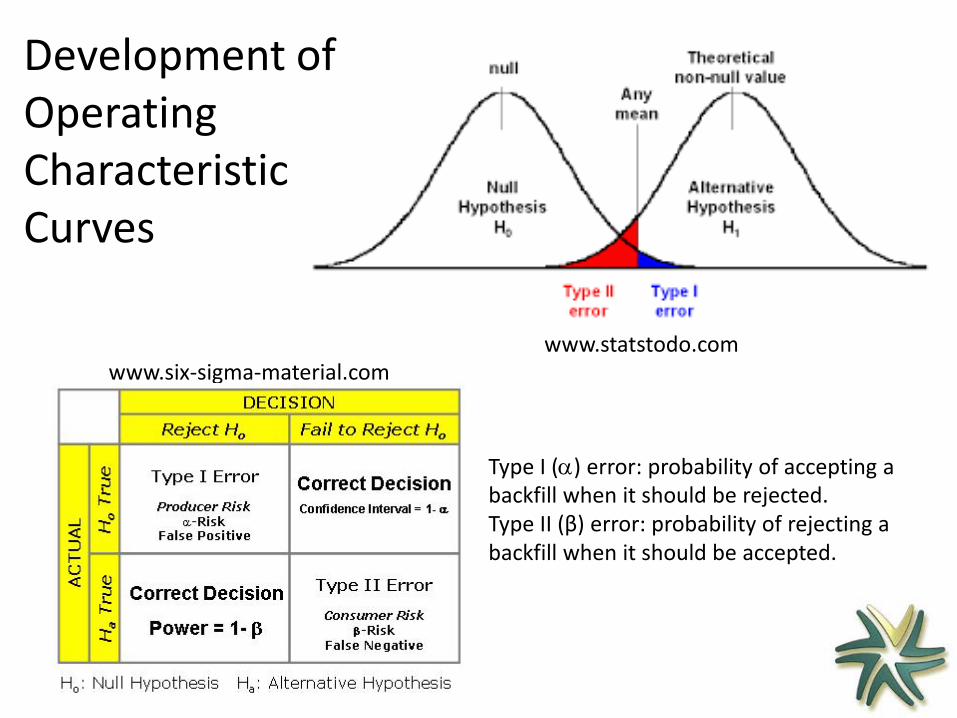
Type I (α) error: probability of accepting a backfill when it should be rejected.Type II (β) error: probability of rejecting a backfill when it should be accepted.
Development of Operating Characteristic Curves
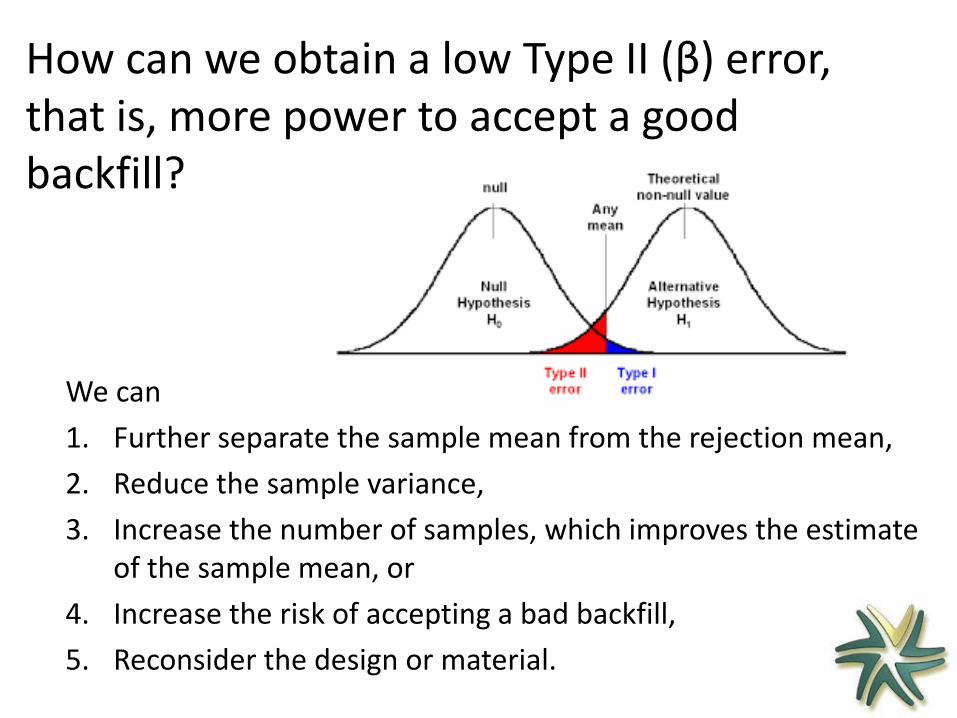
How can we obtain a low Type II (β) error, that is, more power to accept a good backfill?
We can1. Further separate the sample mean from the rejection mean,2. Reduce the sample variance,3. Increase the number of samples, which improves the estimate
of the sample mean, or4. Increase the risk of accepting a bad backfill,5. Reconsider the design or material.
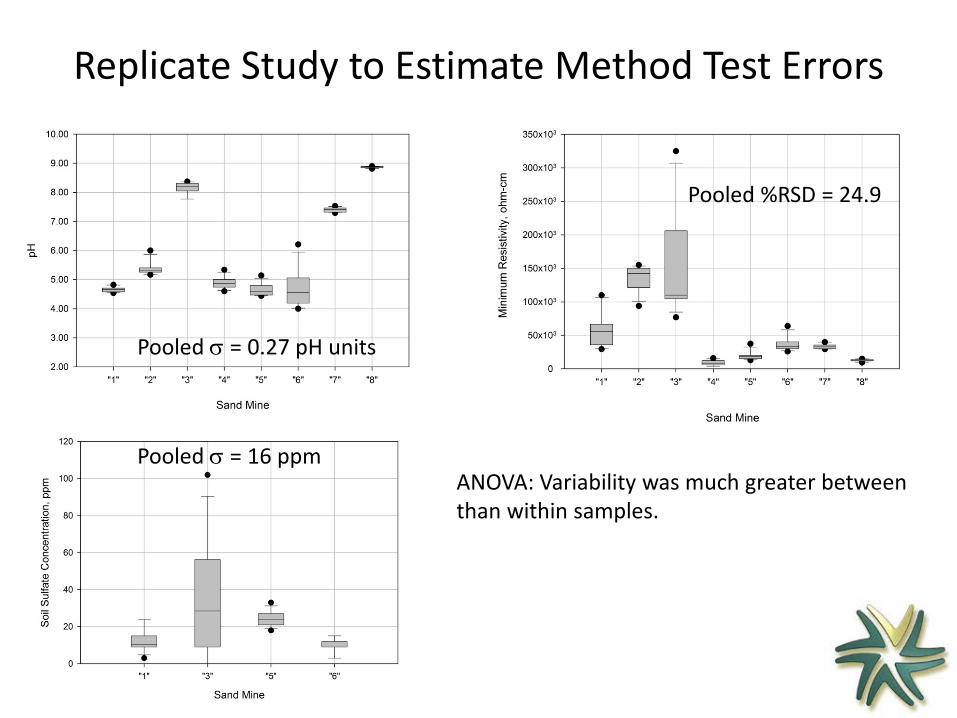
ANOVA: Variability was much greater between than within samples.
Replicate Study to Estimate Method Test Errors
Pooled σ = 0.27 pH units
Pooled %RSD = 24.9
Pooled σ = 16 ppm
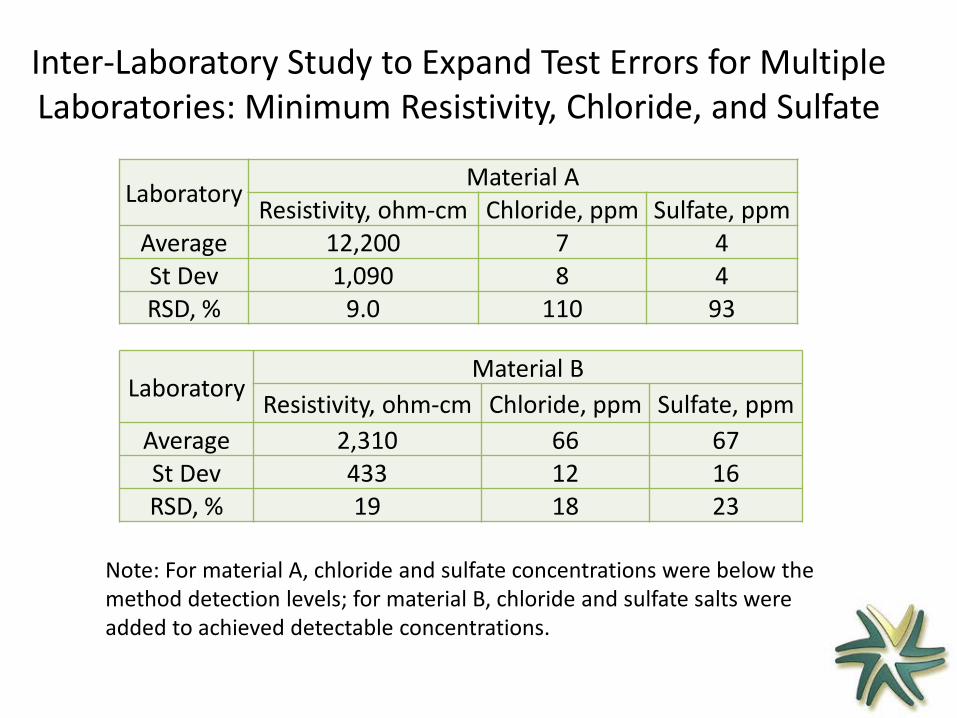
Inter-Laboratory Study to Expand Test Errors for Multiple Laboratories: Minimum Resistivity, Chloride, and Sulfate
Laboratory Material AResistivity, ohm-cm Chloride, ppm Sulfate, ppm
Average 12,200 7 4St Dev 1,090 8 4RSD, % 9.0 110 93
LaboratoryMaterial B
Resistivity, ohm-cm Chloride, ppm Sulfate, ppmAverage 2,310 66 67St Dev 433 12 16RSD, % 19 18 23
Note: For material A, chloride and sulfate concentrations were below the method detection levels; for material B, chloride and sulfate salts were added to achieved detectable concentrations.
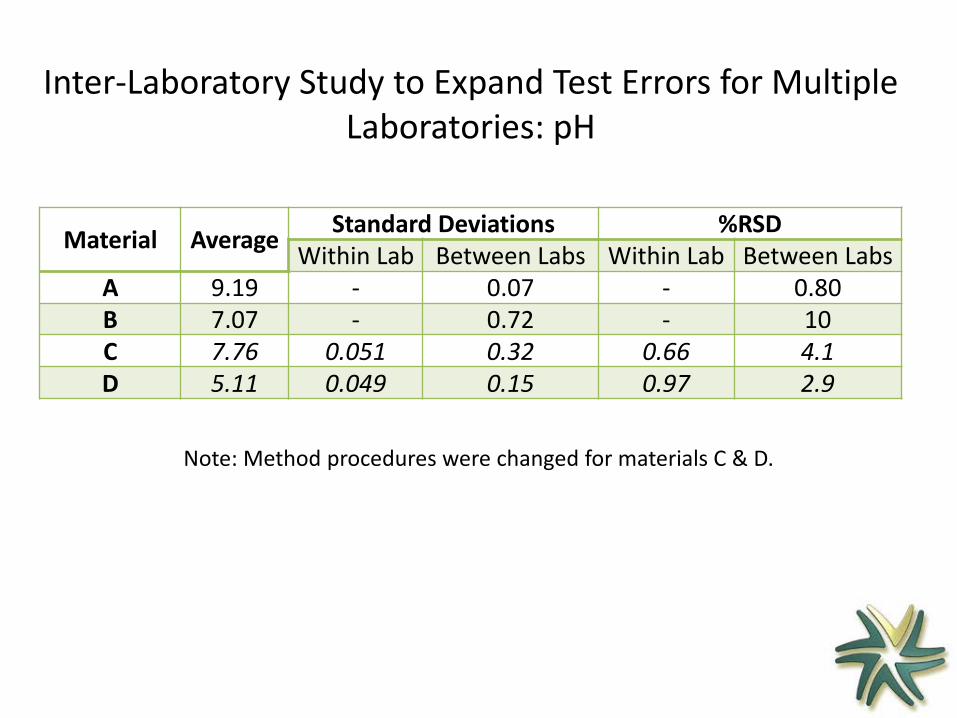
Inter-Laboratory Study to Expand Test Errors for Multiple Laboratories: pH
Material Average Standard Deviations %RSDWithin Lab Between Labs Within Lab Between Labs
A 9.19 - 0.07 - 0.80B 7.07 - 0.72 - 10C 7.76 0.051 0.32 0.66 4.1D 5.11 0.049 0.15 0.97 2.9
Note: Method procedures were changed for materials C & D.
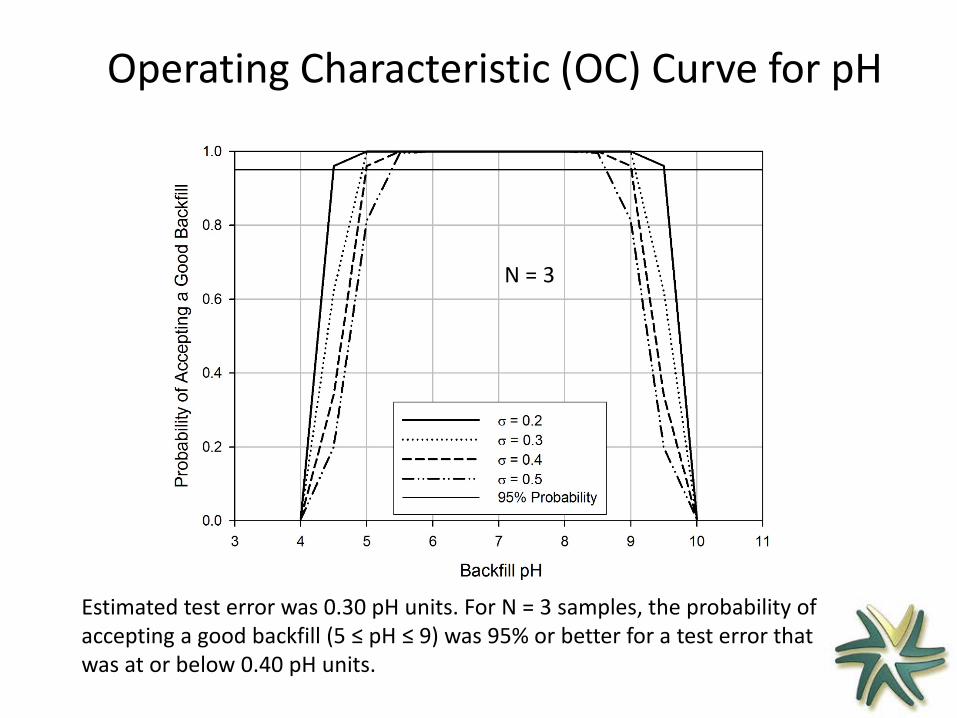
Operating Characteristic (OC) Curve for pH
Estimated test error was 0.30 pH units. For N = 3 samples, the probability of accepting a good backfill (5 ≤ pH ≤ 9) was 95% or better for a test error that was at or below 0.40 pH units.
N = 3
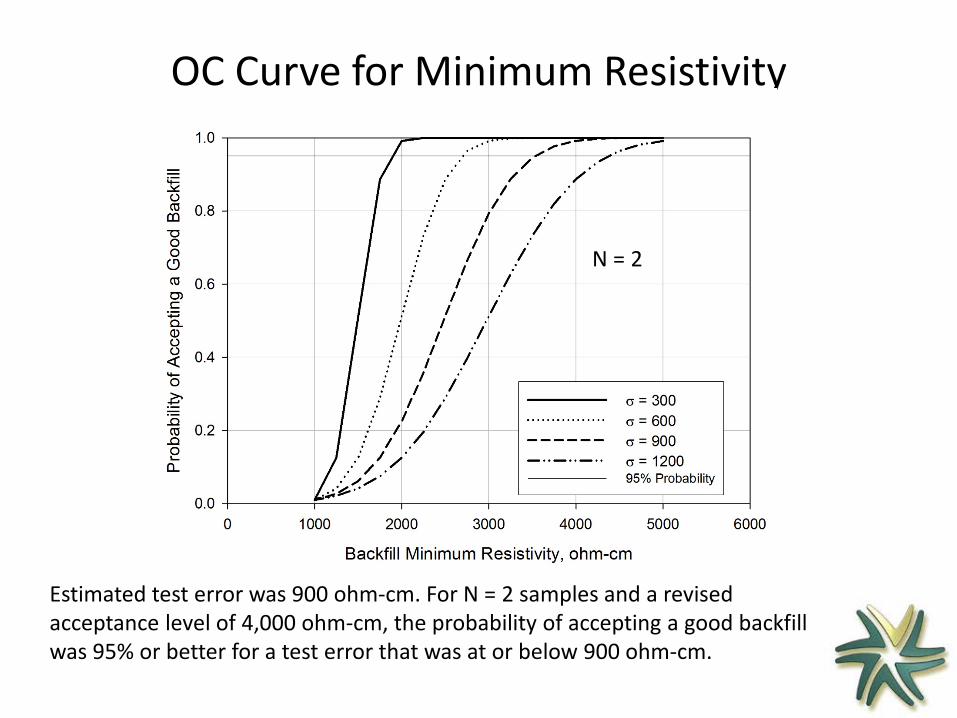
OC Curve for Minimum Resistivity
Estimated test error was 900 ohm-cm. For N = 2 samples and a revised acceptance level of 4,000 ohm-cm, the probability of accepting a good backfill was 95% or better for a test error that was at or below 900 ohm-cm.
N = 2
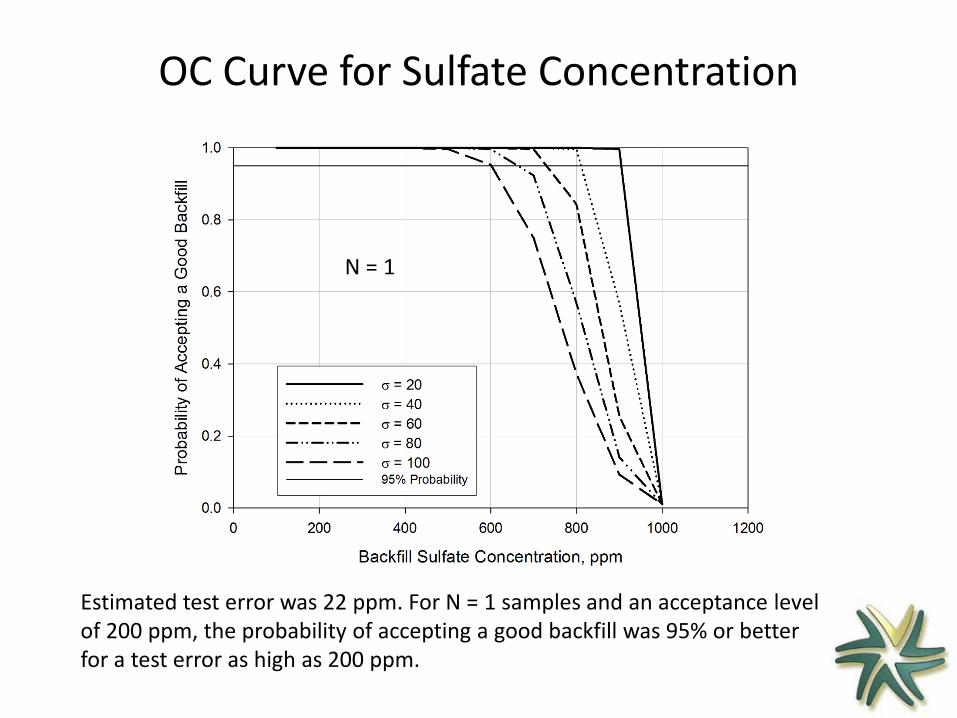
OC Curve for Sulfate Concentration
Estimated test error was 22 ppm. For N = 1 samples and an acceptance level of 200 ppm, the probability of accepting a good backfill was 95% or better for a test error as high as 200 ppm.
N = 1
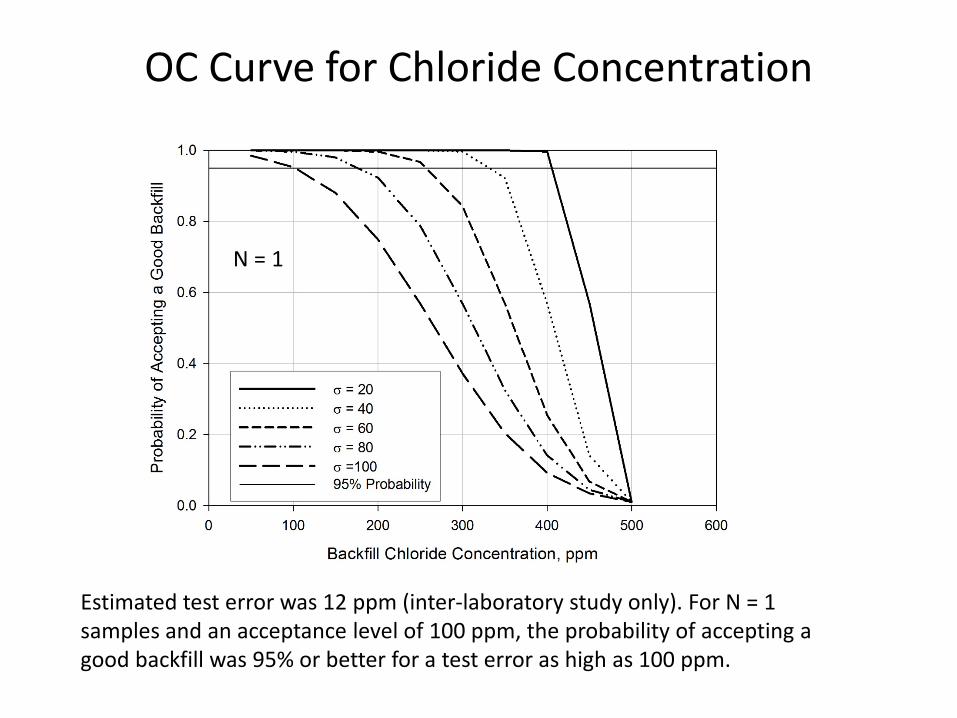
OC Curve for Chloride Concentration
Estimated test error was 12 ppm (inter-laboratory study only). For N = 1 samples and an acceptance level of 100 ppm, the probability of accepting a good backfill was 95% or better for a test error as high as 100 ppm.
N = 1
Recommendations
• Revise the FMs for pH, minimum resistivity, chloride, and sulfate;
• Increase the number of independent samples per soil type for pH and minimum resistivity;
• Increase the acceptance limit for minimum resistivity from 3,000 to 4,000 ohm-cm;
• Conduct operator training and laboratory audits of corrosion FMs;
• Conduct a Florida-wide inter-laboratory study of revised FMs within a year of implementation; and
• Re-evaluate the FMs for chloride and sulfate after a two-year data collection period.