distribution, growth, and performance of microfinance ... · loan portfolio, deposit mobilization,...
TRANSCRIPT
FCND DP No. 114
FCND DISCUSSION PAPER NO. 114
Food Consumption and Nutrition Division
International Food Policy Research Institute 2033 K Street, N.W.
Washington, D.C. 20006 U.S.A. (202) 862–5600
Fax: (202) 467–4439
June 2001 FCND Discussion Papers contain preliminary material and research results, and are circulated prior to a full peer review in order to stimulate discussion and critical comment. It is expected that most Discussion Papers will eventually be published in some other form, and that their content may also be revised.
DISTRIBUTION, GROWTH, AND PERFORMANCE OF
MICROFINANCE INSTITUTIONS IN AFRICA, ASIA, AND LATIN AMERICA
Cécile Lapenu and Manfred Zeller
ii
ABSTRACT
How many microfinance institutions (MFIs) exist in the developing world? What
are their current performances? In 1999, an International Food Policy Research Institute
(IFPRI) team on microfinance conducted a survey on MFIs in Asia, Africa, and Latin
America in order to offer a new in-depth analysis on the distribution and performances of
MFIs at the international level.
A systematic sampling has been adopted through the contacting of international
NGOs and networks supporting various MFIs. The information has been complemented
by a review of publications and technical manuals on microfinance. The database of
MFIs from 85 developing countries shows 1,500 institutions (790 institutions worldwide
plus 688 in Indonesia) supported by international organizations. They reach 54 million
members, 44 million savers (voluntary and compulsory savings), and 23 million
borrowers. The total volume of outstanding credit is $18 billion. The total savings
volume is $12 billion, or 72 percent of the volume of the outstanding loans. MFIs have
developed at least 46,000 branches and employ around 175,000 staff.
The IFPRI database underlines the presence of a multitude of MFIs that, except in
unstable countries, are widespread, with no forgotten regions. MFIs are very diverse in
terms of lending technologies and legal status, which allows room for innovation, but
they remain highly concentrated. The data are analyzed by type of MFIs and by
geographic regions. The results presented give an overview of the current development of
MFIs and offer a benchmark for comparisons.
iii
CONTENTS
Acknowledgments............................................................................................................... v 1. Introduction..................................................................................................................... 1 2. Methodology................................................................................................................... 2
Difficulties of an International Overview and Previous Experiences............................. 2 Nature of the Information ............................................................................................... 3
Source of information ................................................................................................. 3 Selection...................................................................................................................... 6 Limitations of the Data ............................................................................................... 8
3. Global Overview of MFIs in the Developing World ...................................................... 9
Volume of Activities....................................................................................................... 9 Average Performance of MFIs...................................................................................... 11 Size of the MFIs............................................................................................................ 13 Distribution of MFIs, by Country ................................................................................. 14
4. Role and Performance of MFIs, by Type of Technology and Legal Status ................. 15
Type of MFIs, by Technology ...................................................................................... 15 Type of MFIs, by Legal Status ..................................................................................... 22
5. Role and Performance of MFIs, by Location................................................................ 24
Rural and Urban MFIs .................................................................................................. 24 MFIs, by Continent ....................................................................................................... 27
6. Summary and Conclusions ........................................................................................... 31 References......................................................................................................................... 34
TABLES 1 Achievements of the main inventories.....................................................................3
2 List of international NGOs contacted ......................................................................5
iv
3 List of networks contacted .......................................................................................6
4 Overview of the volume of activities of MFIs in the developing world................10
5 Average performance of MFIs in the developing world........................................12
6 Distribution of MFIs, by number of members .......................................................13
7 Criteria of the typology of MFI structure ..............................................................16
8 Distribution of activities, by type of MFI (including Indonesia), in percent .........19
9 Distribution of activities, by type of MFI (excluding Indonesia), in percent ........20
10 Outreach, by type of MFI.......................................................................................21
11 Regulation of MFIs according to size in number of members (percent) ...............23
12 Volume of activities of MFIs, by geographic location (including Indonesia), in percent.............................................................................................25
13 Volume of activities of MFIs, by continent (including Indonesia)........................27
14 Total population and average per capita GNP, by continent .................................27
15 Volume of activities of MFIs, by continent (excluding Indonesia) .......................28
16 Average performance of MFIs, by continent .........................................................28
FIGURES
1 Staff productivity, by type of MFI.........................................................................20
2 Staff productivity, by location ...............................................................................26
3 Staff productivity, by continent .............................................................................29
4 Size of loans and deposits ......................................................................................30
v
ACKNOWLEDGMENTS
This research emanates from the multicountry research program on rural finance
by the International Food Policy Research Institute (IFPRI). We thank Aliou Diagne and
Manohar Sharma of IFPRI, Franz Heidhues of Hohenheim University, and an anonymous
reviewer for their comments. The financial support of the German Federal Ministry for
Economic Cooperation and Development and of the French Minister of Foreign Affairs is
gratefully acknowledged. Finally, we thank the international and national MFI networks
as well as MFI donors for providing data. The paper is excerpted from an unpublished
report to the Federal Ministry for Economic Cooperation and Development, Germany.
Cécile Lapenu Comité d’Echange, de Réflexion et d’Information sur les Systèmes d’Epargne-crédit (CERISE), Paris Manfred Zeller University of Goettingen, Germany
1
1. INTRODUCTION
How many microfinance institutions (MFIs) are there in the developing world?
Where are they located? How many households do they reach? How well do they do in
terms of repayment and outreach? While there have been previous efforts to inventory
MFIs and to look for commonalities in their development and performance, the answers
to these questions are still not fully known. In 1999, the International Food Policy
Research Institute (IFPRI) team on microfinance conducted a survey of MFIs in Asia,
Africa, and Latin America (summarized in Section 1). This study builds on that work and
offers further clarification of the world of MFIs by giving a detailed analysis of the
distribution, growth, and performance of the MFIs supported by donor organizations and
addressing some of the recurring questions on their roles. The questions are analyzed for
all the institutions of the sample (Section 2), by type of institutions, i.e., lending
technology and legal status (Section 3), and by geographic location, i.e., rural or urban
and continent (Section 4). Issues are addressed at an aggregated level, which requires
readers to consider the observations with caution. However, the results give benchmarks
for the purpose of making comparisons and can help identify questions to be pursued
through further research.
2
2. METHODOLOGY
DIFFICULTIES OF AN INTERNATIONAL OVERVIEW AND PREVIOUS EXPERIENCES
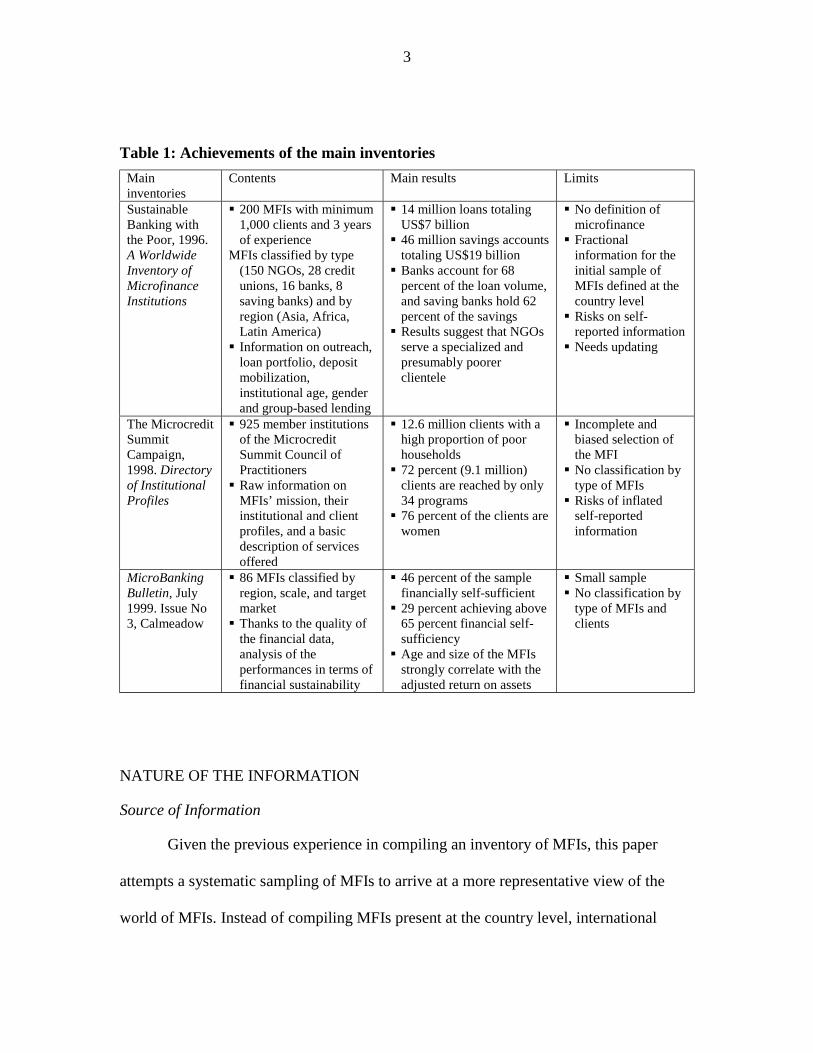
Three major documents provide an overview of MFIs (see Table 1): the
Sustainable Banking with the Poor Inventory, A Worldwide Inventory of Microfinance
Institutions (1996), the Microcredit Summit Directory of Institutional Profiles (1998),
and Calmeadow’s Microbanking Bulletin (July 1999). However, some limits exist in the
information provided by these inventories.
Other inventories exist, but only at regional or national levels. The PA-
SMEC/BIT/BCEAO Database for West Africa (1998) or the Credit and Development
Forum Statistics (1998) for Bangladesh offer interesting information to supplement a
worldwide inventory of MFIs. Case studies offer more detailed data and analysis about
some innovative or well-known MFIs. The Food and Agriculture Organization of the
United Nations (FAO) recently launched a Web site called AgriBankStat1; however, the
inventory focuses on licensed financial institutions and excludes intentionally
unregulated financial institutions. The target group of this inventory does not focus on
MFIs.
1 http://www.fao.org/waicent/faoinfo/agricult/ags/agsm/banks/invent.htm
3
Table 1: Achievements of the main inventories Main inventories
Contents Main results Limits
Sustainable Banking with the Poor, 1996. A Worldwide Inventory of Microfinance Institutions
! 200 MFIs with minimum 1,000 clients and 3 years of experience
MFIs classified by type (150 NGOs, 28 credit unions, 16 banks, 8 saving banks) and by region (Asia, Africa, Latin America) ! Information on outreach,
loan portfolio, deposit mobilization, institutional age, gender and group-based lending
! 14 million loans totaling US$7 billion ! 46 million savings accounts
totaling US$19 billion ! Banks account for 68
percent of the loan volume, and saving banks hold 62 percent of the savings ! Results suggest that NGOs
serve a specialized and presumably poorer clientele
! No definition of microfinance ! Fractional
information for the initial sample of MFIs defined at the country level ! Risks on self-
reported information ! Needs updating
The Microcredit Summit Campaign, 1998. Directory of Institutional Profiles
! 925 member institutions of the Microcredit Summit Council of Practitioners ! Raw information on
MFIs’ mission, their institutional and client profiles, and a basic description of services offered
! 12.6 million clients with a high proportion of poor households ! 72 percent (9.1 million)
clients are reached by only 34 programs ! 76 percent of the clients are
women
! Incomplete and biased selection of the MFI ! No classification by
type of MFIs ! Risks of inflated
self-reported information
MicroBanking Bulletin, July 1999. Issue No 3, Calmeadow
! 86 MFIs classified by region, scale, and target market ! Thanks to the quality of
the financial data, analysis of the performances in terms of financial sustainability
! 46 percent of the sample financially self-sufficient ! 29 percent achieving above
65 percent financial self-sufficiency ! Age and size of the MFIs
strongly correlate with the adjusted return on assets
! Small sample ! No classification by
type of MFIs and clients
NATURE OF THE INFORMATION
Source of Information
Given the previous experience in compiling an inventory of MFIs, this paper
attempts a systematic sampling of MFIs to arrive at a more representative view of the
world of MFIs. Instead of compiling MFIs present at the country level, international
4
nongovernmental organizations (NGOs) (Table 2) and networks supporting various MFIs
(Table 3) were contacted.2 By contacting Acción International, for example, the authors
could collect information on all MFIs the organization supports.
The international NGOs and networks were asked to send information concerning
their activities in the field of microfinance: countries where they work; by country and
project the type of MFIs promoted (e.g., solidarity groups, village banks, cooperatives,
etc.) with a definition of each type of structure; area targeted (rural, urban, mixed);
number of staff; number of clients (members, borrowers, savers); volume of savings and
outstanding loans; average size of the loans; repayment rate; donors; and complementary
services provided.
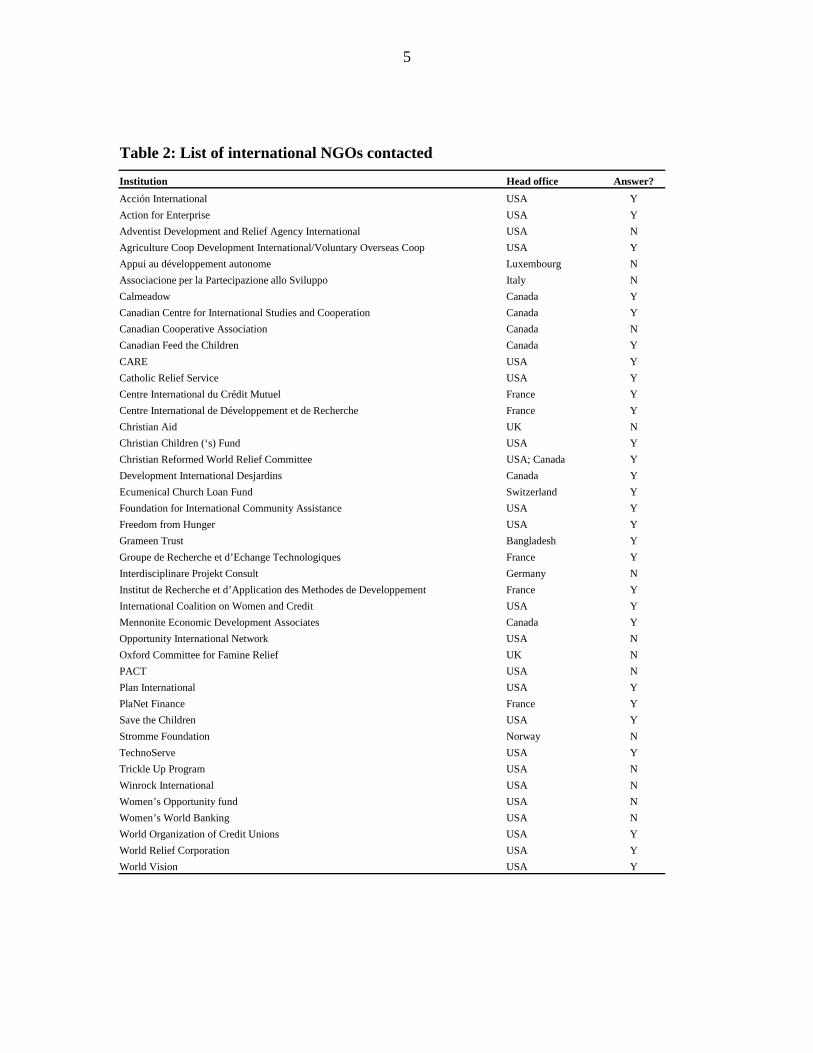
Of the 42 international NGOs contacted, 28 (67 percent) responded (Table 2).3 In
some cases, information from the NGOs that did not respond was obtained through other
means, such as case studies or publications.
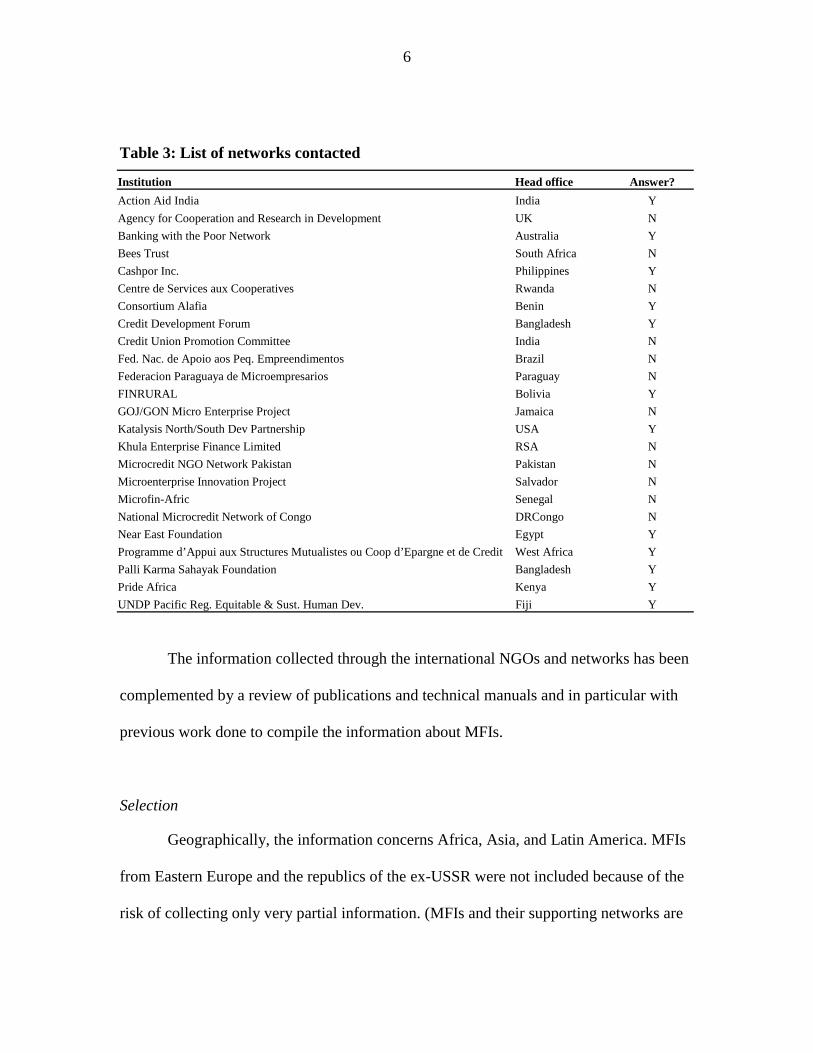
Of the 24 networks contacted, 12 (50 percent) responded (Table 3). Though only
half of them responded, the information provided a broad overview of MFIs by region or
country. Most of the networks that did not answer are national networks with more
limited coverage of institutions.
2 Source of information for the lists of NGOs and networks: Web sites of well-known NGOs and network, Microcredit Summit Directory of Institutional profiles, Pôle Microfinancement (http://www.cirad.fr/ mcredit/present.html), publications on case studies, IFPRI contacts. 3Some NGOs replied, but as they had not compiled information on all their projects around the world, it was difficult for them to provide the requested information.
5
Table 2: List of international NGOs contacted
Institution Head office Answer? Acción International USA Y Action for Enterprise USA Y Adventist Development and Relief Agency International USA N Agriculture Coop Development International/Voluntary Overseas Coop USA Y Appui au développement autonome Luxembourg N Associacione per la Partecipazione allo Sviluppo Italy N Calmeadow Canada Y Canadian Centre for International Studies and Cooperation Canada Y Canadian Cooperative Association Canada N Canadian Feed the Children Canada Y CARE USA Y Catholic Relief Service USA Y Centre International du Crédit Mutuel France Y Centre International de Développement et de Recherche France Y Christian Aid UK N Christian Children (‘s) Fund USA Y Christian Reformed World Relief Committee USA; Canada Y Development International Desjardins Canada Y Ecumenical Church Loan Fund Switzerland Y Foundation for International Community Assistance USA Y Freedom from Hunger USA Y Grameen Trust Bangladesh Y Groupe de Recherche et d’Echange Technologiques France Y Interdisciplinare Projekt Consult Germany N Institut de Recherche et d’Application des Methodes de Developpement France Y International Coalition on Women and Credit USA Y Mennonite Economic Development Associates Canada Y Opportunity International Network USA N Oxford Committee for Famine Relief UK N PACT USA N Plan International USA Y PlaNet Finance France Y Save the Children USA Y Stromme Foundation Norway N TechnoServe USA Y Trickle Up Program USA N Winrock International USA N Women’s Opportunity fund USA N Women’s World Banking USA N World Organization of Credit Unions USA Y World Relief Corporation USA Y World Vision USA Y
6
Table 3: List of networks contacted
Institution Head office Answer? Action Aid India India Y Agency for Cooperation and Research in Development UK N Banking with the Poor Network Australia Y Bees Trust South Africa N Cashpor Inc. Philippines Y Centre de Services aux Cooperatives Rwanda N Consortium Alafia Benin Y Credit Development Forum Bangladesh Y Credit Union Promotion Committee India N Fed. Nac. de Apoio aos Peq. Empreendimentos Brazil N Federacion Paraguaya de Microempresarios Paraguay N FINRURAL Bolivia Y GOJ/GON Micro Enterprise Project Jamaica N Katalysis North/South Dev Partnership USA Y Khula Enterprise Finance Limited RSA N Microcredit NGO Network Pakistan Pakistan N Microenterprise Innovation Project Salvador N Microfin-Afric Senegal N National Microcredit Network of Congo DRCongo N Near East Foundation Egypt Y Programme d’Appui aux Structures Mutualistes ou Coop d’Epargne et de Credit West Africa Y Palli Karma Sahayak Foundation Bangladesh Y Pride Africa Kenya Y UNDP Pacific Reg. Equitable & Sust. Human Dev. Fiji Y
The information collected through the international NGOs and networks has been
complemented by a review of publications and technical manuals and in particular with
previous work done to compile the information about MFIs.
Selection
Geographically, the information concerns Africa, Asia, and Latin America. MFIs
from Eastern Europe and the republics of the ex-USSR were not included because of the
risk of collecting only very partial information. (MFIs and their supporting networks are
7
rather new, and often different from those in Asia, Africa, and Latin America.) MFIs
from countries with per capita GDPs above $5,000 were also excluded.4
In terms of size, MFIs that have been included have at least 500 members and/or
100 borrowers when they have been founded before 1996. All MFIs founded from 1996
to December 1998 have been integrated, whatever their size.
As the idea is to concentrate on microfinance, it was essential to fix a limit in
terms of size of the financial services offered. Any limit can look rather arbitrary, and
ideally it should vary between the different countries concerned. The authors decided an
amount that can be substantial to support a family’s microenterprise, but that may appear
insignificant for a bigger enterprise with a large amount of capital or many employees. In
the sample, an average loan size of less than $1,000 was used as a somewhat crude cutoff
point to distinguish microfinance from commercial loans.5 All of the selected MFIs
receive some form of international support, either through funding, technical assistance,
or information dissemination.6
4 The only exceptions are Argentina and Uruguay with per capita GDPs of $8,380 and $5,760, respectively, which have been kept so that the whole continent of Latin America could be analyzed. 5 Based on this, institutions such as PAME/AGETIP Senegal, Wages/CARE Togo, ADMIC Mexico, and Caja Social Colombia have been excluded due to their average loan sizes of $3,350, $2,800, $2,600, and $2,300, respectively. 6 In the case of Bangladesh, where the Credit Development Forum collected an impressive amount of data on microfinance NGOs, we kept the NGOs receiving at least 10 percent of their funding from international donors. In Indonesia, the local system of MFIs is impressive, with around 7,000 rural banks, some of which have been in operation since 1895 (Lapenu 1998). However, most institutions, such as the BKD (village banks), are locally owned and financed. We took into account the institutions that receive support from donors (ADB, USAID). These still number more than 680 institutions (or nearly 50 percent of the entire sample).
8
This mode of sampling underestimates local initiatives and national programs. It
also underestimates national associations and foundations, informal systems, and
agricultural or microenterprise cooperatives, all of which offer credit and saving services
to their members. There were reasons for this choice, however. First, national
implementations are more difficult to list exhaustively. Second, the aim of this synthesis
is to offer an overview of the role of donors and the international community in the
development of MFIs. Finally, except for the informal credit and saving associations or
for some specific countries, microfinance development still remains a largely
internationally-driven initiative.
Limitations of the Data
Of course, the task of providing a worldwide inventory of microfinance is
condemned to be partial, and many MFIs will always be missing. From the institutions
listed in the database, there is also missing data. When average sizes of the loans are not
provided, there is a risk of misclassifying institutions, i.e., some may offer loans that
average over $1,000. Moreover, missing data on the number of clients or volume of
credit and savings lead to underestimates of the volume of activity. However, the larger
the sample, the more accurate the overall picture, and with a sample of more than 1,000
MFIs, we have minimized the limitations caused by missing information. As with every
inventory, it will be necessary to update the information regularly. This will, of course,
create the opportunity to further refine the data.
9
In terms of reliability of the information, most of the data was self-reported by the
MFIs or the network they belong to. However, when the information comes from
supporting institutions, we assume that the accuracy of the data was checked by the
supporting institution. Given the difficulties of obtaining accurate and comparable
information based on accounting data or level of poverty of the clients, no information
has been recorded on costs, sustainability, or profile of the clients. The distinction
between rural and urban areas comes from MFIs’ self-assessment rather than a strict
definition. Finally, the years of the data may differ (50 percent are from 1998, 39 percent
from 1997, 4 percent from 1996, and the remaining 7 percent from 1992 to 1995, and
1999) but they give a general overview of the volume of microfinance activity.
3. GLOBAL OVERVIEW OF MFIs IN THE DEVELOPING WORLD
VOLUME OF ACTIVITIES
This database of MFIs7 from 85 developing countries shows 1,500 institutions
(790 institutions worldwide plus 688 in Indonesia) supported by international
organizations (Table 4). They reach 54 million members, 44 million savers, and 17
7 See Lapenu 2000.
10
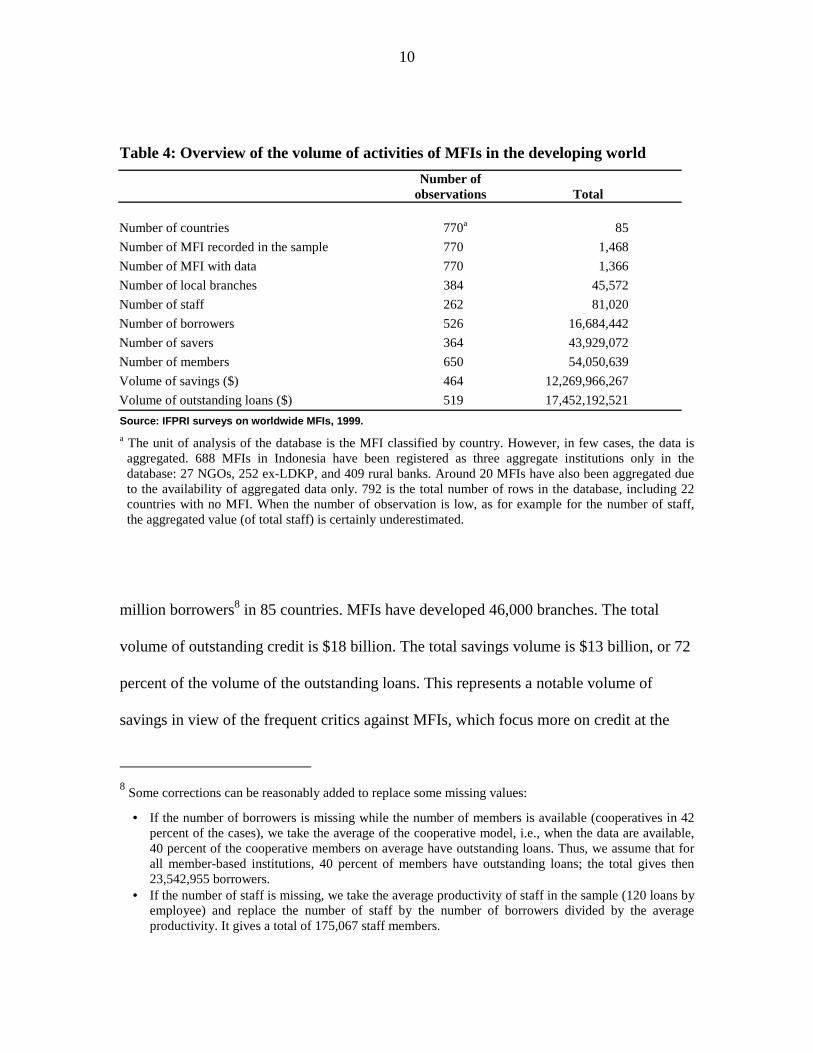
Table 4: Overview of the volume of activities of MFIs in the developing world
Number of
observations Total Number of countries 770a 85 Number of MFI recorded in the sample 770 1,468 Number of MFI with data 770 1,366 Number of local branches 384 45,572 Number of staff 262 81,020 Number of borrowers 526 16,684,442 Number of savers 364 43,929,072 Number of members 650 54,050,639 Volume of savings ($) 464 12,269,966,267 Volume of outstanding loans ($) 519 17,452,192,521 Source: IFPRI surveys on worldwide MFIs, 1999. a The unit of analysis of the database is the MFI classified by country. However, in few cases, the data is
aggregated. 688 MFIs in Indonesia have been registered as three aggregate institutions only in the database: 27 NGOs, 252 ex-LDKP, and 409 rural banks. Around 20 MFIs have also been aggregated due to the availability of aggregated data only. 792 is the total number of rows in the database, including 22 countries with no MFI. When the number of observation is low, as for example for the number of staff, the aggregated value (of total staff) is certainly underestimated.
million borrowers8 in 85 countries. MFIs have developed 46,000 branches. The total
volume of outstanding credit is $18 billion. The total savings volume is $13 billion, or 72
percent of the volume of the outstanding loans. This represents a notable volume of
savings in view of the frequent critics against MFIs, which focus more on credit at the
8 Some corrections can be reasonably added to replace some missing values:
• If the number of borrowers is missing while the number of members is available (cooperatives in 42 percent of the cases), we take the average of the cooperative model, i.e., when the data are available, 40 percent of the cooperative members on average have outstanding loans. Thus, we assume that for all member-based institutions, 40 percent of members have outstanding loans; the total gives then 23,542,955 borrowers.
• If the number of staff is missing, we take the average productivity of staff in the sample (120 loans by employee) and replace the number of staff by the number of borrowers divided by the average productivity. It gives a total of 175,067 staff members.
11
expense of savings mobilization. Of course, if MFIs were to distribute loans from the
mobilized savings, the current amount is still insufficient.
If the figures are viewed from the perspective of the population of developing
countries, the global outreach of microfinance can be summarized as follows: on average
for developing countries,9 1.5 percent of the total population are MFI members. The
volume of credit disbursed is around $5 per inhabitant and $3 per inhabitant are
mobilized as savings.
AVERAGE PERFORMANCE OF MFIs
Repayment rates, as reported in the questionnaires, appear quite high at 91 percent
(Table 5). If weighted by the loan volume, the rate increases to 98 percent, implying that
MFIs with larger loan volumes, i.e., larger MFIs, seem to have better repayment rates
than smaller MFIs. On average, it seems that staff productivity in number of loans is
relatively low, with 120 borrowers per employee, and a portfolio of $20,000 of credit and
$10,000 of savings. By contrast, the figures for banks average 187 borrowers per
employee, with $50,000 of credit and $16,000 of deposits.
It is difficult to evaluate the depth of outreach of the MFIs at such an aggregated
level. However, the available data include three proxy variables by which to assess the
access by the poor to the financial services: percentage of women clients, average loan
size, and average deposit size. The unweighted figure suggests a high outreach to women
9 Average for the whole sample aggregated by country and weighted by national population.
12
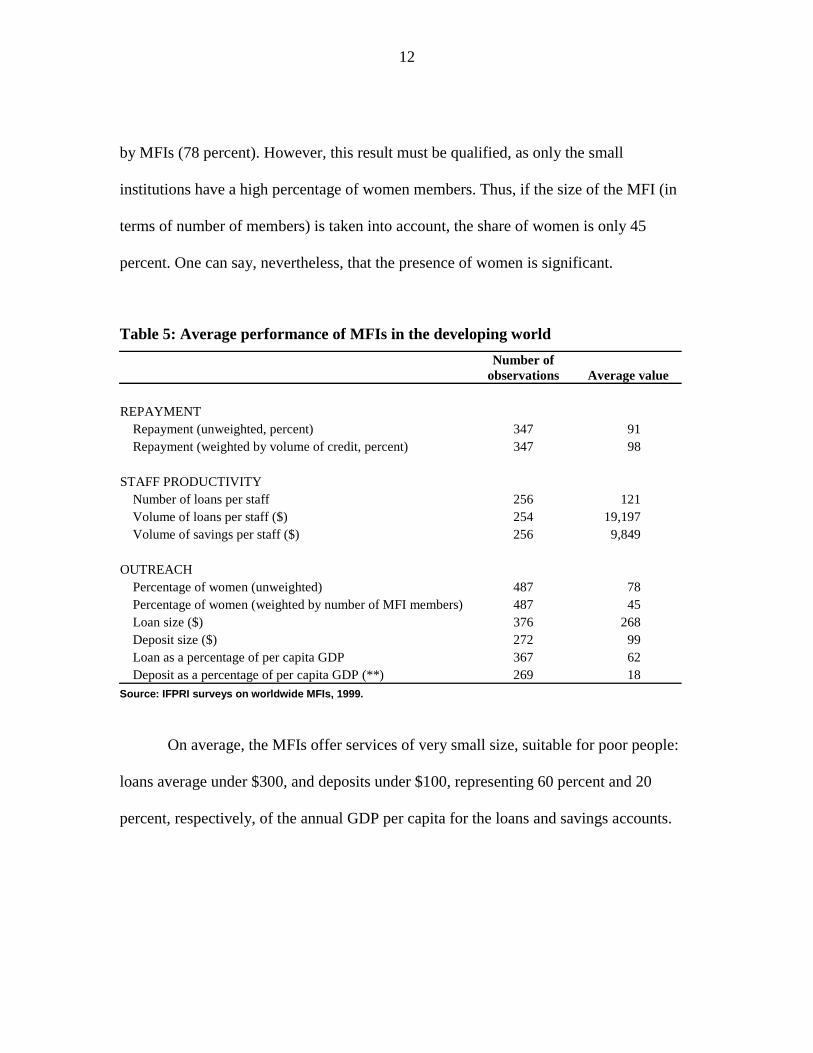
by MFIs (78 percent). However, this result must be qualified, as only the small
institutions have a high percentage of women members. Thus, if the size of the MFI (in
terms of number of members) is taken into account, the share of women is only 45
percent. One can say, nevertheless, that the presence of women is significant.
Table 5: Average performance of MFIs in the developing world
Number of
observations Average value REPAYMENT Repayment (unweighted, percent) 347 91 Repayment (weighted by volume of credit, percent) 347 98 STAFF PRODUCTIVITY Number of loans per staff 256 121 Volume of loans per staff ($) 254 19,197 Volume of savings per staff ($) 256 9,849 OUTREACH Percentage of women (unweighted) 487 78 Percentage of women (weighted by number of MFI members) 487 45 Loan size ($) 376 268 Deposit size ($) 272 99 Loan as a percentage of per capita GDP 367 62 Deposit as a percentage of per capita GDP (**) 269 18 Source: IFPRI surveys on worldwide MFIs, 1999.
On average, the MFIs offer services of very small size, suitable for poor people:
loans average under $300, and deposits under $100, representing 60 percent and 20
percent, respectively, of the annual GDP per capita for the loans and savings accounts.
13
SIZE OF THE MFIs
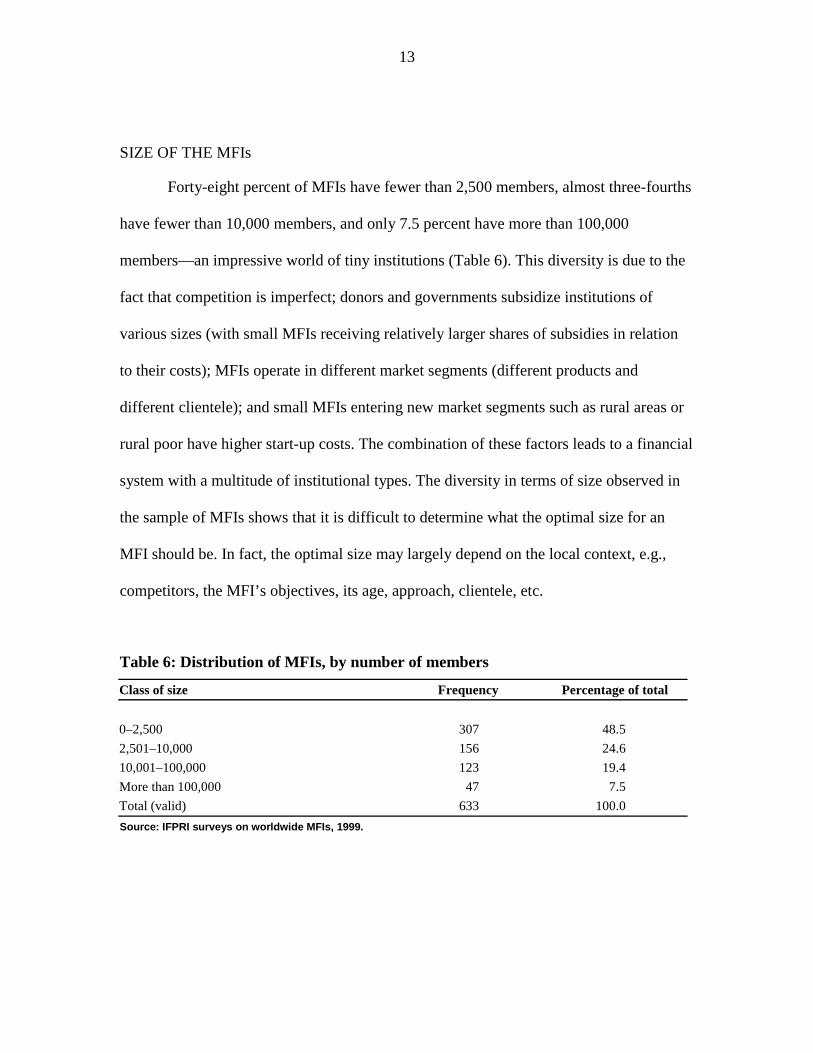
Forty-eight percent of MFIs have fewer than 2,500 members, almost three-fourths
have fewer than 10,000 members, and only 7.5 percent have more than 100,000
members—an impressive world of tiny institutions (Table 6). This diversity is due to the
fact that competition is imperfect; donors and governments subsidize institutions of
various sizes (with small MFIs receiving relatively larger shares of subsidies in relation
to their costs); MFIs operate in different market segments (different products and
different clientele); and small MFIs entering new market segments such as rural areas or
rural poor have higher start-up costs. The combination of these factors leads to a financial
system with a multitude of institutional types. The diversity in terms of size observed in
the sample of MFIs shows that it is difficult to determine what the optimal size for an
MFI should be. In fact, the optimal size may largely depend on the local context, e.g.,
competitors, the MFI’s objectives, its age, approach, clientele, etc.
Table 6: Distribution of MFIs, by number of members
Class of size Frequency Percentage of total 0–2,500 307 48.5 2,501–10,000 156 24.6 10,001–100,000 123 19.4 More than 100,000 47 7.5 Total (valid) 633 100.0 Source: IFPRI surveys on worldwide MFIs, 1999.
14
The world of MFI is highly concentrated: MFIs with more than 300,000 members
(19 institutions in the database) account for 44 million members, i.e., 3 percent of the
MFIs serve more than 80 percent of the total number of members!10 This extreme
concentration underscores the current difficulty to significantly and rapidly increase
MFIs’ breadth of outreach. It will be necessary to support MFIs and to innovate so that
they can reach a significant scale in terms of number of clients and volume of activity.
DISTRIBUTION OF MFIs, BY COUNTRY
With at least 85 countries having MFIs, there is a wide distribution of various
microfinance models, with Latin America and East Asia particularly well served. Among
the large countries that do not have any MFIs with international support are countries
involved in conflicts (Algeria, Somalia, Angola, and Sudan) or countries that receive less
international support for political reasons (Cuba, North Korea, Iran, Iraq, and Libya). The
same reasons apply for a number of countries that have very low outreach (Democratic
Republic of Congo, Afghanistan, Myanmar, Pakistan, and Liberia reach less than 0.1
percent of the population). A minimum of political and economic stability is required for
MFIs to develop. However, low outreach figures (less than 0.1 percent) are also observed
in countries with high populations (China, India, Nigeria, Egypt).
Latin America and East Asia are particularly active for microfinance. The
“giants” in terms of absolute number of members reached are found in Asia: Indonesia,
10 The 19 MFIs serve 81.1 percent of the members in the database.
15
Bangladesh, Thailand, Viet Nam, Sri Lanka, and India. In Latin America, Colombia,
Ecuador, Bolivia, Mexico, Uruguay, and Honduras account for the largest number of
members. In Africa, Eastern and Southern Africa (Kenya, Uganda, Zimbabwe, and
Zambia) are particularly dynamic as well as the CFA-franc zone (Mali, Benin, Burkina
Faso, Ivory Coast, and Togo).
The largest distribution of loans and mobilization of savings in terms of GNP are
recorded in South East Asia (Thailand, Bangladesh, Viet Nam, and Indonesia), Latin
America (Bolivia, Honduras, Panama, Jamaica, and Colombia) and East and West Africa
(Kenya, Togo, Benin, Mali, and Burkina Faso).
4. ROLE AND PERFORMANCE OF MFIs, BY TYPE OF TECHNOLOGY AND LEGAL STATUS
TYPE OF MFIs, BY TECHNOLOGY
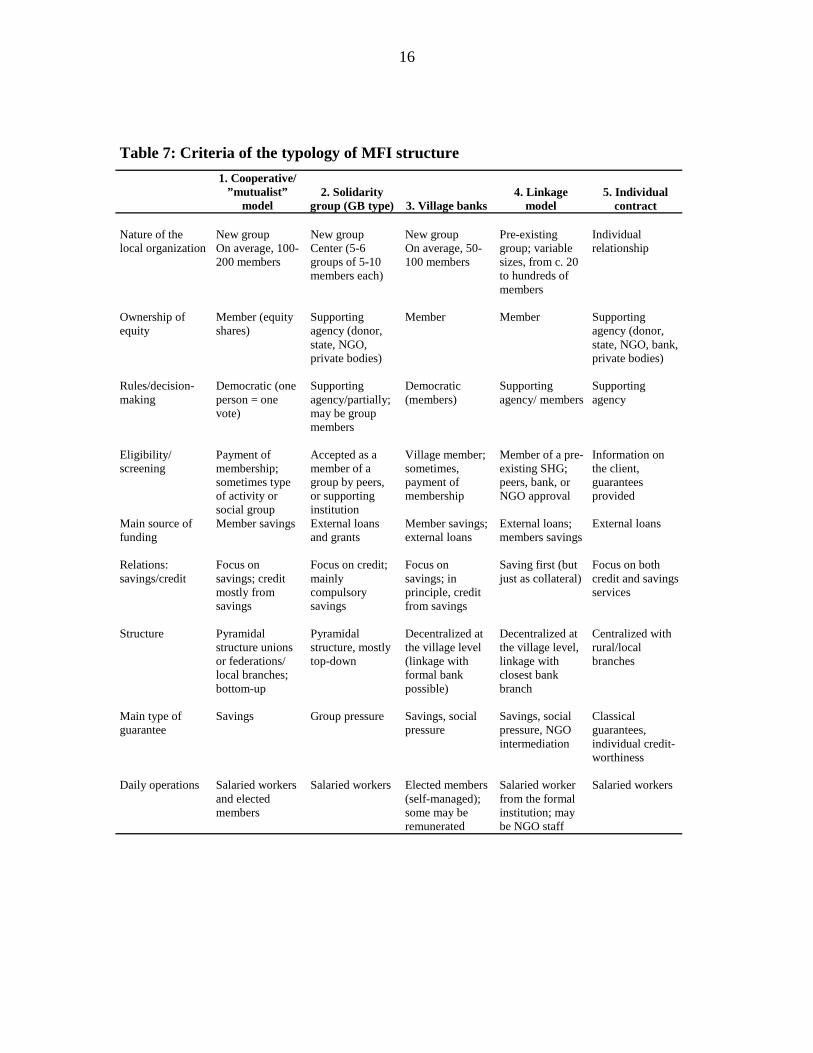
The MFIs have been classified into five major types, according to the main
technology they use to provide financial services (see Table 7): cooperatives, solidarity
groups, village banks, individual contracts, and linkage models. Some MFIs combine
different approaches, e.g., individual and solidarity group models. These have been
classified as mixed.11
11 One-hundred-and-fifty institutions of unknown type have been excluded from Table 7.
16
Table 7: Criteria of the typology of MFI structure 1. Cooperative/
”mutualist” model
2. Solidarity group (GB type) 3. Village banks
4. Linkage model
5. Individual contract
Nature of the local organization
New group On average, 100-200 members
New group Center (5-6 groups of 5-10 members each)
New group On average, 50-100 members
Pre-existing group; variable sizes, from c. 20 to hundreds of members
Individual relationship
Ownership of equity
Member (equity shares)
Supporting agency (donor, state, NGO, private bodies)
Member Member Supporting agency (donor, state, NGO, bank, private bodies)
Rules/decision-making
Democratic (one person = one vote)
Supporting agency/partially; may be group members
Democratic (members)
Supporting agency/ members
Supporting agency
Eligibility/ screening
Payment of membership; sometimes type of activity or social group
Accepted as a member of a group by peers, or supporting institution
Village member; sometimes, payment of membership
Member of a pre-existing SHG; peers, bank, or NGO approval
Information on the client, guarantees provided
Main source of funding
Member savings External loans and grants
Member savings; external loans
External loans; members savings
External loans
Relations: savings/credit
Focus on savings; credit mostly from savings
Focus on credit; mainly compulsory savings
Focus on savings; in principle, credit from savings
Saving first (but just as collateral)
Focus on both credit and savings services
Structure Pyramidal structure unions or federations/ local branches; bottom-up
Pyramidal structure, mostly top-down
Decentralized at the village level (linkage with formal bank possible)
Decentralized at the village level, linkage with closest bank branch
Centralized with rural/local branches
Main type of guarantee
Savings Group pressure Savings, social pressure
Savings, social pressure, NGO intermediation
Classical guarantees, individual credit-worthiness
Daily operations Salaried workers and elected members
Salaried workers Elected members (self-managed); some may be remunerated
Salaried worker from the formal institution; may be NGO staff
Salaried workers
17
The largest MFIs are the cooperative and individual models, with a smaller
number among the solidarity groups. The linkage system and the village banks remain
small, most of which have fewer than 50,000 members.
If the size of MFIs is analyzed by type, the results can be summarized as follows:
• Cooperatives: Very few cooperatives have under 1,000 members (10 percent of
the sample of cooperative MFIs); many have 10,000 to 200,000 members. In fact,
most cooperatives were formed more than ten years ago, and unsuccessful ones
have vanished.
• Solidarity groups: 37 percent have fewer than 1,000 members; 93.7 percent have
fewer than 50,000 members. It seems to be a difficult task for solidarity groups to
grow to a large scale, which is probably due to their geographical location—50
percent are located in rural areas, and 40 percent are in Africa (IFPRI surveys
1999), where low population density and poor infrastructure may limit their
development. All solidarity group MFIs with more than 300,000 members are in
Asia: BAAC (Thailand); Grameen Bank, BRAC, PROSHIKA, ASA
(Bangladesh); Friends of Women’s World Banking (India); Viet Nam Bank for
the Poor; and P4K (Indonesia). Higher scales of operation can be achieved in
densely populated areas, whereas lower scales tend to gain competitive advantage
in areas with lower density. Finally, there is no justification for solidarity group
systems if the population density is very low (mainly due to cost of staff and
18
transaction costs related to transport). In this case, village bank and linkage
models that rely on endogenous and voluntary organization become more
attractive.
• Village banks and linkage: None of the village banks has more than 25,000
members. Except for the Self-Help Development Foundation/CARE, Zimbabwe,
with 300,000 members, no linkage system has more than 30,000 members. By
definition, village banks and linkage models are local organizations that tend by
nature to remain smaller scale, though they are linked to the formal banking
network or their own federations.
• Individual: Most MFIs have fewer than 30,000 members.12 Three institutions
have more than 80,000 members: BRI-UD Indonesia (18 million), Viet Nam
Banks for Agriculture and Rural Development (4 million), and CERUDEB
Uganda (86,000). Due to management costs, individual lending is not well suited
to countries or regions with low income and low population densities.
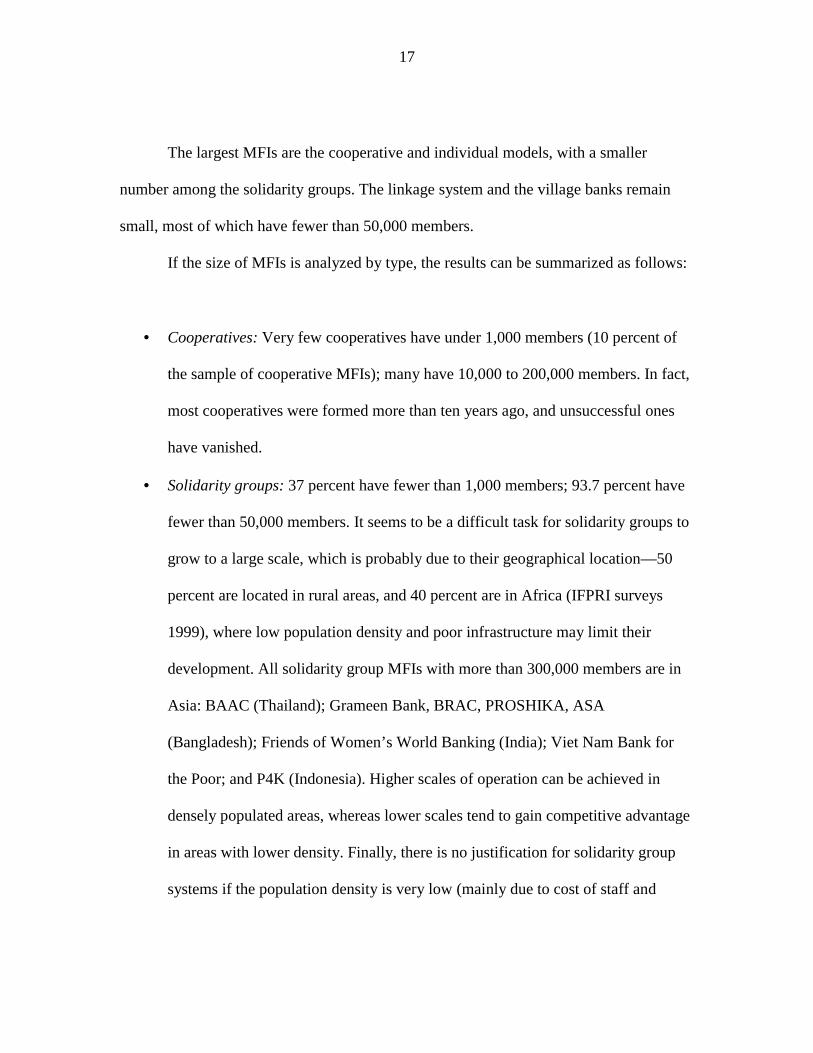
If Indonesian MFIs are included, the individual approach predominates in terms
of number of MFIs (Table 8). Next are solidarity groups and cooperatives. Members are
predominantly from MFIs with individual approach. Next are, at the same level,
cooperatives and group methodologies. The solidarity groups have the largest number of
12 In Indonesia, the 1992 Banking Act limited the geographical reach of rural banks, restricting them until 1997 to subdistricts, each of which encompasses, on average, 10 villages. Proposed changes to the regulatory framework will promote consolidation of smaller rural banks in larger ones.
19
borrowers. Even if the number of borrowers from the cooperative system was
underestimated due to a lack of data (see footnote 10, with data corrected based on
assumptions), it reveals a very active policy of lending for solidarity groups. The
cooperative model dominates for loans and savings volume (around 60 percent), followed
by the solidarity groups. In fact, the Indonesian individual MFIs are very numerous but,
except for the BRI, mostly represent very small institutions at the village level.
Table 8: Distribution of activities, by type of MFI (including Indonesia), in percent
Cooperative Solidarity
group Village bank
Individual contract
Linkage model
Mixed approach Total
Number of MFIs 11.9 16.4 7 58.3 4 2.4 100 Number of borrowers 9.9 67.8 1.8 17.9 0.3 2.3 100 Number of savers 31.2 25.9 0.5 41.7 0 0.6 100 Number of members 26.9 28 0.8 42.5 0.9 0.9 100 Volume of savings 60.5 28.9 0.1 10.4 0 0.1 100 Volume of credit 59.9 34.8 0.2 4.5 0 0.7 100 Source: IFPRI surveys on worldwide MFIs, 1999.
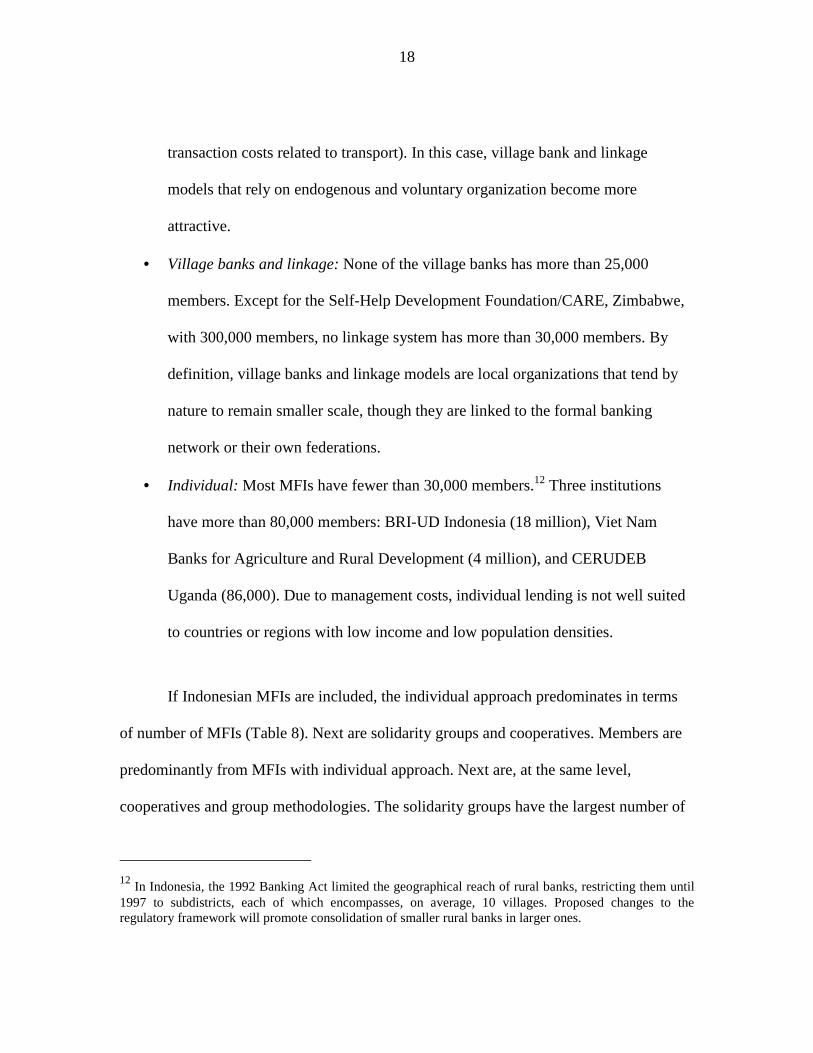
If Indonesian MFIs are excluded from the sample, solidarity groups dominate in
terms of number of MFIs and of borrowers (Table 9). The cooperatives are the most
important source for loans and for savings mobilization. Village banks account for an
important number of MFIs and of branches, and account for 12.5 percent of members, but
they remain very small in terms of volume.
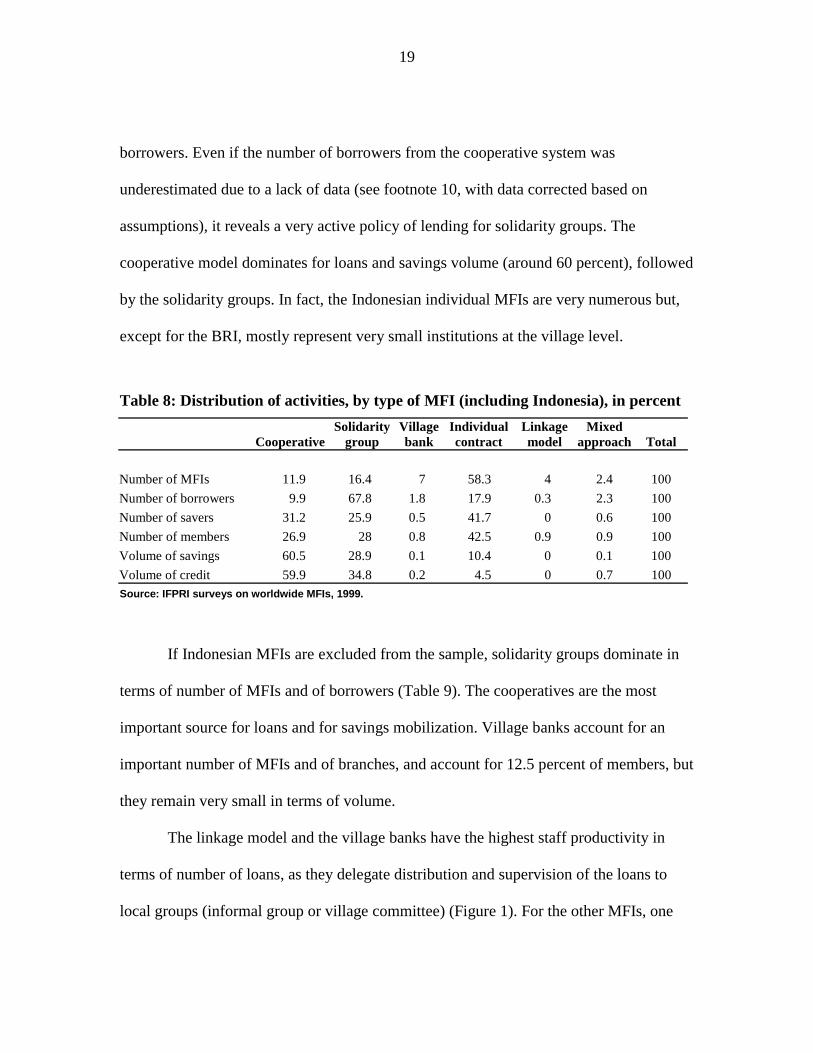
The linkage model and the village banks have the highest staff productivity in
terms of number of loans, as they delegate distribution and supervision of the loans to
local groups (informal group or village committee) (Figure 1). For the other MFIs, one
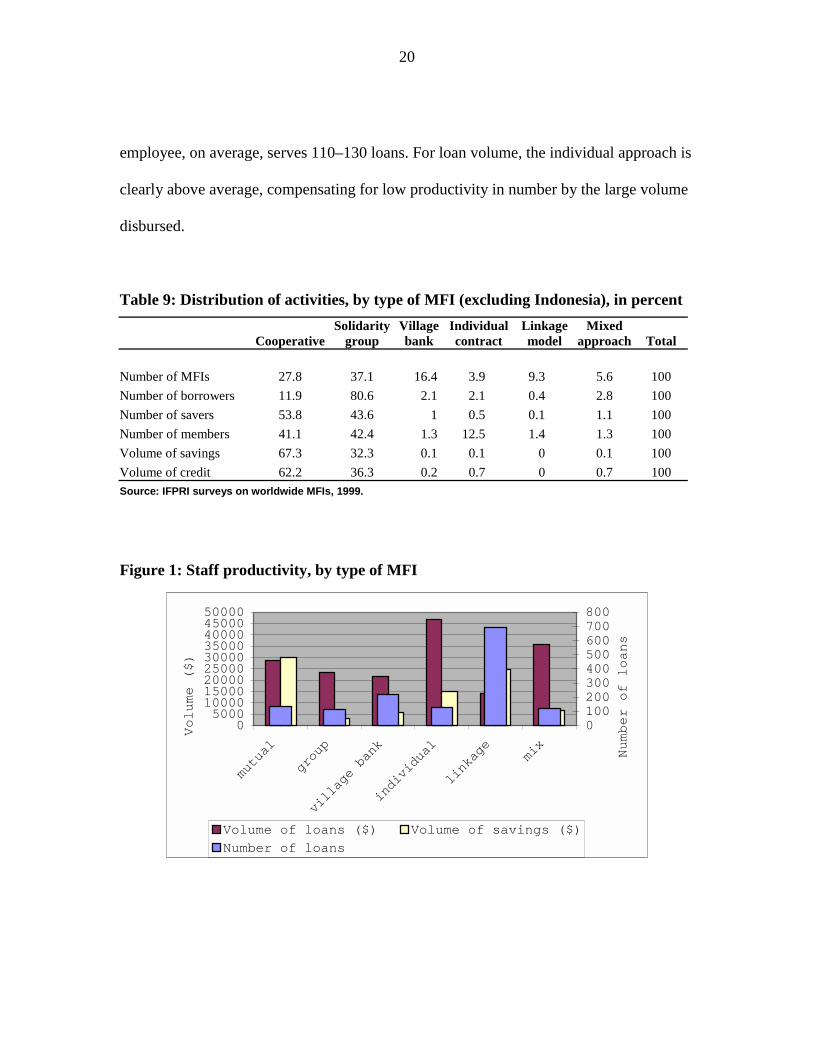
20
employee, on average, serves 110–130 loans. For loan volume, the individual approach is
clearly above average, compensating for low productivity in number by the large volume
disbursed.
Table 9: Distribution of activities, by type of MFI (excluding Indonesia), in percent
Cooperative Solidarity
group Village bank
Individual contract
Linkage model
Mixed approach Total
Number of MFIs 27.8 37.1 16.4 3.9 9.3 5.6 100 Number of borrowers 11.9 80.6 2.1 2.1 0.4 2.8 100 Number of savers 53.8 43.6 1 0.5 0.1 1.1 100 Number of members 41.1 42.4 1.3 12.5 1.4 1.3 100 Volume of savings 67.3 32.3 0.1 0.1 0 0.1 100 Volume of credit 62.2 36.3 0.2 0.7 0 0.7 100 Source: IFPRI surveys on worldwide MFIs, 1999.
Figure 1: Staff productivity, by type of MFI
05000100001500020000250003000035000400004500050000
mutual
group
village bank
individual
linkage
mix
Volume ($)
0100200300400500600700800
Number of loans
Volume of loans ($) Volume of savings ($)
Number of loans
21
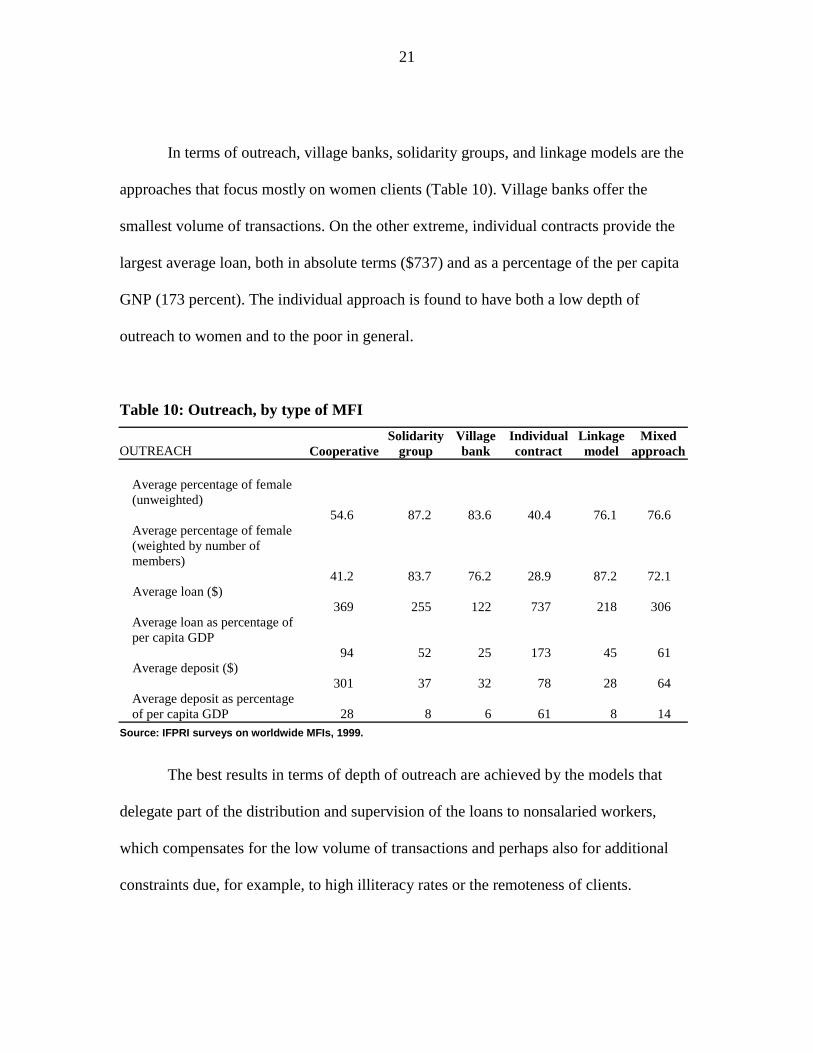
In terms of outreach, village banks, solidarity groups, and linkage models are the
approaches that focus mostly on women clients (Table 10). Village banks offer the
smallest volume of transactions. On the other extreme, individual contracts provide the
largest average loan, both in absolute terms ($737) and as a percentage of the per capita
GNP (173 percent). The individual approach is found to have both a low depth of
outreach to women and to the poor in general.
Table 10: Outreach, by type of MFI
OUTREACH Cooperative Solidarity
group Village bank
Individual contract
Linkage model
Mixed approach
Average percentage of female
(unweighted) 54.6 87.2 83.6 40.4 76.1 76.6 Average percentage of female
(weighted by number of members)
41.2 83.7 76.2 28.9 87.2 72.1 Average loan ($) 369 255 122 737 218 306 Average loan as percentage of
per capita GDP 94 52 25 173 45 61 Average deposit ($) 301 37 32 78 28 64 Average deposit as percentage
of per capita GDP 28 8 6 61 8 14 Source: IFPRI surveys on worldwide MFIs, 1999.
The best results in terms of depth of outreach are achieved by the models that
delegate part of the distribution and supervision of the loans to nonsalaried workers,
which compensates for the low volume of transactions and perhaps also for additional
constraints due, for example, to high illiteracy rates or the remoteness of clients.
22
If one was to combine the good side of the performance of the different type of
institutions, one may rapidly face trade-offs between local, endogenous, and small-scale
organization, and large, anonymous, well-staffed structures.
TYPE OF MFIs, BY LEGAL STATUS
MFIs have been classified by legal status: they may be NGOs, cooperatives,
registered banking institutions, government organizations (GO), or projects.13
In terms of performances, banks record the best staff productivity (187 loans for
an amount of $50,000 per employee), but their results are low in terms of depth of
outreach, with few women among their clients (40 percent) and high size of transaction
(average loan of $425). Cooperatives also have a low depth of outreach (45 percent of
women, average loan of $339) and high staff productivity (144 loans, $30,000). On the
contrary, NGOs have a good depth of outreach (73 percent of women, average loan of
$228), but low staff productivity (104 loans, $12,700). The worst results are recorded for
government organizations, with very low productivity and depth of outreach.
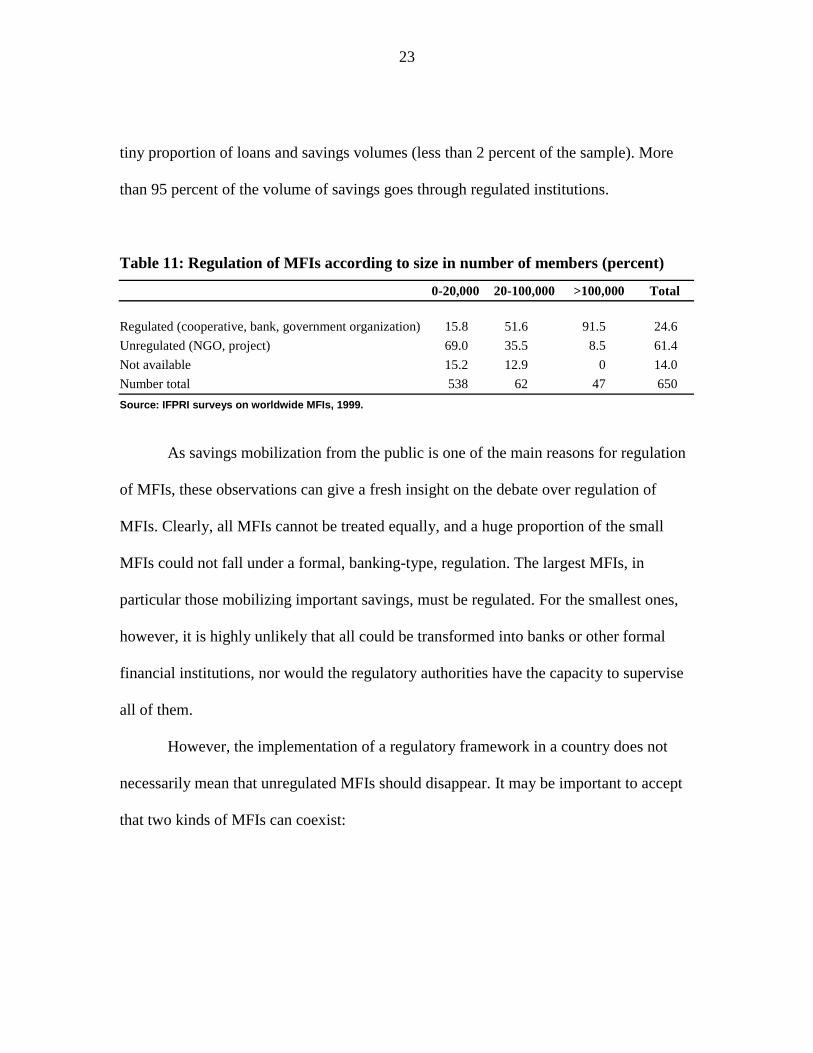
Table 11 shows that 91.5 percent of MFIs with more than 100,000 members are
regulated, while the same is true for only 16 percent of MFIs with fewer than 20,000
members. There is a large number of unregulated NGOs, accounting for 61.4 percent of
the sample. However, in terms of volume of activity, unregulated NGOs represent only a
13 One hundred institutions for which the status was unavailable are excluded from the tables.
23
tiny proportion of loans and savings volumes (less than 2 percent of the sample). More
than 95 percent of the volume of savings goes through regulated institutions.
Table 11: Regulation of MFIs according to size in number of members (percent)
0-20,000 20-100,000 >100,000 Total Regulated (cooperative, bank, government organization) 15.8 51.6 91.5 24.6 Unregulated (NGO, project) 69.0 35.5 8.5 61.4 Not available 15.2 12.9 0 14.0 Number total 538 62 47 650 Source: IFPRI surveys on worldwide MFIs, 1999.
As savings mobilization from the public is one of the main reasons for regulation
of MFIs, these observations can give a fresh insight on the debate over regulation of
MFIs. Clearly, all MFIs cannot be treated equally, and a huge proportion of the small
MFIs could not fall under a formal, banking-type, regulation. The largest MFIs, in
particular those mobilizing important savings, must be regulated. For the smallest ones,
however, it is highly unlikely that all could be transformed into banks or other formal
financial institutions, nor would the regulatory authorities have the capacity to supervise
all of them.
However, the implementation of a regulatory framework in a country does not
necessarily mean that unregulated MFIs should disappear. It may be important to accept
that two kinds of MFIs can coexist:
24
• larger MFIs that concentrate on financial services, in particular, mobilizing
savings, and that are falling under specific national regulation. Thanks to their
official recognition in the formal financial system, they may receive loans from
the commercial banking sector to leverage their capital.
• NGOs using microfinance tools as one among others to alleviate poverty. In spite
of their “informality,” these NGOs also have a duty to adhere to minimal internal
rules to work on a professional and efficient basis: insure a high rate of
repayment, charge interest rates that allow them to recover part of the costs,
define appropriate services for their clients, and to not compete unfairly with
other MFIs. These NGOs, as they receive funding from donors and remain out of
a strict regulatory framework, may have opportunities to test innovations that can
be used by the larger MFIs or that may eventually enable growth to scale if the
innovation proves successful in the market. On the other hand, this second type of
MFI can benefit from the information on regulation and best practices
implemented by the first type of MFIs to improve their performance and
governance. A few of them may eventually grow to large scale.
5. ROLE AND PERFORMANCE OF MFIs, BY LOCATION
RURAL AND URBAN MFIs
The information on geographic location is missing for 33 percent of MFIs. For the
Indonesian cases, most work in a mixed environment. From the data available, we
25
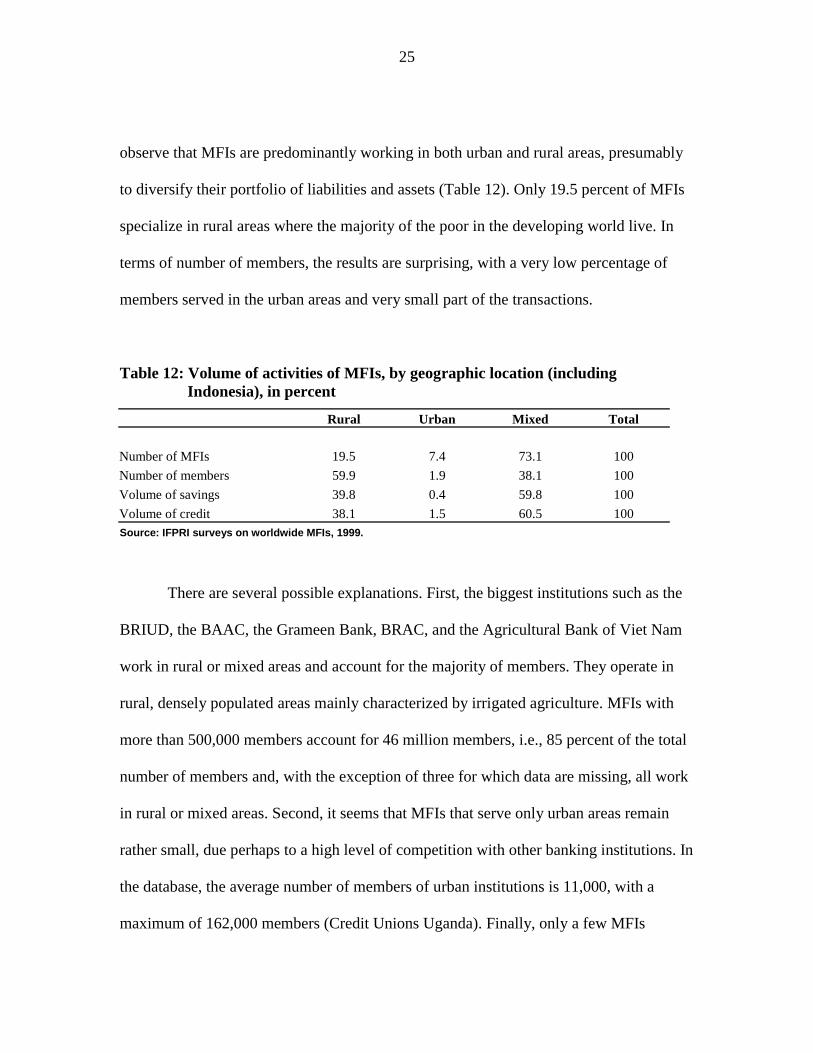
observe that MFIs are predominantly working in both urban and rural areas, presumably
to diversify their portfolio of liabilities and assets (Table 12). Only 19.5 percent of MFIs
specialize in rural areas where the majority of the poor in the developing world live. In
terms of number of members, the results are surprising, with a very low percentage of
members served in the urban areas and very small part of the transactions.
Table 12: Volume of activities of MFIs, by geographic location (including Indonesia), in percent
Rural Urban Mixed Total Number of MFIs 19.5 7.4 73.1 100 Number of members 59.9 1.9 38.1 100 Volume of savings 39.8 0.4 59.8 100 Volume of credit 38.1 1.5 60.5 100 Source: IFPRI surveys on worldwide MFIs, 1999.
There are several possible explanations. First, the biggest institutions such as the
BRIUD, the BAAC, the Grameen Bank, BRAC, and the Agricultural Bank of Viet Nam
work in rural or mixed areas and account for the majority of members. They operate in
rural, densely populated areas mainly characterized by irrigated agriculture. MFIs with
more than 500,000 members account for 46 million members, i.e., 85 percent of the total
number of members and, with the exception of three for which data are missing, all work
in rural or mixed areas. Second, it seems that MFIs that serve only urban areas remain
rather small, due perhaps to a high level of competition with other banking institutions. In
the database, the average number of members of urban institutions is 11,000, with a
maximum of 162,000 members (Credit Unions Uganda). Finally, only a few MFIs
26
specialize in urban areas, and even those that do also seek to serve rural, or at least
periurban, areas.
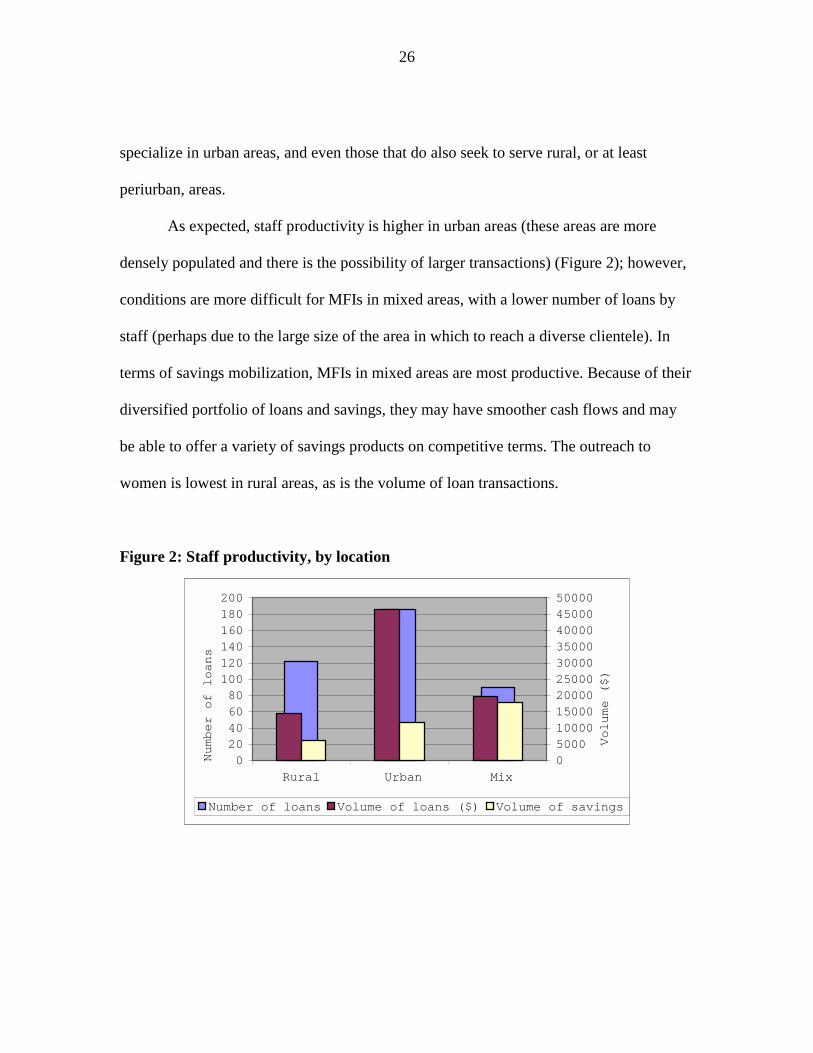
As expected, staff productivity is higher in urban areas (these areas are more
densely populated and there is the possibility of larger transactions) (Figure 2); however,
conditions are more difficult for MFIs in mixed areas, with a lower number of loans by
staff (perhaps due to the large size of the area in which to reach a diverse clientele). In
terms of savings mobilization, MFIs in mixed areas are most productive. Because of their
diversified portfolio of loans and savings, they may have smoother cash flows and may
be able to offer a variety of savings products on competitive terms. The outreach to
women is lowest in rural areas, as is the volume of loan transactions.
Figure 2: Staff productivity, by location
020406080100120140160180200
Rural Urban Mix
Number of loans
05000100001500020000250003000035000400004500050000
Volume ($)
Number of loans Volume of loans ($) Volume of savings
27
MFIs, BY CONTINENT
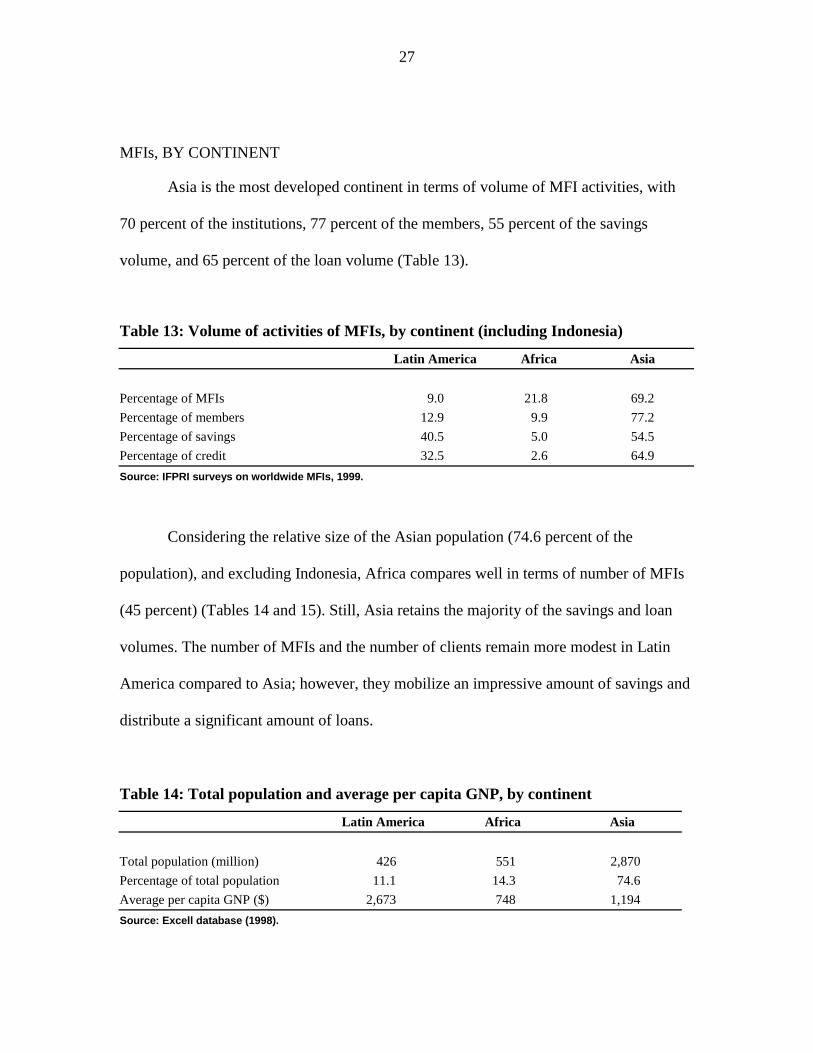
Asia is the most developed continent in terms of volume of MFI activities, with
70 percent of the institutions, 77 percent of the members, 55 percent of the savings
volume, and 65 percent of the loan volume (Table 13).
Table 13: Volume of activities of MFIs, by continent (including Indonesia)
Latin America Africa Asia Percentage of MFIs 9.0 21.8 69.2 Percentage of members 12.9 9.9 77.2 Percentage of savings 40.5 5.0 54.5 Percentage of credit 32.5 2.6 64.9 Source: IFPRI surveys on worldwide MFIs, 1999.
Considering the relative size of the Asian population (74.6 percent of the
population), and excluding Indonesia, Africa compares well in terms of number of MFIs
(45 percent) (Tables 14 and 15). Still, Asia retains the majority of the savings and loan
volumes. The number of MFIs and the number of clients remain more modest in Latin
America compared to Asia; however, they mobilize an impressive amount of savings and
distribute a significant amount of loans.
Table 14: Total population and average per capita GNP, by continent
Latin America Africa Asia Total population (million) 426 551 2,870 Percentage of total population 11.1 14.3 74.6 Average per capita GNP ($) 2,673 748 1,194 Source: Excell database (1998).
28
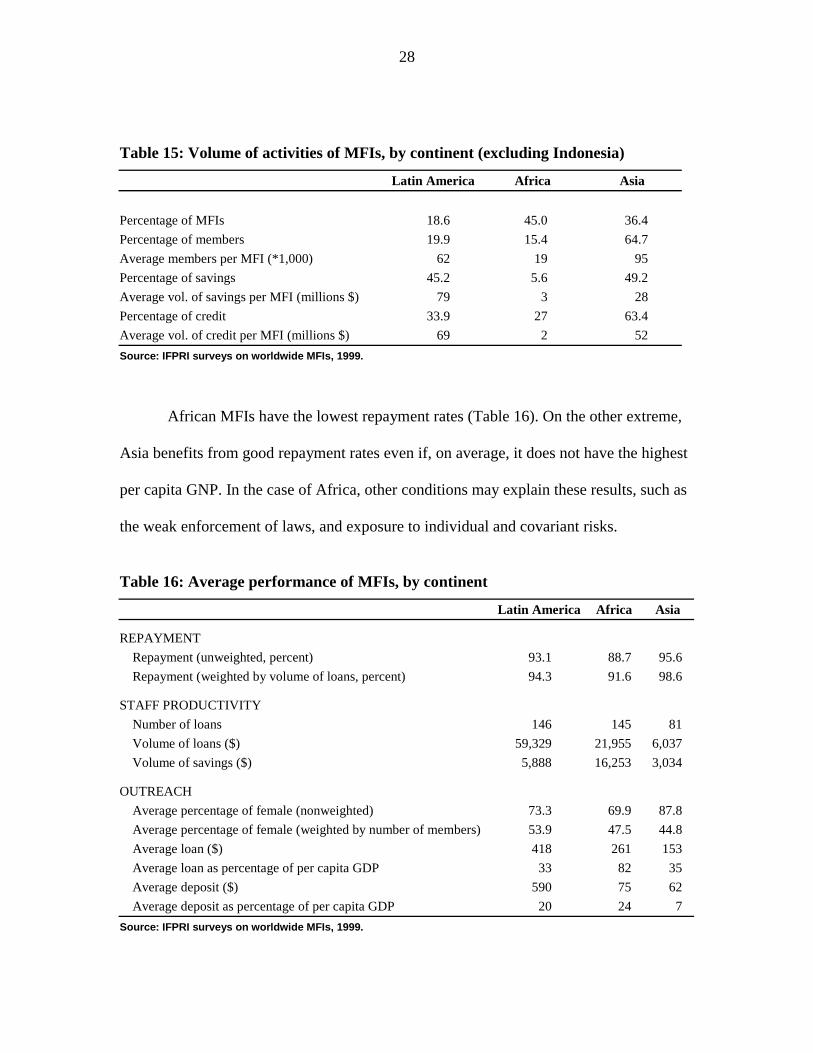
Table 15: Volume of activities of MFIs, by continent (excluding Indonesia)
Latin America Africa Asia Percentage of MFIs 18.6 45.0 36.4 Percentage of members 19.9 15.4 64.7 Average members per MFI (*1,000) 62 19 95 Percentage of savings 45.2 5.6 49.2 Average vol. of savings per MFI (millions $) 79 3 28 Percentage of credit 33.9 27 63.4 Average vol. of credit per MFI (millions $) 69 2 52 Source: IFPRI surveys on worldwide MFIs, 1999.
African MFIs have the lowest repayment rates (Table 16). On the other extreme,
Asia benefits from good repayment rates even if, on average, it does not have the highest
per capita GNP. In the case of Africa, other conditions may explain these results, such as
the weak enforcement of laws, and exposure to individual and covariant risks.
Table 16: Average performance of MFIs, by continent
Latin America Africa Asia
REPAYMENT Repayment (unweighted, percent) 93.1 88.7 95.6 Repayment (weighted by volume of loans, percent) 94.3 91.6 98.6
STAFF PRODUCTIVITY Number of loans 146 145 81 Volume of loans ($) 59,329 21,955 6,037 Volume of savings ($) 5,888 16,253 3,034
OUTREACH Average percentage of female (nonweighted) 73.3 69.9 87.8 Average percentage of female (weighted by number of members) 53.9 47.5 44.8 Average loan ($) 418 261 153 Average loan as percentage of per capita GDP 33 82 35 Average deposit ($) 590 75 62 Average deposit as percentage of per capita GDP 20 24 7 Source: IFPRI surveys on worldwide MFIs, 1999.
29
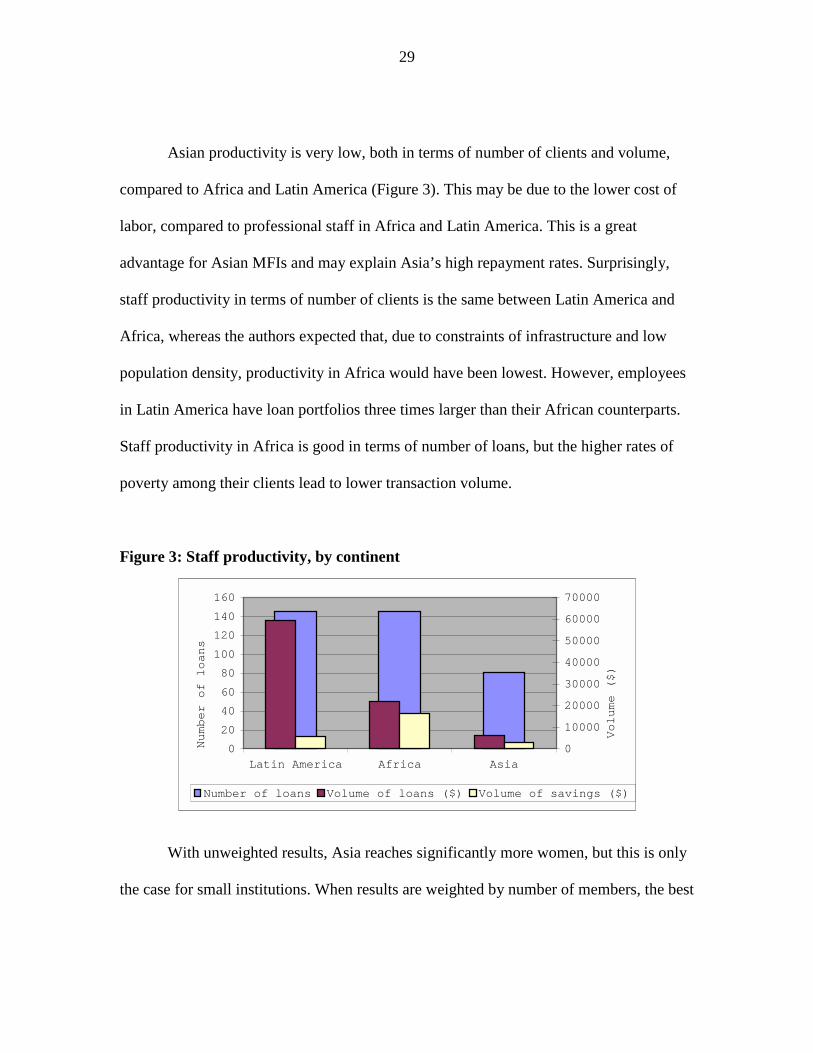
Asian productivity is very low, both in terms of number of clients and volume,
compared to Africa and Latin America (Figure 3). This may be due to the lower cost of
labor, compared to professional staff in Africa and Latin America. This is a great
advantage for Asian MFIs and may explain Asia’s high repayment rates. Surprisingly,
staff productivity in terms of number of clients is the same between Latin America and
Africa, whereas the authors expected that, due to constraints of infrastructure and low
population density, productivity in Africa would have been lowest. However, employees
in Latin America have loan portfolios three times larger than their African counterparts.
Staff productivity in Africa is good in terms of number of loans, but the higher rates of
poverty among their clients lead to lower transaction volume.
Figure 3: Staff productivity, by continent
0
20
40
60
80
100
120
140
160
Latin America Africa Asia
Number of loans
0
10000
20000
30000
40000
50000
60000
70000Volume ($)
Number of loans Volume of loans ($) Volume of savings ($)
With unweighted results, Asia reaches significantly more women, but this is only
the case for small institutions. When results are weighted by number of members, the best
30
results are in Latin America, with 54 percent female members, whereas African and
Asian MFIs have fewer than 50 percent women as members.
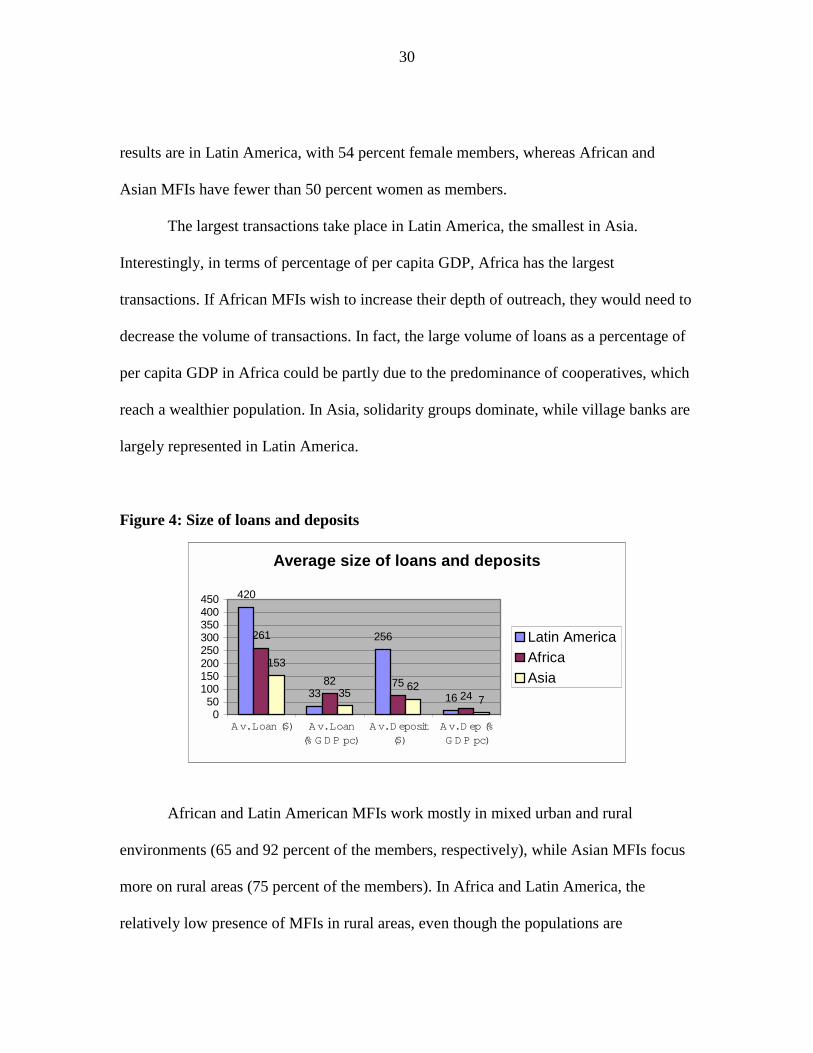
The largest transactions take place in Latin America, the smallest in Asia.
Interestingly, in terms of percentage of per capita GDP, Africa has the largest
transactions. If African MFIs wish to increase their depth of outreach, they would need to
decrease the volume of transactions. In fact, the large volume of loans as a percentage of
per capita GDP in Africa could be partly due to the predominance of cooperatives, which
reach a wealthier population. In Asia, solidarity groups dominate, while village banks are
largely represented in Latin America.
Figure 4: Size of loans and deposits
Average size of loans and deposits
420
33
256
16
261
82 7524
153
35 627
050
100150200250300350400450
Av. Loan ($) Av. Loan(% G D P pc)
Av. D eposit($)
Av. D ep (%G D P pc)
Latin AmericaAfricaAsia
African and Latin American MFIs work mostly in mixed urban and rural
environments (65 and 92 percent of the members, respectively), while Asian MFIs focus
more on rural areas (75 percent of the members). In Africa and Latin America, the
relatively low presence of MFIs in rural areas, even though the populations are
31
predominantly rural, implies that the rural depth of outreach is low. In particular,
agricultural finance for smallholders remains underexploited.
6. SUMMARY AND CONCLUSIONS
MFIs provide extensive coverage of Asia, Africa, and Latin America, and have
adopted a wide range of innovations to overcome various constraints. However, they
require stable macroeconomic and political environments to develop. Unstable countries
are still out of reach of the international world of microfinance. On the other extreme,
Southeast Asia, Latin America, and East and West Africa receive most of the
international support and account for the majority of the clients and the volumes involved
in microfinance.
On the whole, MFIs reach 54 million members, who have received $18 billion in
loans and accumulated $13 billion in savings. With these figures, the Micro-Credit
Summit objective to reach 100 million poor people by 2005 appears be achievable if one
were to assume that most of the current MFI clients were “poor.” However, MFIs are
highly concentrated in size (3 percent of the largest MFIs reach 80 percent of the
members). If the stakeholders of the Micro-Credit Summit wish to achieve their goal,
further client growth among the bigger MFIs should be necessary. This is because the
many small MFIs will not contribute much to the total numbers even if they would
double or triple their client numbers by 2005. However, it will be necessary to support
the change of scale of small but efficient MFIs.
32
In terms of lending technologies, cooperatives are responsible for the largest
proportion of the credit volume and savings transactions, while solidarity groups have a
very active policy in terms of number of borrowers. The village bank and linkage models,
thanks to the delegation of supervision to local voluntary staff, record higher staff
productivity and achieve better depth of outreach than other MFIs. Surprisingly, there
were relatively few urban-oriented MFIs, and those that did focus in urban areas tended
to reach peri-urban and/or rural areas as well.
In terms of regulation and legal status, more than 95 percent of the volume of
microfinance transactions goes through regulated institutions (bank or cooperative) and
although 60 percent of MFIs are still unregulated, they only account for less than 2
percent of the volume of savings mobilized and loans disbursed.
By continent, Asia accounts for the largest volume of activity and employs the
largest number of staff (thanks to low labor costs). This allows for close monitoring and
supervision. Africa is very active in the field of microfinance. Many efforts have been
made to improve staff productivity, but the continent still faces the constraints of poverty
and illiteracy, both of which limit transaction volume. Moreover, loan sizes are already
high when expressed as a percentage of per capita GNP, and increasing the size of loan
transactions would endanger the depth of outreach. Rural Africa still has relatively lower
outreach, which calls for continued efforts to improve rural and agricultural finance.
Latin America is extensively covered by MFIs and records the largest volume per
transaction. However, MFIs there work essentially in urban or mixed areas, and rural
outreach remains low.
33
More households in developing countries as currently reached are likely to benefit
from future growth of the MFI sector. To support future growth, it will be necessary to
support MFIs in their efforts to find demand-oriented products to broaden their clientele
and to innovate in cost-efficient service delivery systems, so that they can sustainably
increase their scale in terms of number of clients, volume of activity, and relative poverty
level of clients.
34
REFERENCES
Christen, R. P. 1999. Bulletin Highlights, MicroBanking Bulletin, Issue No. 3, July,
Calmeadow: 19–49.
CDF (Credit and Development Forum). 1998. Credit and Development Forum Statistics,
Volume VI. Dhaka, Bangladesh.
Lapenu, C. 1998. Indonesia’s rural financial system: The role of the state and private
institutions. Case Studies in Microfinance, Sustainable Banking with the Poor,
Asia Series. World Bank, Washington, D.C.
Lapenu, C. 2000. Volume 3: Multicountry synthesis report on institutional analysis.
Report to the Federal Ministry for Economic Cooperation and Development
(BMZ), Germany. International Food Policy Research Institute, Washington, D.C.
Microcredit Summit Campaign (The). 1998. Directory of institutional profiles.
Washington, D.C.
PA-SMEC/BIT, BCEAO, 1998. Banques de données sur les systèmes financiers
décentralisés de 7 pays de l’UMOA (Bénin, Burkina Faso, Côte d’Ivoire, Mali,
Niger, Sénégal et Togo). PA-SMEC, projet BIT/BCEAO, Dakar, Sénégal/
Genève, Suisse, 8 volumes.
World Bank. 1996. Sustainable banking with the poor: A worldwide inventory of
microfinance institutions. Washington, D.C.
FCND DISCUSSION PAPERS
01 Agricultural Technology and Food Policy to Combat Iron Deficiency in Developing Countries, Howarth E. Bouis, August 1994
02 Determinants of Credit Rationing: A Study of Informal Lenders and Formal Credit Groups in Madagascar, Manfred Zeller, October 1994
03 The Extended Family and Intrahousehold Allocation: Inheritance and Investments in Children in the Rural Philippines, Agnes R. Quisumbing, March 1995
04 Market Development and Food Demand in Rural China, Jikun Huang and Scott Rozelle, June 1995
05 Gender Differences in Agricultural Productivity: A Survey of Empirical Evidence, Agnes R. Quisumbing, July 1995
06 Gender Differentials in Farm Productivity: Implications for Household Efficiency and Agricultural Policy, Harold Alderman, John Hoddinott, Lawrence Haddad, and Christopher Udry, August 1995
07 A Food Demand System Based on Demand for Characteristics: If There Is "Curvature" in the Slutsky Matrix, What Do the Curves Look Like and Why?, Howarth E. Bouis, December 1995
08 Measuring Food Insecurity: The Frequency and Severity of "Coping Strategies," Daniel G. Maxwell, December 1995
09 Gender and Poverty: New Evidence from 10 Developing Countries, Agnes R. Quisumbing, Lawrence Haddad, and Christine Peña, December 1995
10 Women's Economic Advancement Through Agricultural Change: A Review of Donor Experience, Christine Peña, Patrick Webb, and Lawrence Haddad, February 1996
11 Rural Financial Policies for Food Security of the Poor: Methodologies for a Multicountry Research Project, Manfred Zeller, Akhter Ahmed, Suresh Babu, Sumiter Broca, Aliou Diagne, and Manohar Sharma, April 1996
12 Child Development: Vulnerability and Resilience, Patrice L. Engle, Sarah Castle, and Purnima Menon, April 1996
13 Determinants of Repayment Performance in Credit Groups: The Role of Program Design, Intra-Group Risk Pooling, and Social Cohesion in Madagascar, Manfred Zeller, May 1996
14 Demand for High-Value Secondary Crops in Developing Countries: The Case of Potatoes in Bangladesh and Pakistan, Howarth E. Bouis and Gregory Scott, May 1996
15 Repayment Performance in Group-Based credit Programs in Bangladesh: An Empirical Analysis, Manohar Sharma and Manfred Zeller, July 1996
16 How Can Safety Nets Do More with Less? General Issues with Some Evidence from Southern Africa, Lawrence Haddad and Manfred Zeller, July 1996
17 Remittances, Income Distribution, and Rural Asset Accumulation, Richard H. Adams, Jr., August 1996
18 Care and Nutrition: Concepts and Measurement, Patrice L. Engle, Purnima Menon, and Lawrence Haddad, August 1996
19 Food Security and Nutrition Implications of Intrahousehold Bias: A Review of Literature, Lawrence Haddad, Christine Peña, Chizuru Nishida, Agnes Quisumbing, and Alison Slack, September 1996
20 Macroeconomic Crises and Poverty Monitoring: A Case Study for India, Gaurav Datt and Martin Ravallion, November 1996
21 Livestock Income, Male/Female Animals, and Inequality in Rural Pakistan, Richard H. Adams, Jr., November 1996
22 Alternative Approaches to Locating the Food Insecure: Qualitative and Quantitative Evidence from South India, Kimberly Chung, Lawrence Haddad, Jayashree Ramakrishna, and Frank Riely, January 1997
FCND DISCUSSION PAPERS
23 Better Rich, or Better There? Grandparent Wealth, Coresidence, and Intrahousehold Allocation, Agnes R. Quisumbing, January 1997
24 Child Care Practices Associated with Positive and Negative Nutritional Outcomes for Children in Bangladesh: A Descriptive Analysis, Shubh K. Kumar Range, Ruchira Naved, and Saroj Bhattarai, February 1997
25 Water, Health, and Income: A Review, John Hoddinott, February 1997
26 Why Have Some Indian States Performed Better Than Others at Reducing Rural Poverty?, Gaurav Datt and Martin Ravallion, March 1997
27 "Bargaining" and Gender Relations: Within and Beyond the Household, Bina Agarwal, March 1997
28 Developing a Research and Action Agenda for Examining Urbanization and Caregiving: Examples from Southern and Eastern Africa, Patrice L. Engle, Purnima Menon, James L. Garrett, and Alison Slack, April 1997
29 Gender, Property Rights, and Natural Resources, Ruth Meinzen-Dick, Lynn R. Brown, Hilary Sims Feldstein, and Agnes R. Quisumbing, May 1997
30 Plant Breeding: A Long-Term Strategy for the Control of Zinc Deficiency in Vulnerable Populations, Marie T. Ruel and Howarth E. Bouis, July 1997
31 Is There an Intrahousehold 'Flypaper Effect'? Evidence from a School Feeding Program, Hanan Jacoby, August 1997
32 The Determinants of Demand for Micronutrients: An Analysis of Rural Households in Bangladesh, Howarth E. Bouis and Mary Jane G. Novenario-Reese, August 1997
33 Human Milk—An Invisible Food Resource, Anne Hatløy and Arne Oshaug, August 1997
34 The Impact of Changes in Common Property Resource Management on Intrahousehold Allocation, Philip Maggs and John Hoddinott, September 1997
35 Market Access by Smallholder Farmers in Malawi: Implications for Technology Adoption, Agricultural Productivity, and Crop Income, Manfred Zeller, Aliou Diagne, and Charles Mataya, September 1997
36 The GAPVU Cash Transfer Program in Mozambique: An assessment, Gaurav Datt, Ellen Payongayong, James L. Garrett, and Marie Ruel, October 1997
37 Why Do Migrants Remit? An Analysis for the Dominican Sierra, Bénédicte de la Brière, Alain de Janvry, Sylvie Lambert, and Elisabeth Sadoulet, October 1997
38 Systematic Client Consultation in Development: The Case of Food Policy Research in Ghana, India, Kenya, and Mali, Suresh Chandra Babu, Lynn R. Brown, and Bonnie McClafferty, November 1997
39 Whose Education Matters in the Determination of Household Income: Evidence from a Developing Country, Dean Jolliffe, November 1997
40 Can Qualitative and Quantitative Methods Serve Complementary Purposes for Policy Research? Evidence from Accra, Dan Maxwell, January 1998
41 The Political Economy of Urban Food Security in Sub-Saharan Africa, Dan Maxwell, February 1998
42 Farm Productivity and Rural Poverty in India, Gaurav Datt and Martin Ravallion, March 1998
43 How Reliable Are Group Informant Ratings? A Test of Food Security Rating in Honduras, Gilles Bergeron, Saul Sutkover Morris, and Juan Manuel Medina Banegas, April 1998
44 Can FAO's Measure of Chronic Undernourishment Be Strengthened?, Lisa C. Smith, with a Response by Logan Naiken, May 1998
45 Does Urban Agriculture Help Prevent Malnutrition? Evidence from Kampala, Daniel Maxwell, Carol Levin, and Joanne Csete, June 1998
46 Impact of Access to Credit on Income and Food Security in Malawi, Aliou Diagne, July 1998
FCND DISCUSSION PAPERS
47 Poverty in India and Indian States: An Update, Gaurav Datt, July 1998
48 Human Capital, Productivity, and Labor Allocation in Rural Pakistan, Marcel Fafchamps and Agnes R. Quisumbing, July 1998
49 A Profile of Poverty in Egypt: 1997, Gaurav Datt, Dean Jolliffe, and Manohar Sharma, August 1998.
50 Computational Tools for Poverty Measurement and Analysis, Gaurav Datt, October 1998
51 Urban Challenges to Food and Nutrition Security: A Review of Food Security, Health, and Caregiving in the Cities, Marie T. Ruel, James L. Garrett, Saul S. Morris, Daniel Maxwell, Arne Oshaug, Patrice Engle, Purnima Menon, Alison Slack, and Lawrence Haddad, October 1998
52 Testing Nash Bargaining Household Models With Time-Series Data, John Hoddinott and Christopher Adam, November 1998
53 Agricultural Wages and Food Prices in Egypt: A Governorate-Level Analysis for 1976-1993, Gaurav Datt and Jennifer Olmsted, November 1998
54 Endogeneity of Schooling in the Wage Function: Evidence from the Rural Philippines, John Maluccio, November 1998
55 Efficiency in Intrahousehold Resource Allocation, Marcel Fafchamps, December 1998
56 How Does the Human Rights Perspective Help to Shape the Food and Nutrition Policy Research Agenda?, Lawrence Haddad and Arne Oshaug, February 1999
57 The Structure of Wages During the Economic Transition in Romania, Emmanuel Skoufias, February 1999
58 Women's Land Rights in the Transition to Individualized Ownership: Implications for the Management of Tree Resources in Western Ghana, Agnes Quisumbing, Ellen Payongayong, J. B. Aidoo, and Keijiro Otsuka, February 1999
59 Placement and Outreach of Group-Based Credit Organizations: The Cases of ASA, BRAC, and PROSHIKA in Bangladesh, Manohar Sharma and Manfred Zeller, March 1999
60 Explaining Child Malnutrition in Developing Countries: A Cross-Country Analysis, Lisa C. Smith and Lawrence Haddad, April 1999
61 Does Geographic Targeting of Nutrition Interventions Make Sense in Cities? Evidence from Abidjan and Accra, Saul S. Morris, Carol Levin, Margaret Armar-Klemesu, Daniel Maxwell, and Marie T. Ruel, April 1999
62 Good Care Practices Can Mitigate the Negative Effects of Poverty and Low Maternal Schooling on Children's Nutritional Status: Evidence from Accra, Marie T. Ruel, Carol E. Levin, Margaret Armar-Klemesu, Daniel Maxwell, and Saul S. Morris, April 1999
63 Are Urban Poverty and Undernutrition Growing? Some Newly Assembled Evidence, Lawrence Haddad, Marie T. Ruel, and James L. Garrett, April 1999
64 Some Urban Facts of Life: Implications for Research and Policy, Marie T. Ruel, Lawrence Haddad, and James L. Garrett, April 1999
65 Are Determinants of Rural and Urban Food Security and Nutritional Status Different? Some Insights from Mozambique, James L. Garrett and Marie T. Ruel, April 1999
66 Working Women in an Urban Setting: Traders, Vendors, and Food Security in Accra, Carol E. Levin, Daniel G. Maxwell, Margaret Armar-Klemesu, Marie T. Ruel, Saul S. Morris, and Clement Ahiadeke, April 1999
67 Determinants of Household Access to and Participation in Formal and Informal Credit Markets in Malawi, Aliou Diagne, April 1999
68 Early Childhood Nutrition and Academic Achievement: A Longitudinal Analysis, Paul Glewwe, Hanan Jacoby, and Elizabeth King, May 1999
FCND DISCUSSION PAPERS
69 Supply Response of West African Agricultural Households: Implications of Intrahousehold Preference Heterogeneity, Lisa C. Smith and Jean-Paul Chavas, July 1999
70 Child Health Care Demand in a Developing Country: Unconditional Estimates from the Philippines, Kelly Hallman, August 1999
71 Social Capital and Income Generation in South Africa, 1993-98, John Maluccio, Lawrence Haddad, and Julian May, September 1999
72 Validity of Rapid Estimates of Household Wealth and Income for Health Surveys in Rural Africa, Saul S. Morris, Calogero Carletto, John Hoddinott, and Luc J. M. Christiaensen, October 1999
73 Social Roles, Human Capital, and the Intrahousehold Division of Labor: Evidence from Pakistan, Marcel Fafchamps and Agnes R. Quisumbing, October 1999
74 Can Cash Transfer Programs Work in Resource-Poor Countries? The Experience in Mozambique, Jan W. Low, James L. Garrett, and Vitória Ginja, October 1999
75 Determinants of Poverty in Egypt, 1997, Gaurav Datt and Dean Jolliffe, October 1999
76 Raising Primary School Enrolment in Developing Countries: The Relative Importance of Supply and Demand, Sudhanshu Handa, November 1999
77 The Political Economy of Food Subsidy Reform in Egypt, Tammi Gutner, November 1999.
78 Determinants of Poverty in Mozambique: 1996-97, Gaurav Datt, Kenneth Simler, Sanjukta Mukherjee, and Gabriel Dava, January 2000
79 Adult Health in the Time of Drought, John Hoddinott and Bill Kinsey, January 2000
80 Nontraditional Crops and Land Accumulation Among Guatemalan Smallholders: Is the Impact Sustainable? Calogero Carletto, February 2000
81 The Constraints to Good Child Care Practices in Accra: Implications for Programs, Margaret Armar-Klemesu, Marie T. Ruel, Daniel G. Maxwell, Carol E. Levin, and Saul S. Morris, February 2000
82 Pathways of Rural Development in Madagascar: An Empirical Investigation of the Critical Triangle of Environmental Sustainability, Economic Growth, and Poverty Alleviation, Manfred Zeller, Cécile Lapenu, Bart Minten, Eliane Ralison, Désiré Randrianaivo, and Claude Randrianarisoa, March 2000
83 Quality or Quantity? The Supply-Side Determinants of Primary Schooling in Rural Mozambique, Sudhanshu Handa and Kenneth R. Simler, March 2000
84 Intrahousehold Allocation and Gender Relations: New Empirical Evidence from Four Developing Countries, Agnes R. Quisumbing and John A. Maluccio, April 2000
85 Intrahousehold Impact of Transfer of Modern Agricultural Technology: A Gender Perspective, Ruchira Tabassum Naved, April 2000
86 Women’s Assets and Intrahousehold Allocation in Rural Bangladesh: Testing Measures of Bargaining Power, Agnes R. Quisumbing and Bénédicte de la Brière, April 2000
87 Changes in Intrahousehold Labor Allocation to Environmental Goods Collection: A Case Study from Rural Nepal, Priscilla A. Cooke, May 2000
88 The Determinants of Employment Status in Egypt, Ragui Assaad, Fatma El-Hamidi, and Akhter U. Ahmed, June 2000
89 The Role of the State in Promoting Microfinance Institutions, Cécile Lapenu, June 2000
90 Empirical Measurements of Households’ Access to Credit and Credit Constraints in Developing Countries: Methodological Issues and Evidence, Aliou Diagne, Manfred Zeller, and Manohar Sharma, July 2000
91 Comparing Village Characteristics Derived From Rapid Appraisals and Household Surveys: A Tale From Northern Mali, Luc Christiaensen, John Hoddinott, and Gilles Bergeron, July 2000
FCND DISCUSSION PAPERS
92 Assessing the Potential for Food-Based Strategies to Reduce Vitamin A and Iron Deficiencies: A Review of Recent Evidence, Marie T. Ruel and Carol E. Levin, July 2000
93 Mother-Father Resource Control, Marriage Payments, and Girl-Boy Health in Rural Bangladesh, Kelly K. Hallman, September 2000
94 Targeting Urban Malnutrition: A Multicity Analysis of the Spatial Distribution of Childhood Nutritional Status, Saul Sutkover Morris, September 2000
95 Attrition in the Kwazulu Natal Income Dynamics Study 1993-1998, John Maluccio, October 2000
96 Attrition in Longitudinal Household Survey Data: Some Tests for Three Developing-Country Samples, Harold Alderman, Jere R. Behrman, Hans-Peter Kohler, John A. Maluccio, Susan Cotts Watkins, October 2000
97 Socioeconomic Differentials in Child Stunting Are Consistently Larger in Urban Than in Rural Areas, Purnima Menon, Marie T. Ruel, and Saul S. Morris, December 2000
98 Participation and Poverty Reduction: Issues, Theory, and New Evidence from South Africa, John Hoddinott, Michelle Adato, Tim Besley, and Lawrence Haddad, January 2001
99 Cash Transfer Programs with Income Multipliers: PROCAMPO in Mexico, Elisabeth Sadoulet, Alain de Janvry, and Benjamin Davis, January 2001
100 On the Targeting and Redistributive Efficiencies of Alternative Transfer Instruments, David Coady and Emmanuel Skoufias, March 2001
101 Poverty, Inequality, and Spillover in Mexico’s Education, Health, and Nutrition Program, Sudhanshu Handa, Mari-Carmen Huerta, Raul Perez, and Beatriz Straffon, March 2001
102 School Subsidies for the Poor: Evaluating a Mexican Strategy for Reducing Poverty, T. Paul Schultz, March 2001
103 Targeting the Poor in Mexico: An Evaluation of the Selection of Households for PROGRESA, Emmanuel Skoufias, Benjamin Davis, and Sergio de la Vega, March 2001
104 An Evaluation of the Impact of PROGRESA on Preschool Child Height, Jere R. Behrman and John Hoddinott, March 2001
105 The Nutritional Transition and Diet-Related Chronic Diseases in Asia: Implications for Prevention, Barry M. Popkin, Sue Horton, and Soowon Kim, March 2001
106 Strengthening Capacity to Improve Nutrition, Stuart Gillespie, March 2001
107 Rapid Assessments in Urban Areas: Lessons from Bangladesh and Tanzania, James L. Garrett and Jeanne Downen, April 2001
108 How Efficiently Do Employment Programs Transfer Benefits to the Poor? Evidence from South Africa, Lawrence Haddad and Michelle Adato, April 2001
109 Does Cash Crop Adoption Detract From Childcare Provision? Evidence From Rural Nepal, Michael J. Paolisso, Kelly Hallman, Lawrence Haddad, and Shibesh Regmi, April 2001
110 Evaluating Transfer Programs Within a General Equilibrium Framework, Dave Coady and Rebecca Lee Harris, June 2001
111 An Operational Tool for Evaluating Poverty Outreach of Development Policies and Projects, Manfred Zeller, Manohar Sharma, Carla Henry, and Cécile Lapenu, June 2001
112 Effective Food and Nutrition Policy Responses to HIV/AIDS: What We Know and What We Need to Know, Lawrence Haddad and Stuart Gillespie, June 2001
113 Measuring Power, Elizabeth Frankenberg and Duncan Thomas, June 2001