distribution community insights conference august 18-21, 2015 minneapolis, mn 2015 electric t&d...
TRANSCRIPT
Distribution
Community Insights Conference
August 18-21, 2015
Minneapolis, MN
2015 Electric T&D Benchmarking

2
Agenda -- Distribution
◼ Overview
◼ Performance Results Profiles and Trends Financial Performance Measures
◼ Process Model – Context
◼ Practice Modules Expand System – Planning, Engineering and Design Operate System – Distribution Operations Center (DOC) Sustain System – Equipment Inspection & Maintenance

3
Overview
4
Insights Overview - Distribution
Costs◼ While Distribution O&M spending decreased significantly last year, the five
year trend is still upward◼ Distribution Capital spending has been increasing steadily over the past 4
years. The increase is driven by replacement capital spending more than new business, which continues to be slow.
Practices◼ More companies are outsourcing portions of their distribution design work◼ Staff recruitment and retention is a significant issue in many Distribution
Operations Centers ◼ Equipment inspection and maintenance practices vary widely within the
community

5
Profiles & Trends

Distribution Lines Demographic Profile
2014YE 2013YE
Min Mean Max
# of Bars Min Mean Max
# of Bars
Service TerritoryDensity: Customers per Square mile 9.20 480.98 1807.36 15 1.90 338.90 975.02 16Density: Customers per Distribution Circuit mile 24.82 54.01 101.65 14 17.61 51.34 101.26 15Percent of Distribution Circuit Miles Underground 14% 36% 66% 14 13% 37% 63% 15Percent of Switches outside the substation remotely operated 0% 20% 74% 9 0% 11% 62% 11Wage Rate: Distribution Journey Level Line Worker $34.64 $40.37 $50.72 13 $35.30 $39.13 $42.14 12Distribution Staffing: FTEs per 100,000 Customers 19.69 74.02 157.33 11 36.15 79.45 143.02 13Percent of staffing group represented by a union/bargaining unit: Distribution Field 48% 84% 100% 8 0% 78% 100% 11KWh Sold per Distribution End-Use Customer 17567 25117 34709 15 18337 27036 35496 15Percent of Customers: Commercial/Industrial 9.33% 11.60% 16.76% 16 9.01% 11.60% 18.28% 16Percent of Load: Commercial/Industrial 10.35% 47.00% 69.00% 15 12.57% 56.19% 67.85% 14System - DemographicsVoltage Levels
5kV class = >1kV, <=9kV 0.0% 5.5% 37.2% 15 0.0% 11.0% 57.0% 1515kV class = >9kV, <=15kV 0.0% 69.3% 98.0% 15 0.0% 65.2% 99.0% 1525kV class = >15kV to <=26kV 0.0% 15.1% 86.7% 15 0.0% 15.0% 86.7% 1535kV class = >26kV to <=36kV 0.0% 10.1% 42.0% 15 0.0% 8.4% 53.9% 1544kV class = >36kV to <=44kV 0.00% 0.00% 0.00% 15 0.00% 0.39% 5.80% 15
Financial - DemographicsDistribution Line Assets per Customer $2,160 $3,011 $4,590 14 $1,672 $2,823 $4,102 15
Changes in the demographics profile are driven mostly by modifications of the community. Customer density within the panel increased significantly this year.

Distribution Lines Cost Profile
7
O&M spending is down significantly from last year, while Capital spending has increased.
Profile values and counts may differ from report values and counts due to the exclusion of companies that did not provide complete data sets.
2014YE 2013YE
Mean Q1 Q2 Q3 Bars Mean Q1 Q2 Q3 Bars
O&M
Distribution O&M Expense per Customer $85.34 $62.60 $83.29 $105.63 15 $89.58 $70.02 $86.74 $109.47 15
Distribution O&M less Veg Mgmt per Customer [Activity-based]
$68.65 $52.63 $66.31 $79.31 12 $76.91 $61.72 $68.15 $94.59 12
Distribution O&M per circuit miles $4,142 $3,121 $4,261 $4,675 13 $4,544 $3,190 $4,150 $5,933 13
Distribution O&M per MWh $3.51 $2.78 $3.24 $4.42 14 $3.45 $2.59 $3.33 $4.27 14
Distribution O&M Expense per Distribution Assets 2.89% 2.20% 2.87% 3.59% 14 3.37% 2.43% 3.07% 3.69% 14
Distribution O&M less Veg Mgmt per Total Dist. Assets [Activity-based]
2.07% 1.58% 1.85% 2.20% 12 2.38% 1.92% 2.38% 2.84% 12
Capital
Distribution Line Capital Additions per Asset [FERC] 4.95% 5.97% 4.94% 3.86% 14 4.59% 5.68% 4.58% 3.60% 14
Distribution Line Capital Spending less Serve New, Expand per Asset [Activity Based]
4.33% 4.57% 3.82% 3.52% 14 3.98% 4.48% 3.14% 2.73% 14

Total Distribution Capital Spending and O&M Spending (FERC)
8
Spending per Customer Spending per Asset
Most companies spend more capital than O&M. Total spending at the high end is more than 2x that of the lowest spenders.
DF page 3 – Questions DF5, DF20, ST5 DF page 5 – Questions DF5, DF20, DF70
Mean 7.841 %
Quartile 1 5.954 %
Quartile 2: 7.948 %
Quartile 3: 9.566 %
Mean $234.27
Quartile 1 $190.48
Quartile 2: $215.76
Quartile 3: $275.71
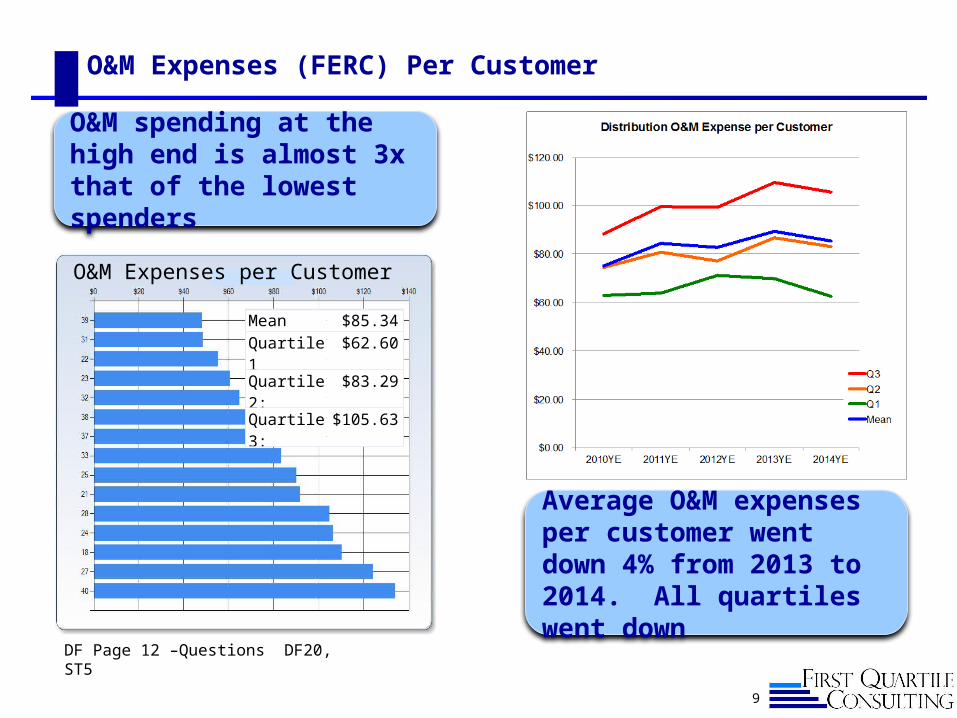
O&M Expenses (FERC) Per Customer
9
DF Page 12 –Questions DF20, ST5
O&M spending at the high end is almost 3x that of the lowest spenders
Average O&M expenses per customer went down 4% from 2013 to 2014. All quartiles went down
O&M Expenses per Customer
Mean $85.34
Quartile 1 $62.60
Quartile 2: $83.29
Quartile 3: $105.63

O&M Expenses (FERC) Per Asset
10
DF 14 – Questions DF20, DF70
O&M spending at the high end is almost 4x that of the lowest spenders
Average O&M expenses per asset went down 13% from 2013 to 2014. All quartiles went down
Percentage of Expenses per Asset
Mean 2.89 %
Quartile 1 2.20 %
Quartile 2: 2.87 %
Quartile 3: 3.59 %
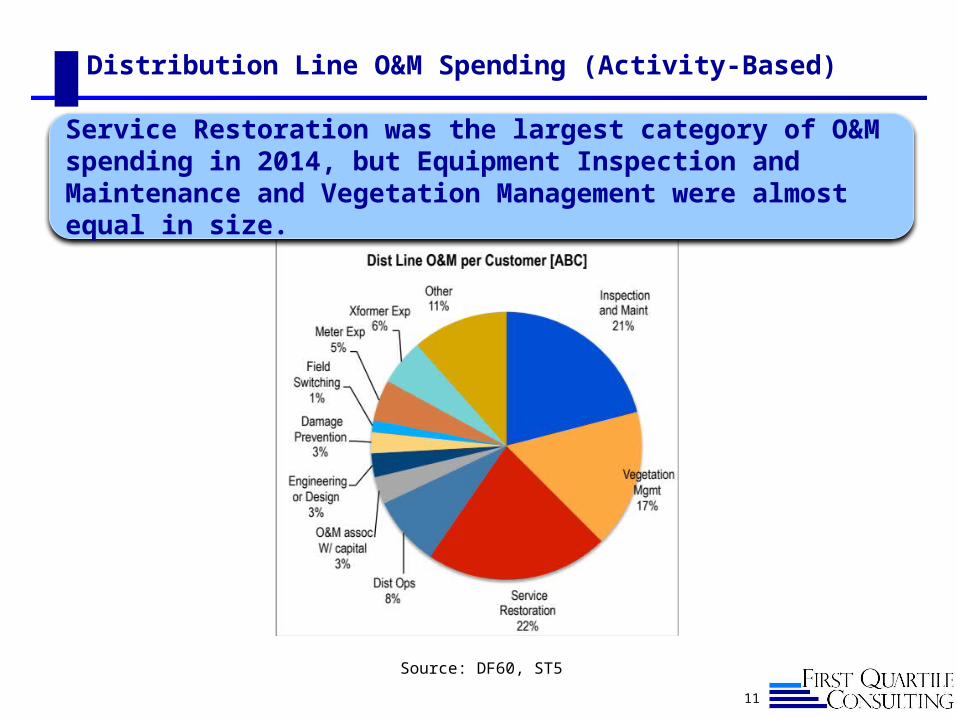
Distribution Line O&M Spending (Activity-Based)
11
Service Restoration was the largest category of O&M spending in 2014, but Equipment Inspection and Maintenance and Vegetation Management were almost equal in size.
Source: DF60, ST5
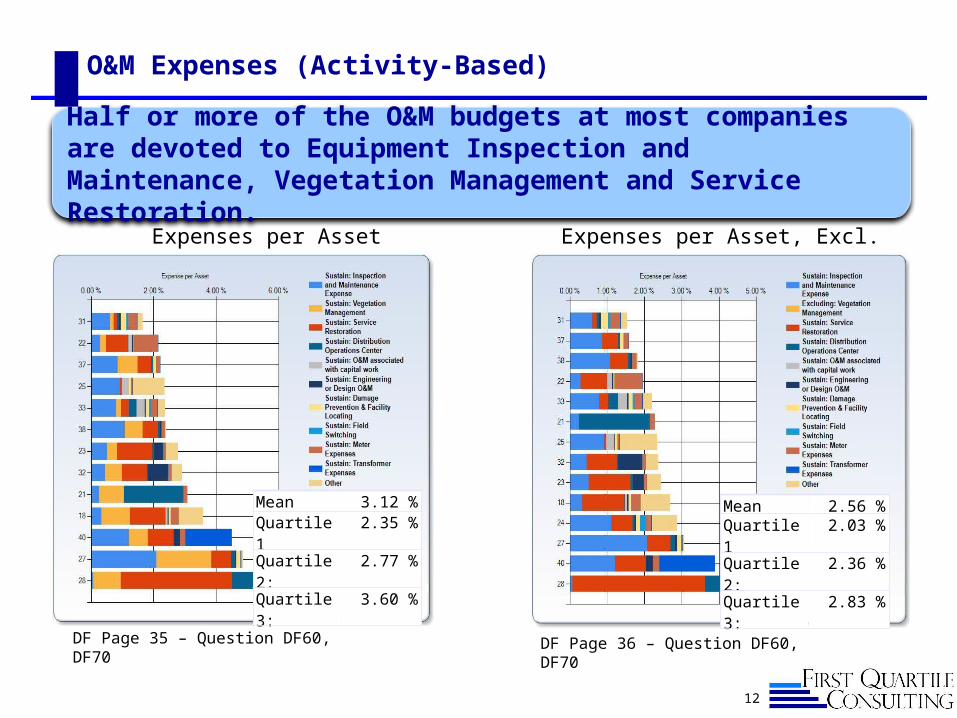
O&M Expenses (Activity-Based)
12
Expenses per Asset Expenses per Asset, Excl. Vegetation
Half or more of the O&M budgets at most companies are devoted to Equipment Inspection and Maintenance, Vegetation Management and Service Restoration.
DF Page 35 – Question DF60, DF70 DF Page 36 – Question DF60, DF70
Mean 3.12 %Quartile 1 2.35 %Quartile 2: 2.77 %Quartile 3: 3.60 %
Mean 2.56 %Quartile 1 2.03 %Quartile 2: 2.36 %Quartile 3: 2.83 %

Vegetation Management Expenses
13
The relative impact of Vegetation Management expenses varies widely across the community
DF Page 62 – Question DF60, ST35 DF Page 61 – Question DF60
Veg. Mgmt O&M per OH Circuit Mile Veg. Mgmt O&M as % of Total O&M
Mean $1,430
Quartile 1 $639
Quartile 2: $1,266
Quartile 3: $1,800
Mean 18.32 %
Quartile 1 11.80 %
Quartile 2: 16.64 %
Quartile 3: 25.13 %

Capital Spending (FERC) Per Customer
14
DF Page 7 – Question DF5, ST5
Last year, most companies invested $100 to $180 on capital projects per customer
Mean $127.45Quartile 1 $148.71Quartile 2: $131.85Quartile 3: $95.98
Mean $149.90Quartile 1 $166.86Quartile 2: $147.44Quartile 3: $125.91
Spending per Customer
Capital spending per customer has been increasing steadily since 2011. The average increased 18% last year

Capital Spending (FERC) per Asset
15
Last year, most companies invested between 3-6% per asset.
Spending per Asset
Mean 4.95 %Quartile 1 5.97 %Quartile 2: 4.94 %Quartile 3: 3.86 %
After three years of relatively flat spending , average Capital spending per asset increased 8% from 2013 to 2014. DF Page 9 – Question DF5, DF70

Distribution Line Capital Spending (Activity-Based)
16
Our T&D community’s capital spending to sustain and improve the distribution system significantly exceeded capital investments related to new customers and increased loads.
Source: DF50, DF70

Sustain Capital Spending
Sustaining capital investments have increased steadily since 2011
17
Spending Category
2010YEQ2
2011YEQ2
2012YEQ2
2013YEQ2
2014 YEQ2
Total Capital Spending (ABC)
4.56% 4.82% 4.33% 5.18% 6.02%
Less Serve New 1.14% 1.34% 0.81% 1.84% 1.52%
Subtotal Cap Add & Sustain
3.42% 3.48% 3.52% 3.84% 4.50%
Less Capacity Adds 0.73% 0.97 0.51% 0.51% 0.68%Subtotal: Sustain 2.69% 2.51% 3.01% 3.14% 3.82%
Capital Spending Per Asset
Source: DF50, DF70

New Business Capital
18
Last year most companies invested between 0.8-1.6% per asset on New Business
Companies at the lower quartiles have been increasing, while those at the top quartile decreased compared to last year and 2010
Mean 1.16 %Quartile 1 1.40 %Quartile 2: 1.13 %Quartile 3: 0.98 %
Source – Questions DF50, D70
19
Practice Modules
Using the Process Model

Develop System Strategy
Develop and Approve Asset Plans
Project/Portfolio Management
Expand System
A Process Model for Managing the T&D Business
20
Operate System
Sustain System
Indicates separate D, S, T components
Add New Customers
Respond to Emergencies
The Practice Modules that we will be discussing today fall within the Expand System, Operate System and Sustain System processes

Potential On-Site Presentation Modules – Distribution Practices
21
Developed for Today’s Presentation:
◼ Expand System: Planning/Engineering/Design
◼ Operate System: Distribution Operations Center (DOC)
◼ Sustain System: Line Equip. Inspection & Maintenance
This year we added numerous questions to better flesh out our understanding of how the various Distribution processes are being carried out. A total of six practice modules have been identified for the Distribution function which could be incorporated into First Quartile’s presentations at company On-Site meetings
Additional Modules That Can Be Developed:
◼ Add New Customers: New Business
◼ Expand System: Construction
◼ Sustain System: Vegetation Management

22
Distribution Practices --Distribution Planning, Engineering & Design

23
KPI’s Used To Monitor Planning/Engineering/Design Performance
Primary focus is on meeting schedules and cost. Two companies also have formal quality measures
Dist. Practices Page 9 – DP15
ID Response Schedule Cost Quality Others
27 Estimate to be within 10% of actual cost x
31 We currently track timeframes for various stages of our Design process; work request initiate, field check, and quality review. Designers are scored on addressing key points and following policies and procedures pertaining to their designs. We also track safety performance and our job estimates to actual dollars and CMH used.
x x x x
32 Capital Projects Approved (%) by January 1 x
33 Work Order On time completion x
37 On-time design completion, Estimate to Actual comparisons x x
38 Achieve Need Date Performance, Material Planned vs. Actual Variance, Achieve Material Returns less than 5%, Increase Inventory Turns, Achieve an average of 42 days from Walk to energized date, Reduce URD cost per lot. O&M and Capital Expenses, SAIDI, SAIFI, CAIDI
x x x x
25 None
30 Currently evaluating to determine how we can best measure performance utilizing SAP system (new WMS).
24
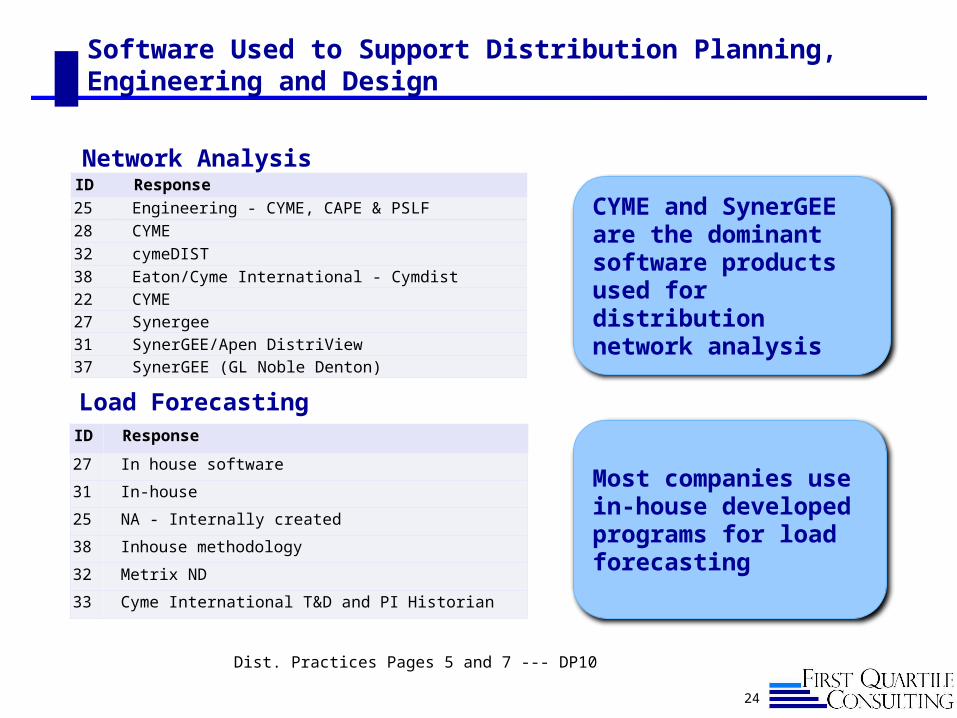
Software Used to Support Distribution Planning, Engineering and Design
ID Response25 Engineering - CYME, CAPE & PSLF
28 CYME
32 cymeDIST
38 Eaton/Cyme International - Cymdist
22 CYME
27 Synergee
31 SynerGEE/Apen DistriView
37 SynerGEE (GL Noble Denton)
ID Response
27 In house software
31 In-house
25 NA - Internally created
38 Inhouse methodology
32 Metrix ND
33 Cyme International T&D and PI Historian
Dist. Practices Pages 5 and 7 --- DP10
Network Analysis
Load Forecasting
CYME and SynerGEE are the dominant software products used for distribution network analysis
Most companies use in-house developed programs for load forecasting
25
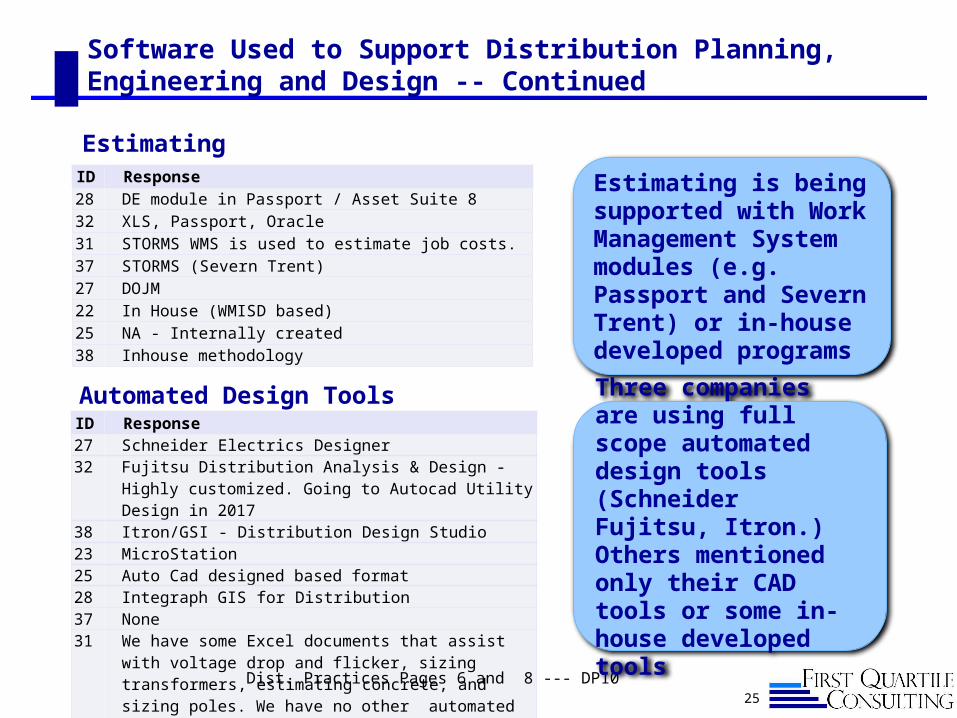
Software Used to Support Distribution Planning, Engineering and Design -- Continued
ID Response28 DE module in Passport / Asset Suite 8
32 XLS, Passport, Oracle
31 STORMS WMS is used to estimate job costs.
37 STORMS (Severn Trent)
27 DOJM
22 In House (WMISD based)
25 NA - Internally created
38 Inhouse methodology
ID Response27 Schneider Electrics Designer32 Fujitsu Distribution Analysis & Design - Highly customized.
Going to Autocad Utility Design in 201738 Itron/GSI - Distribution Design Studio23 MicroStation25 Auto Cad designed based format28 Integraph GIS for Distribution37 None31 We have some Excel documents that assist with voltage
drop and flicker, sizing transformers, estimating concrete, and sizing poles. We have no other automated design tools.
Dist. Practices Pages 6 and 8 --- DP10
Estimating is being supported with Work Management System modules (e.g. Passport and Severn Trent) or in-house developed programs
Three companies are using full scope automated design tools (Schneider Fujitsu, Itron.) Others mentioned only their CAD tools or some in-house developed tools
Estimating
Automated Design Tools
26
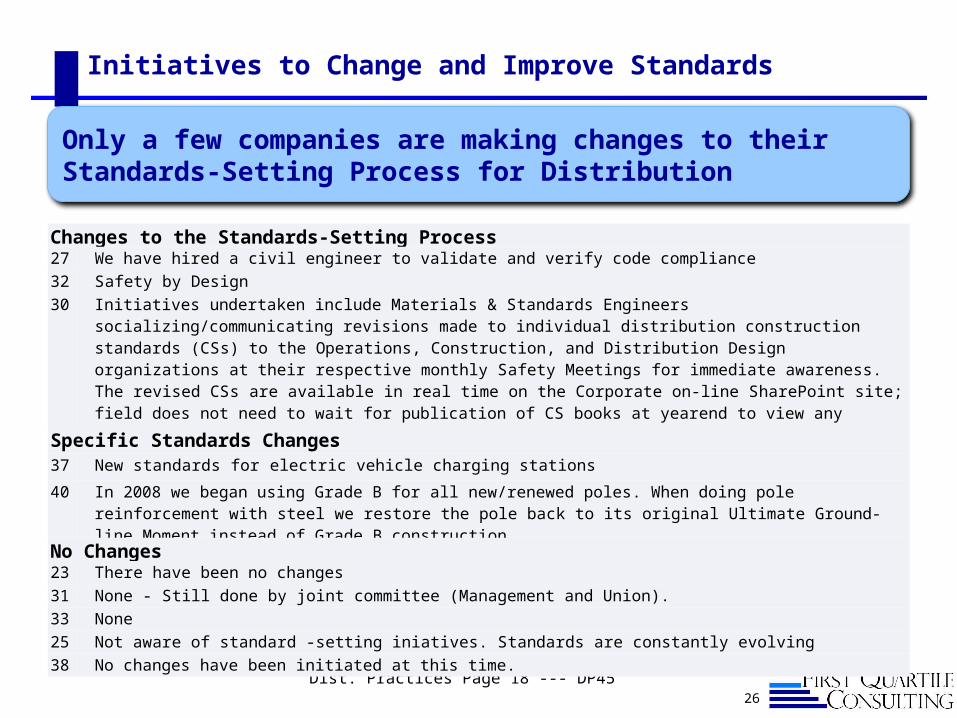
Initiatives to Change and Improve Standards
Dist. Practices Page 18 --- DP45
Changes to the Standards-Setting Process27 We have hired a civil engineer to validate and verify code compliance
32 Safety by Design
30 Initiatives undertaken include Materials & Standards Engineers socializing/communicating revisions made to individual distribution construction standards (CSs) to the Operations, Construction, and Distribution Design organizations at their respective monthly Safety Meetings for immediate awareness. The revised CSs are available in real time on the Corporate on-line SharePoint site; field does not need to wait for publication of CS books at yearend to view any changes/revisions.
Specific Standards Changes37 New standards for electric vehicle charging stations
40 In 2008 we began using Grade B for all new/renewed poles. When doing pole reinforcement with steel we restore the pole back to its original Ultimate Ground-line Moment instead of Grade B construction.
No Changes23 There have been no changes
31 None - Still done by joint committee (Management and Union).
33 None
25 Not aware of standard -setting iniatives. Standards are constantly evolving
38 No changes have been initiated at this time.
Only a few companies are making changes to their Standards-Setting Process for Distribution

27
Designer Occupation – Areas of Responsibility
ID Job Title(s) Areas of Responsibility
25 Designer 1, 2 Currently work load not separated, assignment is based geographically and by ability. Designers are responsible to prepare scaled maps utilizing computer aided design software, pull material codes, cost, in-put and validate billing and contracts are correct.
27 Tech SpecialistSr. Tech SpecialistDesign Techs 1, 2 3
Design all 34kv and below projects
30 Customer Planning Representative
Design and estimate all Asset Care and Customer care work on distribution system.
31 Field Technician (FT)
Designer
FT performs civil inspections and basic design work; services, pole replacement, basic single phase design. Designer performs all more complex distribution design work; commercial/industrial, system reinforcement, public improvement, subdivision. Designers also assist with transmission relocation and maintenance.
32 Design Representatives (5 levels)
Design, cost estimates, liase with customers etc.
33 Designer 1, 2, 3 Customer Engineering, Distribution Engineering
37 General Design Technician (GDT)Field Design Specialist (FDS)Engineer I, II, III
GDT-Service coordination, 1 phase extensions, standard 3 phase commercial extensions
FDS -completes 3 phase commercial & industrial extensions, road re-locations, Eng. I/II/III-complex 3 phase commercial & industrial extensions, road re-locations
38 Service Consultant I, II, III Designs project and is the single point of contact to the developer on all Joint Use work
Dist. Practices Pages 10 and 11 --- DP20
Designer occupation job titles and degree of specialization/ concentration vary

28
Designer Occupation – Entry Level Education Requirements
ID Job Title(s) Education Requirements
25 Designer 1, 2 Associates degree preferred, Auto CAD experience required
27 Tech SpecialistSr. Tech SpecialistDesign Techs 1, 2 3
High School Diploma
30 Customer Planning Representative
Two years of college in an engineering discipline
31 Field Technician (FT)Designer
FT – High school diplomaDesigner - This is a craft position that requires a 4yr apprenticeship. These candidates are typically hired internally; they need a High School Diploma to qualify for the apprenticeship
32 Design Representatives (5 levels)
High School graduation
33 Designer 1, 2, 3 HS or associates
37 General Design Technician (GDT)Field Design Specialist (FDS)Engineer I, II, III
GDT-High School (union position),
FDS-High School Diploma, Bachelor's degree preferredE I/II/III- Engineering degree from accredited University
38 Service Consultant I, II, III Degree
Post-high school education is desired but is generally not required for people who are entering the Designer ranks
Dist. Practices Pages 10 and 12 --- DP20

29
Designer Occupation – Entry Level Work Experience Requirements
ID Job Title(s) Work Experience Requirements
25 Designer 1, 2 Design/drafting utilizing CAD based software for electric utility, electrical distribution design, engineering design, or construction
27 Tech SpecialistSr. Tech SpecialistDesign Techs 1, 2 3
None
30 Customer Planning Representative
None - We train all new hires
31 Field Technician (FT)Designer
FT - Electrical construction experience preferred, knowledge of electric distribution systems, understanding of utility business, basic computer knowledge. Candidates are put through a written and practical exam.Designer -- 4yrs experience as a Field Technician, proficiency with our Design Tools, knowledge of our Transmission/ Distribution Systems.
32 Design Representatives (5 levels)
30 months for entry level
33 Designer 1, 2, 3 >1 yrs. Exp. in Construction practices, GIS/Drafting or Customer Service
37 General Design Technician (GDT)Field Design Specialist (FDS)Engineer I, II, III
GDT-union seniority,
FDS-5 years in electrical construction,E I/II/III-varies
38 Service Consultant I, II, III No prior work experience is required for an Associate Service Consultant (I).
Work experience requirements vary. Three companies do not require any prior work experience to enter the Designer ranks
Dist. Practices Pages 10 and 13 --- DP20

30
Outsourcing of Distribution Line Design Work
ID Y/N CommentsCurrently Outsourcing Design Work22 Yes25 Yes Design continues to utilize Contract Planners to support work load beyond resource capability. Additionally
this allows flexibility in resource levels that would not be available with internal employees. Regarding Engineering, some studies have been outsourced
27 Yes Protection and Control is using contractors.28 Yes Most large projects are contracted to engineering firms for detailed design31 Yes We do not have any major outsourcing efforts underway.32 Yes We have a EPCM service provider (Engineer, Procure, Construction Manage)
33 Yes Outsourcing Pole Attachment design and inspections.38 Yes Currently using one(1)Contract Designer to assist in URD designs40 Yes We to outsource work to contract design firms as needed to supplement workload, but no major efforts are
underway.No Current Outsourcing21 No23 No30 No None at the present time.37 No no active programs
Dist. Practices Page 4 - DP5 and Staffing Page 59 – SO115
Most companies are now outsourcing portions of their distribution line design work

31
Systems For Estimating The Hours Required To Complete Different Types of Design Work
Dist. Practices Page 16 – DP35
Have System25 Anecdotally developed with front line leaders, validated through historical output ability and refined
32 Partially - Designers charged to charge codes for different classes of work. For EOL work we can calculate an average unit cost for design.
33 Actual design hours per construction point per work order. Averages of hours per construction point range from 3 to 10 hrs per cp.
38 Service Consultant Model
No System27 No
30 We did have a system in our previous WMS. However, it is not available in SAP.
31 Not at this time. We are working on this currently.
Only about half of the responding companies have formal systems to estimate the time required to complete different types of design work

32
Monitoring the Quality of Design Work Performed By Company Employees
Reviews of Completed Orders31 We have a quality review process and Designers are graded32 Each design employee has a certain threshold for self approval. Once a projects approval level exceeds that
threshold, a peer review will ensue. For projects over a certain $ value, there are higher levels of technical, finanicial, and manager risk review completed. In Addition, Projects and Contract Management also complete a quality assurance review of constructed works monthly which eavluates design, engineering standards, and construction quality of work and feedback is provided where gaps exist.
33 Supervisor review establishes quantity of errors per sketch
38 Every work order is reviewed prior to being sent to the Developer for their approval.
Construction Feedback27 Feedback from the field
30 We typically will gauge it based on Construction organization's ability to build the product as designed.
31 We also have a variance/feedback report program where crews provide feedback.
Others37 Estimate to Actual comparisons
25 Various metrics and review processes over the years. Currently developing a formal review process that will translate to a metric.
Dist. Practices Page 17 --- DP40
At most companies, Design Quality is monitored through office reviews of orders and construction feedback.

33
Distribution Practices --Distribution Operations Center
(DOC)
34
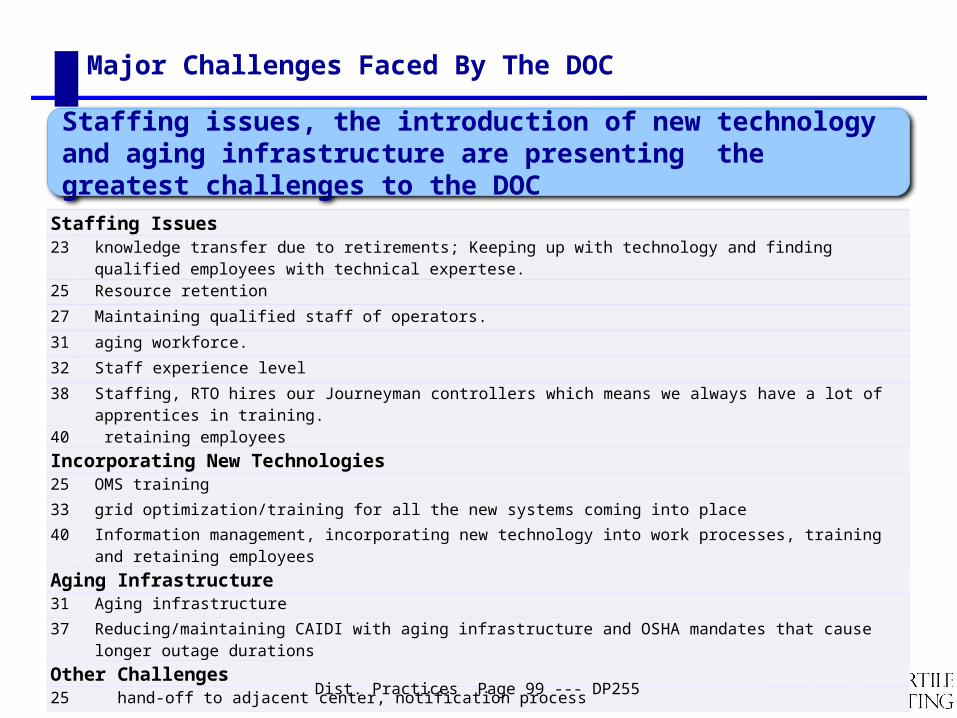
Major Challenges Faced By The DOC
Staffing Issues 23 knowledge transfer due to retirements; Keeping up with technology and finding qualified employees with technical
expertese.25 Resource retention
27 Maintaining qualified staff of operators.
31 aging workforce.
32 Staff experience level
38 Staffing, RTO hires our Journeyman controllers which means we always have a lot of apprentices in training.
40 retaining employeesIncorporating New Technologies25 OMS training
33 grid optimization/training for all the new systems coming into place
40 Information management, incorporating new technology into work processes, training and retaining employees
Aging Infrastructure31 Aging infrastructure
37 Reducing/maintaining CAIDI with aging infrastructure and OSHA mandates that cause longer outage durations
Other Challenges25 hand-off to adjacent center, notification process
Staffing issues, the introduction of new technology and aging infrastructure are presenting the greatest challenges to the DOC
Dist. Practices Page 99 --- DP255
35
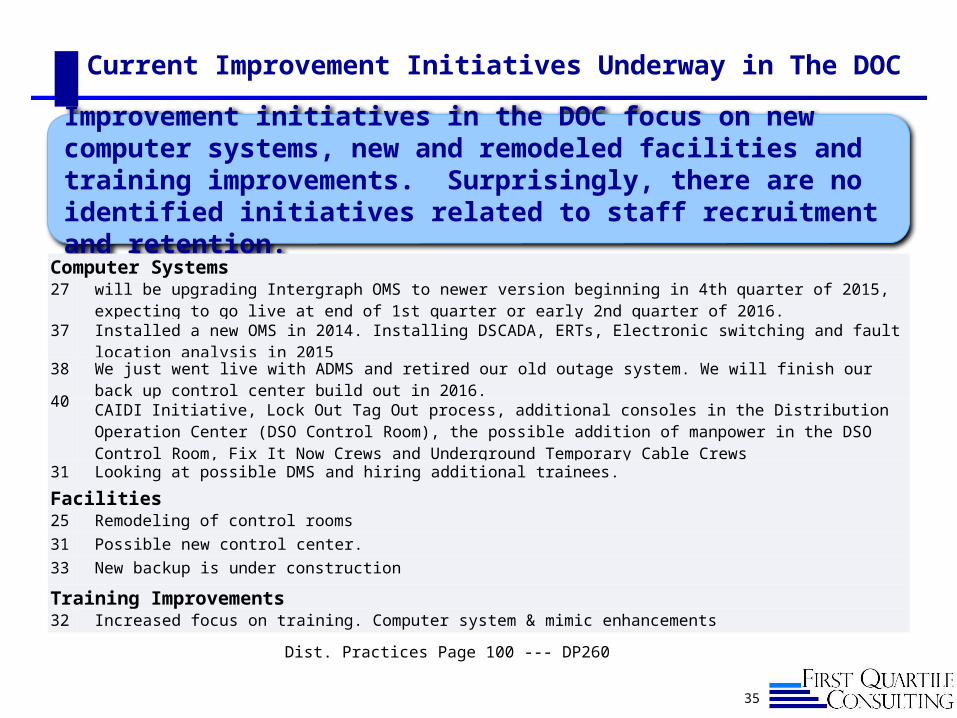
Current Improvement Initiatives Underway in The DOC
Improvement initiatives in the DOC focus on new computer systems, new and remodeled facilities and training improvements. Surprisingly, there are no identified initiatives related to staff recruitment and retention.
Dist. Practices Page 100 --- DP260
Computer Systems27 will be upgrading Intergraph OMS to newer version beginning in 4th quarter of 2015, expecting to go live at end of
1st quarter or early 2nd quarter of 2016.
37 Installed a new OMS in 2014. Installing DSCADA, ERTs, Electronic switching and fault location analysis in 2015
38 We just went live with ADMS and retired our old outage system. We will finish our back up control center build out in 2016.
40 CAIDI Initiative, Lock Out Tag Out process, additional consoles in the Distribution Operation Center (DSO Control Room), the possible addition of manpower in the DSO Control Room, Fix It Now Crews and Underground Temporary Cable Crews
31 Looking at possible DMS and hiring additional trainees.
Facilities25 Remodeling of control rooms
31 Possible new control center.
33 New backup is under construction
Training Improvements32 Increased focus on training. Computer system & mimic enhancements

36
Use of Advanced Distribution Management Systems (ADMS)
Less than half of the responding companies reported that they have installed an Advanced Distribution Management System (ADMS). Volt/VAR Optimization is the most widely used application module
Dist. Practices Pages 101 to 103 --- DP265, DP270
Now Have ADMS Installed? 23 25 27 31 32 33 37 38 40
Yes ♦ ♦ ♦ ♦ 44.4%No ♦ ♦ ♦ ♦ ♦ 55.6%
ADMS Modules In Use 32 33 37 38
VoltVar Optimiization ♦ ♦ ♦ 75.0%
Fault Location Isolation and Service Restoration
♦ 25.0%
Network configuration ♦ 25.0%Training simulator ♦ 25.0%Other – Monarch Data Analysis
♦ 25.0%

37
Impacts of Distributed Generation on the DOC
ID Response – Unfavorable Impacts Response -- Favorable Impacts
25 NEGATIVE VOLTAGE IMPACT, ADVERSE IMPACTS ON NORMAL SWITCHING ACTIVITIES
ENHANCED CIRCUIT LOADING RELIABILITY, ENHANCED VOLTAGE CAPABILITY
27 No Impact No Impact
31 Difficult to field switch due to unknown flows on distribution system.
None known.
32 N/A
33 None Reduces the load on the distribution bus
37 Very little has impacted the service territory n/a
38 Hard to coordinate and can cause scheduling issues
3 of 7 note unfavorable impacts related to switching issues2 of 7 note favorable impacts related to loading2 have seen little or no impact, either favorable or unfavorable
Dist. Practices Pages 104 and 105 --- DP275
38
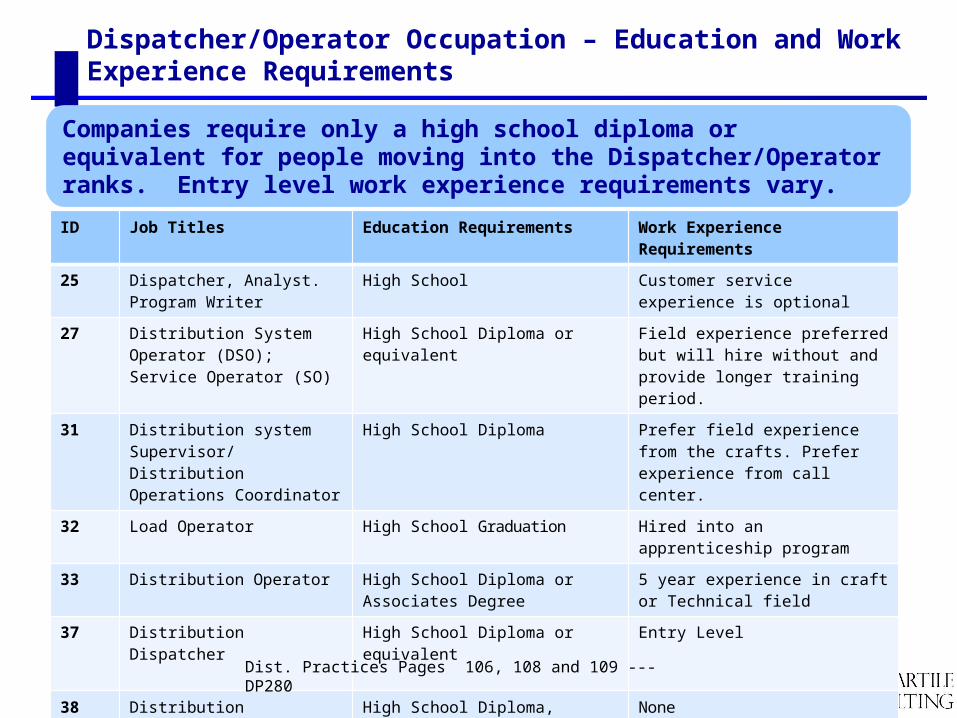
Dispatcher/Operator Occupation – Education and Work Experience Requirements
ID Job Titles Education Requirements Work ExperienceRequirements
25 Dispatcher, Analyst. Program Writer
High School Customer service experience is optional
27 Distribution System Operator (DSO); Service Operator (SO)
High School Diploma or equivalent Field experience preferred but will hire without and provide longer training period.
31 Distribution system Supervisor/ Distribution Operations Coordinator
High School Diploma Prefer field experience from the crafts. Prefer experience from call center.
32 Load Operator High School Graduation Hired into an apprenticeship program
33 Distribution Operator High School Diploma or Associates Degree
5 year experience in craft or Technical field
37 Distribution Dispatcher High School Diploma or equivalent Entry Level
38 Distribution controller High School Diploma, college preferred
None
Dist. Practices Pages 106, 108 and 109 --- DP280
Companies require only a high school diploma or equivalent for people moving into the Dispatcher/Operator ranks. Entry level work experience requirements vary.

39
ID Job Titles Entry Level Work ExperienceRequirements
Required Classroom
Training Hours
Required On The Job
Training Hours
25 Dispatcher, Analyst. Program Writer
Customer service experience is optional
0 480
27 Distribution System Operator (DSO); Service Operator (SO)
Field experience preferred but will hire without and provide longer training period.
0 4160
31 Distribution system Supervisor/ Distribution Operations Coordinator
Prefer field experience from the crafts. Prefer experience from call center.
0 1040
32 Load Operator Hired into an apprenticeship program
35 105
33 Distribution Operator 5 year experience in craft or Technical field
0 2080
37 Distribution Dispatcher Entry Level 880 160
38 Distribution controller None
Dist. Practices Pages 106, 109 and 11--- DP280, D290
Hours of Required Training For New Dispatchers/Operators
Companies vary widely in the amount of training that new Dispatchers/ Operators must complete before being allowed to work independently. The differences do not correlate to differences in required entry-level work experience.

40
Hours of Lead Time Required For Planned Switching Requests
1 Day32 Day ahead
33 Plan work is 24 hours. Emergency work is ASAP.
38 We request 24 hour notice for all planned switching but we will write the order real time if needed and notiffy that persons management that they did not give us 24 hour notice.
2 Days27 48 hours
37 48 hour notice required for planned switching
31 Preferably two business days or more.
More than 2 Days25 11 days
Most company DOC’s require either one or two days of lead time for planned switching requests
Dist. Practices Page 114--- Question DP305

41
Processes and Support Technologies for Preparing and Communicating Switching Orders
ID Switching Order Preparation Communication to the Field27 If complex job an Engineer reviews and suggests switching.
Operators either review Engineer suggestion or create own switching, a different Operator reviews switching and the operator on duty will perform 3rd check of switching again prior to issuing. We mainly use OMS and GIS to verify switching accuracy. Engineers use their tools to plan switching events.
When possible switching is sent to field prior to beginning of job. Preferred communication is by radio but often requires the use of cell phones.
31 All switching orders are reviewed by a qualified System Supervisor before being switched.
All switching orders are switched over the air via radio using 3 point communication unless there is no radio coverage then cell phones are used.
32 Manually prepared and checked by different Operators Fax and verbal33 Switching order are written and verified using OMS system, circuit
one-lines and station one-lines, when the job is approved. Then checked by Supervisor. The order are then checked using same tools by the operator that will be issuing the orders.
System Operations uses OMS and Mobile Data to dispatch work and three part communication when communicating to field personnel.
37 Switching request is sent to DSO via fax or email. The distribution dispatcher prepares the switching. Switching is reviewed by a Supervisor. Dispatchers have the option to go through the switching in OMS in study mode to further verify the switching. Dispatcher then gives out and executes the switching order with field personnel
The switching is faxed down to the service center prior to executing. The switching is then issued over the phone or radio. Each individual switching step is required to be communicated over radio system as it is being executed
38 All switching orders need to be checked by two controllers. Planned switching orders are written in advance and checked and then checked again when issued.
On planned switching we attach the switching order to the SAP work order and will also email it to field personnel. On trouble switching we will use our radio. All switching planned or unplanned is done on the radio or phone step by step as it occurs in real time.
Typically switching orders are checked by multiple dispatchers/operators before they are issued. Companies are using a variety of methods to communicate orders to field personnel
Dist. Practices Pages 115 and 116--- Questions DP310 and DP315

42
KPI’S Used to Monitor DOC Performance
25 LOAD RESTORATION, CANCEL/RESCHEDULE, WD RESPONSE TIME, OUTAGES <24 HOURS
33 CAIDI
37 SAIDI, CAIDI, and switching errors
38 SAIDI goals and how long it takes to isolate circuits and dispatch trouble orders
27 None
31 None.
32 NA
Surprisingly, only a few companies identified specific KPI’s that they use to monitor and evaluate the performance of the DOC. System reliability measures are the most common.
Dist. Practices Page 113--- Question DP300

43
Distribution Practices --Line Equipment Inspection &
Maintenance
44
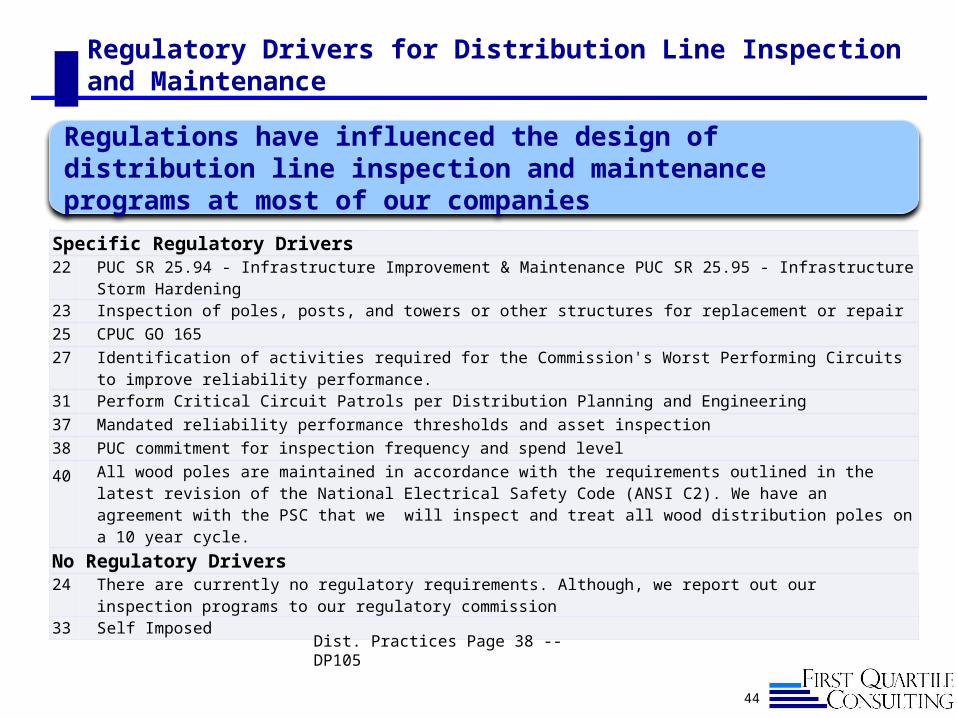
Regulatory Drivers for Distribution Line Inspection and Maintenance
Specific Regulatory Drivers22 PUC SR 25.94 - Infrastructure Improvement & Maintenance PUC SR 25.95 - Infrastructure Storm Hardening
23 Inspection of poles, posts, and towers or other structures for replacement or repair
25 CPUC GO 165
27 Identification of activities required for the Commission's Worst Performing Circuits to improve reliability performance.
31 Perform Critical Circuit Patrols per Distribution Planning and Engineering
37 Mandated reliability performance thresholds and asset inspection
38 PUC commitment for inspection frequency and spend level
40 All wood poles are maintained in accordance with the requirements outlined in the latest revision of the National Electrical Safety Code (ANSI C2). We have an agreement with the PSC that we will inspect and treat all wood distribution poles on a 10 year cycle.
No Regulatory Drivers24 There are currently no regulatory requirements. Although, we report out our inspection programs to our regulatory
commission33 Self Imposed
Regulations have influenced the design of distribution line inspection and maintenance programs at most of our companies
Dist. Practices Page 38 -- DP105

45
Pole Management Activity
The majority of utilities are on a 10-year cycle for pole inspection
Years Between Inspections
Of the 10 companies responding, all 10 capitalize pole reinforcement and bracing, while only two capitalize pole treatment.
Dist. Practices Pages 37 and 39 -- DP100, DP110
Mean 12
Quartile 1 10
Quartile 2: 10
Quartile 3: 12

46
Cable Treatment for Life Extension
All of the companies that are using cable injection in this year’s survey reported that they capitalize that work
2014 Responses
2013 Responses
Use cable injection 6 companies(22, 24, 25, 32, 33, 37)
4 companies
Do not use cable injection
4 companies(23,27,30,31)
7 companies
Cable types, splice types and other factors drive decisions on cable treatment. This year’s results show more companies performing cable treatment
Dist. Practices Pages 50 and 51 -- DP130, DP135

47
Planned I&M Programs – Overhead Line Equipment
Planned I&M Programs* 22 24 25 27 30 31 33 37
Capacitor Banks ♦ ♦ ♦ ♦ 50.0%Line Switches and Reclosers
♦ ♦ ♦ ♦ 50.0%
Distribution Transformers ♦ ♦ ♦ 37.5%Conductors and Splices ♦ ♦ ♦ ♦ 50.0%Pole Attachments and Guying
♦ ♦ ♦ ♦ ♦ 62.5%
Ground Wires ♦ ♦ ♦ ♦ 50.0%
Only about half of the responding companies have planned inspection and maintenance programs for overhead line equipment other than poles
Dist. Practices Pages 40 to 45 -- DP115
* Information summarized from text responses. Program was counted on this chart if text responses indicated that all or most equipment in the category was inspected on a scheduled basis
48
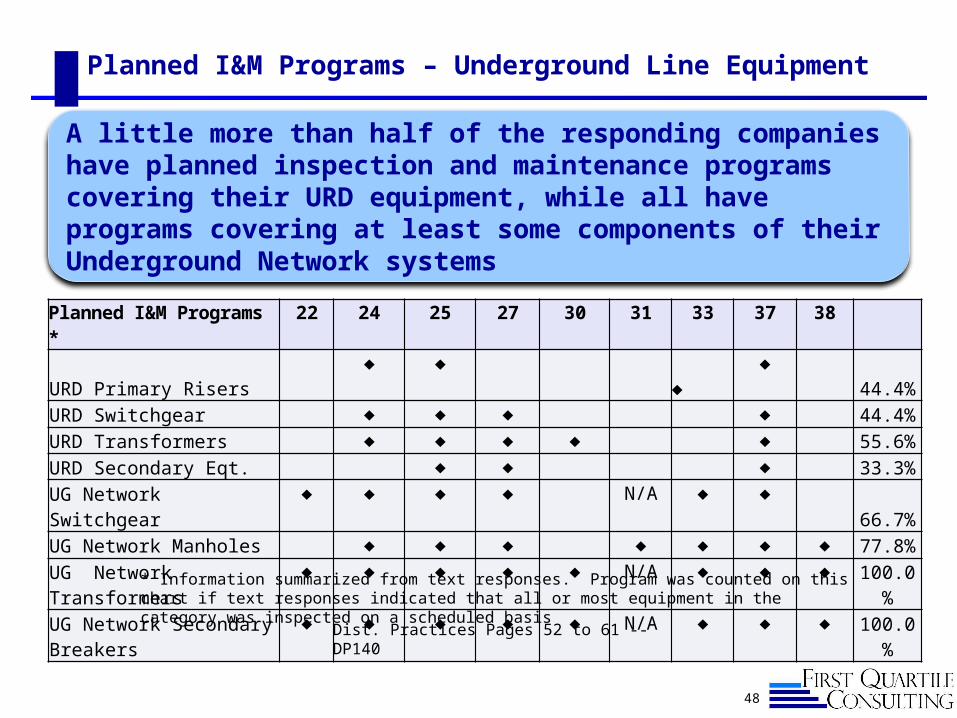
Planned I&M Programs * 22 24 25 27 30 31 33 37 38
URD Primary Risers ♦ ♦ ♦ ♦ 44.4%URD Switchgear ♦ ♦ ♦ ♦ 44.4%URD Transformers ♦ ♦ ♦ ♦ ♦ 55.6%URD Secondary Eqt. ♦ ♦ ♦ 33.3%UG Network Switchgear ♦ ♦ ♦ ♦ N/A ♦ ♦ 66.7%UG Network Manholes ♦ ♦ ♦ ♦ ♦ ♦ ♦ 77.8%UG Network Transformers ♦ ♦ ♦ ♦ ♦ N/A ♦ ♦ ♦ 100.0%UG Network Secondary Breakers
♦ ♦ ♦ ♦ ♦ N/A ♦ ♦ ♦100.0%
A little more than half of the responding companies have planned inspection and maintenance programs covering their URD equipment, while all have programs covering at least some components of their Underground Network systems
Dist. Practices Pages 52 to 61 -- DP140
Planned I&M Programs – Underground Line Equipment
* Information summarized from text responses. Program was counted on this chart if text responses indicated that all or most equipment in the category was inspected on a scheduled basis
49
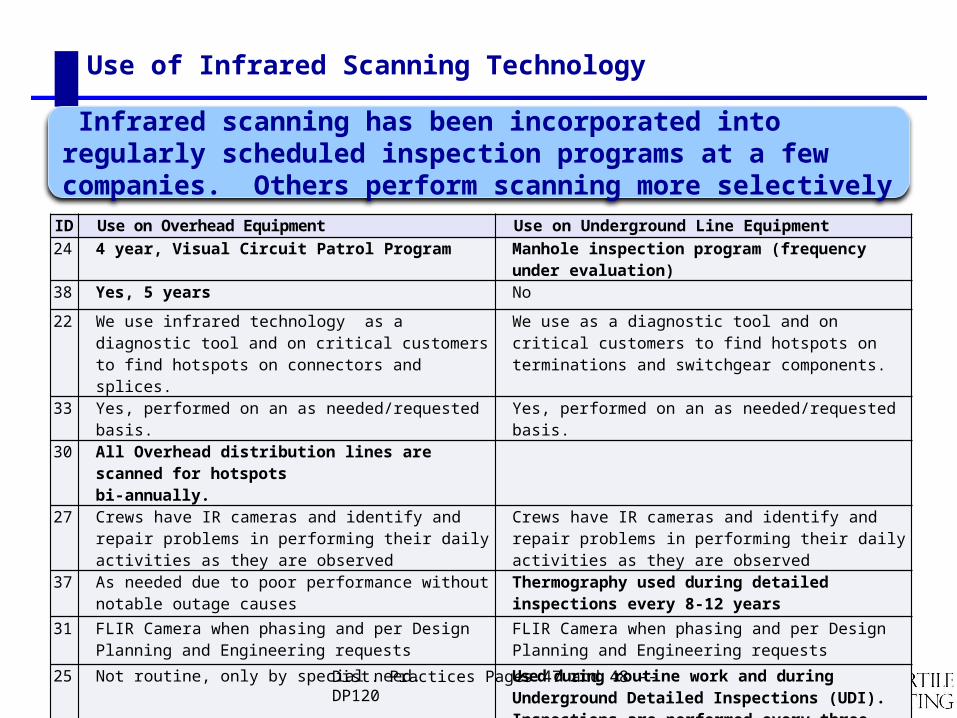
Use of Infrared Scanning Technology
ID Use on Overhead Equipment Use on Underground Line Equipment
24 4 year, Visual Circuit Patrol Program Manhole inspection program (frequency under evaluation)
38 Yes, 5 years No
22 We use infrared technology as a diagnostic tool and on critical customers to find hotspots on connectors and splices.
We use as a diagnostic tool and on critical customers to find hotspots on terminations and switchgear components.
33 Yes, performed on an as needed/requested basis. Yes, performed on an as needed/requested basis.
30 All Overhead distribution lines are scanned for hotspots bi-annually.
27 Crews have IR cameras and identify and repair problems in performing their daily activities as they are observed
Crews have IR cameras and identify and repair problems in performing their daily activities as they are observed
37 As needed due to poor performance without notable outage causes
Thermography used during detailed inspections every 8-12 years
31 FLIR Camera when phasing and per Design Planning and Engineering requests
FLIR Camera when phasing and per Design Planning and Engineering requests
25 Not routine, only by special need. Used during routine work and during Underground Detailed Inspections (UDI). Inspections are performed every three years for subsurface equipment and five years for padmounted.
Infrared scanning has been incorporated into regularly scheduled inspection programs at a few companies. Others perform scanning more selectively
Dist. Practices Pages 47 and 48 -- DP120

50
Software Used to Plan and Track Line Maintenance Work
Work Management System - SAP25 SAP is our WMS. We use a field application to collect, validate, and process inspections in the field.
38 GIS, Excel, SAP
Work Management System - Passport24 Passport WO Tasks
Work Management System - Maximo22 Maximo and Excel Spreadsheets
Specialized Systems27 Utilized the ESRI GIS to track and plan the pad mounted equipment external inspection. New EAM system
being implemented in 201632 in house developed system37 GTECH (store the records) and P3 Database (reporting feature within this program)
Other Responses 31 Use cable loading calculations to determine planned cable replacements33 Microsoft Excel
Dist. Practices Page 64 -- DP145
Half of the responding companies use their Work Management Systems to plan and track their line maintenance work. Three companies have developed or are planning to develop specialized systems to support this activity

51
Most Important Initiatives to Improve Distribution Line Maintenance
Worst Performing Circuit Patrols 31 We perform annual critical circuit patrols prioritized by SAIDI data from the previous year
33 Circuit Patrols on identified lines
37 Worst Performing Circuit/Lateral Inspections
Better Alignment of Programs27 Circuit walk down and repairs completed after tree trimming on worst performing circuits.
38 Our current initiative is to align our vegetation management, pole inspection and distribution line equipment. It is too early to determine the efficacy at this time.
Employee Training Improvements40 Use a training crew process is more conducive in the development of trainees. 3YR program - 3 months of core
training (compliance, safety, field visits), 7 months of classroom training, 8 months of OJT training with highly skilled crew leader and OH mechanic. OH 'B' Test is taken. 3 months classroom training, 15 months OJT training, OH 'M' Test. Blending trainees with a training crew enhances opportunities to develop and be better prepared for future job roles
Improvement initiatives focus on worst performing circuit patrols; better alignment of vegetation management, pole inspection and equipment inspection programs; and improvements in employee training
Dist. Practices Page 66 -- DP155

52
# People at Job Site for Various Line Maintenance Activities
Work Activity 24 25 27 31 32 33 37 38 Range Avg.
Day Shift Trouble Call First Response 1 1 1 1 1 1 1 1 All 1 1.00
Night Shift Trouble Call First Response 1 1 1 1 1 1 1 1 All 1 1.00
Overhead Line Patrol 1 1 1 2 2 1 1 1 1 - 2 1.25
Street Light Maintenance 1 1 1 2 2 2 1 1 1 - 2 1.38
Overhead High Voltage Switching 3 1 1 4 1 1 1 1 1 - 4 1.63
Underground High Voltage Switching 3 2 2 4 2 2 1 2 2 - 4 2.25
Underground Fault Location 1 1 2 4 2 3 2 2 1 - 4 2.13
Undergound Secondary Cable Repair 3 3 2 4 2 2 2 2 - 4 2.57
Underground Primary Cable Repair 3 3 3 4 3 9 3 3 - 9 4.00
Crew sizes for common line maintenance activities vary across the community, particularly with regards to switching activities and underground work
Dist. Practices Pages 67 to 75 -- DP160

53
% of Equipment I&M Spending That is Planned vs. Equipment Failure-Related SAIFI
Dist. Equipment Failure -Related SAIFI% of Total Dist. Eqt. I&M Spending That Is Planned
Surprisingly, the companies with low percentages of planned I&M spending are achieving better reliability results than those with high percentages of planned I&M spending
DR Page 41 – Question DR40DP Page 65– Questions DP150

54
Areas of Focus and Opportunity
◼ Investment Levels Understanding the long term impact of sustaining capital spending on
reliability and service restoration O&M
◼ Practices Evaluating the cost-effectiveness of planned inspection and
maintenance programs
55
Corporate Offices
400 Continental Blvd. Suite 600El Segundo, CA 90245(310) 426-2790
New York | Maryland | Texas | Wyoming | Wisconsin
First Quartile Consulting is a utility-focused consultancy providing a full range of consulting services including continuous process improvement, change management, benchmarking and more. You can count on a proven process that assesses and optimizes your resources, processes, leadership management and technology to align your business needs with your customer’s needs.
Visit us at www.1stquartileconsulting.com | Follow our updates on LinkedIn
About 1QC
Satellite Offices
Debi [email protected]
David [email protected]
Dave [email protected]
Dave [email protected]
Your Presenters
Ken Buckstaff [email protected]
Thank You for Your Input and Participation!

56
Appendix

57
Customer Growth Rate – New Service Locations
Reported customer growth rates for the responding companies ranged from 0.26% to 2.44%.
System Activity Page 2 -- SA5, ST5
58
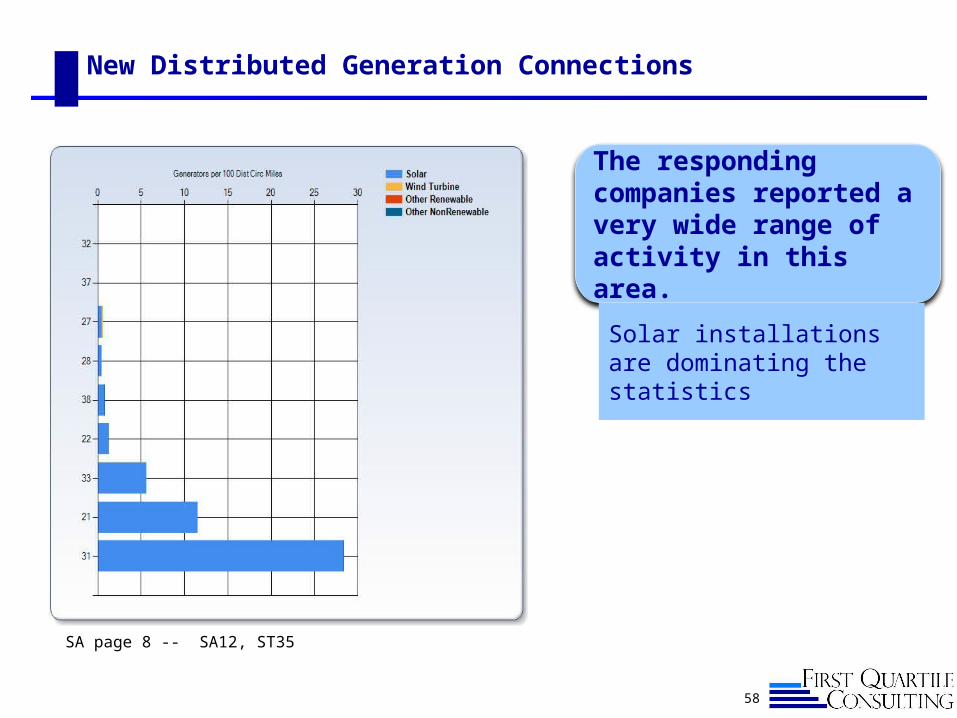
New Distributed Generation Connections
SA page 8 -- SA12, ST35
The responding companies reported a very wide range of activity in this area.
Solar installations are dominating the statistics
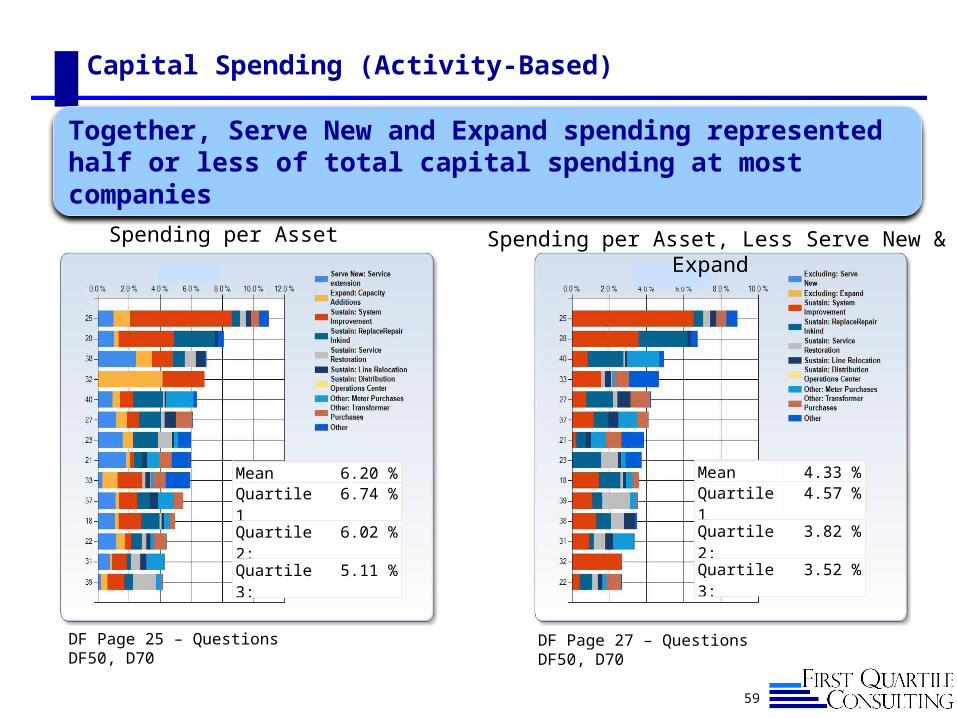
Capital Spending (Activity-Based)
59
DF Page 25 – Questions DF50, D70
Together, Serve New and Expand spending represented half or less of total capital spending at most companies
Spending per Asset
Mean 6.20 %Quartile 1 6.74 %Quartile 2: 6.02 %Quartile 3: 5.11 %
Spending per Asset, Less Serve New & Expand
Mean 4.33 %Quartile 1 4.57 %Quartile 2: 3.82 %Quartile 3: 3.52 %
DF Page 27 – Questions DF50, D70

60
Measures of Designer Productivity
Multiple Measures 23 Estimate v. actual job cost tracking; on-time completion
27 Design Time / Delivery Standard, Work packet Completness, Closing backlog - time window, Estimate accuracy,
32 Value of Designs Issued / FTE; Utilization (Charagble Time / Total Time)
33 Efficiency (Est. Plan Hrs vs. Act. Plan Hrs), Quality (# of errors/job), On-Time Completion (Requested Design Completion Date vs. Release to Construction)
37 Total construction hours designed, # jobs designed, estimate to actuals comparisons
38 We use a flow chart ('Basic Design Work Flow with Timeline Target') involving all Dry Utilities to complete all designs within 32 days from receipt of Final cad file usually driven by Developers need date.
40 Designers are measured on Quality, Difficulty level, # of designs produced, planned construction $s & planned construction hours, and overall productivity The results achieved are recorded onour individual metrics scorecard on the DS SharePoint site
Single Measure25 Designer productivity is assigned as a percentage of the Planner productivity values for the work orders that they
design.No Measures
30 From experience, our supervisors know how long a project or job should take to design. We use that as our measure.
31 No
Dist. Practices Page 14 -- DP25
Most companies are using multiple measures to track the productivity of their Designers. Two companies do not have any formal measures
61
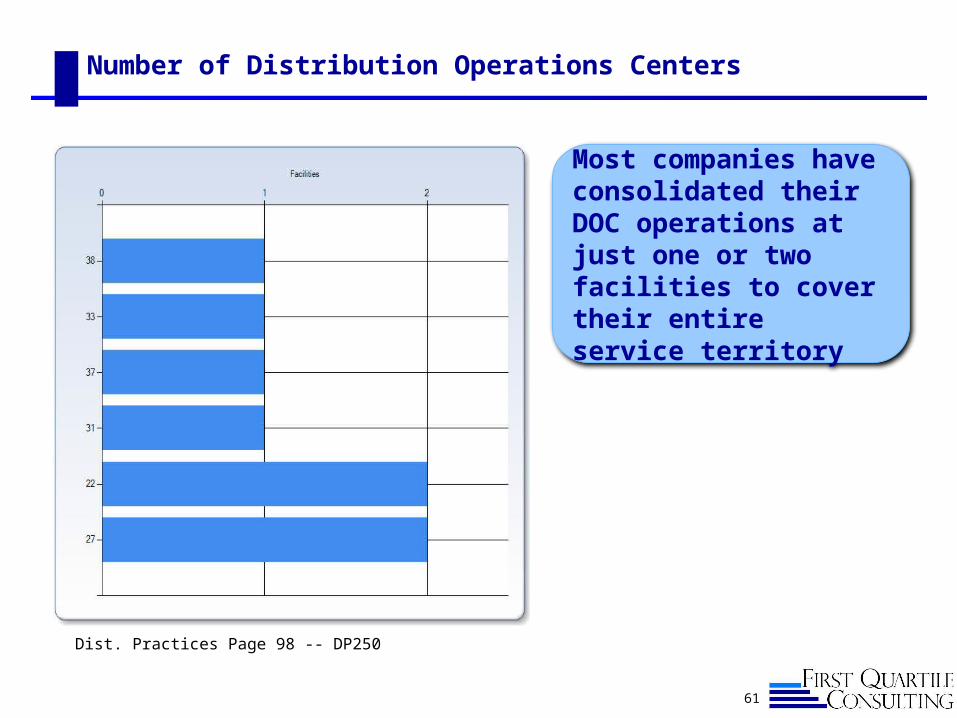
Number of Distribution Operations Centers
Most companies have consolidated their DOC operations at just one or two facilities to cover their entire service territory
Dist. Practices Page 98 -- DP250
62
Dispatcher/Operator Union Representation
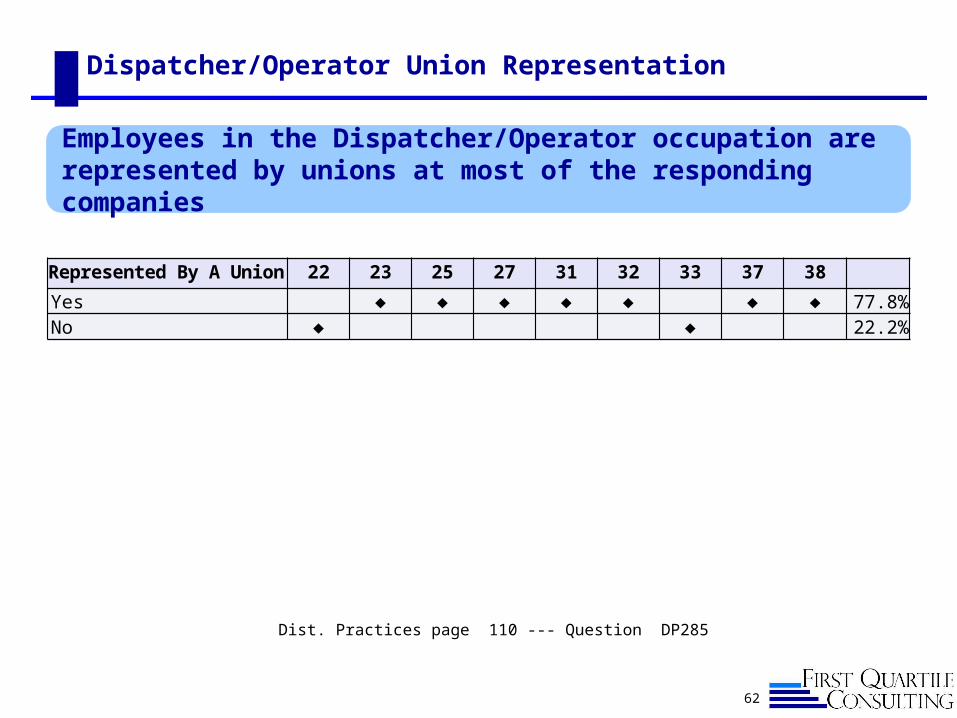
Represented By A Union
22 23 25 27 31 32 33 37 38
Yes ♦ ♦ ♦ ♦ ♦ ♦ ♦ 77.8%No ♦ ♦ 22.2%
Employees in the Dispatcher/Operator occupation are represented by unions at most of the responding companies
Dist. Practices page 110 --- Question DP285

63
Current Grid Hardening Initiatives
ID Response
24 Smart Grid initiative also known as the Energy Infastructure Modernization Act (EIMA) initiative. The (EIMA) initiative is focused on: Improving system reliability and deploying new smart grid technologies; Providing greater value to customers through better service and creating a new level of accountability for the company; Preparing our region for the new demands of the 21st century economy and supporting a greener future; Providing energy consumers more savings, choice and control
25 We have an overhead pole loading program to assess in-service pole safety factors. We also have an overhead conductor program assessing circuit capacities and engineering activities looking into system automations and distributed generation resiliency
27 12 kV and 34 kV wood pole ground line inspections and circuit walkdown and repairs for selected circuits after tree trimming is completed.
31 Wood poles are replaced with steel poles unless the location is identified as a 'restricted access' location.
32 adding reclosers on system - veg management program - pole replacement program
33 Cable replacement/Injection, Padmount Equipment, Fuse coordination, Pole Replacement, Reclosures
38 Smart grid- install intelligent grid switching devices
Dist. Practices Page 76 -- DP165
Companies apply the term “grid hardening” to a wide variety of line maintenance and system improvement activities