distribution and pools of mercury in czech forest soils
TRANSCRIPT
Distribution and Pools of Mercury in Czech Forest Soils
Tomáš Navrátil & Jamie Shanley & Jan Rohovec &
Maria Hojdová & Vít Penížek & Jana Buchtová
Received: 8 August 2013 /Accepted: 28 November 2013# Springer Science+Business Media Dordrecht 2014
Abstract Parts of the Czech Republic received extremeloading of acid deposition from coal combustion in thesecond half of the twentieth century. Although associat-ed Hg deposition was not directly measured, Hg depo-sition rates calculated from peat cores approach100 μg m−2 year−1. We quantified the soil concentra-tions and pools of Hg with carbon (C), sulfur (S), andnitrogen (N)—elements closely associated with soil or-ganic matter at five sites across the Czech Republic—four sites known for extreme deposition levels of S andN compounds in the twentieth century, and one siterelatively less impacted. The site-specific means of O-horizon Hg concentrations ranged from 277 to393 μg kg−1, while means of Hg concentrations inmineral soil ranged from 22 to 95 μg kg−1. The meanHg/C ratio across sites increased from ∼0.5 μg Hg g−1 Cin the Oi-horizon to ∼5 μg Hg g−1 C in the C-horizondue to the progressive mineralization of soil organicmatter. The soil Hg/C increase was accompanied by asoil C/N decrease, another indicator of soil organicmatter mineralization. Soil Hg/C also increased as soilC/S decreased, suggesting that Hg was stabilized by S
functional groups within the soil organic matter. Mineralsoil Hg pools (8.9–130.0 mg m−2) dominated over or-ganic soil Hg pools (5.3–10.1 mg m−2) at all sites.Mineral soil Hg pools correlated more strongly withtotal soil S and oxalate-extractable Fe than with totalsoil C. Total soil Hg pools could be accounted for by atime period of atmospheric inputs that was short relativeto the age of the soils. The cross site variability of Hgsoil pools was not sensitive to the local Hg depositionhistory but rather related to the capacity of soil to storeand stabilize organic matter.
Keywords Mercury. Carbon . Sulfur . Oxalate-extractableAl . Oxalate-extractable Fe .Hg/C ratio . Central Europe .
Black Triangle
1 Introduction
Mercury (Hg) occurs naturally in the environment butanthropogenic activities have increased the amount ofHg in the global environment (Pirrone et al. 2010).Atmospheric emissions are the primary source of Hgfor the global environment. Annual European anthropo-genic atmospheric Hg emissions declined from 850 t in1980 to 87 t in 2010 (Pacyna et al. 2009; EMEP 2012).Most of this major decline was due to the reduction inconsumption of coal for power generation, emissionimprovements (flue gas desulphurization) from coalpower plants, and various technological changes in oth-er industrial processes (e.g., chlor-alkali plants) (Pacynaet al. 2009). Atmospheric mercury is efficiently retainedby vegetation and soil in terrestrial ecosystems (e.g.,Hintelmann et al. 2002). Foliage takes up atmosphericHg throughout the growing season, thus litterfall
Water Air Soil Pollut (2014) 225:1829DOI 10.1007/s11270-013-1829-1
T. Navrátil (*) : J. Rohovec :M. Hojdová : J. BuchtováInstitute of Geology AS CR, v.v.i., Rozvojová 269,Prague 6 165 00, Czech Republice-mail: [email protected]
J. ShanleyUS Geological Survey, PO Box 628, Montpelier,VT 05601, USA
V. PenížekFaculty of Agrobiology, Food and Natural Resources,Czech University of Life Sciences, Kamýcká 129,Prague 6 165 21, Czech Republic
represents an important pathway of Hg to the forest floor(Rea et al. 2002; Sheehan et al. 2006; Demers et al.2007; Bushey et al. 2008). Forest litter, organic soils,and mineral soils represent a large storage pool foratmospheric Hg within the forest ecosystem. Soils retaindeposited Hg and delay its transport to surface waters(Bishop and Lee 1997) such that only a small fraction ofannual Hg deposition runs off in streamflow (Shanleyand Bishop 2012). A considerable fraction may also beevaded back to the atmosphere (Pirrone et al. 2010;Denkenberger et al. 2012). A strong relationship of Hgconcentration and organic carbon (C) in forest soils hasbeen widely observed (Grigal 2003). Generally, Hgconcentrations in litter and organic soil horizons aregreater than those in mineral soils due to an order ofmagnitude greater content of organic material. An in-creasing ratio of Hg/C with depth has been attributed togreater mineralization of soil organic material and partlyto the higher reactive surface area of the more humifiedsoil organic material in the mineral horizon(Amirbahman and Fernandez 2012).
In a cross-Europe study, Hg concentration in topsoil(humus) averaged 200 μg kg−1, while the subsoil Hgconcentration averaged 37 μg kg−1 (Salminen et al.2005). Hg concentrations in litter and forest humus wereelevated in the central European region, e.g., Poland andGermany, relative to European averages (Schwesig et al.1999; Schwesig and Matzner 2000; Schwesig andMatzner 2001; Szopka et al. 2011). Regional variationsin Hg concentrations in organic horizons can be attrib-uted to site-specific differences in historical loading(Grigal 2003). In the Czech Republic, according toresults from peat archives, the lowest Hg accumulationrates (average 24, maximum 40μgm−2 year−1) since thebeginning of the twentieth century were found in theBohemian Forest area in the south (Zuna et al. 2012),whereas the highest Hg accumulation rates (average104, maximum 250 μg m−2 year−1) were found in theBrdyMountains in the central region (Ettler et al. 2008).The national forest organic soil survey had previouslyidentified this central part of the Czech Republic as aregion with a high Hg deposition history (Suchara andSucharová 2002). This Hg hot spot originated fromindustrial activities concentrated in this area, primarilyhistorical mining and smelting activities in Příbram OreDistrict, historical activities of the steel processing in-dustry, and ongoing operations of the cement industryand chlor-alkali plants (Suchara and Sucharová 2000).The average Hg concentration in Czech forest humus for
the whole country including areas impacted by pointsources was 656 μg kg−1, ranging from 329 to2,260 μg kg−1 (Suchara and Sucharová 2000). Ettleret al. (2007) reported that concentrations of Hg in forestsoils in the polluted central part of the Czech Republicranged from 44 μg kg−1 in mineral soil to 6,485 μg kg−1
in organic horizons. Information on Hg concentrationsin organic and mineral soil and the quantification of Hgsoil pools in Czech forests unaffected by local emissionsources has been rather scarce. A single study from anarea with sandstone bedrock in northern Bohemia re-ported mean Hg concentrations of 333 μg kg−1 for theO-horizons and 22 μg kg−1 for the mineral soil (Navrátilet al. 2009). There have been few studies in Europeaddressing the distribution of Hg in organic and mineralsoil that would allow the calculation of Hg pools, as hasbeen done for North America (Obrist et al. 2009, 2011).
Terrestrial catchments serve as both sources andsinks of Hg (Shanley and Bishop 2012). Vegetation actsas a short-term sink for Hg due to stomatal uptake ofatmospheric Hg by foliage (Graydon et al. 2012). Forestsoils receive Hg via wet deposition and litterfall andrepresent a longer-term sink (Grigal 2003). A key deter-minant of Hg retention time in catchment soils is theamount and stability of the soil organic matter (Grigal2003; Yu et al. 2013). Recent works assessed the poten-tial for revolatilization of historically deposited Hg heldin soils (Harris et al. 2007; Pokharel and Obrist 2011;Denkenberger et al. 2012). Some of the Hg re-emittedfrom soils can be adsorbed by canopy via stomataluptake and will return to the forest floor in litterfall. Ithas been recognized that Hg re-emission from soils maybe an important source of atmospheric Hg even thoughprimary emissions have decreased due to better emis-sion controls (Gustin et al. 2000). Although soils retainmost of the Hg deposition, Hg release from soils is theprimary source of Hg to streams (Harris et al. 2007,Navrátil et al. 2011, Shanley and Bishop 2012).Therefore, it is important to understand the spatial dis-tribution of Hg in forest ecosystems and factors affect-ing its distribution therein.
The Czech Republic in central Europe experiencedextensive industrialization in the twentieth century, lead-ing to extremely high atmospheric emissions and depo-sition of acidifying sulfur (S) and nitrogen (N) com-pounds. The main emission source was coal combustionwhich peaked in the 1970s and 1980s (Kopáček andVeselý 2005). Increased levels of Hg deposition for theperiod from the 1960s to 1980s were found in peat bogs
1829, Page 2 of 17 Water Air Soil Pollut (2014) 225:1829
at a mountainous site in the northwestern CzechRepublic (Zuna et al. 2012). The most impacted areafrom coal burning power plants is known as the BlackTriangle (Sucharová and Suchara 2004). It extendsacross the northwestern part of the Czech Republic intoparts of Germany and Poland (Fig. 1). Estimated Czechanthropogenic atmospheric Hg emissions have de-creased since 1990 from 7.5 to 3.5 t in 2010 (EMEP2012). Recent Hg fluxes to the forest ecosystems werequantified at the Lesní potok catchment (LES) in thecentral part of the Czech Republic. The 5-year average(2008–2012) of bulk deposition, spruce throughfall andlitterfall fluxes was 5.4, 6.4 and 18.5 μg m−2 year−1
(Navrátil et al. unpublished).We performed a systematic investigation of Hg con-
centrations and pools in forest soils of five coniferousforests within the Czech Republic, to observe soil Hgdistributions and the fate of legacy Hg within theseecosystems. The study sites in this paper were selectedbased on previous research history, relative non-disturbance, and an expected range in Hg concentra-tions. We characterized Hg concentrations in organichorizons and mineral soil horizons at different depths.Using field observations and analytical data we
quantified and compared the size of soil Hg pools withinthe five selected sites. Furthermore, we explored linksbetween soil Hg concentrations and potential explana-tory variables including soil organic carbon (TC), soilnitrogen (TN), soil sulfur (TS) and soil oxalate-extractable Al and Fe concentrations.
2 Methods
2.1 Site Descriptions
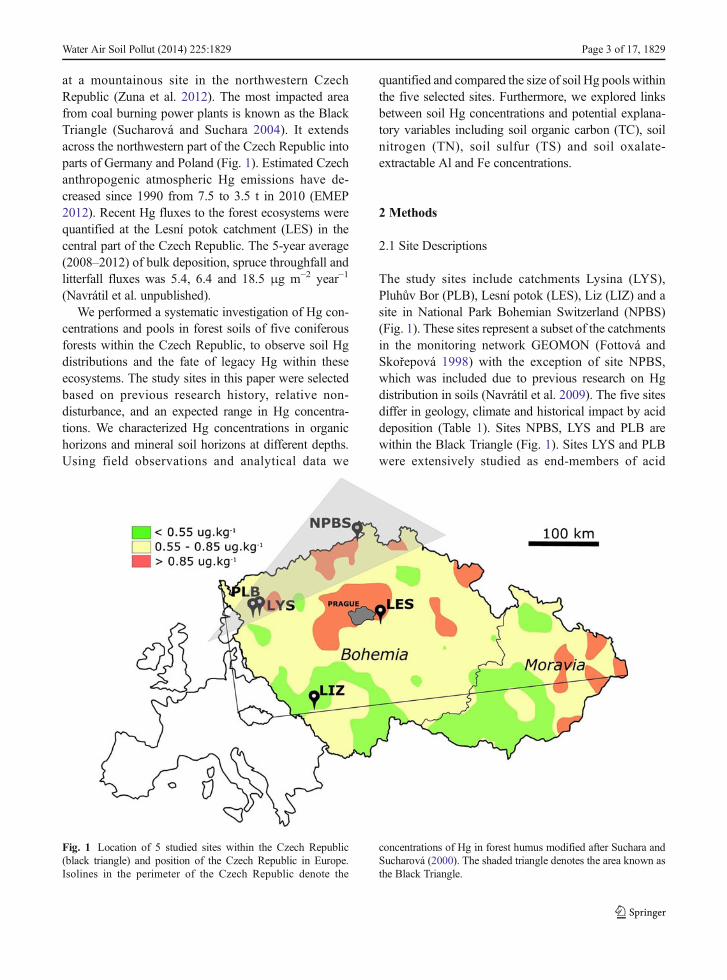
The study sites include catchments Lysina (LYS),Pluhův Bor (PLB), Lesní potok (LES), Liz (LIZ) and asite in National Park Bohemian Switzerland (NPBS)(Fig. 1). These sites represent a subset of the catchmentsin the monitoring network GEOMON (Fottová andSkořepová 1998) with the exception of site NPBS,which was included due to previous research on Hgdistribution in soils (Navrátil et al. 2009). The five sitesdiffer in geology, climate and historical impact by aciddeposition (Table 1). Sites NPBS, LYS and PLB arewithin the Black Triangle (Fig. 1). Sites LYS and PLBwere extensively studied as end-members of acid
Fig. 1 Location of 5 studied sites within the Czech Republic(black triangle) and position of the Czech Republic in Europe.Isolines in the perimeter of the Czech Republic denote the
concentrations of Hg in forest humus modified after Suchara andSucharová (2000). The shaded triangle denotes the area known asthe Black Triangle.
Water Air Soil Pollut (2014) 225:1829 Page 3 of 17, 1829
precipitation buffering (e.g., Krám et al. 1997, 2009a,2012; Hruška and Krám 2003) with LYS extremelyvulnerable to acidification (Navrátil et al. 2007) andPLB extremely resistant (Krám et al. 2009b). Site LESis close to the contamination hot spot south of the capitalPrague in central Bohemia (Fig. 1). LES catchmenttypically has relatively low precipitation and highevapotranspiration (Navrátil et al. 2003). Finally, siteLIZ is in southern Bohemia within the mountainousarea of the Bohemian Forest, which has been the arealeast impacted by anthropogenic deposition (Fottováand Skořepová 1998). Sites LES and LIZ are vegetatedby mixed forests (spruce/beech) but we selected conif-erous stands for soil sampling at all sites. The dominantconiferous species were Norway spruce (Picea abies) at
LES, LYS and LIZ and Scots pine (Pinus sylvestris) atPLB and NPBS.
2.2 Sample Collection
Individual plots were sited at well-drained level areasseveral tens of meters away from stream channels. Ateach site, we selected three plots that were broadlyrepresentative of the catchment area. Soils were sampledat each plot from approximately 0.5 to 1 m deep pits byindividual morphological horizons (Oi, Oe, Oa, E/A, B,C). The total depth of the soil pits was dependent on thedepth of unconsolidated material. The soil bulk densitywas determined using a 15×15 cm frame for O-horizonsand 100 cm3 steel rings for mineral horizons. All soils
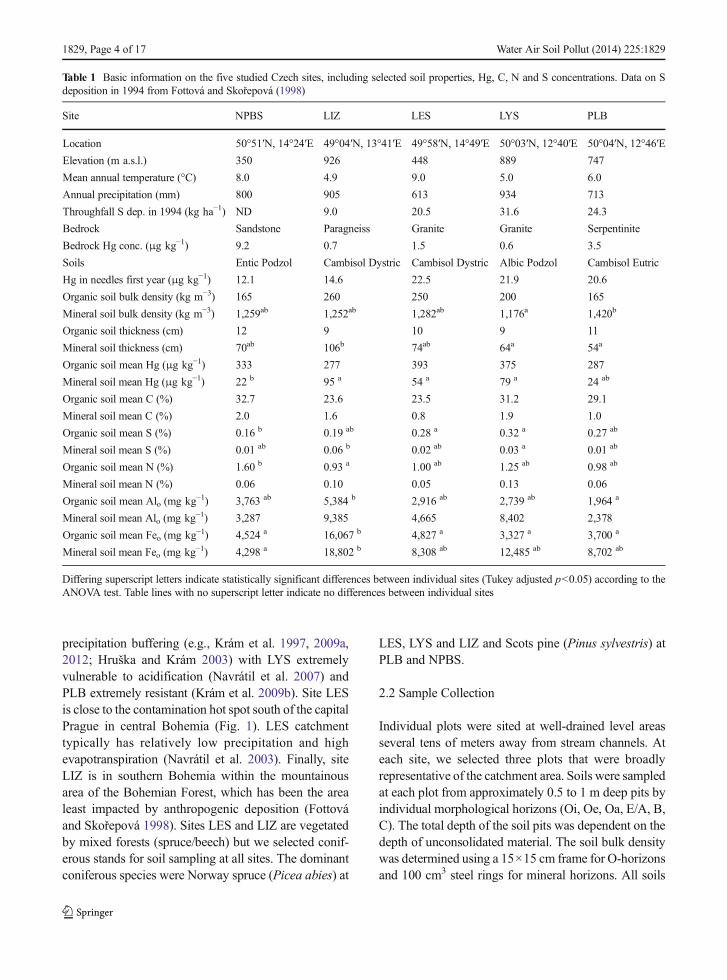
Table 1 Basic information on the five studied Czech sites, including selected soil properties, Hg, C, N and S concentrations. Data on Sdeposition in 1994 from Fottová and Skořepová (1998)
Site NPBS LIZ LES LYS PLB
Location 50°51′N, 14°24′E 49°04′N, 13°41′E 49°58′N, 14°49′E 50°03′N, 12°40′E 50°04′N, 12°46′E
Elevation (m a.s.l.) 350 926 448 889 747
Mean annual temperature (°C) 8.0 4.9 9.0 5.0 6.0
Annual precipitation (mm) 800 905 613 934 713
Throughfall S dep. in 1994 (kg ha−1) ND 9.0 20.5 31.6 24.3
Bedrock Sandstone Paragneiss Granite Granite Serpentinite
Bedrock Hg conc. (μg kg−1) 9.2 0.7 1.5 0.6 3.5
Soils Entic Podzol Cambisol Dystric Cambisol Dystric Albic Podzol Cambisol Eutric
Hg in needles first year (μg kg−1) 12.1 14.6 22.5 21.9 20.6
Organic soil bulk density (kg m−3) 165 260 250 200 165
Mineral soil bulk density (kg m−3) 1,259ab 1,252ab 1,282ab 1,176a 1,420b
Organic soil thickness (cm) 12 9 10 9 11
Mineral soil thickness (cm) 70ab 106b 74ab 64a 54a
Organic soil mean Hg (μg kg−1) 333 277 393 375 287
Mineral soil mean Hg (μg kg−1) 22 b 95 a 54 a 79 a 24 ab
Organic soil mean C (%) 32.7 23.6 23.5 31.2 29.1
Mineral soil mean C (%) 2.0 1.6 0.8 1.9 1.0
Organic soil mean S (%) 0.16 b 0.19 ab 0.28 a 0.32 a 0.27 ab
Mineral soil mean S (%) 0.01 ab 0.06 b 0.02 ab 0.03 a 0.01 ab
Organic soil mean N (%) 1.60 b 0.93 a 1.00 ab 1.25 ab 0.98 ab
Mineral soil mean N (%) 0.06 0.10 0.05 0.13 0.06
Organic soil mean Alo (mg kg−1) 3,763 ab 5,384 b 2,916 ab 2,739 ab 1,964 a
Mineral soil mean Alo (mg kg−1) 3,287 9,385 4,665 8,402 2,378
Organic soil mean Feo (mg kg−1) 4,524 a 16,067 b 4,827 a 3,327 a 3,700 a
Mineral soil mean Feo (mg kg−1) 4,298 a 18,802 b 8,308 ab 12,485 ab 8,702 ab
Differing superscript letters indicate statistically significant differences between individual sites (Tukey adjusted p<0.05) according to theANOVA test. Table lines with no superscript letter indicate no differences between individual sites
1829, Page 4 of 17 Water Air Soil Pollut (2014) 225:1829
were freeze-dried, passed through a 2-mm polyethylenesieve and homogenized. Bedrock samples were takenfrom the bottom of soil profiles or from nearby outcrops.Current-year coniferous needles were collected from atleast three trees close to the dug pits and pooled togetherinto a bulk sample.
2.3 Analytical Methods
Total Hg was analyzed by cold-vapor atomic absorptionspectrometry (CV-AAS, Leco-Altec AMA 254). Thedeterminations were performed in triplicate, with rela-tive standard deviation consistently<5 %). Quality ofHg measurements was assessed by the analysis of stan-dard reference material No. 7001 Light Sandy Soil,produced by Analytika Co. with measurements yielding86±2 μg kg−1 (five sets of three measurements) com-pared to the certified value of 87±6 μg kg−1.
Soil pH was measured in a 1:2 (v/v) ratio of soil anddeionized water suspension (Pansu and Gautheyrou2006). Total carbon (TC) and total sulfur (TS) weredetermined using an Eltra Metalyt CS1000S elementalanalyzer. Total nitrogen (TN) was determined using aCarlo-Erba Fisons 1108 analyzer. Cation exchange ca-pacity (CEC) was determined as the sum of base cationsand Al extracted with 0.1 M BaCl2 solution plus ex-tractable acidity. Base cations and Al were determinedby ICP-OES (Thermo Elemental Intrepid II). Soil acid-ity was determined by back titration of a solution of 50-ml deionized water equilibrated with 10 g of soil using0.05MNaOH. Oxalate-extractable Fe, Al, andMnweredetermined in a 0.2-M ammonium oxalate/oxalic acidsolution at pH 3 (Pansu and Gautheyrou 2006). Feo, Alo,and Mno in extracts were determined by ICP-OES(Thermo Elemental Intrepid II).
2.4 Statistical Analysis
Each of the 82 samples was considered to be a vectorwith 10 variables (sample pH, CEC, total acidity, TC,TS, TN, oxalate-extractable Fe, Mn, Al and total Hgconcentration). As a result, two data matrices with di-mensions of 37×10 (organic soil samples) and 45×10(mineral soil samples) were used for calculation ofPearson correlation coefficients. Values less than detec-tion limit (LOD) were replaced by 50 % of the LODvalue for statistical tests and calculation of pools.
We used one-way ANOVA with post-hoc TukeyHSD test to compare characteristics of organic and
mineral soil horizons at each site. The data were testedfor skewness, kurtosis, and overall normality to deter-mine whether they were normally distributed. Log trans-formations were used when residuals were not normallydistributed. Significance for all statistical analysis wasaccepted at p<0.05.
3 Results and Discussion
3.1 Distribution of Hg in Forest Soils
Pooled data from the five studied forest sites dissemi-nated across the Czech Republic show increasing Hgconcentration with depth in order of individual organichorizons Oi, Oe, and Oa (Fig. 2), similar to other studies(Obrist et al. 2011). The topmost Oi-horizons with rel-atively fresh organic material contained on average178 μg kg−1 Hg. The Oe horizons containing partlydecomposed organic material and Oa horizons contain-ing predominantly decomposed humus averaged 379and 477 μg kg−1 Hg, respectively. Thus, Oa horizonshad 2.5 times higher Hg concentrations than Oi-horizons. Mineral soil Hg concentrations were lowerthan those in the O-horizon and decreased with depth(Fig. 2). Mean Hg concentrations decreased from142 μg kg−1 in E and A horizons, to 93 μg kg−1 in Bhorizons to 32 μg kg−1 in C horizons. The Hg concen-tration in bedrock was low (0.7–9.2 μg kg−1) at all sites(Table 1). The decreasing Hg concentrations with depthin the mineral soil and the much higher Hg concentra-tion in soils relative to bedrock suggest that the source ofHg for the five Czech catchments was atmosphericinputs rather than geological sources such as releasefrom bedrock by weathering.
Concentrations of Hg in organic horizons were great-er than those reported for forest sites in USA andCanada. Obrist et al. (2009) reported 22–39, 46–90,and 126–134 μg kg−1 of Hg in Oi, Oe, and Oa horizons,respectively, in the Sierra Nevada, while the mineralhorizons had only 8–35 μg kg−1 Hg. The SierraNevada is in the western USA which has relativelylow levels of Hg deposition relative to other parts ofUSA (Zhang et al. 2012). Juillerat et al. (2012) found 72,229, 283, and 131 μg kg−1 Hg for Oi, Oa, Oe, and Ahorizons in forest soils in Vermont. Amirbahman et al.(2004) reported ∼120, ∼60, and ∼70 μg kg−1 Hg in O,Bh, and Bs horizons at two forest sites in Maine. Nasrand Arp (2011) reported mean Hg concentrations of
Water Air Soil Pollut (2014) 225:1829 Page 5 of 17, 1829
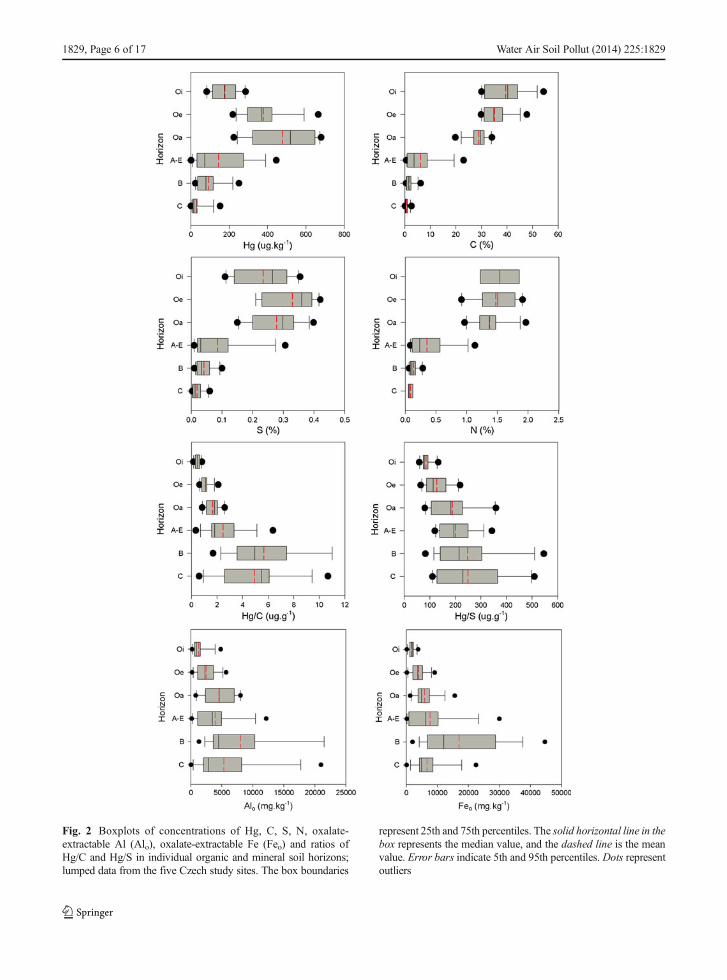
Fig. 2 Boxplots of concentrations of Hg, C, S, N, oxalate-extractable Al (Alo), oxalate-extractable Fe (Feo) and ratios ofHg/C and Hg/S in individual organic and mineral soil horizons;lumped data from the five Czech study sites. The box boundaries
represent 25th and 75th percentiles. The solid horizontal line in thebox represents the median value, and the dashed line is the meanvalue. Error bars indicate 5th and 95th percentiles. Dots representoutliers
1829, Page 6 of 17 Water Air Soil Pollut (2014) 225:1829
141, 260, and 299 μg kg−1 in Oi, Oe, and Oa horizons offorest soil in New Brunswick, Canada. NewBrunswick has elevated atmospheric Hg depositionfrom long-range transport (Pilgrim et al. 2000;Ritchie et al. 2006). The comparable mean Hg con-centration in the Oi horizon of New Brunswick andCzech sites suggests similar levels of present-dayatmospheric deposition of Hg in the forest floor.Higher Hg concentrations in Oe and Oa horizonsin the Czech soils suggest greater historical Hgdeposition relative to eastern Canada.
Average soil Hg concentrations at the 5 Czech forestsites were comparable to those reported from forestedsites in Germany, suggesting similar Hg depositionmagnitudes across the broader central European region.For example, Schwesig et al. (1999) found ∼100, ∼300,and 400–500 μg kg−1 of Hg in Oi, Oe and Oa horizonsof a spruce forest in Bavaria. Hg concentrations inmineral soils of Bavarian forests ranged from ∼20 to250 μg kg−1.
3.2 Relation of Hg to Soil Components
It is well known that concentrations of Hg in unpollutedforest soils are intimately linked to the content of soilorganic matter (SOM), which can be represented inacidic soils by total carbon (TC). Hg correlates withparameters such as TC, TN, pH, CEC and clay contentat many sites (Ettler et al. 2007, Obrist et al. 2009,Navrátil et al. 2009, Szopka et al. 2011, Nasr and Arp2011). Splitting the complete dataset into two groups for(1) organic and (2) mineral soil horizons based on theorder of magnitude difference between the organic
matter content brings another view of the relationshipsbetween Hg concentration and soil properties.
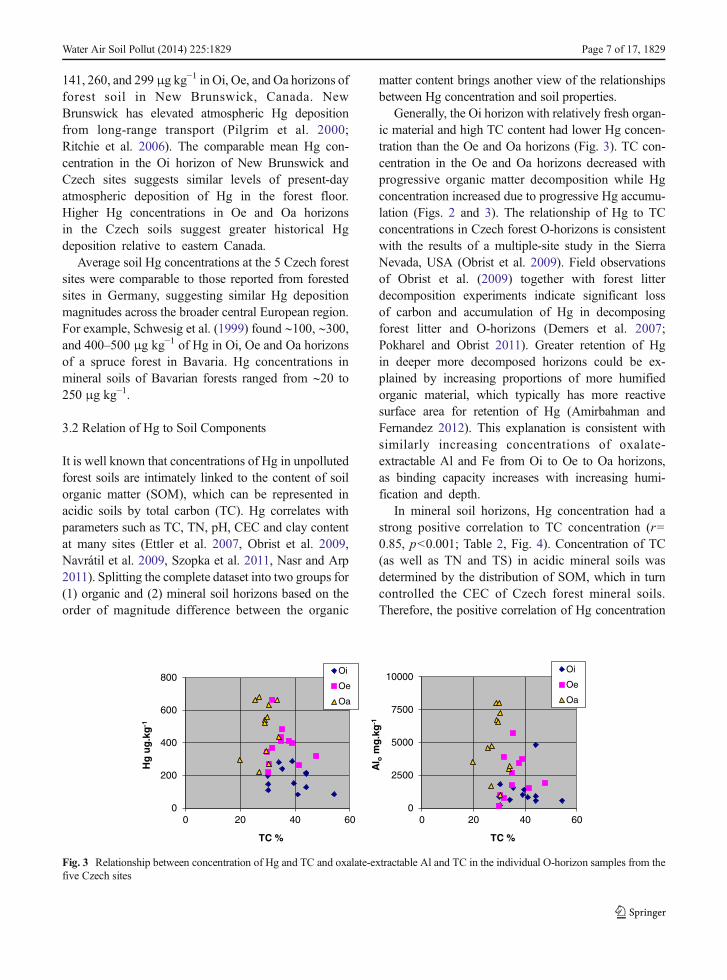
Generally, the Oi horizon with relatively fresh organ-ic material and high TC content had lower Hg concen-tration than the Oe and Oa horizons (Fig. 3). TC con-centration in the Oe and Oa horizons decreased withprogressive organic matter decomposition while Hgconcentration increased due to progressive Hg accumu-lation (Figs. 2 and 3). The relationship of Hg to TCconcentrations in Czech forest O-horizons is consistentwith the results of a multiple-site study in the SierraNevada, USA (Obrist et al. 2009). Field observationsof Obrist et al. (2009) together with forest litterdecomposition experiments indicate significant lossof carbon and accumulation of Hg in decomposingforest litter and O-horizons (Demers et al. 2007;Pokharel and Obrist 2011). Greater retention of Hgin deeper more decomposed horizons could be ex-plained by increasing proportions of more humifiedorganic material, which typically has more reactivesurface area for retention of Hg (Amirbahman andFernandez 2012). This explanation is consistent withsimilarly increasing concentrations of oxalate-extractable Al and Fe from Oi to Oe to Oa horizons,as binding capacity increases with increasing humi-fication and depth.
In mineral soil horizons, Hg concentration had astrong positive correlation to TC concentration (r=0.85, p<0.001; Table 2, Fig. 4). Concentration of TC(as well as TN and TS) in acidic mineral soils wasdetermined by the distribution of SOM, which in turncontrolled the CEC of Czech forest mineral soils.Therefore, the positive correlation of Hg concentration
0
200
400
600
800
0 20 40 60
Hg
ug
.kg
-1
TC %
Oi
Oe
Oa
0
2500
5000
7500
10000
0 20 40 60
Al o
mg
.kg
-1
TC %
Oi
Oe
Oa
Fig. 3 Relationship between concentration of Hg and TC and oxalate-extractable Al and TC in the individual O-horizon samples from thefive Czech sites
Water Air Soil Pollut (2014) 225:1829 Page 7 of 17, 1829
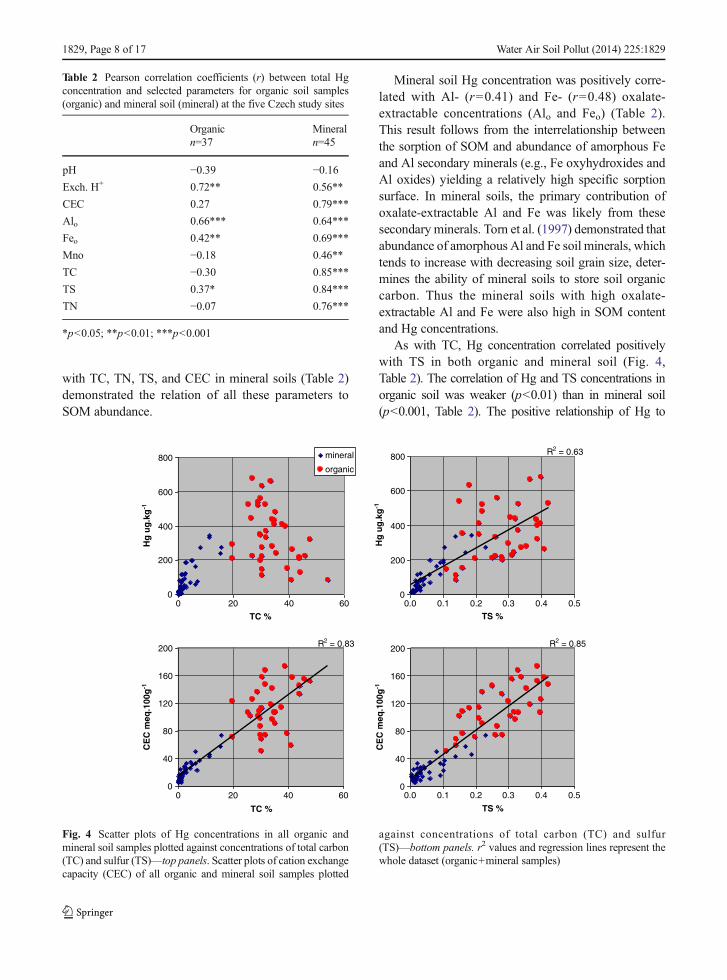
with TC, TN, TS, and CEC in mineral soils (Table 2)demonstrated the relation of all these parameters toSOM abundance.
Mineral soil Hg concentration was positively corre-lated with Al- (r=0.41) and Fe- (r=0.48) oxalate-extractable concentrations (Alo and Feo) (Table 2).This result follows from the interrelationship betweenthe sorption of SOM and abundance of amorphous Feand Al secondary minerals (e.g., Fe oxyhydroxides andAl oxides) yielding a relatively high specific sorptionsurface. In mineral soils, the primary contribution ofoxalate-extractable Al and Fe was likely from thesesecondary minerals. Torn et al. (1997) demonstrated thatabundance of amorphous Al and Fe soil minerals, whichtends to increase with decreasing soil grain size, deter-mines the ability of mineral soils to store soil organiccarbon. Thus the mineral soils with high oxalate-extractable Al and Fe were also high in SOM contentand Hg concentrations.
As with TC, Hg concentration correlated positivelywith TS in both organic and mineral soil (Fig. 4,Table 2). The correlation of Hg and TS concentrations inorganic soil was weaker (p<0.01) than in mineral soil(p<0.001, Table 2). The positive relationship of Hg to
Table 2 Pearson correlation coefficients (r) between total Hgconcentration and selected parameters for organic soil samples(organic) and mineral soil (mineral) at the five Czech study sites
Organic Mineraln=37 n=45
pH −0.39 −0.16Exch. H+ 0.72** 0.56**
CEC 0.27 0.79***
Alo 0.66*** 0.64***
Feo 0.42** 0.69***
Mno −0.18 0.46**
TC −0.30 0.85***
TS 0.37* 0.84***
TN −0.07 0.76***
*p<0.05; **p<0.01; ***p<0.001
0
200
400
600
800
0 20 40 60
TC %
Hg
ug
.kg
-1
mineral
organic
R2 = 0.83
0
40
80
120
160
200
0 20 40 60
TC %
CE
C m
eq.1
00g
-1
R2 = 0.85
0
40
80
120
160
200
0.0 0.1 0.2 0.3 0.4 0.5
TS %
CE
C m
eq.1
00g
-1
R2 = 0.63
0
200
400
600
800
0.0 0.1 0.2 0.3 0.4 0.5
TS %
Hg
ug
.kg
-1
Fig. 4 Scatter plots of Hg concentrations in all organic andmineral soil samples plotted against concentrations of total carbon(TC) and sulfur (TS)—top panels. Scatter plots of cation exchangecapacity (CEC) of all organic and mineral soil samples plotted
against concentrations of total carbon (TC) and sulfur(TS)—bottom panels. r2 values and regression lines represent thewhole dataset (organic+mineral samples)
1829, Page 8 of 17 Water Air Soil Pollut (2014) 225:1829
TS in O-horizons could be a result of historic atmosphericdeposition because it is likely that sites subjected to higherdeposition of S from coal burning were subjected to higherdeposition of associated Hg in the coal. Sulfur in soils oftemperate forests is primarily associatedwith SOMas esterand carbon bonded organic S species (Novák et al. 2003,Skyllberg et al. 2003). Sulfur in forest soils of the CzechRepublic impacted by the relatively extreme historical Sdeposition in 1970s and 1980s was present primarily asorganic C bonded S (Novák et al. 2003). This finding issupported in the present study by the positive correlation ofTC and TS concentration in mineral soil (r=0.71,p<0.001). In New Brunswick, Canada, Nasr and Arp(2011) also observed a significant positive relationship ofHg concentrations with TS in soil, which they attributed toHg retention byHg-SH-organic matter bonding (Skyllberget al. 2003; Skyllberg et al. 2006).
Apart from the simple comparison of Hg concentra-tions, insight into the patterns of soil Hg distribution canbe gained by examining the stoichiometric ratios of Hgto C, N, and S. Hg/C, Hg/N, and Hg/S ratios all in-creased from organic to mineral soil (Fig. 2). While C isreleased rapidly during the decomposition of SOM, N isreleased less rapidly and S even less so. Thus, theincreases in mean ratios of Hg to C, N and S from theOi to C horizons were 10-, 8-, and 3-fold, respectively(Fig. 2). Unfortunately, no field or laboratory experi-ments studying Hg processes during litter decomposi-tion have considered changes in S concentrations (Halland St. Louis 2004, Pokharel and Obrist 2011).
The mean Hg/C values for individual soil horizons atour 5 sites in the Czech Republic were 0.47, 1.1, 1.7,2.4, 4.6, and 5.5 μg Hg g−1 C in Oi, Oe, Oa, E, B, and Chorizons, respectively (Fig. 2). By comparison, NewBrunswick forest soils had lower O-horizon Hg/C ratioswhich increased in order 0.28, 0.58 to 0.83 μg Hg g−1 Cfor Oi, Oe, and Oa horizons, while mineral soil Hg/Cratios increased from 3.64 in B horizons to 10 in Chorizons (Nasr and Arp 2011). In Vermont, Juilleratet al. (2012) reported Hg/C ratios of 0.15, 0.69, 1.35,and 1.45 μg Hg g−1 C in Oi, Oe, Oa, and E horizons,respectively. Obrist et al. (2011) found significant dif-ferences in the Hg/C ratio in organic and mineral soil at14 forest sites across the USA. The mean reported Hg/Cratios were 0.73 μg Hg g−1 C in Oa horizons and 3.1 μgHg g−1 C in mineral soils. Amirbahman et al. (2004)found 0.4, 1.4 and 2.3 μg Hg g−1 C in O, Bh and Bshorizons at two forest sites in Maine. In Europe, twoSwedish sites had 0.63 and 0.96 μg Hg g−1 C in Oe
horizons and 0.48 and 0.67 μg Hg g−1 in Oa horizons(Akerblom et al. 2008). The increasing Hg/C ratio withdepth in forest soils has been explained by release ofCO2 during the decomposition of SOM, followed bysequestration of the associated Hg from soil solution byresidual SOM (Grigal 2003; Akerblom et al. 2008).These processes were also observed for litter in fieldexperiments (Hall and St. Louis 2004). We suggest thatsoil Hg/C should be greater in areas with greater atmo-spheric Hg deposition. For example, from data ofKlaminder et al. (2008) can be calculated soil Hg/Calong a 100-km-long transect starting at a Hg emissionpoint source. The mean Hg/C ratios of forest O-horizonson the transect decreased gradually from 2.03μg Hg g−1
C at a distance of 12 km to 0.38 μg Hg g−1 C at 100 km.Hg/C ratios of the uppermost Oi horizons of Czech siteswere comparable to the other forest sites in Sweden,New Brunswick, Maine, and Sierra Nevada(Amirbahman et al. 2004; Akerblom et al. 2008;Obrist et al. 2011; Nasr and Arp 2011). But mean Hg/C ratios in Oe and Oa horizons at all five of our Czechsites were greater (Hg/C≥1 μg g−1) than those fromother sites in Europe and North America. This patternsuggests higher historical deposition of Hg during theheavy industrialization of the Czech Republic in thetwentieth century. Carbon turnover on the forest flooris generally thought to be on the order of a few years inhumid temperate climates (Schimel et al. 1994), but fewstudies have attempted to measure O-horizon age. Kasteet al. (2011) dated Oa horizons at seven sites in USA andNorway with ages ranging from ∼30 to ∼100 years. IfCzech Oa ages fall within this range, we should expect Hgin the Oa horizon to reflect Hg deposition through theheavily industrialized period of the late twentieth century.
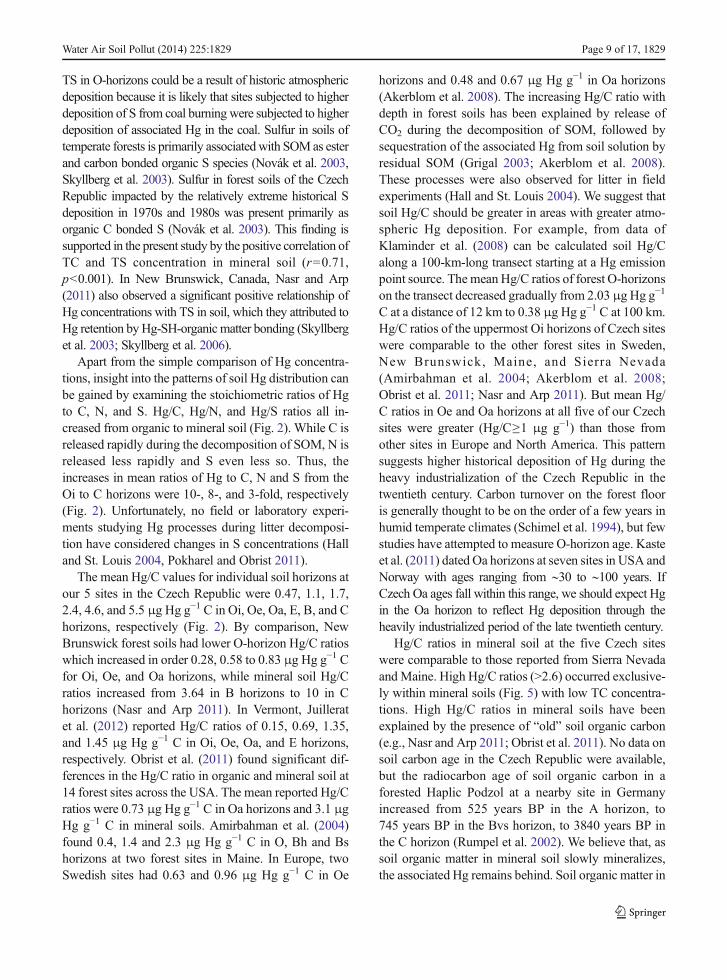
Hg/C ratios in mineral soil at the five Czech siteswere comparable to those reported from Sierra NevadaandMaine. High Hg/C ratios (>2.6) occurred exclusive-ly within mineral soils (Fig. 5) with low TC concentra-tions. High Hg/C ratios in mineral soils have beenexplained by the presence of “old” soil organic carbon(e.g., Nasr and Arp 2011; Obrist et al. 2011). No data onsoil carbon age in the Czech Republic were available,but the radiocarbon age of soil organic carbon in aforested Haplic Podzol at a nearby site in Germanyincreased from 525 years BP in the A horizon, to745 years BP in the Bvs horizon, to 3840 years BP inthe C horizon (Rumpel et al. 2002). We believe that, assoil organic matter in mineral soil slowly mineralizes,the associated Hg remains behind. Soil organic matter in
Water Air Soil Pollut (2014) 225:1829 Page 9 of 17, 1829
mineral soil becomes immobilized and relatively stablein acid soils due either to (1) adsorption to inorganic soilcomponents (e.g., Al and Fe secondary minerals) or (2)direct co-precipitation with Al and Fe compounds(Kalbitz and Kaiser 2008). Recent studies have shownthat soil C pools have not increased during the past30 years in Central European forest soils (Porębskaand Ostrowska 2013). Furthermore, little DOC derivedfrom recent litter, and thus containing recent Hg, reachesthe mineral soil horizons (e.g., Fröberg et al. 2007;Hagedorn et al. 2012).
Soil N is usually associated with organic matter.Concentrations of TN in this study positively correlatedwith those of TC in organic soil (r=0.89, p<0.05) andmineral soil (r=0.77, p<0.001). Thus the Hg/N ratioexhibited similar trends to the Hg/C ratio. Mean Hg/Nratio values for individual horizons at five sites in theCzech Republic increased with depth: 12, 28, 35, 43, 82,and 98 μg Hg g−1 N for the Oi, Oe, Oa, E, B, and Chorizons, respectively (not shown). Contrary to the
results of Obrist et al. (2009), we did not find a positivecorrelation of Hg concentrations with TN in organic soil(Table 2) and thus results for the Czech sites do notsupport the likelihood of nitrogen functional groups asthe key ligands for Hg retention in O-horizons.
However, sulfur functional groups are wellestablished preferential bonding sites for Hg(Skyllberg et al. 2003). Mean Hg/S ratios in individualhorizons at the 5 study sites increased with depth: 83,127, 188, 200, 248, to 250 μg Hg g−1 S in the Oi, Oe,Oa, E, B and C horizons, respectively (Fig. 2). Fewstudies have considered the Hg/S ratio in soils butGrigal (2003) reported a slope of 120 μg Hg g−1 S inpooled soils of the north-central USA. Recently, Demerset al. (2013) found similar Hg/S stoichiometry in uplandorganic and mineral soils (∼210 μg Hg g−1 S) and lowerHg/S (∼63 μg Hg g−1 S) in peat of riparian and head-water wetlands in forests of the Adirondacks region.While both Hg and TS were lower in New Brunswicksoil relative to the five studied Czech sites, Hg/S calcu-lated from Nasr and Arp (2011) was slightly greater(108, 163, 187 and 220 μg Hg g−1 S in Oi, Oe, Oa,and A horizons, respectively). The difference in soil Hg/S between the Czech and New Brunswick sites maysimply reflect a difference in the stoichiometry of atmo-spheric deposition at the two sites.
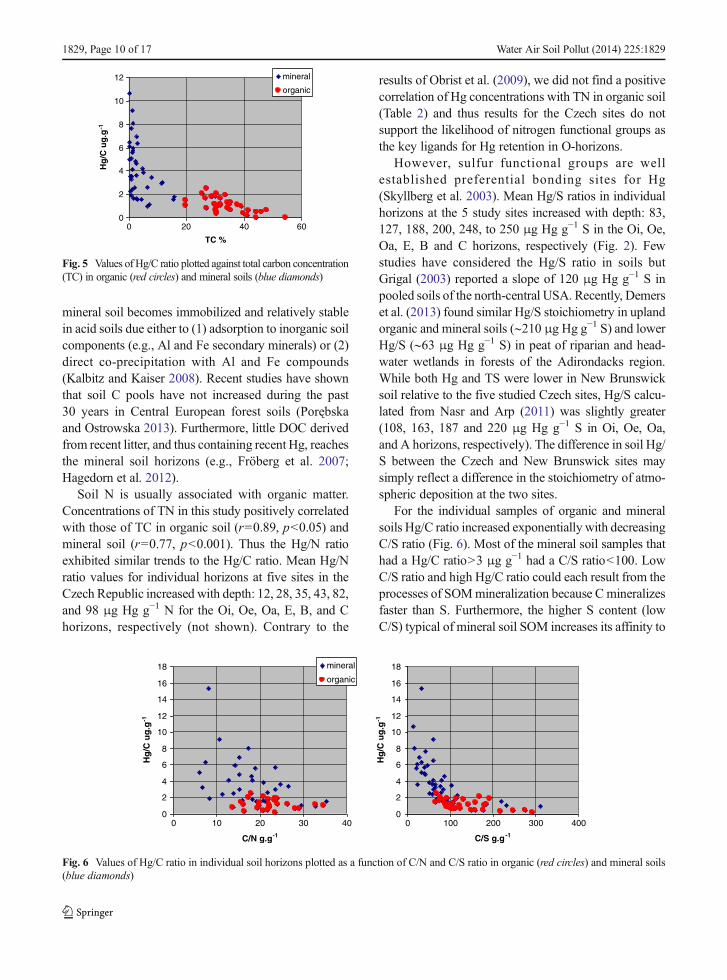
For the individual samples of organic and mineralsoils Hg/C ratio increased exponentially with decreasingC/S ratio (Fig. 6). Most of the mineral soil samples thathad a Hg/C ratio>3 μg g−1 had a C/S ratio<100. LowC/S ratio and high Hg/C ratio could each result from theprocesses of SOMmineralization because C mineralizesfaster than S. Furthermore, the higher S content (lowC/S) typical of mineral soil SOM increases its affinity to
0
2
4
6
8
10
12
0 20 40 60
TC %
Hg
/C u
g.g
-1
mineral
organic
Fig. 5 Values of Hg/C ratio plotted against total carbon concentration(TC) in organic (red circles) and mineral soils (blue diamonds)
0
2
4
6
8
10
12
14
16
18
0 100 200 300 400
C/S g.g-1
Hg
/C u
g.g
-1
0
2
4
6
8
10
12
14
16
18
0 10 20 30 40
C/N g.g-1
Hg
/C u
g.g
-1
mineral
organic
Fig. 6 Values of Hg/C ratio in individual soil horizons plotted as a function of C/N and C/S ratio in organic (red circles) and mineral soils(blue diamonds)
1829, Page 10 of 17 Water Air Soil Pollut (2014) 225:1829

bind Hg. Thus, as mineral soil SOM ages, it developsgreater binding potential for residual or any newlyadvecting Hg that is able to bypass the excess bindingcapacity higher in the profile. Mean C/S ratios for theorganic and mineral soils were 200 or less at all sites(Table 3). The mean C/S ratios in organic soils at all siteswere higher than those in mineral soil (Table 3), thusmineral SOM is enriched in S binding sites available toHg. No soils sampled in this study exhibited a C/S ratio>400 (Fig. 6), which would be indicative of net sulfurimmobilization (Demers et al. 2013). High C/S valuesup to 4,000 were reported from peat riparian wetlands
(Demers et al. 2013) but our soils were all in well-drained uplands away from riparian areas.
Because of the strong affinity of Hg for organic Sfunctional groups (Skyllberg et al. 2003), it is instructiveto take a closer look at soil TS and its relation to SOM.The concentration of TS in O-horizons of the Czechsites was positively related to CEC (r=0.72, p<0.001).TC had a less significant correlation (r=0.45, p<0.01)and TN had no significant correlation. An explanationfor this pattern could be that S associated with thefraction of organic material most important for CEC.Despite the findings of Novák et al. (2005) showing that
Table 3 Calculated organic and mineral soil pools of Hg, C, N, S and oxalate-extractable Fe and Al. Elemental ratios for individualcatchments were calculated from the pool data
Site NPBS LIZ LES LYS PLB
Organic soil Hg (mg m−2) 7.1 6.8 10.1 7.4 5.3
Mineral soil Hg (mg m−2) 8.9 c 130.0 b 37.0 ab 63.1 ab 16.6 ac
Organic soil C (g m−2) 6,538 4,486 5,633 5,884 5,606
Mineral soil C (g m−2) 8,272 ab 20,668 b 4,159 a 14,832 ab 6,020 a
Organic soil S (g m−2) 33 40 70 59 50
Mineral soil S (g m−2) 74 a 846 c 144 ab 227 b 78 ab
Organic soil N (g m−2) 307 186 241 240 208
Mineral soil N (g m−2) 429 a 1,293 c 372 ab 939 bc 422 ab
Organic soil Alo (g m−2) 84 ab 139 b 79 ab 51 ab 36 a
Mineral soil Alo (g m−2) 2,262 a 14,087 b 3,999 ab 5,570 ab 1,797 ab
Organic soil Feo (g m−2) 105 a 428 b 129 a 63 a 67 a
Mineral soil Feo (g m−2) 3,300 a 26,342 b 6,109 ab 9,353 ab 6,709 ab
Total soil Hg (mg m−2) 16 137 47 70 22
Total soil C (g m−2) 14,810 24,898 9,792 20,716 18,388
Total soil S (g m−2) 108 887 214 286 217
Total soil N (g m−2) 736 1,481 613 1,168 1,028
Total soil Alo (g m−2) 2,346 14,226 4,078 5,622 1,833
Total soil Feo (g m−2) 3,405 26,769 6,238 9,416 6,776
Organic soil Hg/C (μg g−1) 1.09 1.51 1.79 1.26 0.94
Mineral soil Hg/C (μg g−1) 1.08 6.29 8.90 4.25 2.71
Organic soil Hg/S (μg g−1) 215 171 137 126 105
Mineral soil Hg/S (μg g−1) 120 148 256 278 183
Organic soil Hg/N (μg g−1) 23 36 46 32 30
Mineral soil Hg/N (μg g−1) 21 97 99 67 36
Organic soil C/N (g g−1) 21 24 24 25 27
Mineral soil C/N (g g−1) 19 16 11 16 14
Organic soil C/S (g g−1) 198 111 81 100 112
Mineral soil C/S (g g−1) 112 23 28 65 76
Differing superscript letters indicate statistically significant differences between individual sites (Tukey adjusted p<0.05) according to theANOVA test. Table lines with no superscript letter indicate no differences between individual sites
Water Air Soil Pollut (2014) 225:1829 Page 11 of 17, 1829
the majority of soil S across the Czech Republic wasassociated with organic matter, we found no significantcorrelation between TS and TC (nor between TS andTN) in O-horizons. The probable reason for this wassite-to-site differences in S deposition history causingvariable availability of S for vegetation. In mineral soils,all three elements associated with soil organic materialTS, TC and TN were significantly correlated (TS to TC,r=0.71 and TS to TN, r=0.63, both at p<0.001). Inmineral soils, as in O-horizons, TS correlated moststrongly with CEC (r=0.87, p<0.001), followed byTC (r=0.83, p<0.001) and TN (r=0.60, p<0.001).
3.3 Comparing the Individual Sites
Hg concentrations in individual O-horizon soils atthe 5 study sites LES, NPBS, PLB, LYS and LIZranged from 87 to 679 μg kg−1. They were signif-icantly lower than those (up to 2,000 μg Hg kg−1)reported from forest sites in the Czech Republicclose to a significant Hg emission point source inPříbram (Ettler et al. 2007). Across sites, the meanHg concentration in organic soil ranged from277 μg kg−1 at LIZ to 393 μg kg−1 at LES, butan ANOVA showed no significant statistical differ-ences (Table 1). The mean concentration of Hg forcomposited forest humus from a whole countryareal study was 676 μg kg−1 (Suchara andSucharová 2000) thus soils at our study sites appearto be less impacted by Hg pollution. The highestmean concentration of Hg in organic soil was atsite LES, probably because of its proximity to thePříbram mining and ore smelting region (Fig. 1,Sucharová and Suchara 2004; Ettler et al. 2007).Mercury contamination from this activity reachedits maximum during the 1960s to 1980s, as re-vealed from peat archives (Ettler et al. 2008). Themean amount of accumulated Hg during a period of117 years was 12.1 mg m−2. Site LIZ had thelowest mean Hg concentration in organic soil, cor-responding to the relatively low deposition load atthe Bohemian Forest area in the south part ofCzech Republic (Fig. 1). A peat profile near LIZaccumulated only 2.8 mg Hg m−2 during the last117 years (Zuna et al. 2012).
Hg concentrations in mineral soil were markedlylower than those in organic horizons and varied signif-icantly across the five study sites (ANOVA, Table 1).Mean mineral soil Hg concentration ranged from
22 μg kg−1 at NPBS to 95 μg kg−1 at LIZ, and was alsorelatively high at LES and LYS (Table 1). This rangewas generally similar to Hg concentrations in mineralsoils at German forest sites in Bavaria (Schwesig andMatzner 2000). The pattern of mean Hg concentrationsacross sites in mineral soil (Table 1) did not reflect thepattern in organic soils.
Mean Hg/C ratios for individual sites ranged from0.94 to 1.79 μg Hg g−1 C in organic soil and from 1.08to 8.90 μg Hg g−1 C in mineral soil. Sites with thehighest Hg/C ratios in organic soil tended to have thehighest Hg/C ratios in mineral soil (Table 3). O-horizonHg/C ratios at all sites were greater than the average of0.7 μg Hg g−1 C reported in a review paper by Grigal(2003). The pattern of lower Hg/C ratios in organic soilrelative to mineral soil occurred at all sites, similar tonumerous other studies (e.g., Grigal 2003; Amirbahmanet al. 2004; Nasr and Arp 2011; Juillerat et al. 2012).The highest Hg/C ratio was found at LES, which had thehighest mean O-horizon Hg concentration of all sites.The second highest Hg/C ratio was at the least impactedsite LIZ. Surprisingly, all three sites within the BlackTriangle—NPBS, LYS, and PLB—exhibited relativelylow O-horizon Hg/C ratios (Table 3). Due to the closerelation of TC and TN concentrations at all sites, Hg/Npatterns were similar to those of Hg/C (Table 3).
Hg/S ratios exhibited differing patterns from organictomineral soil among the five sites. At the sandstone siteNPBS, the Hg/S ratio in organic soil was much higherthan in mineral soil (Table 3). At the least impacted siteLIZ the organic and mineral soil Hg/S ratio were ap-proximately equal, similar to the findings of Demerset al. (2013) for an upland soil in the AdirondackMountains, USA. The remaining sites LES, LYS andPLB had much lower Hg/S ratios in organic soil relativeto mineral soil (Table 3). Although Novák et al. (2005)concluded that organic forms of S dominated at thesesites, small amounts of sulfide minerals could be respon-sible for this variable pattern.
All five of our Czech sites displayed the typicalpattern of higher soil C/N ratios in organic relative tomineral soil (Table 3), as C/N tends to decrease withincreasing extent of organic material decomposition.The least difference between the organic and mineralC/N values occurred at the NPBS site with the sandstonebedrock. C/N ratios at individual sites were consistentwith the results of Oulehle et al. (2008) who assessedC/N ratios at 14 sites throughout the Czech Republic.The lowest C/N ratios occurred at sites heavily impacted
1829, Page 12 of 17 Water Air Soil Pollut (2014) 225:1829
by acid deposition (e.g., Ore Mountains, JizeraMountains), which could explain the lowest C/N ratioat NPBS (Table 3). On the other hand, the well-bufferedsite PLB fell among the sites with the highest C/N ratio,similar to results in this paper (Table 3). Obrist et al.(2009) and Yu et al. (2013) found that decomposed soilorganic matter with a typically low C/N had high Hg/C.We found a similar relationship of the Hg/C ratio to C/Non Czech organic and mineral soils but with a muchmore narrow C/N ratio range compared to that in Obristet al. (2009).
3.4 Pools of Hg, C, N and S in Forest Soil
The total mass per unit area of an element contained inthe soil pool is a function of its concentration in the soil,soil bulk density and soil thickness. Bulk density at thefive study sites ranged from 165 to 260 kg m−3 inorganic horizons and from 1,180 to 1,420 kg m−3 inmineral soil (Table 1). Cross-site differences in the meanbulk densities of organic soil were not statistically sig-nificant but mineral soil bulk density differed at sitesPLB and LYS (Table 1). Similarly, organic horizonthickness was not statistically different across all 5 sitesbut mineral soil thickness was significantly greater atsite LIZ compared to sites LYS and PLB (Table 1).
The largest mean total soil pool (organic+mineral) ofHg was 137 mg m−2 at LIZ, followed by 70 mg m−2 atLYS, 51 mg m−2 at LES, 22 mg m−2 at PLB, and16 mg m−2 at NPBS. The total Hg pools were compa-rable to those reported from German catchments inBavaria of 19 and 89 mg m−2 (Schwesig and Matzner2000) or from New Brunswick of 89 mg m−2 (Nasr andArp 2011). All elemental pools were greatest at LIZ,primarily as a consequence of its greatest thickness ofmineral soil (Tables 1 and 3). LIZ has the largest totalHg pool size despite its setting in the Czech regionreceiving the lowest historical anthropogenic Hg (andS) deposition. The 2.8 mg Hg m−2 accumulated in thenearby peat profile during the last 117 years (Zuna et al.2012) represents only about 2 % of the total Hg soilpool. If we assume that the higher 12.1 mg applies to theBlack Triangle sites and LES, then the last 117 years ofHg deposition represents 17 % of the soil Hg pool atLYS, 24 % at LES, 53 % at PLB, and 76 % at NPBS.These figures underscore that the size of the total soil Hgpool at a particular site does not necessarily reflect thelevel of past Hg atmospheric deposition. It is also afunction of mineral soil thickness and its capacity for
organic matter storage, as well as characteristics of theforest floor that may control the amount of Hg evasion.Variation in soil Hg pool size was also explained bydifferences in soil thickness in other studies (e.g.,Amirbahman et al. 2004).
The smallest total soil Hg pool was at site NPBSwithin the Black Triangle. The mean concentration ofHg in mineral soil was the smallest of the three BlackTriangle sites (Table 3). Site NPBS also had the smallesttotal pool of N and S (Table 3) and a low total C pool.This probably results from lowmean oxalate-extractableFe pool of mineral soil (Table 3), which implies reducedability for SOM storage, and consequently a relativelysmall Hg pool. The low Hg/C ratio in mineral soil atNPBS may result from fast turnover of the SOM due toits low elevation relative to the other studied sites andpossible high soil matrix porosity due to the low contentof clay minerals.
All sites had a larger Hg pool in the mineral soil than inthe organic soil, but the relative amounts varied widelyamong sites (Table 3). The greatest difference in size oforganic and mineral Hg soil pool occurred at LIZ, wherethe organic Hg pool formed only 5 % of the total Hg pool.At the other extremewasNPBS, where the organic soil Hgpool (7.1 mg m−2) represented 44 % of the total soil Hgpool (16.0 mg m−2). There were no significant statisticaldifferences among the organic soil Hg pools at all sites(Table 3), in spite of different local deposition histories,thus differences in total Hg soil pools were driven bydifferences in the mineral soil Hg pools across sites.Organic horizon Hg pools from all sites were smaller thanthe 16.9 mgm−2 reported from Fichtelgebirge in Germany(Schwesig and Matzner, 2001).
Similarly, O-horizon pools of C and N were notsignificantly different across the 5 study catchments.The organic soil pools of C at the 5 study sites rangedfrom 4,486 g m−2 at site LIZ to 6,538 g m−2 at siteNPBS (Table 1). This represents 18 to 62 % of the totalC soil pool. These organic C soil pools were comparableto those reported from German sites in Fichtelgebirgewhere the organic pool contained 1,710 and 5,460 g m−2
of C, forming 17 and 31 % of the total soil C pool(Rumpel et al. 2002). Within the Czech RepublicOulehle et al. (2011) reported a decrease in the organicsoil C pool from 5,797 g m−2 in 1994 to 3,741 g m−2 in2010 from an extremely acidified site in the mountain-ous part of the Black Triangle area. The effect of thisorganic soil C pool reduction, attributed to the reductionin acidic (sulfur) deposition (Oulehle et al. 2011), on Hg
Water Air Soil Pollut (2014) 225:1829 Page 13 of 17, 1829
pools is not known. Furthermore, Oulehle et al. (2011)reported a simultaneous decrease in the organic soil Npool from 233 to 150 g m−2 in the period 1994 to 2010.The organic soil N pools calculated in this study rangedfrom 178 g m−2 at site NPBS to 307 g m−2 at site LIZ.
Organic soil S pools differed significantly amongsites and were greatest at LES (90 g m−2). Unlike Sconcentrations, organic soil S pools did not reflect his-torical S deposition. The organic soil S pools weresmaller at the Black Triangle sites NPBS, LYS andPLB, which experienced extreme levels of acid deposi-tion in the 1970s and 1980s (Hruška and Krám 2003).
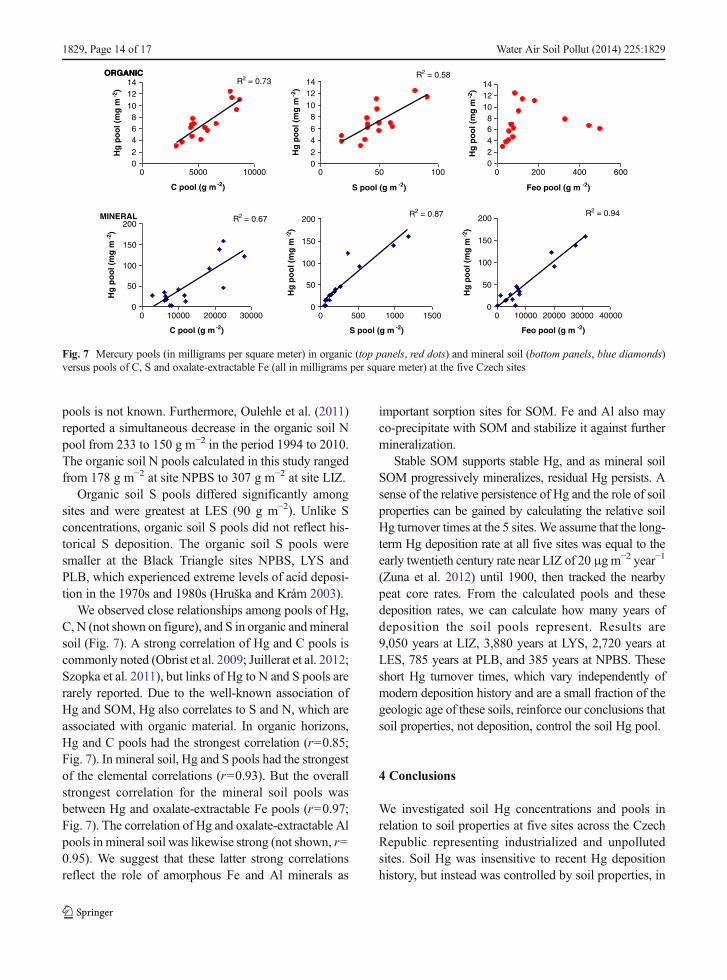
We observed close relationships among pools of Hg,C, N (not shown on figure), and S in organic andmineralsoil (Fig. 7). A strong correlation of Hg and C pools iscommonly noted (Obrist et al. 2009; Juillerat et al. 2012;Szopka et al. 2011), but links of Hg to N and S pools arerarely reported. Due to the well-known association ofHg and SOM, Hg also correlates to S and N, which areassociated with organic material. In organic horizons,Hg and C pools had the strongest correlation (r=0.85;Fig. 7). In mineral soil, Hg and S pools had the strongestof the elemental correlations (r=0.93). But the overallstrongest correlation for the mineral soil pools wasbetween Hg and oxalate-extractable Fe pools (r=0.97;Fig. 7). The correlation of Hg and oxalate-extractable Alpools in mineral soil was likewise strong (not shown, r=0.95). We suggest that these latter strong correlationsreflect the role of amorphous Fe and Al minerals as
important sorption sites for SOM. Fe and Al also mayco-precipitate with SOM and stabilize it against furthermineralization.
Stable SOM supports stable Hg, and as mineral soilSOM progressively mineralizes, residual Hg persists. Asense of the relative persistence of Hg and the role of soilproperties can be gained by calculating the relative soilHg turnover times at the 5 sites. We assume that the long-term Hg deposition rate at all five sites was equal to theearly twentieth century rate near LIZ of 20 μgm−2 year−1
(Zuna et al. 2012) until 1900, then tracked the nearbypeat core rates. From the calculated pools and thesedeposition rates, we can calculate how many years ofdeposition the soil pools represent. Results are9,050 years at LIZ, 3,880 years at LYS, 2,720 years atLES, 785 years at PLB, and 385 years at NPBS. Theseshort Hg turnover times, which vary independently ofmodern deposition history and are a small fraction of thegeologic age of these soils, reinforce our conclusions thatsoil properties, not deposition, control the soil Hg pool.
4 Conclusions
We investigated soil Hg concentrations and pools inrelation to soil properties at five sites across the CzechRepublic representing industrialized and unpollutedsites. Soil Hg was insensitive to recent Hg depositionhistory, but instead was controlled by soil properties, in
02468
101214
0 200 400 600
Feo pool (g m -2)
Hg
po
ol (
mg
m-2
)
R2 = 0.94
0
50
100
150
200
0 10000 20000 30000 40000
Feo pool (g m -2)
Hg
po
ol (
mg
m-2
)
R2 = 0.73
02
468
10
1214
0 5000 10000
C pool (g m -2)
Hg
po
ol (
mg
m-2
)
ORGANIC ORGANIC R2 = 0.58
02
46
810
1214
0 50 100
S pool (g m -2)
Hg
po
ol (
mg
m-2
)
R2 = 0.67
0
50
100
150
200
0 10000 20000 30000
C pool (g m -2)
Hg
po
ol (
mg
m-2
)
MINERAL R2 = 0.87
0
50
100
150
200
0 500 1000 1500
S pool (g m -2)
Hg
po
ol (
mg
m-2
)
Fig. 7 Mercury pools (in milligrams per square meter) in organic (top panels, red dots) and mineral soil (bottom panels, blue diamonds)versus pools of C, S and oxalate-extractable Fe (all in milligrams per square meter) at the five Czech sites
1829, Page 14 of 17 Water Air Soil Pollut (2014) 225:1829
particular the distribution of soil organic matter. Asexpected, soil Hg correlated strongly to total carbon(TC) concentration in soils. However, Hg was evenmore strongly linked with total sulfur (TS) concentra-tion and oxalate-extractable Al and Fe concentrations,which were also intimately coupled with distribution oforganic matter in soil. The association of Hg to TSfollows from the known affinity of Hg for S functionalgroups in organic matter.
Despite a fivefold spread in recent (past century) Hgdeposition flux, organic soil Hg pools were not statisti-cally different across the five sites, but were smaller thanmineral soil Hg pools. The cross-site differences inmineral soil Hg pools were explained primarily by dif-ferences in soil thickness and the ability of the soil tostore (stabilize) organic material. Thus, the least impact-ed site LIZ had the greatest soil Hg pool. The Hgturnover times in the soil were only a small fraction ofsoil age, further underscoring that local soil characteris-tics and vegetation are more important than Hg deposi-tion history.
Acknowledgments Main financial support for this research hasbeen provided by the Czech Science Foundation Project No. P210-11-1369. We are very thankful to Světlana Hubičková and IrenaDobešová for sample processing and laboratory treatment. Weappreciate the work of Ondřej Šebek at the Laboratories of Facultyof Science Charles University performing sulfur analyses.Supporting information for site LIZ was kindly provided byMiroslav Tesař and for sites LYS and PLB by Pavel Krám.
References
Akerblom, S., Meili, M., Bringmark, L., Johansson, K.,Kleja, D. B., & Bergkvist, B. (2008). Partitioning ofHg between solid and dissolved organic matter in thehumus layer of boreal forests. Water, Air, and SoilPollution, 189, 239–252.
Amirbahman, A., & Fernandez, I. J. (2012). The Role of Soils inStorage and Cycling of Mercury. In M. S. Bank (Ed.),Mercury in the environment: pattern and process (pp. 99–118). Berkeley: University of California Press.
Amirbahman, A., Ruck, P. L., Fernandez, I. J., Haines, T.A., & Kahl, J. A. (2004). The effect of fire on mer-cury cycling in the soils of forested watersheds:Acadia National Park, Maine, USA. Water, Air, andSoil Pollution, 152, 315–331.
Bishop, K.H., & Lee, Y.H. (1997). Catchments as a source ofmercury/methylmercury in boreal surface waters. A. Sigel &H. Sigel (Eds.), metal ions in biological systems; mercuryand its effect on environment and biology (pp. 113-127).New York: Marcel Dekker Inc
Bushey, J. T., Nallana, A. G., Montesdeoca, M. R., & Driscoll, C.T. (2008). Mercury dynamics of a northern hardwood cano-py. Atmospheric Environment, 42, 6905–6914.
Demers, J.D., Yavitt, J.B., Driscoll, C.T., Montesdeoca, M.R.(2013). Legacy mercury and stoichiometry with C, N, andS in soil, pore water, and stream water across the upland–wetland interface: The influence of hydrogeologic setting.Journal of Geophysical Research: Biogeosciences 118, doi:10.1002/jgrg.20066
Demers, J. D., Driscoll, C. T., Fahey, T. J., & Yavitt, J. B. (2007).Mercury cycling in litter and soil in different forest types inthe Adirondack region, New York, USA. EcologicalApplications, 17, 1341–1351.
Denkenberger, J. S., Driscoll, C. T., Branfireun, B. A., Eckley, C.S., Cohen,M., & Selvendiran, P. A. (2012). Synthesis of ratesand controls on elemental mercury evasion in theGreat LakesBasin. Environmental Pollution, 161, 291–298.
EMEP, (2012). Database of the EMEP Centre on EmissionInventories and Projections (CEIP) www.ceip.at AccessedJanuary 2013.
Ettler, V., Navrátil, T., Mihaljevič, M., Rohovec, J., Zuna, M.,Šebek, M., et al. (2008). Mercury deposition/accumulationrates in the vicinity of a lead smelter as recorded by a peatdeposit. Atmospheric Environment, 42, 5968–5977.
Ettler, V., Rohovec, J., Navrátil, T., & Mihaljevič, M. (2007).Mercury distribution in soil profiles polluted by leadsmelting. Bulletin of Environmental Contamination andToxicology, 78, 12–16.
Fottová, D., & Skořepová, I. (1998). Changes in mass elementfluxes and their importance for critical loads: GEOMONnetwork, Czech Republic. Water, Air, and Soil Pollution,105, 365–376.
Fröberg, M., Jardine, P. M., Hanson, P. J., Swanston, C. W., Todd,D. E., Tarver, J. R., &Garten, C. T., Jr. (2007). Low dissolvedorganic carbon input from fresh litter to deep mineral soils.Soil Science Society of America Journal, 71, 347–354.
Graydon, J. A., St. Louis, V. L., Lindberg, S. E., Sandilands, K. A.,Rudd, J. W. M., Kelly, C. A., Harris, R., Tate, M. T.,Krabbenhoft, D. P., Emmerton, C. A., Asmath, H., &Richardson, M. (2012). The role of terrestrial vegetation inatmospheric Hg deposition: pools and fluxes of spike andambient Hg from the METAALICUS experiment. GlobalBiogeochemical Cycles, 26, GB1022.
Grigal, D. F. (2003). Mercury sequestration in forests andpeatlands: a review. Journal of Environmental Quality, 32,393–405.
Gustin, M. S., Lindberg, S. E., Austin, K., Coolbaugh, M., Vette,A., & Zhang, H. (2000). Assessing the contribution of naturalsources to regional atmospheric mercury budgets. Science ofthe Total Environment, 259, 61–71.
Hagedorn, F., Kammer, A., Schmidt, M. W. I., & Goodale, C. L.(2012). Nitrogen addition alters mineralization dynamics of13C depleted leaf and twig litter and reduces leaching ofolder DOC from mineral soil. Global Change Biology, 18,1412–1427.
Hall, B. D., & St. Louis, V. L. (2004). Methylmercury and totalmercury in plant litter decomposing in upland forests andflooded landscapes. Environmental Science and Technology,38, 5010–5021.
Harris, R. C., Rudd, J.W.M., Amyot,M., Babiarz, C. L., Beaty, K.G., Blanchfield, P. J., et al. (2007). Whole-ecosystem study
Water Air Soil Pollut (2014) 225:1829 Page 15 of 17, 1829
shows rapid fish–mercury response to changes in mercurydeposition. Proceedings of the National Academy ofSciences, 104, 16586–16591.
Hintelmann, H., Harris, R., Heyes, A., Hurley, J., Kelly, C.,Krabbenhoft, D., Lindberg, S., Rudd, J., Scott, K., & St.Louis, V. (2002). Reactivity and mobility of new and oldmercury deposition in a boreal forest ecosystem during thefirst year of the METAALICUS study. EnvironmentalScience and Technology, 36, 5034–5040.
Hruška, J., & Krám, P. (2003). Modelling long-term changes instream water and soil chemistry in catchments with contrast-ing vulnerability to acidification (Lysina and Pluhuv Bor,Czech Republic). Hydrology and Earth System Sciences, 7,525–539.
Juillerat, J. I., Ross, D. S., & Bank, M. S. (2012). Mercury inlitterfall and upper soil horizons in forested ecosystems inVermont, USA. Environmental Toxicology and Chemistry,31, 1720–1729.
Kalbitz, K., & Kaiser, K. (2008). Contribution of dissolved organ-ic matter to carbon storage in forest soils. Journal of PlantNutrition and Soil Science, 171, 52–60.
Kaste, J. M., Bostick, B. C., Heimsath, A. M., Steinnes, E., &Friedland, A. J. (2011). Using atmospheric fallout to dateorganic horizon layers and quantify metal dynamics duringdecomposition. Geochimica et Cosmochimica Acta, 75,1642–1661.
Klaminder J., Bindler R., Rydberg J., & Renberg, I. (2008). Isthere a chronological record of atmospheric mercury and leaddeposition preserved in the mor layer (O-horizon) of borealforest soils? Geochimica et Cosmochimica Acta, 72, 703–712.
Kopáček, J., & Veselý, J. (2005). Sulfur and nitrogen emissions inthe Czech Republic and Slovakia from 1850 till 2000.Atmospheric Environment, 39, 2179–2188.
Krám, P., Hruška, J., Driscoll, C. T., Johnson, C. E., &Oulehle, F. (2009a). Long-term changes in aluminumfractions of drainage waters in two forest catchmentswith contrasting lithology. Journal of InorganicBiochemistry, 103, 1465–1472.
Krám, P., Hruška, J., & Shanley, J. B. (2012). Streamwater chem-istry in three contrasting monolithologic catchments. AppliedGeochemistry, 27, 1854–1863.
Krám, P., Hruška, J., Wenner, B. S., Driscoll, C. T., & Johnson, C.E. (1997). The biogeochemistry of basic cations in two forestcatchments with contrasting lithology in the Czech Republic.Biogeochemistry, 37, 173–202.
Krám, P., Oulehle, F., Štědrá, V., Hruška, J., Shanley, J. B.,Minocha, R., & Traister, E. (2009b). Geoecology of a forestwatershed underlain by serpentine in central Europe.Northeastern Naturalist, 16, 309–328.
Nasr, M., & Arp, P. A. (2011). Hg concentrations and accumula-tions in fungal fruiting bodies, as influenced by forest soilsubstrates and moss carpets. Applied Geochemistry, 26,1905–1917.
Navrátil, T., Hojdová, M., Rohovec, J., Penížek, V., & Vařilová, Z.(2009). Effect of fire on pools of mercury in forest soil,central Europe. Bulletin of Environmental Contaminationand Toxicology, 83, 269–274.
Navrátil, T., Kurz, D., Krám, P., Hofmeister, J., & Hruška, J. (2007).Acidification and recovery of soil at a heavily impacted forest
catchment (Lysina, CzechRepublic)—SAFEmodeling and fieldresults. Ecological Modeling, 205, 464–474.
Navrátil, T., Rohovec, J., Hojdová, M., & Vach, M. (2011). Springsnowmelt and mercury export from a forested catchment inthe Czech Republic, Central Europe. Bulletin ofEnvironmental Contamination and Toxicology, 86, 670–675.
Navrátil, T., Vach, M., Norton, S. A., Skřivan, P., Hruška, J., &Maggini, L. (2003). Chemical response of a small stream in aforested catchment (central Czech Republic) to a short-termin-stream acidification. Hydrology and Earth SystemSciences, 7, 411–423.
Novák,M., Buzek, F., Harrison, A. F., Přechová, E., Jačková, I., &Fottová, D. (2003). Similarity between C, N and S stableisotope profiles in European spruce forest soils: implicationsfor the use of delta S-34 as a tracer. Applied Geochemistry,18, 765–779.
Novák, M., Kirchner, J., Fottová, D., Přechová, E., Jačková, I.,Krám, P., & Hruška, J. (2005). Isotopic evidence for process-es of sulfur retention/release in 13 forested catchments span-ning a strong pollution gradient (Czech Republic, centralEurope). Global Biogeochemical Cycles, 19, GB4012.
Obrist, D., Johnson, D.W., Lindberg, S. E., Luo, Y., Hararuk, O.,Bracho, R. et al. (2011). Mercury distribution across 14 U.S.Forests. Part I: spatial patterns of concentrations in biomass,litter, and soils. Environmental Science and Technology,3974-3981.
Obrist, D., Johnson, D. W., & Lindberg, S. E. (2009). Mercuryconcentrations and pools in four Sierra Nevada forest sites,and relationships to organic carbon and nitrogen.Biogeosciences, 6, 765–777.
Oulehle, F., Evans, C. D., Hofmeister, J., Krejci, R., Tahovska, K.,Persson, T., Cudlin, P., &Hruska, J. (2011).Major changes inforest carbon and nitrogen cycling caused by declining sul-phur deposition. Global Biogeochemical Cycles, 17, 3115–3129.
Oulehle, F., McDowell, W. H., Aitkenhead-Peterson, J. A., Krám,P., Hruška, J., Navrátil, T., et al. (2008). Longterm trends instream nitrate concentrations and losses across watershedsundergoing recovery from acidification in the CzechRepublic. Ecosystems, 11, 410–425.
Pacyna, J. M., Pacyna, E. G., & Aas, W. (2009). Changes ofemissions and atmospheric deposition of mercury, lead, andcadmium. Atmospheric Environment, 43, 117–127.
Pansu, M., & Gautheyrou, J. (2006). Handbook of soil analysis.Berlin: Springer.
Pilgrim, W., Poissant, L., & Trip, L. (2000). The Northeast statesand Eastern Canadian provinces mercury study: a frameworkfor action: summary of the Canadian chapter. Science of theTotal Environment, 261, 177–184.
Pirrone, N., Cinnirella, S., Feng, X., Finkelman, R. B., Friedli, H.R., Leaner, J., et al. (2010). Global mercury emissions to theatmosphere from anthropogenic and natural sources.Atmospheric Chemistry and Physics, 10, 5951–5964.
Pokharel, A. K., & Obrist, D. (2011). Fate of mercury in tree litterduring decomposition. Biogeosciences, 8, 2507–2521.
Porębska, G., & Ostrowska, A. (2013). Assessment of C stock inforest soils in Poland over the last 30 years. Polish Journal ofEnvironmental Studies, 22, 503–510.
Rea, A. W., Lindberg, S. E., Scherbatskoy, T., & Keeler, G. J.(2002). Mercury accumulation in foliage over time in two
1829, Page 16 of 17 Water Air Soil Pollut (2014) 225:1829
northern mixed-hardwood forests. Water, Air, and SoilPollution, 133, 49–67.
Ritchie, C. D., Richards, W., & Arp, P. A. (2006). Mercury in fogon the Bay of Fundy (Canada). Atmospheric Environment,40, 6321–6328.
Rumpel, C., Kögel-Knabner, I., & Bruhn, F. (2002). Verticaldistribution, age, and chemical composition of organic car-bon in two forest soils of different pedogenesis. OrganicGeochemistry, 33, 1131–1142.
Salminen, R., Batista, M. J., Bidovec, M., Demetriades, A., DeVivo, B., De Vos, W., Duris, M., et al. (2005). GeochemicalAtlas of Europe. Part 1—background information, method-ology and maps. Espoo: Geological Survey of Finland.
Schimel, D. S., Braswell, B. H., Holland, E. A., McKeown, R.,Ojima, D. S., Painter, T. H., Parton,W. J., & Townsend, A. R.(1994). Climatic, edaphic, and biotic controls over storageand turnover of carbon in soils. Global BiogeochemicalCycles, 8, 279–293.
Schwesig, D., & Matzner, E. (2000). Pools and fluxes of mercuryand methylmercury in two forested catchments in Germany.Science of the Total Environment, 260, 213–223.
Schwesig, D., & Matzner, E. (2001). Dynamics of mercury andmethylmercury in forest floor and runoff of a forested water-shed in Central Europe. Biogeochemistry, 53, 181–200.
Schwesig, D., Ilgen, G., & Matzner, E. (1999). Mercury andmethylmercury in upland and wetland forest soils of a water-shed in NE-Bavaria, Germany.Water, Air, and Soil Pollution,113, 141–154.
Shanley, J. B., & Bishop, K. (2012). Mercury cycling in terrestrialwatersheds. InM. S. Bank (Ed.),Mercury in the environment:pattern and process (pp. 119–142). Berkeley and LosAngeles: University of California Press.
Sheehan, K. D., Fernandez, I. J., Kahl, J. S., & Amirbahman, A.(2006). Litterfall mercury in two forested watersheds atAcadia Nation Park, Maine, USA. Water, Air, and SoilPollution, 170, 249–265.
Skyllberg, U., Bloom, P. R., Qian, J., Lin, C.-M., & Bleam, W. F.(2006). Complexation of mercury(II) in soil organic matter:EZAFs evidence for linear two-coordination with reduced
sulfur groups. Environmental Science and Technology, 40,4174–4180.
Skyllberg, U., Qian, J., Frech, W., Xia, K., & Bleam,W. F. (2003).Distribution of mercury, methyl mercury and organic sulphurspecies in soil, soil solution and stream of a boreal forestcatchment. Biogeochemistry, 64, 53–76.
Suchara, I., & Sucharová, J. (2000). Distribution of long-termaccumulated atmospheric deposition loads of metal and sul-phur compounds in the Czech Republic determined throughforest floor humus analyses. Results of the InternationalBiomonitoring Programme (1995). Acta Pruhoniciana, 69,1–177.
Suchara, I., & Sucharová, J. (2002). Distribution of sulphur andheavy metals in forest floor humus of the Czech Republic.Water, Air, and Soil Pollution, 136, 289–316.
Sucharová, J., & Suchara, I. (2004). Distribution of 36 elementdeposition rates in a historic mining and smelting area asdetermined through fine-scale biomonitoring techniques. PartI: relative and absolute current atmospheric deposition levelsdetected throughmoss analyses.Water Air and Soil Pollution,153, 205–228.
Szopka, K., Karczewska, A., & Kabala, C. (2011). Mercury accu-mulation in the surface layers of mountain soils: a case studyfrom the Karkonosze Mountains, Poland. Chemosphere, 83,1507–1512.
Torn, M. S., Trumbore, S. E., Chadwick, O. A., Vitousek, P. M., &Hendricks, D. M. (1997). Mineral control of soil organiccarbon storage and turnover. Nature, 389, 170–173.
Yu, X., Driscoll, C.T., Warby, R.A.F., Montesdeoca, M., JohnsonC.E. (2013). Soil mercury and its response to atmosphericmercury deposition across the northeastern United States.Ecological Applications, Online.
Zhang, Y., Jaegle, L., van Donkelaar, A., Martin, R. V., Holmes, C.D., Amos, H. M., et al. (2012). Nested-grid simulation ofmercury over North America. Atmospheric Chemistry andPhysics, 12, 6095–6111.
Zuna, M., Ettler, V., Šebek, O., & Mihaljevič, M. (2012). Mercuryaccumulation in peatbogs at Czech sites with contrasting pollu-tion histories. Science of the Total Environment, 424, 322–330.
Water Air Soil Pollut (2014) 225:1829 Page 17 of 17, 1829