distressed firm and bankruptcy prediction in an...
TRANSCRIPT
1
Distressed Firm and Bankruptcy prediction in an international context a review and empirical analysis of Altmanrsquos Z-Score Model
Edward I Altman New York University
Małgorzata Iwanicz-Drozdowska Warsaw School of Economics
Erkki K Laitinen University of Vaasa
Arto Suvas University of Vaasa
(Latest version July 9 2014)
ABSTRACT
The purpose of this paper is firstly to review the literature on the efficacy and importance of the Altman Z-Score bankruptcy prediction model globally and its applications in Finance and related areas This review is based on an analysis of 34 scientific papers published from the year 2000 in leading financial and accounting journals Secondly we use a large international sample of firms to assess the classification performance of the model in bankruptcy and distressed firm prediction In all we analyze its performance in firms from 32 European and three non-European countries This kind of comprehensive international analysis has not been presented thus far Except for the US and China the firms in the sample are private and cover non-financial companies across all industrial sectors Thus the version of the Z-Score model developed by Altman (1983) for private manufacturing and non-manufacturing firms (Zrsquorsquo-Score Model) is used in our testing The literature review shows that results for Z-Score Models have been somewhat uneven in that in some studies the model has performed very well whereas in others it has been outperformed by competing models None of the reviewed studies is based on a comprehensive international comparison which makes the results difficult to generalize The analysis in this study shows that while a general international model works reasonably well for most countries with prediction accuracy levels of about 75 and exceptionally well for some (above 90) the classification accuracy may be considerably improved with country-specific estimation In some country models the information provided by additional variables helps boost the classification accuracy to a higher level
1 Introduction
The first multivariate bankruptcy prediction model was developed by EI Altman (1968) from New York University in the late 1960rsquos (8176 citations according to Google Scholar per June 12th 2014) After this pioneering work the multivariate approach to failure prediction spread worldwide among researchers in finance banking and credit risk Failure prediction models are important tools for bankers investors asset managers rating agencies and even for the distressed firms themselves The banking industry as the main provider of financing in the economy is especially interested in minimizing the level of non-performing loans in order to maximize profit on the credit activity Another issue of interest for bankers is capital adequacy and an internal ratings-based approach was encouraged by Basel 2 (first version in 1999 implemented in 2004) The Z-Score model has become a prototype for many of these internal-rate based models Asset manager investors need to have reliable tools for the selection of companies into their portfolios Financial distress of the companies is on the one hand detrimental to investor returns but on the other hand risk may give opportunities for high returns Rating agencies assess the risk of the entities and securities issues thus they need to
2
have a tool to predict default1 In addition Altman (1983 1993) has suggested that the management of distressed firms can utilize the Z-Score model as a guide to a finanancial turnaround The approach used for bankruptcy prediction has been evolving over time Beaver (1966 1968) used univariate analysis for selected ratios and detected that some of them had a very good predictive power Altman (1968) moved significantly forward since he developed a multiple discriminant analysis model (MDA) called the Z-Score Model with 5 ratios The next two decades brought even more financial distress research (eg Ohlson 1980 who used the logit model2 Taffler 1984 who developed a Z-score model for the UK) which was summarized by Zmijewski (1984)3 who used a probit approach in his own model Dimitras et al (1996) reviewed 47 studies on business prediction models (of which 13 were from the US and nine from the UK) They summarized the methods used (discriminant analysis was prevailing) and the variety of ratios used The next summary of different approaches to credit risk analysis was given by Altman and Saunders (1998) Balcaen and Ooghe (2006) reviewed models of business failure prediction and classified 43 models presented in the literature into 4 categories (univariate model 1 risk index models 2 MDA models 21 conditional probability models 19) They omitted however the fast growing models based on the option pricing theory and contingent claims (eg Vassalou and Xing 2004 commercialized into the KMV model) and hazard models (eg Shumway 2001) Kumar and Ravi (2007) reviewed 128 statistical and artificial intelligence models for the bankruptcy prediction of banks and firms with special attention paid to the technique used in different models pointing out that neural networks were the most popular intelligence technique Jackson and Wood (2013) presented in their review the frequency of the occurrence of the specific forecasting techniques in the prior literature The top-five popular techniques were (1) multiple discriminant analysis (2) the logit model (3) neural network (4) contingent claims and (5) univariate analysis Recent valuable reviews on the efficacy of the models have been delivered by Agarwal and Taffler (2008) and Bauer and Agarwal (2014) taking into account the performance of accounting-based models market-based models and hazard models These three types of models prevail in the finance literature According to Agarwal and Taffler (2008) there is little difference in the predictive accuracy of accounting-based and market-based models however the usage of accounting-based models allows for a higher level of risk-adjusted return on the credit activity In Bauer and Agarwal (2014) hazard models that use both accounting and market information (Shumway (2001) and Campbell et al (2006)) were compared with two other approaches (the original Tafflerrsquos (1984) accounting based z-score model that was tested in Agarwal and Taffler (2008) and a contingent claims-based model using the Bharath and Shumway (2008) approach) The hazard models were superior in UK data in terms of bankruptcy prediction accuracy (their default probabilities were close to the observed default rates) ROC analysis and information content In spite of the vast research on failure prediction the original Z-Score Model introduced by Altman (1968) has been the dominant model applied all over the world Thus although the Z-Score Model has been in existence for more than 45 years it is still used as a main or supporting tool for bankruptcy or financial distress prediction or analysis both in research and pracitice Our study is focused on this classic model The purpose of the paper is twofold Firstly we review the literature on the Z-Score Model (or its versions Zrsquo-Score for private manufacturing firms and Zrsquorsquo-Score for non-manufacturing and manufacturing firms) applications in order to check its vitality This review is based on an analysis of 34 scientific papers published from the year 2000 in leading financial and accounting journals which have not - according to our knowledge - been presented so far Secondly
1 We use as equivalents bankruptcy failure default and financial distress
2 Altmanrsquos z-score and Ohlsonrsquos o-score have been compared by Dichev (1998)
3 Re-estimation of Ohlsonrsquos and Zmijewskirsquos models was presented by Grice and Dugan (2003)
3
we use a large international sample of firms to assess the classification performance of the Zrsquorsquo-Score model in bankruptcy prediction In all we analyze its performance in firms from 32 European and 3 Non-European countries (China Colombia and the US) Except for the US and China the firms in the sample are private Most firms are from non-manufacturing industries Therefore we use the version of the model developed by Altman (1983) for private manufacturing and non-manufacturing firms (Zrsquorsquo-Score Model) Such an extensive international analysis of the performance of the model in a large number of countries has not been presented thus far We regard our review and analysis as important contributions to the economic literature The paper is structured as follows In the introduction we present a short summary of the development of failure prediction research starting from Beaver (1966) and Altman (1968) In the second section we summarize the original Z-Score Model (1968) and its extension for private non-manufacturing firms Zrsquorsquo-Score Model (1983) Then in the third section we present results and conclusions from the literature review on these models The fourth section presents seven research hypotheses on the performance of the Zrsquorsquo-Score Model for empirical analysis In the fifth section the empirical data and statistical methods are discussed while the sixth section presents empirical findings Finally the seventh section summarizes the study
2 Classic Z-Score Models
21 Z-Score Model for public firms Altman (1968) criticized prior studies on financial difficulties and said that the adaptation of their results for assessing the bankruptcy potential of firms both theoretically and practically is questionable The dominant methodology was essentially univariate and emphasis was placed on individual signals of impending difficulties This made the ratio analysis vulnerable to faulty interpretation and potentially confusing analytics As an appropriate extension Altman suggested building upon univariate findings and to combining several measures into a meaningful predictive model Then the question arises which ratios are most important in detecting bankruptcy potential what weights should be attached to those selected ratios and how should the weights be objectively established Altman suggested a multiple discriminant analysis (MDA) as the appropriate statistical technique MDA is a statistical technique used to classify an observation into one of several priori groupings dependent upon the individual characteristics of observations For the adaptation of the MDA model it is crucial how the sample of firms for the two groups of interest bankrupt and non-bankrupt and the variables of the model were originally selected The initial sample was composed of sixty-six corporations with thirty-three firms in each of the two groups The bankrupt group (Group 1) consisted of manufacturers that filed a bankruptcy petition under Chapter X of the National Bankruptcy Act during the period 1946 ndash 1965 The mean asset size of these firms was 64 million US dollars with a range of between 07 ndash 259 million US dollars Altman recognized that this group was not homogenous with respect to size and industry although all firms were relatively small and from manufacturing industries Therefore he attempted to make a careful selection of non-bankrupt firms (Group 2) Group 2 consisted of a paired sample of manufacturing firms chosen on a stratified random basis These firms were stratified by industry and size with the asset size range restricted to 1 ndash 25 million US dollars Altman eliminated both the small firms (less than 1 million US dollars in total assets) and the very large firms because of lack of data for small firms and of the rarity of bankrupcies of large firms He did not match the assets size of the two groups exactly and therefore firms in Group 2 are slightly larger than those in Group 1 The data collected for the firms in both groups were from the same years For Group 1 the data was derived
4
from financial statements one reporting period prior to bankruptcy The average lead time of the financial statements was approximately seven and one-half months The financial ratios selected for model building were based on the balance sheet and income statement data In past studies a very large number of variables were found to be significant indicators of financial difficulties Therefore Altman compiled a list of 22 potentially important financial ratios for evaluation He classified these variables into five standard ratios categories liquidity profitability leverage solvency and activity ratios The ratios were chosen on the basis of their 1) popularity in the literature and 2) potential relevancy to the study The list included only a few ldquonewrdquo ratios In addition Altman did not consider cash flow ratios because of the lack of consistent and precise depreciation data From the original list of 22 financial ratios Altman selected five ratios for the profile as doing the ldquobestrdquo overall job in the prediction of corporate bankruptcy This profile did not contain all of the most significant variables measured independently Instead the contribution of the entire profile was evaluated To arrive at a final profile of variables Altman utilized the following procedures 1) observation of the statistical significance of various alternative functions including determination of the relative contributions of each independent variable 2) evaluation of inter-correlations between the relevant variables 3) observation of the predictive accuracy of the various profiles and 4) judgment of the analyst The final discriminant function estimated by Altman (1968) is as follows Z = 0012X1 + 0014X2 + 0033X3 + 0006X4 + 0 999X5 Or Z = 12X + 14X2 + 33X3 + 06X4 + 10X5 (when the first four variables are expressed in decimals eg 200) where X1 = Working capitalTotal assets X2 = Retained EarningsTotal assets X3 = Earnings before interest and taxesTotal assets X4 = Market value of equityBook value of total liabilities X5 = SalesTotal assets Z = Overall Index 1) The Working capitalTotal assets ratio (X1) is a measure of the net liquid assets of the firm relative to the total capitalization Working capital is defined as the difference between current assets and current liabilities When a firm is experiencing consistent operating losses it will have shrinking current assets in relation to total assets X1 proved to be the more valuable in analyses than the current ratio and the quick ratio This ratio explicitly considers liquidity and size dimensions 2) The Retained EarningsTotal assets ratio (X2) refers to the earned surplus of a firm over its entire life This measure of cumulative profitability over time is one of the two (the other is the use of the market value of equity in X4 instead of the book value) ldquonewrdquo ratios evaluated by Altman It considers implicitly the age of the firm due to its cumulative nature and the use of leverage in the firmrsquos financing of its asset growth 3) The Earnings before interest and taxesTotal assets ratio (X3) is a measure of the true productivity or profitability of the assets of a firm It is not affected by any tax or leverage factors It reflects the earning power of the assets that determines the value of assets In a bankrupt sense insolvency occurs when the total liabilities exceed this fair value 4) The Market value equityBook value of total liabilities ratio (X4) shows how much the assets of a firm can decline in value (measured by market value of equity plus debt) before the liabilities exceed the assets and the firm becomes insolvent This ratio adds a market value dimension to the model The reciprocal of this ratio ndash the familiar DebtEquity ratio ndash is used to measure financial leverage Indeed Altmanrsquos
5
use of the market value of equity was the first study utilizing market measures and was in some ways a predecessor to the so-called structural approach championed by Merton (1974) and commercialized by KMV 5) The SalesTotal Assets ratio is the standard capital-turnover ratio illustrating the sales generating ability of the assets of a firm It refers to the capability of management in dealing with competitive conditions This ratio was dropped in the Zrdquo-Score model Altman evaluated the importance of the five ratios in several ways Firstly he used the F test to evaluate the univariate difference between the average values of the ratios in each group to the variability (or spread) of values of the ratios within each group In this test variables from X1 to X4 were all significant at the 0001 p-level indicating significant difference in the variables between the groups However X5 did not show any significant difference on a univariate basis All five ratios indicated higher values for the non-bankrupt group which is consistent with the positive signs of the discriminant function Secondly Altman determined the relative contribution of each variable to the total discriminating power of the function using the scaled vector In this vector the profitability measure (X3) showed the highest contribution while the SalesTotal assets ratio (X5) gave the second highest contribution although it was insignificant on a univariate basis To explain this Altman found a negative correlation (-078) between X3 and X5 in the bankrupt group Usually negative correlations are more helpful than positive correlations in adding new information to the function Altman explains that this negative correlation will occur when bankrupting firms suffer losses and deteriorate toward failure and their assets are not replaced as much as they were in better times In addition cumulative losses further reduce the asset size through debits to retained earnings Thus the asset size reduction apparently dominates any sales movements 22 Zrsquo-Score and Zrsquorsquo-Score Models for private firms The original Z-Score Model was based on the market value of the firm and was thus applicable only to publicly traded companies Altman (1983 122) emphasized that the Z-Score Model is a publicly traded firm model and ad hoc adjustments are not scientifically valid Therefore Altman (1983) advocated a complete re-estimation of the model substituting the book value of equity for the market value in X4 Using the same data Altman extracted the following revised Zrsquo-Score Model Zrsquo = 0717X1 + 0847X2 + 3107X3 + 0420X4 + 0 998X5 where X1 = Working capitalTotal assets X2 = Retained EarningsTotal assets X3 = Earnings before interest and taxesTotal assets X4 = Book value of equityBook value of total liabilities X5 = SalesTotal assets Zrsquo = Overall Index
Altman did not test the Zrsquo-Score model on a secondary sample due to lack of a private firm data base However he analyzed the accuracy of a four-variable Zrsquorsquo-Score Model excluding the SalesTotal assets ratio X5 from the revised model because of a potential industry effect The industry effect is more likely to take place when this kind of industry-sensitive variable (asset turnover) is included into the model Thus in order to minimize the potential industry effect Altman estimated the following four-variable Zrsquorsquo-Score model (Altman 1983 124)
Zrsquorsquo = 325 + 656X1 + 326X2 + 672X3 + 105X4
6
where X1 = Working capitalTotal assets X2 = Retained EarningsTotal assets X3 = Earnings before interest and taxesTotal assets X4 = Book value of equityBook value of total liabilities Zrsquorsquo = Overall Index
The EBITTotal assets ratio X3 again made the highest contribution to discrimination power in this version of model The classification results for the Zrsquorsquo-Score Model were identical to the revised five-variable (Zrsquo-Score) model In this study our empirical analysis is focused on the performance of the Zrsquorsquo-Score model in bankruptcy prediction
In concluding remarks Altman (1983 125) regarded the general applicability of his Z-Score Model as debatable He admited that the model did not scrutinize very large and very small firms the observation period was quite long (almost two decades) and the analysis included only manufacturing companies Altman concluded as follows ldquoIdeally we would like to develop a bankruptcy predicting model utilizing a homogenous group of bankrupt companies and data as near to the present as possiblerdquo Therefore he advised the analysts interested in practical utilization of the Z-Score Model to be careful This advisement deals with the versions Zrsquo-Score and Zrsquorsquo-Score models of the original Z-Score model as well
3 Literature review of Z-Score Models For the literature review we searched for papers published from the year 2000 on4 in prominent international journals from SciVerse ScienceDirect JSTOR and Springer Link Cambridge Journals and Oxford Journals We selected 34 articles from the below mentioned journals in which the Z-Score was used as a failure prediction proxy or Z-Score methodology was assessed mostly in terms of predictive ability The journals in alphabetical order and one handbook were the following The British Accounting Review (1) Computational Economics (1) Empirical Economics (1) Journal of Accounting Research (2) Journal of Banking and Finance (4) Journal of Business Research (2) Journal of Contemporary Accounting and Economics (1) Journal of Empirical Finance (1) Journal of Finance (4) Journal of Financial Markets (1) Journal of Financial and Quantitative Analysis (2) Journal of Financial Stability (1) Mathematics and Financial Economics (1) Lecture Notes in Computer Science (2) Review of Accounting Studies (3) The Review of Financial Studies (2) Review of Finance (3) Review of Quantitative Finance and Accounting (2) and Handbook of Quantitative Finance and Risk Management (1) The review is presented in Table 1 Out of the 34 studies in 17 cases Altmanrsquos Z-Score Model5 was used as the measure of distress or financial strength (M) in 14 studies Altmanrsquos original model was verified andor modified (V) and in 3 cases it was used for robustness check (R)
(Table 1 here)
The wide usage of the Z-Score Model as a measure of financial distress or financial strength in the economic and financial research points out that it is widely accepted as a venerable simple and consistent measure of the distressed firm at risk In case of the modification of the Z-Score Model
4 Research devoted to the application of Z-Score Model before 2000 was reviewed by Grice andand Ingram
(2001) 5 Most of the models focused on stock exchange listed firms thus Zrsquo-Score Model was not used
7
the most important changes were (1) the use of firmsrsquo up-dated financial data in order to re-estimate coefficients and (2) the use of other estimation techniques in order to improve efficacy in comparison to the original model The use of Altmanrsquos ratios combined with other than MDA modeling techniques has improved the prediction ability Also the application of new data improved model performance in the case of both US and non-US firms In comparison with market-based models or hazard models Altmanrsquos Z-Score Model generally underperformed (4 studies) outperformed (2) or provided similar results In Reisz and Perlich (2007) it was assessed as a better measure for short-term bankruptcy prediction than the market-based models and in Das Hanouna and Sarin (2009) it was shown to perform comparably to the Merton structural market-based approach for CDS spread estimation The question of whether market data is better than acccounting data has been raised many times The same applies to accounting-based models vs market-based models (eg discussion in Bauer and Agarwal 2014) Recall however that the original Z-Score model is not solely an accounting-based approach since the market value of equity is utilized as well Our purpose is not to contribute to this strand of studies and we focus on an accounting-based approach as almost all the estimated models in this study were from privately held firms and by definition there are no market-based data for these firms
4 Research hypotheses
The literature survey shows that the Z-Score Model (publicly traded firms) Zrsquo-Score Model (private firms) and Zrsquorsquo-Score Model (private manufacturing and non-manufacturing firms) have been very widely adapted in different contexts for different purposes For these kinds of widely used studies performance plays the key role In this study we are firstly interested in assessing the performance of the original Zrsquorsquo-Score model in classifying bankrupt and non-bankrupt firms in an international context Mainly our study is focusing on assessing performance in a European context However we also validate the results in a set of non-European countries to get a more global view Secondly we will re-estimate the model using extensive international data and then use the re-estimated Zrsquorsquo-Score Model as a benchmark assessing the effects of different factors on the performance in terms of classification accuracy We will assess the effects of the following five factors on this performance year of bankruptcy size of firms age of firms industry and country of origin In all we shall test a set of hypotheses based on the effects on performance of the model on two different levels Firstly we will test a set hypotheses on a pooled set of all firms and secondly on data from each country individually In comparison to the previous research our contribution consists of the focus on an international context not just the model application or re-estimation for a given country data The hypotheses of the study are as follows
H1 Obsolescence of the coefficients The Zrsquorsquo-Score Model was estimated using the same sample of firms that was used to develop the original Z-Score Model The bankruptcies in the estimation data occurred during the period 1946-1965 Thus the oldest observations are from almost seventy years ago during the post-war period Altman (1983 125) recommended utilizing data as near to the present as possible when developing a bankruptcy prediction model It is obvious that the financial behaviour of firms and their business environment have significantly changed after that potentially making the importance of the financial ratios to differ from their original importance reflected by the coefficients of the model Therefore we suggest as the first hypothesis (H1) that the re-estimation of the coefficients of the four original variables of the Zrsquorsquo-Score model will improve the classification performance of the model in an international context It is supported by the previous research (eg Grice and Ingram 2001) and practice H1 aims to support this evidence on the international level
8
H2 Method of estimation The original Zrsquorsquo-Score Model has been estimated using a MDA suggested by Altman (1983) as the appropriate statistical technique However MDA is based on ordinary least squares method (OLS) and thus requires assumptions of multinormality homoscedasticity and linearity which are not often met in empirical financial ratio analysis Therefore we re-estimate the Zrsquorsquo-Score Model using the logistic regression analysis (LRA) to assess the effect of the method of estimation LRA does not require most of the restricting assumptions of MDA In LRA multivariate normality of the independent variables homoscedasticity and linearity are not required For the sake of OLS MDA can be more useful than LRA for small samples such as the original sample of 66 firms used in the estimation of the Zrsquorsquo-Score Model However in a large sample LRA may potentially perform better In this study we use large samples which is advantageous for LRA Therefore our second hypothesis (H2) suggests that the classification performance of the re-estimated Zrsquorsquo-Score Model will be improved when it is estimated using LRA instead of MDA The model re-estimated for the original variables using LRA and all pooled data is called here the Zrsquorsquo-Score LR-model The performance of this re-estimated model is used in this study as the benchmark for further analyses
H3 Bankruptcy year The model based on the relationship between bankruptcy and financial ratios is likely to be affected by the macro-economic environment These effects may significantly decrease the classification accuracy of the model If the model is estimated using data from one year and it will be applied to data from another year the validity of the model can be questioned Business cycles in terms of economic growth credit policy and interest rates can have an effect on the boundary between bankrupt and non-bankrupt firms The original Zrsquorsquo-Score Model is estimated using data from the period 1946-1965 which includes several business cycles Therefore the model is not focused on any specific stage of cycle and does not explicitly take account of the bankruptcy year Altman (1983 125) suggested gathering data from firms for the last couple of years when developing a prediction model In this study the benchmark Zrsquorsquo-Score LR-model will be estimated for a shorter period than in the original estimation which however covers several recent years on different stages of the business cycle in different countries Therefore the third hypothesis (H3) assumes that the classification accuracy of the benchmark model can be increased by explicitly taking account of the year of bankruptcy in the estimation of the model
H4 Size of the firm The boundary between bankrupt and non-bankrupt firms is different for small and larger firms which decreases the performance of the model estimated for data from one size category and applied for data from another size category For the bankrupt and non-bankrupt firms in the original data for Zrsquorsquo-Score Model estimation the range of asset size was about between 1 ndash 25 million US dollars The data did not include very small and very large firms Altman (1983 125) regarded the suitability of the original Z-Score Model (and in the same way Zrsquorsquo-Score Model) for all firms as debatable because it did not scrutinize very large or very small firms In this study the benchmark Zrsquorsquo-Score LR-model will be estimated for data from many size categories from very small firms to very large firms The fourth hypothesis (H4) assumes that the classification performance of the uniform benchmark LR-model based on the original four financial variables of the Zrsquorsquo-Score Model is increased when the size category of the firm is explicitly taken into account
H5 Age of the firm International insolvency statistics generally shows that bankruptcy risk is a function of the age of the firm Especially very young firms typically show a very high risk The original Zrsquorsquo-Score Model does not take explicitly account of the age However Altman (1983 107) noted that the age of a firm is implicitly considered in the Retained EarningsTotal Assets ratio (X2) that was regarded as a new ratio in bankruptcy prediction context A relatively young firm will probably show a low ratio because it has not has time to build up cumulative profits Thus a young firm is to some degree discriminated against in the model and its likelihood to be classified as
9
bankrupt is relatively higher than that of an older firm For this argument Altman (1987 107) concluded ldquoBut this is precisely the situation in the real worldrdquo The incidence of failure is much higher in the early years of a firm In spite of the fact that the age of the firm in this way is implicitly taken into account in X2 we expect that an explicit consideration of the age will improve the classification accuracy due to controlling for the age factor Therefore the fifth hypothesis (H5) proposes that the performance of the uniform benchmark model based on the original four financial variables of the Zrsquorsquo-Score Model is increased when the age of the firm is explicitly taken into account
H6 Industry of the firm The original Zrsquo-Score Model is estimated only for manufacturing firms Altman (1983 125) stated that ideally we would like to develop a bankruptcy prediction model utilizing a homogenous group of bankrupt firms If we are interested in a particular industry grouping we should gather data from bankrupt and non-bankrupt firms in these groupings Previous studies show that the financial distress analysis is influenced by industry effect (Smith and Liou 2007) Firms in different industries tend to report different levels of the same financial ratios which may have an effect on the boundary between bankrupt and non-bankrupt firms This industry effect may be present in the Zrsquo-Score Model especially due to the SalesTotal Assets ratio (X5) This ratio showed the least significance on a univariate basis but had a very significant contribution to the discriminant power of the multivariate model Altman (1983 108 124) recognized the potential industry effect due to a wide variation among industries in asset turnover and specified the Zrsquorsquo-Score Model without X5 for private non-manufacturing firms However the Zrsquorsquo-Score Model is also estimated using the original sample of manufacturing firms In our analysis the uniform benchmark model based on the original four financial variables of the Zrsquorsquo-Score Model is estimated for a statistical sample representing different industries Therefore the sixth hypothesis (H6) assumes that an explicit consideration of industry will improve the classification accuracy of this benchmark model
H7 Country of origin The original Zrsquorsquo-Score Model has been estimated only for US firms However in previous studies the Zrsquorsquo-Score model has been applied in countries all over the world It can be expected that the international applicability of the model to other countries is affected by country-specific differences Economic environment legislation culture financial markets and accounting practices in a country may affect the financial behaviour of firms and the boundary between bankrupt and non-bankrupt firms These factors may potentially weaken the classification performance of the model in other countries outside the country in which the model is originally estimated (Ooghe and Balcaen 2007) Therefore the seventh hypothesis (H7) assumes that taking account explicitly of the country of origin of a firm will improve the classification accuracy of the benchmark model In our empirical study the country effect will be assessed by including a variable of country risk
5 Empirical data and statistical methods
51 Sample of firms The principal data of this study are extracted from the ORBIS databases of Bureau Van Dijk (BvD) The main data are from ORBIS Europe that is a commercial database which at the moment of sampling contained administrative information on over 50 million European firms However income statement and balance sheet information was available for about 8 million companies More than 99 of the companies covered in this database are private companies from different industries justifying the use of the Zrsquorsquo-Score Model (for private manufacturing and non-manufacturing firms) instead of the original Z-Score Model (for publicly traded manufacturing firms) The ORBIS database
10
organizes the public data from administrative sources and filters them into various standard formats to facilitate searching and company comparisons The ORBIS formats have been derived from the most common formats used for the presentation of business accounts in the world (Ribeiro et al 2010) It is clear that international comparability may be a problem when administrative firm-level data are internationally pooled For administrative data the definition of variables is usually less harmonized This is less of a problem in the ORBIS database because of the common international format of balance sheets For example although some discrepancies in profitloss statements may arise because of differences in fiscal systems across countries balance sheet variables largely adhere to international standards Therefore ORBIS provides us with a useful and extremely large database for our study For statistical sampling several requirements are set for the empirical data Firstly we require that the firm to be selected must be an unlisted industrial (non-financial) company Secondly its owners must have limited liability (whereby partnerships and sole proprietors are left out of the study) Thirdly we set a minimum requirement for the size of the firm Because financial ratios in very small firms are generally too unstable for a failure prediction model these firms are excluded (Balcaen and Ooghe 2006) We require that the Total Assets must have exceeded 100 thousand EUR at least once in the available time series for a firm Fourthly we include in our estimation sample firms from all European countries where the number of failed firms is more than 60 If the number of failed firms for a country is less than 60 the firms from this country are only included in the test sample For other European countries the failed firms are randomly classified into the estimation and test samples so that the number of sample firms are about equal in both samples In all our estimation data include firms from 29 European countries while the number of countries in the test data is 32 Fifthly all failed firms that fulfil the requirements above are included into our samples However if the number of non-failed firms in a country is very high a sample is randomly selected from that country Finally the time span of fiscal years potentially available for this study ranges from 2002 to 2010 Because the last financial statements for failed firms in the database are from a financial period within 2007 and 2010 earlier years are excluded for comparability also for non-failed firms But all qualifying observations for non-failed firms from years 2007 to 2010 are included in the data sets As for failed firms we restrict the analyses to the last financial statements available before failure The four independent variables of the Zrsquorsquo-Score Model were winzorized at 1 and 99 to minimize outliers Our data is not restricted to European countries only The results are estimated and tested also for three non-European countries (United States China and Colombia) to get a more global view of the performance of the Zrsquorsquo-Score Model Therefore a sample of firms from these countries is randomly selected as for the estimation and test data from ORBIS World including middle-size (total assets over 15 Million Euro) and larger firms from all over the world The main principles for selecting these data follow the description outlined above for European firms Table 2 shows the resulting number of non-failed and failed firms in the estimation data and test data by country In all the estimation sample includes data from 2602563 non-failed and 38215 failed firms from 29 European and 3 non-European countries The test sample is slightly larger because it includes data from 32 European and 3 non-European countries From the country of origin of the Zrsquorsquo-Score Model the US the estimation sample only includes 56 bankrupt firms For the US data we made an exception by allowing listed (and delisted) firms to be included as otherwise there would have been no observations for the US in the database From China there are three samples Special Treatment-firms (ST)6 are included in the estimation sample although there are only 32 such firms altogether7 Private and delisted (DL)
6 See Zhang Altman and Yen (2010) for the rationale for using special-treatment firms as a proxy for
bankruptcies These are firms put on probation by the stock exchange for poor operating performance andor negative equity 7This is done because the results about predictability were good also for such a small sample
11
Chinese firms are separately analysed only in the test data8 ST firms are listed firms suffering from serious financial difficulties Delisted firms are firms delisted from the stock enchange (Table 2 here) 52 Status of failed firms ORBIS has five classes for potentially active firms (active default of payment receivership dormant branch) and seven classes for inactive firms which do not carry out business activities anymore (bankruptcy dissolved dissolved (merger) dissolved (demerger) in liquidation branch no precision) From these classes only active is selected to represent non-distressed firms In selecting the failed firms we try to avoid ambiguity as much as possible by considering (with exceptions described below) a firm failed if its status in ORBIS is stated as bankruptcy However because of the small number of bankrupt firms in some countries we also consider receivership (active) firms failed although they are active These firms generally suffer from serious financial distress However liquidation (inactive) firms are not included in the sample of failed firms (with one exception) Firms in liquidation may depending on the country contain firms that have ceased activities due to reasons other than failure (mergers discontinuing the operations of a daughter company or of a foreign branch etc) Therefore for most countries we select only firms that are coded as being bankrupt or under receivership However there are a number of special countries where failed firms are coded under a different status heading These special countries or samples are the following Country Status categories Bulgaria In liquidation Bankruptcy Denmark Inactive (no precision) Greece Active (receivership) In liquidation Bankruptcy Ireland In liquidation Active (receivership) Norway In liquidation Slovenia In liquidation Spain Active (receivership) In liquidation Bankruptcy Ukraine In liquidation Bankruptcy United Kingdom liquidation Inactive (In liquidation) China ST Active (Special Treatment) China delisted Active (delisted) In case no such category for failed firms could be identified that country was excluded from the study (for example Switzerland) If there was only a very small number of failed observations the country was dropped from the study (Luxembourg Liechtenstein Montenegro typically small countries) It should also be noted that the status classes (including the bankruptcy category) are not completely homogenous within European countries due to different legislations although there are obvious similarities in insolvency acts (Philippe et al 2002) China is a special case including samples with three different criteria of failure (bankruptcy Special Treatment delisted) For the UK there are two different samples (liquidation receivership) 53 Statistical methods
8These firms are included only in the test data because the predictability of failure was exceptionally poor
12
In this study seven research hypotheses are drawn for statistical testing The statistical analysis will begin with calculating the original Zrsquorsquo-Score for the firms in the data Following the original model this Zrsquorsquo-Score will be calculated for all sample firms as follows Zrsquorsquo = 325 + 656X1 + 326X2 + 672X3 + 105X4 where X1 = Working capitalTotal assets X2 = Retained EarningsTotal assets X3 = Earnings before interest and taxesTotal assets X4 = Book value of equityBook value of total liabilities
The classification performance of the original model is assessed by the AUC (Area Under Curve) measure extracted from the ROC (Receiver Operating Characteristic) curve ROC curve is a plot of true positive rate against false positive rate for all different possible cut-off-points These profiles show the trade-offs between Type I and Type II errors and represent statistically the cumulative probability distribution of failed events AUC measures the accuracy of the estimated model in relation to the perfect model With a perfect model AUC is 1 and with a random model 05 AUC has a close connection with the Accuracy Ratio (AR) since AR = 2 AUC ndash 1 AR equals 0 for a random model and 05 for a model with an average classification performance In all statistical analyses SAS software is used
The first hypothesis (H1) assumes that the coefficients of the original model are obsolete H1 is tested by re-estimating the coefficients of the Zrsquorsquo-Score Model using the original statistical method (the multiple discriminant analysis or MDA) In MDA the discriminant function is determined by a parametric method (a measure of generalized squared distance) and the distribution of independent variables within both groups is assumed to be multivariate normal The purpose is to estimate the new coefficients for the model to statistically represent the overall sample The problem is that the estimation sample includes different numbers of failed and non-failed firms from 31 countries In the original sample of Altman (1983) an equal number of bankrupt and non-bankrupt firms were selected from one country (US) Following the characteristics of these data we weight the firms so that the weights for the failed and non-failed firms are equal In this way the non-proportional sampling in different countries does not affect the re-estimated model The number of firms from different countries however varies significantly which leads to greater weights for larger countries To avoid this problem the observations are also weighted so that each country has an equal weight in the analysis Then the coefficients of the Zrsquorsquo-Score Model are re-estimated using these weighted data and the resulting AUC is compared with the one based on the original model The second hypothesis (H2) expects that the classification performance of the re-estimated Zrsquorsquo-Score Model improves when it is re-estimated by the logistic regression analysis (LR) that is based on less restrictive statistical assumptions than MDA In this estimation the dependent variable Y = 0 when the firm is non-failed and Y = 1 when it is failed LRA does not require that independent variables are multivariate normal or that groups have equal covariance matrices which are basic assumptions in MDA (Hosmer and Lemeshow 1989) LRA creates a score (logit) L for every firm It is assumed that the independent variables are linearly related to L This score or logit is used to determine the conditional probability of failure as follows
13
)|1( XYp = )( 441101
1
1
1XbXbbL ee
where bi (i =0hellip 4) are the coefficients and Xi (i =1hellip 4) are the four independent variables of the original Zrsquorsquo-Model The effect of the method on classification performance is assessed by testing the statistical significance of the difference between AUCs for this LR model and for the re-estimated MDA model The resulting model is here called the Zrsquorsquo-Score LR-Model and it is used as a benchmark for further statistical AUC comparisons because LR is applied as the principal method in testing of the rest of the research hypotheses
The third hypothesis (H3) is associated with the performance effect of taking account of the bankruptcy year in estimation This hypothesis is tested estimating a LR model based on the following logit
3
1
4
10
jjji
ii DcXbbL
where b0 is a constant Xi (i =1hellip 4) are the four independent variables of the original Zrsquorsquo-Model bi (i =1hellip 4) are their coefficients cj (j =1hellip 3) are coefficients of the dummy variables and
D1 = 1 when year = 2008 0 otherwise
D2 = 1 when year = 2009 0 otherwise
D3 = 1 when year = 2010 0 otherwise
The dummy variables do not directly refer to the bankruptcy year that is not given in the data base but to the last available year For failed firms there is about 1mdash2 years lead time to failure from this year In this model year 2007 is the base category If AUC of this extended LR model statistically significantly exceeds AUC of the Zrsquorsquo-Score LR-Model (benchmark) evidence supports hypothesis H3 The research hypotheses H4-H7 are statistically tested using the same approach as for the third hypothesis above However for each hypothesis appropriate variables are used instead of the year dummies Hypothesis H4 deals with the performance effect of taking account of size and it will be tested using in the LR model two additional variables of size In this LR model size is measured by natural logarithm of total assets and its squared form In this way the effect of logarithmic size can be reflected by a function following the second-order parabola Hypothesis H5 predicts that taking explicitly account of the age of the firm improves classification performance When testing this hypothesis the category 6-12 years is used as the base category and two dummy variables are incorporated in the LR model (D1 0-6 years D2 12- years) Hypothesis H6 is associated with the effect of the explicit consideration of industry on the classification performance It is tested here using dummy variables for seven industries (D1 restaurants and hotels D2 construction D3 whole sale and retailing D4 agriculture D5 manufacturing D6 energy and water production D7 information technology) all other industries acting as the base category Hypothesis H7 predicts that the explicit consideration of the country of origin improves classification performance This hypothesis is tested not using dummy variables for countries but using country risk measures instead The country risk of each country is measured by Standard amp Poorrsquos Country
14
Risk Rating per six months after annual closing of accounts The rating is numerically recoded in the way that the best rating AAA = 1 the second best rating AA+ = 2 and et cetera Finally the lowest rating D = 22 Thus H7 is tested estimating a LR model based on the four financial ratios of the original Zrsquorsquo-Score Model and a 22-step variable referring to country risk The five LR models with the orginal four financial ratios and the additional variables specified in the hypotheses are estimated for all data In addition a LR model including all additional variables is estimated for all data to assess the simultaneous effect of all variables Finally six of the seven hypotheses are tested for the data of each country separately In this country level testing hypothesis H7 is not tested because the additional variable (country risk) is constant within the country
6 Empirical results
61 All data coefficients of the Zrsquorsquo-Score Models
Table 3 presents descriptive statistics of the four independent variables (X1-X4) of the Zrsquorsquo-Score Model for all test data The variation in the ratios is significant as is shown by the standard deviation and the quartiles For X1 (WCTA) X2 (RETA) and X3 (EBITTA) the median and the mean for non-failed firms are close to each other referring to a symmetry of distributions However this is not the case for the failed firms For the faileddistressed firms the median exceeds the mean for these three ratios referring to negatively skewed distributions For X4 (BVETL) the means significantly exceed the median for both failed and non-failed firms indicating a positively skewed distribution For each of the four variables both the mean and the median are higher for non-failed firms than for failed firms which is consistent with the expectations The difference between the means of non-failed and failed firms is larger in the original US data than in our all data for RETA and EBITTA but about the same size for WCTA and BVETL (Altman 1983 123) These characteristics of the data may indicate lower classification accuracy than in the original sample (Table 3 here) Table 4 presents the coefficients of the different models estimated for all data All LRA estimates (Model 2 to Model 9) are statistically significant at 0001 due to their contributions and the large sample size The first column presents the coefficients of the original Zrsquorsquo-Score model Column ldquoModel 1rdquo shows the coefficients when they are re-estimated by the same statistical method or MDA The coefficients are here negative since the models are estimated using Y = 1 for the failed firms In our all data EBITTA has a significantly higher weight than in the original US data while the weights of WCTA and BVETL have proportionally decreased The re-estimated coeffient of BVETD is very small referring to a minor effect on the logit Column ldquoModel 2rdquo presents the coefficients for the Zrsquorsquo-Score LR-Model These coefficients are directly comparable with those of the MDA model which is expected for the sake of the exceptionally large sample The differences in the coefficients of the original four variables between the eight LR models (Models 1-8) are small For each model the coefficient of BVETD is very close to zero This indicates that the original four variables and the additional variables are quite independent of each other (Table 4 here) Table 4 also shows the coefficients of the additional variables beyond the original four in the LR models The negative coefficients of the dummy (year) variables of Model 3 indicate that after 2007 (the base category) this risk of failure has significantly decreased year by year The base year of 2007
15
refers to a failure emerged during 2008-2009 This phenomenon is caused by the global financial crisis The crisis played a significant role in the failure of key businesses and a downturn in economic activity leading to the 2008ndash2012 recession especially in Europe The coefficients of Model 4 for the size variables show that the contribution of size on the logit (risk measure) is at its maximum value when logarithmic total assets is 15 or when total assets is about 33 million Euro Model 5 confirms the riskiness of young firms since the risk to fail is very high for newly founded firms (less than 6 years old) as is shown by the coefficient of the first dummy variable The coefficients of the industry dummies in Model 6 show that construction is an exceptionally risky industry followed by manufacturing For Model 7 the coefficient of the country risk dummy is statistically significant (for the sake of the large sample) but negative and very close to zero Finally the coefficients of all variables in Model 8 are directly comparable with those in Models 3-7 62 All data performance of the Zrsquorsquo-Score Models Table 5 shows the resulted AUCs in the test data for the different ldquoall datardquo models by country Model 1 refers to the original Zrsquorsquo-Score Model The classification performance of the score at the level of all countries is fair since AUC = 0743 refers to AR = 0486 that is about average accuracy (05) However the score gives relatively good results (AUC gt 08) for China (ST firms) Poland Finland Estonia Czech Republic Croatia Bosnia Russia and Sweden Its performance is quite low (AUC lt 07) for Norway Latvia Iceland Ireland and Germany The lower part of the table shows the resulting AUCs for the countries only included in the test data The performance of the score is very low for Chinese private and delisted firms It is also low for the liquidation firms in the United Kingdom Appendix 1 shows the medians of the four ratios (X1 to X4) by status and country Table 6 presents the differences of these medians between the non-failed and failed firms by country In this table also the AUC of the Zrsquorsquo-Score and its correlation to the difference of medians are presented This correlation is high for each financial ratio showing that the effects of the ratios on AUC are well balanced For Chinarsquos ST firms the differences are not exceptionally large except for EBITTA This implies with the exceptionally high AUC that the ST firms systematically differ from the non-ST firms although the differences are not extremely large The differences between the medians are very large in Poland for each ratio justifying high AUC They are also large in Finland and also in Czech Republic where the difference in EBITTA is however average In Germany Latvia China (private and delisted) and UK (liquidation) the differences in all four ratios are below the average which is obviously associated with low AUC In the Chinese delisted firms the differences in RETA and EBITTA are even negative In Iceland and Ireland the differences only in EBITTA are exceptionally small (Table 5 here) (Table 6 here) Model 2 in Table 5 is the re-estimated Zrsquorsquo-Score Model where the coefficients are estimated by MDA for all data Its AUC (0745) is only slightly higher than for the original model (0743) supporting only very weakly if at all H1 (obsolescence of the coefficients) The classification accuracy AR (0490) is about the average level However the re-estimation of the coefficients has led to improved classification accuracy in a number of countries especially in Bosnia China (ST) Norway and Greece However it has impaired classification accuracy in UK and China (delisted) Column ldquoBenchmarkrdquo reports the results for the benchmark model (Zrsquorsquo-Score LR-model) showing the effect of the estimation method For the benchmark model AUC in all data is 0748 that is higher than for Model 1 and 2 The differences between AUCs are very small supporting only weakly H2 (estimation
16
method) The LR-model (benchmark) and the MDA model (Model 2) give almost identical AUCs for each country This result was expected since the coefficients of the models are directly comparable The similar results for the models may also indicate that the independent variables conform to multinormality This last result confirms what most researchers in the field of default classification models have concluded that accuracy levels are extremely similar despite any statistical violations like normality between MDA and logistical regression models Model 3 (LR-model with year dummies) leads in all test data to higher AUC (0752) than the benchmark model supporting H3 (bankruptcy year effect) However the AUC effects are not positive for all countries The effects are positive for example for Russia Estonia Germany Ireland and Latvia but these effects are not statistically significant There are statistically significant negative effects for China (ST) and Serbia There are notable negative effects especially for Bosnia Croatia Hungary Norway and Slovenia These diverse results are due to exceptional annual distributions of failed firms in these countries For the countries with negative effects the percent of failed firms from 2010 (D3 = 1) exceeds 50 while for the countries with positive effects it is only a couple of percent For each group non-failed firms are quite equally distributed over years When the coefficient of D3 is very low (-0666) it strongly decreases the risk estimates of most failed firms in the former countries but only in few failed firms in the latter countries This leads to the observed effects Model 4 (LR-model with size variables) performs better than the benchmark model which gives support to H4 (size effect) It leads to AUC = 0760 referring to AR = 0520 However it leads to significant improvements in AUC for example in China (delisted) and Austria For China (delisted) the increase in AUC is extremely strong There are also improvements in AUC for instance for Estonia Italia Slovakia Spain and UK Model 4 has also led to lower AUCs in few countries but the decrease is not significant Model 4 is based on the four original variables and the size effect following a second-order parabola This kind of size effect is very small for micro firms but increases approaching its maximum value in middle-sized firms The countries with a positive change in AUC have typically data where the percent of failed micro firms (in all failed firms) is relatively low (40-60) while there are a lot of middle-sized failed firms Because the size effect is strongest for middle-sized firms AUC will increase On contrary the countries with a negative change in AUC have data where the percent of failed micro firms is exceptionally high (70-80) Model 5 (LR-model with age category dummies) gives for all test data about the same AUC as the benchmark model (AUC = 0748) Thus empirical evidence does not support H5 (size effect) For each country the effect of the age on AUC is small For Austria the effect is however positive and notable For this country the percent of non-failed young firms (0-6 years) is only about 10 (of non-failed firms) whereas this percent for failed firms is more than 20 (of failed firms) Because Model 5 includes a strong positive age risk effect for young firms (D2) it increases the risk of many failed firms but that of only few nonfailed firms This obviously leads to an improvement in AUC Model 6 (LR-model with industry dummies) outperforms the benchmark model in AUC supporting H6 (industry effect) It gives AUC = 0751 leading to AR = 0502 However its AUC is notably higher than the benchmark AUC only in a couple of countries for example in France Latvia Portugal and Spain Model 6 makes a negative effect on failure risk for example in restaurants and hotels and information technology industries but a positive effect in construction and manufacturing industries For the countries with a positive effect on AUC the percent of nonfailed firms in restaurants and hotels and information technology is high while that of failed firms is low For the risky industries (construction and manufacturing) these distributions are reversed Thus Model 6 gives a positive (negative) risk effect for many failed (nonfailed) firms and a negative (positive) risk effect only for few
17
failed (nonfailed) firms Therefore AUC will be increased This situation is reversed for the countries with a negative effect on AUC (Austria and Slovenia) The samples of these countries include a high percent of nonfailed firms in the manufacturing industry leading to a decrease in AUC Model 7 (LR-model with country risk measure) leads to a marginally higher classification performance (AUC = 0749) than the benchmark model This result gives only very weak support for H7 (country of origin effect) However for each country the resulted AUC is almost identical with that given by the benchmark model This result was expected due to the neglible coefficient (-0003) of the country risk measure (SP Country rating rank) in Model 7 This result implies that country risk does not make any effect on the boundary between bankrupt and non-bankrupt firms Model 8 (LR-model with all variables) includes the four financial ratios and all additional variables It leads in all test data to a sizeable increase in AUC (AUC = 0771) in comparison to the benchmark AUC However the effect on AUCs largely varies and is either negative or positive in different countries The effect is large in several countries for example in Estonia France Iceland Italy Latvia and China (delisted) However it also makes a negative effect on AUC in several countries such as Bosnia Hungary and Norway These results show that the inclusion of additional variables into the original model will usually increase AUC but not in every country The ldquoall datardquo benchmark performs fairly well also for the US and the Colombian samples (the US firms being unlike the other firms in this study listed or delisted companies) The poor performance of Chinese private and delisted firms is associated with very small differences between the medians of the non-failed and failed groups as is shown in Table 6 It is clear that the status ldquodelistedrdquo is not comparable with ldquobankruptcyrdquo When the status is defined as ldquoSTrdquo the predictability of Chinese listed firms is very high Prior studies based on Chinese ST-firms have also demonstrated good predictability (Zhang et al 2010 Wang and Campbell 2010) see footnote 6 earlier Nevertheless this puzzle calls for additional research and modeling work regarding unlisted and delisted Chinese firms 63 Country-level data performance of the Zrsquorsquo-Score Models The heterogeneity of the firms and their distributions in ldquoall datardquo makes it difficult for a uniform all data model to increase AUCs in different countries Table 7 presents the test data AUCs for the different models estimated for each country separately (country-level models) In this table the ldquoall datardquo Zrsquorsquo-Score LR-model acts as the benchmark When the models are estimated from the country data this benchmark will be clearly outperformed by the resulting MDA (Model 1) and LR models (Model 2) only in a couple of countries (Bulgaria France Latvia Spain and Sweden) These results give however only weak support for H1 (obsolescence of the coefficients) at the country level because the effects are not significant In addition the benchmark leads to higher AUCs than Models 1 and 2 at least in Austria Bosnia Ireland Slovenia and United States The differences in AUCs given by Models 1 and 2 are generally small In Romania only Model 1 is clearly outperformed by Model 2 Thus country-level evidence does not support H2 (estimation method) Model 3 (LR-model with year dummies) leads in most countries to clearly higher AUC than the benchmark model This evidence gives support to H3 (bankruptcy year effect) Model 3 leads to lower AUC than the benchmark model in Austria Bosnia Slovenia and United States Model 4 (LR-model
18
with size variables) leads to improved performance almost in every country supporting H4 This improvement is significant however only in the United States where AUC is now 0816 when it is only 0710 for the benchmark model It is notable also in Bulgaria France Latvia Spain and United Kingdom Model 5 (LR-model with age category dummies) gives in several countries higher AUCs than the benchmark model but none of the improvements are significant The positive effect is strong especially in Bulgaria France and Iceland Although there are also negative effects on AUC this evidence weakly supports H5 (age effect) since these negative effects are relatively small Model 6 (LR-model with industry dummies) shows both negative and positive effects on AUCs when compared with the benchmark The only significant effect however is the negative effect found in Austria In Bulgaria and Slovenia AUC has also notably decreased due to the industry dummies However there are notable positive effects on AUC for example in France Iceland Latvia and Sweden Thus the effect is not systematic and gives only weak support to H6 (industry effect) Model 7 (LR-model with all variables) leads to a remarkable increase in AUC as compared with the benchmark model in Colombia Iceland and Unites States It also leads to notable improvements in AUC at least in Belgium Denmark Estonia France Germany Hungary Latvia Norway Spain and United Kingdom There are found negative effects on AUC only in Austria and Slovenia Thus as a conclusion we can state that the classification performance of ldquoall testrdquo data Zrsquorsquo-Score Model can in general remarkably increase in most countries when different effects are taken into account by additional variables This increase is found in most European countries and also in Colombia and United States In China the AUC for the ST sample is extremely high for the Zrsquorsquo-Score LR-model and it can only slightly be improved by additional variables (Table 7 here)
7 Summary of the study and a Suggested Extension
The purpose of this study was to assess the classification performance of the Zrsquorsquo-Score Model originally introduced by Altman (1983) This model was originally applied for small and middle-sized US manufacturing bankrupt and non-bankrupt firms but is applied widely all over the world in different industries and for different size categories for different purposes It is a modified version of the Z-Score Model (1968) developed for listed manufacturing firms The Zrsquorsquo-Score Model is modified to apply for private and non-manufacturing firms as well as manufacturers The literature review section summarizes recent articles in prominent academic journals that have utilized Altmanrsquos Z-Score or Zrsquorsquo-Score models or re-estimated versions of them in empirical analyses These models are typically used as benchmarks in failure prediction modeling studies where one or several alternative methods or approaches (hazard models contingent-claims intelligent algorithms etc) have been tested However in a considerable number of the reviewed studies failure prediction is not the primary focus Instead these models have been largely used as measures of financial strength As to the failure prediction studies the results have been somewhat uneven so that in some studies the models have performed well whereas in others they have been outperformed by competing models None of the reviewed studies were based on comprehensive international comparisons which makes the results difficult to generalize
19
In this study the classification performance of the Zrsquorsquo-Score model is assessed using very large data sets in an international context The purpose is to test how the original version of the Zrsquorsquo-Score Model performs in different countries and how re-estimation using another statistical method and different additional variables affect the classification performance when the data are very heterogeneous For this kind of testing in an international context seven research hypotheses on classification performance are extracted These research hypotheses are tested for all data and also separately for country data (country-level analysis) The hypotheses are associated with the following effects on the classification performance of the Zrsquorsquo-Score Model 1) re-estimation of coefficients 2) estimation method 3) year 4) size 5) age 6) industry and 7) country The estimation data are from 29 countries and the results are validated for 32 countries The countries are mainly from Europe but also three non-European countries are included (China Colombia and United States) The status used in the classification is mainly bankruptcyactive firms but also receivership firms are considered failed In Chinese data also ST (special treatment) and delisted firms are separately analysed as failed firms The analyses at the level of all data show that the original Zrsquorsquo-Score model performs very satisfactorily in an international context The effects of the four financial ratios on performance are well balanced although Book Value of Equity Total Liabilities (BVETD) showed a very small contribution in re-estimation The original model performs very well in several countries such as Poland Finland and China (ST firms) The re-estimation of the coefficients using MDA only marginally improved classification performance supporting weakly the obsolescence hypothesis (H1) or to put it differently shows that the original coefficients are extremely robust across countries and over time This same conclusion holds for the re-estimation of the model using LRA since the performance results are very similar as for MDA (H2) The use of additional variables in the model generally improved classification accuracy of the original model but the results for countries are dependent on the distribution of failed and nonfailed firms When the coefficients are estimated for all data the effects on performance in a country depend on how the distributions in that country correspond to the distributions in all data For all sets of additional variables performance is generally improved but the improvement is not strong and the effects vary country by country Thus evidence gives weak support to effects of all additional variables For the effects of bankruptcy year (H3) and size (H4) the effects are stronger but also the variations in the effects between countries are stronger The effects of age (H5) industry (H6) and country (H7) are marginal When all additional variables are included in the same model performance generally significantly increases but at the same time variations between countries become stronger In summary our evidence thus indicates that the original Zrsquorsquo-Score Model performs well in an international context It is however possible to extract a more efficient country model for most European countries and also for non-European countries using the four original variables accompanied with a set of additional background variables Considering practical applications it is obvious that while a general international model works reasonably well for most countries the classification accuracy may be somewhat improved with country-specific estimation In a country model the information provided even by simple additional variables may help boost the classification accuracy to a much higher level In finance and accounting research failure prediction models may be utilized as risk measures in many different contexts as was revealed by the literature review section Where failure prediction modeling is not the primary focus it would be time-consuming uneconomical and superfluous to first estimate a failure prediction model (or models) and only then proceed to study the phenomenon of interest In these kinds of instances a well tested general model that works reliably
20
and consistently across different countries is highly desirable Based on our empirical tests in this study the original Zrsquorsquo-Score Model and its re-estimated version containing the four Altman (1983) study variables with coefficients re-estimated using a large European data set work consistently well internationally and are easy to implement and interpret An extension to our work could include a comprehensive and more complete analysis of the Altman-Rijken (2011) thesis that a countryrsquos risk of default on its sovereign debt can be assessed by an analysis of the default probabilities of its private sector Our database permits extension of default estimates to non-publicly held firms by far the dominant population in most countries of the world and our analysis can include small and medium size firms as well as larger corporate entities
21
References
Acosta-Gonzaacutelez E Fernaacutendez-Rodriacuteguez F (2014) Forecasting financial failure of firms via genetic algorithms Computational Economics vol 43 p 133ndash157
Agarwal V Taffler R (2008) Comparing the performance of market-based and accounting-based bankruptcy prediction models Journal of Banking and Finance vol 32 p 1541ndash1551
Aktas N de Bodt E Lobez F Statnik J-C (2012) The information content of trade credit Journal of Banking and Finance vol 36 p 1402ndash1413
Allayannis G Brown GW Klapper LF (2003) Capital structure and financial risk Evidence from foreign debt use in East Asia The Journal of Finance vol 58 no 6 p 2667ndash2709
Altman EI (1968) Financial ratios discriminant analysis and the prediction of corporate bankruptcy The Journal of Finance vol 23 no 4 p 589ndash609
Altman EI (1983) Corporate Financial Distress A Complete Guide to Predicting Avoiding and
Dealing with Bankruptcy (Wiley Interscience John Wiley and Sons) also see E Altman amp E Hotchkiss
Corporate Financial Distress amp Bankruptcy 3rd edition John Wiley 2006
Altman EI Saunders A (1998) Credit risk measurement Developments over the last 20 years Journal of Banking and Finance vol 21 p 1721ndash1742
Altman EI Rijken H (2011) Toward a Bottom-Up Approach for Assessing Sovereign Default Risk Journal of Applied Corporate Finance vol 23 no 1 pp 20-31
Balcaen S Ooghe H (2006) 35 years of studies on business failure an overview of the classic statistical methodologies and their related problems The British Accounting Review vol 38 p 63ndash93
Bauer J Agarwal V (2014) Are hazard models superior to traditional bankruptcy prediction approaches A comprehensive test Journal of Banking and Finance vol 40 p 432ndash442
Beaver WH (1966) Financial ratios as predictors of failure Journal of Accounting Research vol 4 p 71ndash111
Beaver WH (1968) Alternative accounting measures as predictors of failure The Accounting Review vol 43 no 1 p 113ndash122
Begley J Ming J Watts S (1996) Bankruptcy classification errors in the 1980s An empirical analysis of Altmanrsquos and Ohlsonrsquos models Review of Accounting Studies vol 1 p 267ndash284
Bharath ST Shumway T (2008) Forecasting default with the Merton distance to default model Review of Financial Studies 21(3) 1339-1369
Butler AW Wan H (2010) Stock market liquidity and the long-run stock performance of debt issuers The Review of Financial Studies vol 23 no 11 p 3966ndash3995
Campbell J Hilscher J Szilagyi J 2008 In search of distress risk Journal of Finance 63 2899ndash2939 Carling K Jacobson T Lindeacute J Roszbach K (2007) Corporate credit risk modeling and the macroeconomy Journal of Banking and Finance vol 31 p 845ndash868
Chava S Jarrow RA (2004) Bankruptcy prediction with industry effects Review of Finance vol 8 p 537ndash569
Chen H Kacperczyk M Ortiz-Molina H (2012) Do nonfinancial stakeholders affect the pricing of risky debt Evidence from unionized workers Review of Finance vol 16 p 347ndash383
22
Clarke J Ferris SP Jayaraman N Lee J (2006) Are analyst recommendations biased Evidence from corporate bankruptcies Journal of Financial and Quantitative Analysis vol 41 no 1 p169ndash196
Clayton MJ Ravid SA (2002) The effect of leverage on bidding behavior Theory and evidence from the FCC auctions The Review of Financial Studies vol 15 no3 p 723ndash750
Das S Hanouna P Sarin A (2009) Accounting-Based versus Market-Based cross-sectional models for CDS spreads Journal of Banking amp Finance vol 33 pp 719-730
Dawkins MC Bhattacharya N Smith Bamber L (2007) Systematic share price fluctuations after bankruptcy filings and the investors who drive them Journal of Financial and Quantitative Analysis vol 42 no 2 p399ndash419
DeLong ER DeLong DM Clarke-Pearson DL (1988) Comparing the areas under two or more correlated receiver operating characteristic curves A nonparametric approach Biometrics 44(3) 837-845
Dichev I (1998) Is the Risk of Bankruptcy a Systematic Risk Journal of Finance vol 53 p 1131-1147
Dimitras AI Zanakis SH Zopounidis C (1996) Theory and methodology A survey of business failures with an emphasis on prediction methods and industrial applications European Journal of Operational Research vol 90 p 487ndash513
Eisdorfer A (2008) Empirical evidence of risk shifting in financially distressed firms The Journal of Finance vol 63 no 2 p 609ndash637
Fich EM Slezak SL (2008) Can corporate governance save distressed firms from bankruptcy An empirical analysis Review of Quantitative Finance and Accounting vol 30 p 225ndash251
Franzen LA Rodgers KJ Simin TT (2007) Measuring distress risk The effect of RandD intensity The Journal of Finance vol 62 no 6 p 2931ndash2967
Grice JS Dugan MT (2001) The limitations of bankruptcy prediction models Some cautions for the researcher Review of Quantitative Finance and Accounting vol 17 p 151ndash166
Grice JS Jr Dugan MT (2003) Re-estimations of the Zmijewski and Ohlson bankruptcy prediction models Advances in Accounting vol 20 p 77ndash93
Grice JS Ingram RW (2001) Tests of the generalizability of Altmanrsquos bankruptcy prediction model Journal of Business Research vol 54 p 53ndash61
Griffin JM Lemmon ML (2002) Book-to-market equity distress risk and stock returns The Journal of Finance vol 57 no 5 p 2317ndash2336
Hillegeist SA Keating EK Cram DP Lundstedt KG (2004) Assessing the probability of bankruptcy Review of Accounting Studies vol 9 p 5ndash34
Hirsch B T and Macpherson D A (2003) Union membership and coverage database from the Current Population Survey Note Industrial and Labor Relations Review 56 349ndash354
Ho C-Y McCarthy P Yang Y Ye X (2013) Bankruptcy in the pulp and paper industry marketrsquos reaction and prediction Empirical Economics vol 45 p 1205ndash1232
Holder-Webb LM Wilkins MS (2000) The incremental information content of SAS No 59 Going-concern opinions Journal of Accounting Research vol 38 no 1 p 209ndash219
Hosmer D Lemeshow S (1989) Applied Logistic Regression (Wiley Interscience Prentice Hall International)
Jackson RHG Wood A (2013) The performance of insolvency prediction and credit risk models in the UK A comparative study The British Accounting Review vol 45 p 183ndash202
23
Karels G Prakash AJ (1987) Multivariate normality and forecasting of business bankruptcy Journal of Business Finance and Accounting 14(4) 573-593
Kieschnick R La Plante M Moussawi R (2013) Working capital management and shareholdersrsquo wealth Review of Finance vol 17 p 1827ndash1852
Kumar PR Ravi V (2007) Bankruptcy prediction in banks and firms via statistical and intelligent techniques ndash A review European Journal of Operational Research vol 180 p 1ndash28
Kwak W Shi Y Cheh JJ Lee H (2005) Multiple criteria linear programming data mining approach An application for bankruptcy prediction Data Mining and Knowledge Management Lecture Notes in Computer Science vol 3327 p 164ndash173
Li M-YL Miu P (2010) A hybrid bankruptcy prediction model with dynamic loadings on accounting-ratio-based and market-based information A binary quantile regression approach Journal of Empirical Finance vol 17 p 818ndash833
Lyandres E Zhdanov A (2013) Investment opportunities and bankruptcy prediction Journal of Financial Markets vol 16 p 439ndash476
Merkevicius E Garšva G Girdzijauskas S (2006) A hybrid SOM-Altman model for bankruptcy prediction International Conference on Computational Science Lecture Notes in Computer Science vol 3994 p 364ndash371
Ohlson J (1980) Financial ratios and probabilistic prediction of bankruptcy Journal of Accounting Research vol 18 p 109-131
Ooghe H Balcaen S (2007) Are failure prediction models widely usable An empirical study using a Belgian dataset Multinational Finance Journal 11(12) 33-76
Philippe and Partners and Deloitte and Touche Corporate Finance (2002) Bankruptcy and a Fresh Start Stigma on Failure and Legal Consequences of Bankruptcy (International Insolvency Institute Brussels Belgium)
Philosophov LV Batten JA Philosophov VL (2008) Predicting the event and time horizon of bankruptcy using financial ratios and the maturity schedule of long-term debt Mathematics and Financial Economics vol 1 p 181ndash212
Pindado J Rodrigues L de la Torre C (2008) Estimating financial distress likelihood Journal of Business Research vol 61 p 995ndash1003
Piotroski JD (2000) Value investing The use of historical financial statement information to separate winners from losers Journal of Accounting Research vol 38 Supplement Studies on accounting information and the economics of the firm p 1ndash41
Reisz AS Perlich C (2007) A market-based framework for bankruptcy prediction Journal of Financial Stability vol 3 p 85ndash131
Shen C-H Chen Y-K Huang B-Y (2010) The prediction of default with outliers Robust logistic regression Handbook of Quantitative Finance and Risk Management p 965ndash977
Shumway T (2001) Forecasting bankruptcy more accurately A simple hazard model Journal of Business vol 74 p 101-124 Singhal R Zhu Y (2013) Bankruptcy risk costs and corporate diversification Journal of Banking and Finance vol 37 p 1475ndash1489
Smith M Liou D-K (2007) Industrial sector and financial distress Managerial Auditing Journal vol 22 Issue 4 p 376 - 391
24
Sun L (2007) A re-evaluation of auditorsrsquo opinions versus statistical models in bankruptcy prediction Review of Quantitative Finance and Accounting vol 28 p 55ndash78
Taffler RJ (1984) Empirical models for the monitoring of UK corporations Journal of Banking and Finance vol 8 Issue 2 p 199-227
Uhde A Heimeshoff U (2009) Consolidation in banking and financial stability in Europe Empirical evidence Journal of Banking and Finance vol 33 p 1299ndash1311 Vassalou M Xing Y (2004) Default Risk in Equity Returns Journal of Finance vol 59 p 831-868
Wang Y and Campbell M (2010) Business failure prediction for publicly listed companies in China Journal of Business and Management 16(1) 75-88
Wu Y Gaunt C Gray S (2010) A comparison of alternative bankruptcy prediction models Journal of Contemporary Accounting and Economics vol 6 p 34ndash45
Xu M Zhang C (2009) Bankruptcy prediction the case of Japanese listed companies Review of Accounting Studies vol 14 p 534ndash558
Zhang L Altman EI and Yen J (2010) Corporate financial distress diagnosis model and application in credit rating for listing firms in China Frontiers of Computer Science in China 4(2) 220-236
Zmijewski ME (1984) Methodological Issues Related to the Estimation of Financial Distress Prediction Models Journal of Accounting Research vol 22 Studies on Current Econometric Issues in Accounting Research p 59-82
25
Tables Table 1 Summary of the literature review of Z-Score Models from year 2000
Authors and year of publication
Period and population or sample Goal methodology and z-score application
Main conclusions
Holder-Webb LM Wilkins MS (2000)
217 firms filing for bankruptcy identified by NAARS or Wall Street Journal between 1975-1996
(M) Evaluation of the impact of implementation of auditing standard on going concern on information value for investors (bankruptcy surprise and audit opinion were assessed by investorsrsquo reactions to bankruptcy news in the event window) Authors implemented BKPRO variable based on z-score in the model as a ratio-based measure of financial distress
Bankruptcy surprise was greater in case of a clean going concern opinion The results hold after controlling for eg firmrsquos level of financial distress
Piotroski JD (2000) 14043 firms with high book-to-market (BM) values across 21 years (1976 -1996) in Compustat database
(M) The application of a simple accounting-based fundamental analysis strategy as a tool for broad portfolio management of high BM firms The author used z-score as financial distress measure in order to justify his own model
The author concluded that firms with lower level of financial distress earned significantly stronger future returns than the highly distressed firms Mean return for the investor involved in the high BM assets could be increased by selection of firms that are financially strong
Grice JS Ingram RW (2001)
972 companies for 1985ndash1987 in the estimation sample (148 distressed and 824 non-distressed) and 1002 companies for 1988ndash1991 in the prediction sample (148 distressed and 854 non-distressed) in Compustat database
(V) Verification of z-score model with 3 questions Is the model as useful as in the previous periods Is the model useful for predicting bankruptcy of non-manufacturing firms as it was for manufacturing firms Is the model useful for predicting financial stress other than bankruptcy
Prediction accuracy of the model declined over time and coefficients of the model significantly changed which means that the relation between financial ratios and financial distress has changed over time Model was sensitive to industry classification (better for manufacturing firms) and not sensitive to the type of financial distress Similar conclusions were drawn in case of Ohlsonrsquos (1980) and Zmijewskirsquos (1984)
26
model by Grice JS Dugan MT (2001)
Clayton MJ Ravid SA (2002)
Federal Communication Commission (FCC) spectrum auctions for 1994-1995 together with firm-specific and region-specific variables
(M) The authors examined the link between capital structure of firms and their bidding behaviour The authors used z-score as a proxy for financial strength and alternative measure of default risk
Empirical analysis showed that as the firmrsquos and the competitorrsquos debt level increase firms tend to submit lower bids which supported authors theoretical model
Griffin JM Lemmon ML (2002)
Sample similar to Fama and French (1992) Non-financial NYSE Nasdaq Amex stocks monthly returns for stocks with nonnegative book value of equity from July 1965 to June 1996
(R) The authors investigated relationship between book-to-market equity distress risk and stock returns They used Ohlsonrsquos o-score but additionally run robustness check with the use of z-score as measure of distress risk
In case of firms with the highest risk of distress the difference in return between high and low book-to-market equity securities was more than twice higher than in case of other groups
Allayannis G et al(2003)
SBC Warburg Dillon Read database with local foreign and synthetic local (hedged foreign) currency debt for 327 largest East Asian non-financial companies from 1996-1998
(M) The first research issue was to check determinants of firmrsquos choice of debt currency local foreign or synthetic local The second research issue was related to the relation of the type of debt and financial performance during the Asian crisis Asian financial crisis was treated as natural experiment They used modified z-score (2000) as one of the financial performance measures
The authors found no evidence that unhedged foreign debt was the cause of poor performance However the use of synthetic currency caused poor stock market performance because of the derivatives market illiquidity during the crisis
Hillegeist SA et al (2004)
Sample covered 78100 firm-year observations (representing 14303 individual industrial firms) for 1980-2000 period with 756 initial bankruptcies
(V) The authors confronted Altmanrsquos z-score and Ohlsonrsquos o-score (with original and up-dated coefficients) with the model based on BSM option pricing model (BSM-Prob) They used relative information content tests to compare the out-of-sample performance
BSM-Prob outperformed accounting based models Conclusions were robust to various modifications of both accounting based models BSM-Prob was not dependent on time horizon and difference in accounting standards in various countries Thus it allowed for international comparisons
Chava S Jarrow RA (2004)
US publicly listed companiesrsquo monthly and yearly data for 1962-1999 period with 1461 bankruptcies
(V) The authors employed extended bankruptcy database to prove the superiority of Shumwayrsquos model (2001) over Altmanrsquos (1968) and Zmijewskirsquos
In case of Shumwayrsquos model 744 (in the first decile) of the bankruptcies were correctly identified for Altmanrsquos model ndash it was 632 and for Zmijewskirsquos model - 432
27
(1984) models Three other goals were included into their research The authors re-estimated models over the 1962ndash1990 period and forecasted bankruptcies over 1991ndash1999
Market-based model outperformed also in case of ROC curve Market variables were better in predicting bankruptcy than accounting variables and the use of monthly data improved prediction
Kwak etal (2005) Data from 1992 to 1998 for bankrupt firms and 584 times more of control firms for the same period Standard and Poorrsquos database was used for US companies from major 3 stock exchanges
(V) Multiple Criteria Linear Programming (MCLP) was used to model 5 Altmanrsquos and 9 Ohlsonrsquos variables in order to apply it for bankruptcy prediction
In case of both models overall predication rate of Ohlsonrsquos model is similar to Altmanrsquos model (8676 vs 8856) with more control firms The MCLP approach performed better than Altmanrsquos model and give similar or better results than Ohlsonrsquos model
Merkevicius E et al (2006)
Data from two sources EDGAR PRO Online Database (ldquotraindatardquo with 1108 records) and database form Lithuanian bank (ldquotestdatardquo with 742 records) for year 2004
(V) The hybrid model was developed with the use of Altmanrsquos z-score model with the changed weights for variables and self-organizing map which was an unsupervised learning artificial neural network (called SOM-Altman model)
Hybrid SOM-Altmanrsquos model reached the prediction rate of 9235 It is easy to adopt for different data sets also from developed and developing countries
Clarke J et al (2006) The initial sample of 995 firms that filed for bankruptcy from 1995 to 2011 Analysts recommendations were taken from IBES database In the final sample the authors used 289 bankrupt firms and their non-bankrupt matches
(M) The research focus was to test if there is a bias in analystsrsquo recommendations for firms that filed for bankruptcy (chapter 11) Altmanrsquos z-score was calculated two years preceding the bankruptcy year
Analysts actively revised their recommendations downward in case of firms that faced bankruptcy The recommendation declined from ldquobuyrdquo about 2 years prior to bankruptcy The authors found no evidence of analystsrsquo bias and conflict of interest
Reisz AS Perlich C (2007)
The authors used 5784 industrial firms for 1988-2002 which gave 33238 non-bankrupt and 799 bankrupt firm-years
(V) The authors used barrier option model for bankruptcy prediction (DOC) and compared its discriminatory power with other market-based (BSM and KMV) and accounting-based models (Altmanrsquos z-score and zrdquo-score developed in 1993 for private firms)
The authors proved domination of Altmanrsquos z-score and zrdquo-score for short term bankruptcy prediction For medium- and long-term bankruptcy prediction DOC outperformed other models
28
Sun L (2007) US public traded firms on the major stock exchanges from 1991 to 2002 The final bankruptcy training sample consists in 344 firms (1657 firm-years) and the final non-bankruptcy training sample ndash 3183 (20918 firm-years) The test samples used respectively 243 and 1165 firms
(M) The main purpose of the research was to compare the performance of auditorsrsquo going concern opinions with the results of bankruptcy prediction models The author improved previous research by using a composite score of financial distress stock-market variables industry failure rate and applying hazard model Altmanrsquos z-score was one of the 4 criteria (besides auditorrsquos opinion Zmijewskirsquos probability and stock return) used as a ldquostressrdquo variable In the final model the author used Zmijewskirsquos probability as the best
The hazard model outperformed auditorrsquos going concern opinions so statistical models could be of any help for auditorsrsquo opinions Market variables had significant explanatory power for auditorrsquos opinion while industry failure rate did not have it Auditorsrsquo going concern opinions had incremental prediction ability beyond traditional financial ratios a composite measure of financial distress market variables and industry failure rate
Franzen LA et al (2007)
US firms listed on the major stock exchanges for the period 1981-2004 with sufficient data to compute accounting-based measures of financial distress RampD intensity and portfolio returns The number of firms filing for bankruptcy was 929
(M) The authors focused on the impact of RampD spending on financial distress prediction They used accounting based models with the special focus on Ohlsonrsquos o-score since it included only accounting based measures Altmanrsquos z-score was used for supporting purposes since it included also market data
Accounting-based measures less accurately classify firms with higher RampD spending In case of adjustment for conservative accounting treatment of RampD and tax effects the classification was better Z-score was used as a benchmark Z-score was more robust to the changes that distort the o-score due to the use of market value Adjustment of z-score for the conservative treatment of RampD improved the classification
Dawkins MC etal (2007)
272 US firms that filed for bankruptcy between 1993 and 2003 traded on the major stock exchanges Investorsrsquo intraday transactions were taken from Trade and Quote database (TAQ)
(M) The authors investigated pattern of returns and investors trades around and shortly after Chapter 11 bankruptcy announcement They divided the investigated period into bull and bear markets The authors used five event windows Altmanrsquos z-score was used as a measure of firmrsquos financial condition
Large traders were dominating transactions around and after bankruptcy filing The authors found a modest negative correlation between the price plunge and post-filing period returns Investorsrsquo reactions were anomalously optimistic in the period of a bull market
29
Agarwal V and Taffler R (2008)
Non-finance UK firms listed on the LSE at any time during the period 1985-2001 The final sample covered 2006 firms (15384 firm-years) and 103 failures
(V) In the paper the authors compared accounting-based models and market based models in terms of predictive ability information content and bank credit portfolio profitability Accounting- based models were represented by Tafflerrsquos (1984) UK z-score based on Altmanrsquos (1968)
In the case of the predictive ability there was a little difference between those two types of models however both carried unique information about firm failure The use of the z-score model generated much higher risk-adjusted return profit and return on risk-weighted assets
Philosophov LV et al (2008)
No sample of non-bankrupt firms 100 US non-financial firms that filed for bankruptcy between 1997 and 2002
(V) The authors appliedmulti-alternative decision rules for bankruptcy prediction (BMP) Bayesian-type forecasting rules used debt repayment schedule and traditional financial ratios Results of the new approach were compared with Altmanrsquos z-score
The authors have identified 4 factors important for multiperiod approach Two of them reflect quantity and quality of debt and the two others the ability to pay the debt back Those factors are similar to as those proposed in the z-score The set of factors did not change however the predictive ability decreased over time BPM outperformed z-score in total probability of correct predictions while ldquofalse alarmrdquo was comparable
Fich EM Slezak SL (2008)
The sample includes 781 companies with 34 that filed for bankruptcy The period covers 1992-2000 Except the availability of financial and market data the availability of corporate governance data from Edgar data retrieval system was a prerequisite
(M) The authors explored how governance characteristics affect firmrsquos ability to avoid bankruptcy and power of accountingfinancial information to predict bankruptcy with the use of hazard models Altmanrsquos z-score was applied as a measure of firmrsquos financial distress together with interest coverage ratio (ICR)
Corporate governance characteristics are important for bankruptcy prediction About 25-30 of the variation in the occurrence of bankruptcy was explained by governance characteristics Smaller and independent boards with a higher ratio of non-inside directors and with larger ownership stakes of inside directors are more effective at avoiding bankruptcy if the firm became distressed
Eisdorfer A (2008) US companies traded on the major stock exchanges for period from 1963 to 2002 representing 7114 firms (52112 firm-years)
(M) The author tested two hypotheses volatility has a positive effect on distressed firmsrsquo investment and investments of these firms generate less
In case of first hypothesis z-score results were stronger than those based on KMV but in case of the second hypothesis KMV results were stronger Empirical tests indicated that
30
value during high uncertainty periods with the use of real option approach Altmanrsquos z-score and KMV model were used as a measure of firmrsquos financial distress
risk-shifting considerations are taken into account by distressed firms
Pindado J et al (2008)
Sample covered 1583 US companies (15702 observations) and 2250 companies (18160 observations) for the other G-7 countries for the period from 1990 to 2002 from Compustat The data panel was unbalanced
(R)The authorsrsquo developed ex-ante model for estimation of financial distress likehood (FDL) and presented financially (not legally) based definition of distress Re-estimated Altmanrsquos z-score was used for robustness check
The model is stable in terms of magnitude sign and significance of the coefficients and it provides a measure of FDL more robust to time and countries than other models In case of the re-estimated z-score model only profitability and retained earnings maintained their significance for different years and countries
Xu M Zhang C (2009)
Non-financial Japanese listed companies from 1992 to 2005 The number of firms was 3510 with 76 bankruptcies
(V) The authors applied Altmanrsquos z-score Ohlsonrsquos o-score and Mertonrsquos distance-to-default (d-score) to Japanese firms in order to check if the models are useful for bankruptcy prediction in Japan They also ldquomergedrdquo the models into c-score They introduced Japan-unique variables in order to check if corporate structure variables have impact on the probability of bankruptcy (x-score)
The models were also useful for Japanese firms in bankruptcy prediction but the market-based model was more successful The developed c-score and x-score models improved bankruptcy prediction
Li M-YL Miu P (2010)
Non-financial firms from Compustat database from 2nd Quarter 1996 to 4th Quarter 2006 The sample covered 73 failed firms and 138 non-failed firms with at least rating B during the whole period
(M) Altmanrsquos z-score and Mertonrsquos distance-to-default (DD) were used as variables in the model The authors developed hybrid bankruptcy prediction model with constant and dynamic loadings with the use of binary quintile regression (BQR)
The results of the research pointed out the superiority of the model with dynamic loadings In the case of firms with relatively poor credit quality the prediction accuracy might be improved by putting more attention to DD and less to the z-score In case of firms with relatively good credit quality the recommendations are the opposite eg more attention should be put to the z-score
31
Wu Y et al (2010) NYSE- and AMEX-listed Compustat non-financial firms for the period from 1980 to 2006 The final sample covered 50611 firm-years with 887 bankruptcies and 49724 non-bankrupt firm-years
(V) Five models (Altman 1968 Ohlson 1980 Zmijewski 1984 Shumway 2001 Hillegeist et al 2004) from the literature are used by the authors in order to evaluate their performance with an up-to-date data set Based on them the authors build their own integrated model (multi-period logit model with expanded set of variables)
The integrated model using accounting and market data as well as firmsrsquo characteristics outperformed the other models Altmanrsquos z-score performed poorly in comparison to the other 4 models Shumwayrsquos model outperformed model of Hillegeist et al performed adequately and Ohlsonrsquos and Zmijewskirsquos models performed adequately but their performance deteriorated over time
Shen C-H et al (2010)
Non-financial companies listed on the Taiwan Stock Exchange covering the period from 1999 to 2004 There were 52 default companies and 156 non-default companies in the sample
(V) The authors applied a robust logit method to build up an empirical model based on Altmanrsquos z-score (one variable was omitted retained earnings to total assets) They took into account outliers which so far have been omitted in the models The results of robust logit method were compared with logit method
In the case of in-the-sample forecasts robust logit models preformed better than the logit model However in the case of out-the-sample forecast superiority of robust logit model disappeared Robust logit model was more aggressive in assigning firms as default
Butler AW Wan H (2010)
New debt offerings from 1975-1999 (4293 offerings within 632 convertible debt issue) Sample covered non-regulated utility and non-financial companies listed on major US stock exchanges The first offering in the sample period for a particular firm was used and the other offerings from the same firms within the following five years were excluded from the sample
(M) The aim of the paper was to assess long-term stock performance of debt and convertible debt issuers The authors revised the results of the previous research on the stock returns of bond issuing firms According to the authors previous models omitted liquidity factor Altmanrsquos z-score was used as a proxy for financial distress besides momentum as another matching criterion
Introduction of the liquidity factor into the model erased long-run underperformance of debt and convertible debt issuers Momentum and Altmanrsquos z-score did not erase this underperformance
Aktas N et al (2012) US listed non-financial firms with z-score higher than the median of the population from 1992 to 2007 The
(M) The article investigated the relationship between the use of trade credit and the quality of firmsrsquo
According to the empirical study the change in the trade credit signaled the future positive change in firmrsquos performance
32
sample consisted in 15928 firm-years from 2096 firms
investments Altmanrsquos z-score was used as one of three proxies for measuring the quality of firmrsquos investment projects (additionally return on assets and long-term abnormal returns) The authors developed a theoretical model for trade credit decision with the use of strategic game with imperfect information as well as empirical study
Empirical results supported conclusions from the theoretical model In the case of the use of next period change of the z-score the authors confirmed both CEO incentive and entrenchment however in the case of two other proxies only CEO incentive
Chen H et al (2012) US non-financial companies issuing debt securities from Lehman Brothers Bond Database data on unionization described in Hirsch and Macpherson (2003) supported by financial and demographic data The period covered years from 1984 to 1998 The sample consisted in 996 firms and 5557 firm-years observations
(M) The authors focused on the impact of ldquounionized workersrdquo on the pricing of corporate debt Altmanrsquos z-score was used as one of 5 measures of distress (accompanied by interest coverage book equity Ohlsonrsquos o-score and default measure developed by Bharath and Shumway in 2008)
The authors drew 4 conclusions In the case of more ldquounionizedrdquo industries the yield on bonds is lower the impact is stronger in firms with weak financial standing highly ldquounionizedrdquo firms invested less in RampD than in physical assets they were less likely to be the acquisition target According to the authors ldquounionized workersrdquo protected bondholdersrsquo and other fixed claimants wealth
Jackson RHG Wood A (2013)
LSE-listed non-financial UK firms The sample consisted in 101 failed firms of which failure was registered from 30 Sept 2000 to 31 Dec 2009 and 6494 non-failed firm-years from 1 Jan 2000 to 31 Dec 2009
(V) The authors tested 13 different models of bankruptcy prediction and assessed their efficacy with the use of ROC curve They selected 3 single variable models 3 accounting-based models (with Altmanrsquos z-score) in two versions with up-dated coefficients and neural network approach 4 contingent claims models
Contingent claims models outperformed the other models The best four models are contingent claims models based on European call and barrier options In the case of application of the neural network to accounting based models the predictive ability improved however was still lower than in case of market-based models
Singhal R Zhu Y (2013)
US non-financial firms Final sample covered 769 bankruptcy filings between 1 Jan 1991 to 31 Dec 2007 Failed firms were divided to two groups focused (622) and diversified (147)
(M) The focus of the study was to check bankruptcy risk and bankruptcy costs in the case of focused vs diversified firms Altmanrsquos z-score was used as a measure of financial distress
The mean and median z-score for diversified groups were higher than for focused groups The Z-score was highly correlated with the leverage in the authorsrsquo model Diversified firms represented a lower risk of bankruptcy however they underperformed focused firms
33
in other areas (like inefficient segment investment and longer time in the bankruptcy procedure what incurred higher bankruptcy costs)
Lyandres E Zhdanov A (2013)
US companies (financial and non-financial) listed on major stock-exchanges The sample covered period from 1985 to 2005 The number of bankruptcies was 948 (compiled from different sources like Thomson Financial and T Shumwayrsquos database) and the number of firm-years was 146836
(V) The authors posed the question if the inclusion of variables related to investment opportunities improved the predictive power of three models (Altmanrsquos z-score Zmijewskirsquos and Shumwayrsquos models) They used 3 proxies for investment opportunities (market-to-book value-to-book RampD-to-assets)
The measures of investment opportunities were related to the likehood of default Inclusion of either of three investment opportunities measures improved modelsrsquo out-of-sample forecasting ability
Ho C-Y et al (2013) North America publicly listed pulp and papers firms Sample includes 122 firms within 12 that filed for bankruptcy The period from 1990 to 2009 Data were compiled from different sources (like Compustat CRSP WRDS)
(R) The paper investigated bankruptcy prediction with the use of financial ratios and investorsrsquo reactions to bankruptcy filing The authors used Ohlsonrsquos model (original and re-estimated) to predict bankruptcy in the pulp and paper industry Altmanrsquos z-score (original and re-estimated) was used for robustness check
Investorsrsquo suffered significant losses during the month a bankruptcy occurred O-scores of failed firms were higher than in case of non-failed firms 1 to 2 year before the bankruptcy Re-estimated Ohlsonrsquos model performed better than the original In the case of Altmanrsquos z-score the re-estimated model performed better due to the reduction of Type II errors that occurred in the original one In both cases models were useful for bankruptcy prediction
Kieschnick R et al (2013)
Non-financial US companies from 1990 to 2006 There were 3786 companies in the sample (yearly average)
(M) The paper focused on the relationship between working capital management and shareholdersrsquo wealth as well as their determinants Altmanrsquos original (1968) and revised (2000) z-score were used as a measure of the financial distress
The authors concluded that ldquoincremental dollar invested in net operating capital is worth less than an incremental dollar held in cash for the average firmrdquo The impact on the shareholder value was determined by sales expectations access to external capital bankruptcy risk and debt load The higher the z-score was the more valuable its investment in working capital
34
Acosta-Gonzaacutelez E
Fernaacutendez-Rodriacuteguez
F (2014)
Spanish building industry firms For model estimation the sample covered 93 firms that failed in 2004 and 257 randomly selected non-failed firms for the period from 2000 to 2004 For ex-ante forecast accounting information from 2005 for randomly selected 400 out of which 80 failed in 2007
(V) The authors used genetic algorithms with Schwarz information criterion (GASIC) for variables selection (out of 32 preselected ratios) combined with the logit model for bankruptcy prediction Altmanrsquos z-score model was used as one of two benchmarks for authorsrsquo model evaluation
One step ahead forecast Altmanrsquos model was better in predicting failed firms but the type II error was high two and three steps ahead forecasts were similar in terms of failed firms but in the case of non-failed Altmanrsquos model prediction was worse four steps ahead forecasts GASIC model outperformed in the case of failed firms and was comparable in the case of non-failed firms
Note Based on the own review of studies
35
35
Table 2 Number of observations by country
Estimation data Test data
Country Non-failed Failed Non-failed Failed
Austria (AT) 7430 55 7526 44
Belgium (BE) 179979 2994 179818 2944
Bosnia (BA) 29391 35 29139 32
Bulgaria (BG) 50041 48 42351 44
China (CN) 39315 198
China delisted dataset
16291 29
China ST data 846 16 1020 16
Colombia (CO) 8366 139 6982 125
Greece (GR) 51763 28
Croatia (HR) 59541 249 58478 275
Czech Republic (CZ) 92835 556 92562 564
Denmark (DK) 167934 1334 168538 1398
Estonia (EE) 34313 234 34196 242
Finland (FI) 90878 481 91227 459
France (FR) 160749 6124 161653 6318
Germany (DE) 98814 910 99496 921
Hungary (HU) 19421 303 20155 313
Iceland (IS) 17399 248 17624 243
Ireland (IE) 6665 121 6406 139
Italy (IT) 167113 8101 166258 8124
Latvia (LV) 8064 433 8241 477
Lithuania (LT) 10000 56
Netherlands (NL) 20885 154 15854 147
Norway (NO) 172467 1294 170985 1206
Poland (PL) 87200 291 86233 264
Portugal (PT) 180114 3390 178646 3422
Romania (RO) 161992 97 164259 93
Russian Federation (RU) 116903 2534 115711 2481
Serbia (RS) 100100 68
Slovakia (SK) 7856 120 7788 124
Slovenia (SI) 14419 59 14081 41
Spain (ES) 156746 3036 158122 2991
Sweden (SE) 169810 2256 169999 2314
Ukraine (UA) 133342 1787 133980 1765
United Kingdom (GB) 171493 760 170930 716
UK (GB) liquidation dataset
342423
4990
United States (US) 9557 56 9929 53
In total 2602563 38215 3148079 43664
36
36
Table 3 Descriptive statistics (all data)
WCTA RETA EBITTA BVETD
Statistic Non-failed Failed Non-failed Failed
Non-failed Failed
Non-failed Failed
Median 0152 -0059 0189 -0024 0041 -0020 0451 0025
Mean 0147 -0213 0188 -0317 0055 -0108 3594 0703
Standard deviation 0442 0604 0509 0767 0227 0296 11499 5712
Upper quartile 0420 0142 0476 0087 0131 0042 1548 0215
Lower quartile -0040 -0440 0011 -0450 -0008 -0208 0100 -0240
Maximum 0956 0956 0958 0958 0785 0785 68606 68606
Minimum -1637 -1637 -2453 -2453 -0828 -0828 -0649 -0649
Legend WCTA = Working CapitalTotal Assets
RETA = Retained EarningsTotal Assets EBITTA = EBITTotal Assets
BVETD = Book Value of EquityTotal Liabilities SALTA = SalesTotal Assets
37
37
Table 4 The coefficients of the different models estimated for all data
Coefficients for different statistical models
Variable Zrsquo-Score
Model 1
Model 2
Model 3 Model 4
Model 5
Model 6
Model 7 Model 8
Constant 325 -0042 0035 0207 -13466 0007 0048 0049 -13302
WCTA 656 -0561 -0495 -0483 -0441 -0487 -0540 -0496 -0459
RETA 326 -0724 -0862 -0891 -1146 -0846 -0859 -0863 -1160
EBITTA 672 -1791 -1721 -1790 -1619 -1757 -1695 -1717 -1682
BVETD 105 -0021 -0017 -0016 -0012 -0017 -0016 -0017 -0013
Year dummies
Year 2008 -0055 -0034
Year 2009 -0179 -0150
Year 2010 -0666 -0631
Size variables Total assets (log)
1830
1837
Total assets squared (log)
-0061
-0061
Age dummies
Less than 6 years 0135 0186
Over 12 years -0058 -0099
Country risk SP Country rating rank
-0003 -0014
Industry dummies
Restaurants and hotels -0653 -0628
Construction 0445 0365
Whole sale and retailing -0112 -0157
Agriculture -0180 -0176
Manufacturing 0139 0095
Energy and water production -0454 -0472
Information technology -0913 -0915
Significance
38
38
Coefficients are statistically significant at 00001
Models
Zrsquo-Score = Original Altman (1983) Zrsquo-Score Model coefficients Model 1 = The MDA model
Model 2 = The LR model Model 3 = The LR model estimated for all data with year dummies
Model 4 = The LR model estimated for all data with size variables Model 5 = The LR model estimated for all data with age category dummies Model 6 = The LR model estimated for all data with industry dummies Model 7 = The LR model estimated for all data with country risk rank Model 8 = The LR model estimated for all data with all variables
39
39
40
40
Table 5 Test data AUCs for different countries based on all data model versions Comparisons are with AUC of the LR model estimated for all data (benchmark)
Test data AUC for different models
Country Benchmark Model 1 Model 2 Model 3 Model 4 Model 5 Model 6 Model 7 Model 8
All Data 0748 0743---- 0745---- 0752++++ 0760++++ 0748+++ 0751++++ 0749++++ 0771++++
Countries with estimation data
Austria (AT) 0800 0788 0797 0805 0818+ 0814+ 0782 0800 0819
Belgium (BE) 0772 0760 0770 0777 0747 0777 0765 0772 0758
Bosnia (BA) 0862 0805 0857 0776 0863 0847 0855 0862 0784
Bulgaria (BG) 0684 0630 0680 0654 0691 0680 0659 0684 0632
China ST companies 0985 0911---- 0983 0958- 0977 0978 0987 0985 0968
Colombia (CO) 0726 0724 0727 0715 0758 0728 0726 0726 0757
Croatia (HR) 0844 0812 0839 0803 0837 0835 0832 0844 0801
Czech Republic (CZ) 0811 0813 0811 0819 0828 0807 0820 0811 0838
Denmark (DK) 0803 0798 0800 0781 0813 0802 0801 0803 0796
Estonia (EE) 0823 0827 0823 0847 0866 0826 0833 0823 0890
Finland (FI) 0867 0864 0866 0835 0862 0870 0878 0867 0853
France (FR) 0739 0723 0735 0749 0771 0741 0762 0739 0799
Germany (DE) 0673 0658 0666 0695 0656 0684 0677 0673 0688
Hungary (HU) 0742 0746 0740 0660 0738 0755 0735 0742 0696
Iceland (IS) 0664 0674 0666 0694 0678 0673 0672 0664 0716
Ireland (IE) 0679 0672 0676 0708 0677 0681 0688 0679 0712
Italy (IT) 0806 0799 0804 0833 0835 0806 0799 0806 0849
Latvia (LV) 0678 0691 0678 0704 0676 0686 0698 0678 0724
Netherlands (NL) 0752 0754 0750 0775 0769 0754 0746 0752 0787
Norway (NO) 0716 0694 0713 0658 0682 0720 0715 0716 0645
41
41
Poland (PL) 0903 0904 0904 0908 0902 0903 0899 0903 0904
Portugal (PT) 0741 0724 0736 0749 0773 0738 0755 0741 0785
Romania (RO) 0758 0740 0754 0709 0749 0755 0748 0758 0703
Russian Federation (RU) 0811 0802 0812 0843 0799 0807 0799 0811 0814
Slovakia (SK) 0777 0774 0776 0780 0811 0769 0786 0777 0808
Slovenia (SI) 0737 0725 0733 0674 0740 0747 0718 0737 0721
Spain (ES) 0734 0713 0732 0707 0793 0728 0753 0734 0774
Sweden (SE) 0813 0801 0809 0799 0784 0817 0823 0814 0800
Ukraine (UA) 0708 0714 0710 0715 0721 0708 0702 0708 0722
United Kingdom (GB) 0699 0719 0699 0686 0736 0695 0706 0699 0729
United States (US) 0710 0701 0711 0709 0722 0705 0716 0710 0723
Countries only in test data
European
Greece (GR) 0715 0670 0702 0725 0711 0713 0717 0715 0718
Lithuania (LT) 0767 0782 0767 0764 0768 0769 0775 0767 0778
Serbia (RS) 0736 0713 0730 0603- 0826 0720 0753 0736 0738
United Kingdom Liquidation set 0606 0621 0603 0620 0618 0610 0607 0607 0635
Non-European
China (CN) 0558 0570 0557 0572 0543 0554 0567 0558 0556
China Delisted companies 0529 0546 0519 0563 0740++++ 0542 0520 0529 0707+++
Significance AUC better than benchmark 00001 = ++++ 0001 = +++ 001 = ++ 01 = +
AUC worse than benchmark 00001 = ---- 0001 = --- 001 = -- 01 = - Models
Benchmark = The LR model estimated for all data with Zrsquorsquo-model (1983) variables Model 1 = The original Altman (1983) Zrsquorsquo-Score Model
Model 2 = The MDA model estimated for all data Model 3 = The LR model estimated for all data with year dummies
42
42
Model 4 = The LR model estimated for all data with size variables Model 5 = The LR model estimated for all data with age category dummies Model 6 = The LR model estimated for all data with industry dummies Model 7 = The LR model estimated for all data with country risk rank Model 8 = The LR model estimated for all data with all variables
43
43
Table 6 Differences of medians between non-failed and failed groups
Country WCTA RETA EBITTA BVETD AUC of
Z-Score
Austria (AT) 0448 0405 0126 0487 0788
Belgium (BE) 0223 0264 0077 0431 0760
Bosnia (BA) 0106 0249 0088 0580 0805
Bulgaria (BG) 0114 0291 0094 0436 0630
China (CN) 0068 0032 0016 0280 0570
China delisted data 0089 -0061 -0032 0083 0546
China ST data 0298 0293 0139 0468 0911
Colombia (CO) 0226 0235 0099 0705 0724
Croatia (HR) 0275 0335 0044 0274 0812
Czech Republic (CZ) 0404 0397 0069 0667 0813
Denmark (DK) 0267 0356 0046 0733 0798
Estonia (EE) 0331 0388 0113 1033 0827
Finland (FI) 0402 0606 0207 0907 0864
France (FR) 0140 0213 0065 0424 0723
Germany (DE) 0131 0136 0032 0262 0658
Greece (GR) 0171 0262 0049 0349 0670
Hungary (HU) 0175 0224 0052 0587 0746
Iceland (IS) 0246 0261 0051 0337 0674
Ireland (IE) 0181 0266 0039 0560 0672
Italy (IT) 0277 0164 0073 0207 0799
Latvia (LV) 0117 0120 0042 0254 0691
Lithuania (LT) 0246 0218 0051 0569 0782
Netherlands (NL) 0204 0253 0077 0432 0754
Norway (NO) 0157 0219 0115 0329 0694
Poland (PL) 1340 0920 0124 1351 0904
Portugal (PT) 0215 0200 0052 0318 0724
Romania (RO) 0222 0271 0056 0298 0740
Russian Federation (RU) 0350 0242 0069 0245 0802
Serbia (RS) 0120 0148 0045 0389 0713
Slovakia (SK) 0256 0184 0061 0431 0774
Slovenia (SI) 0111 0172 0035 0326 0725
Spain (ES) 0143 0143 0076 0285 0713
Sweden (SE) 0255 0346 0099 0663 0801
Ukraine (UA) 0204 0200 0031 0449 0714
United Kingdom (GB) 0211 0245 0033 0472 0719
UK Liquidation set 0156 0234 0031 0447 0621
United States (US) 0195 0378 0248 0722 0701
44
44
Average of column items 0245 0265 0073 0481 0740
Correlation with Z-Score AUC 0611 0681 0516 0574 1000
Legend WCTA = Working CapitalTotal Assets
RETA = Retained EarningsTotal Assets EBITTA = EBITTotal Assets
BVETD = Book Value of EquityTotal Liabilities SALTA = SalesTotal Assets
AUC = Area under the ROC curve Z-Score = Altman (1983) Z-Score in the test data
45
45
Table 7 Test data AUCs for different estimated country models Comparisons are with AUC of the LR model estimated for all data (benchmark)
Test data AUC for different models
Country Benchmark Model 1 Model 2 Model 3 Model 4 Model 5 Model 6 Model 7
Austria (AT) 0800 0782 0770- 0774 0829 0787 0707- 0764
Belgium (BE) 0772 0779 0780 0826 0776 0783 0781 0834
Bosnia (BA) 0862 0850 0832 0833 0838 0838 0820 0853
Bulgaria (BG) 0684 0785 0785 0785 0796 0794 0677 0707
China (CN) ST companies 0985 0984 0982 0980 0986 0986 0986 0989
Colombia (CO) 0726 0755 0754 0818+ 0789 0749 0774 0824+
Croatia (HR) 0844 0862 0858 0865 0853 0863 0847 0863
Czech Republic (CZ) 0811 0812 0812 0823 0830 0813 0818 0842
Denmark (DK) 0803 0806 0809 0833 0818 0804 0813 0843
Estonia (EE) 0823 0824 0839 0866 0874 0839 0847 0899
Finland (FI) 0867 0867 0870 0885 0868 0873 0879 0894
France (FR) 0739 0773 0799 0805 0826 0800 0810 0845
Germany (DE) 0673 0684 0685 0734 0704 0701 0690 0762
Hungary (HU) 0742 0736 0743 0788 0767 0765 0747 0820
Iceland (IS) 0664 0670 0671 0784+ 0683 0714 0708 0824+
Ireland (IE) 0679 0663 0666 0718 0661 0665 0680 0724
Italy (IT) 0806 0802 0810 0835 0839 0809 0816 0868
Latvia (LV) 0678 0690 0707 0745 0720 0711 0730 0771
Netherlands (NL) 0752 0752 0756 0768 0784 0760 0759 0807
Norway (NO) 0716 0741 0741 0803 0749 0744 0743 0814
Poland (PL) 0903 0891 0897 0915 0899 0896 0895 0913
Portugal (PT) 0741 0753 0757 0761 0780 0758 0765 0797
Romania (RO) 0758 0718 0773 0805 0757 0755 0753 0774
Russian Federation (RU) 0811 0808 0810 0854 0811 0811 0818 0862
Slovakia (SK) 0777 0773 0775 0782 0810 0761 0773 0807
46
46
Slovenia (SI) 0737 0703 0719 0704 0711 0739 0686 0698
Spain (ES) 0734 0755 0767 0768 0849 0766 0776 0858
Sweden (SE) 0813 0826 0829 0843 0831 0831 0892 0901
Ukraine (UA) 0708 0712 0712 0720 0742 0718 0718 0758
United Kingdom (GB) 0699 0708 0713 0718 0764 0714 0731 0785
United States (US) 0710 0689 0687 0686 0816+ 0689 0714 0816+
Average of AUC 0768 0773 0778 0801 0799 0782 0779 0823
Significance AUC better than benchmark 00001 = ++++ 0001 = +++ 001 = ++ 01 = +
AUC worse than benchmark 00001 = ---- 0001 = --- 001 = -- 01 = - Models
Benchmark = The LR model estimated for all data with Zrsquorsquo-model (1983) variables Model 1 = The MDA model estimated for country data
Model 2 = The LR model estimated for country data Model 3 = The LR model estimated for country data with year dummies
Model 4 = The LR model estimated for country data with size variables Model 5 = The LR model estimated for country data with age category dummies Model 6 = The LR model estimated for country data with industry dummies
Model 7 = The LR model estimated for country data with all variables
47
47
Appendices
Appendix 1 Medians of the Altman (1983) model (Z) variables by status and country
Non-failed Failed
Non-failed Failed
Non-failed Failed Non-failed Failed
Country WCTA
RETA
EBITTA
BVETD
Austria (AT) 0170 -0278 0260 -0145 0055 -0071 0465 -0022
Belgium (BE) 0136 -0087 0157 -0107 0052 -0025 0460 0029
Bosnia (BA) 0087 -0019 0148 -0101 0032 -0056 0580 0000
Bulgaria (BG) 0216 0102 0272 -0019 0075 -0019 0504 0068
China (CN) 0105 0037 0064 0032 0064 0048 0870 0590
China delisted data 0158 0069 0286 0347 0059 0091 0923 0840
China ST data 0106 -0192 0281 -0012 0052 -0087 0776 0308
Colombia (CO) 0244 0018 0282 0047 0104 0005 0940 0235
Croatia (HR) 0093 -0182 0130 -0205 0030 -0014 0274 0000
Czech Republic (CZ) 0196 -0208 0230 -0167 0050 -0019 0591 -0076
Denmark (DK) 0128 -0139 0306 -0050 0005 -0041 0758 0025
Estonia (EE) 0222 -0109 0455 0067 0050 -0063 1169 0136
Finland (FI) 0233 -0169 0359 -0247 0082 -0125 0744 -0163
France (FR) 0146 0006 0223 0010 0059 -0006 0501 0077
Germany (DE) 0307 0176 0150 0014 0069 0037 0335 0073
Greece (GR) 0127 -0044 0049 -0213 0039 -0010 0460 0111
Hungary (HU) 0135 -0040 0271 0047 0054 0002 0717 0130
Iceland (IS) 0051 -0195 0046 -0215 0051 0000 0196 -0141
Ireland (IE) 0198 0017 0383 0117 0029 -0010 0728 0168
Italy (IT) 0107 -0170 0077 -0087 0032 -0041 0178 -0029
Latvia (LV) 0102 -0015 0150 0030 0069 0027 0342 0088
48
48
Lithuania (LT) 0205 -0041 0273 0055 0054 0003 0686 0117
Netherlands (NL) 0204 0000 0303 0050 0065 -0012 0511 0079
Norway (NO) 0185 0028 0139 -0080 0068 -0047 0398 0069
Poland (PL) 0198 -1142 0258 -0662 0076 -0048 0850 -0501
Portugal (PT) 0164 -0051 0133 -0067 0028 -0024 0343 0025
Romania (RO) 0071 -0151 0158 -0113 0041 -0015 0250 -0048
Russian Federation (RU) 0088 -0262 0106 -0136 0043 -0026 0194 -0051
Serbia (RS) 0093 -0027 0129 -0019 0027 -0018 0389 0000
Slovakia (SK) 0137 -0119 0185 0001 0060 -0001 0496 0065
Slovenia (SI) 0109 -0002 0215 0043 0039 0004 0434 0108
Spain (ES) 0117 -0026 0139 -0004 0029 -0047 0336 0051
Sweden (SE) 0266 0011 0357 0011 0058 -0041 0749 0086
Ukraine (UA) 0053 -0151 0034 -0166 0003 -0028 0442 -0007
United Kingdom (GB) 0179 -0032 0294 0049 0031 -0002 0579 0107
UK Liquidation set 0179 0023 0294 0060 0031 0000 0579 0132
United States (US) 0164 -0031 0374 -0004 0003 -0245 0800 0078
Average of medianssect 0153 -0092 0213 -0050 0048 -0025 0555 0075
Legend WCTA = Working CapitalTotal Assets
RETA = Retained EarningsTotal Assets EBITTA = EBITTotal assets
BVETD = Book Value of EquityTotal Liabilities sect = Because the two datasets for non-failed UK firms are identical the non-failed medians are used only once in the calculation of the averages

3
we use a large international sample of firms to assess the classification performance of the Zrsquorsquo-Score model in bankruptcy prediction In all we analyze its performance in firms from 32 European and 3 Non-European countries (China Colombia and the US) Except for the US and China the firms in the sample are private Most firms are from non-manufacturing industries Therefore we use the version of the model developed by Altman (1983) for private manufacturing and non-manufacturing firms (Zrsquorsquo-Score Model) Such an extensive international analysis of the performance of the model in a large number of countries has not been presented thus far We regard our review and analysis as important contributions to the economic literature The paper is structured as follows In the introduction we present a short summary of the development of failure prediction research starting from Beaver (1966) and Altman (1968) In the second section we summarize the original Z-Score Model (1968) and its extension for private non-manufacturing firms Zrsquorsquo-Score Model (1983) Then in the third section we present results and conclusions from the literature review on these models The fourth section presents seven research hypotheses on the performance of the Zrsquorsquo-Score Model for empirical analysis In the fifth section the empirical data and statistical methods are discussed while the sixth section presents empirical findings Finally the seventh section summarizes the study
2 Classic Z-Score Models
21 Z-Score Model for public firms Altman (1968) criticized prior studies on financial difficulties and said that the adaptation of their results for assessing the bankruptcy potential of firms both theoretically and practically is questionable The dominant methodology was essentially univariate and emphasis was placed on individual signals of impending difficulties This made the ratio analysis vulnerable to faulty interpretation and potentially confusing analytics As an appropriate extension Altman suggested building upon univariate findings and to combining several measures into a meaningful predictive model Then the question arises which ratios are most important in detecting bankruptcy potential what weights should be attached to those selected ratios and how should the weights be objectively established Altman suggested a multiple discriminant analysis (MDA) as the appropriate statistical technique MDA is a statistical technique used to classify an observation into one of several priori groupings dependent upon the individual characteristics of observations For the adaptation of the MDA model it is crucial how the sample of firms for the two groups of interest bankrupt and non-bankrupt and the variables of the model were originally selected The initial sample was composed of sixty-six corporations with thirty-three firms in each of the two groups The bankrupt group (Group 1) consisted of manufacturers that filed a bankruptcy petition under Chapter X of the National Bankruptcy Act during the period 1946 ndash 1965 The mean asset size of these firms was 64 million US dollars with a range of between 07 ndash 259 million US dollars Altman recognized that this group was not homogenous with respect to size and industry although all firms were relatively small and from manufacturing industries Therefore he attempted to make a careful selection of non-bankrupt firms (Group 2) Group 2 consisted of a paired sample of manufacturing firms chosen on a stratified random basis These firms were stratified by industry and size with the asset size range restricted to 1 ndash 25 million US dollars Altman eliminated both the small firms (less than 1 million US dollars in total assets) and the very large firms because of lack of data for small firms and of the rarity of bankrupcies of large firms He did not match the assets size of the two groups exactly and therefore firms in Group 2 are slightly larger than those in Group 1 The data collected for the firms in both groups were from the same years For Group 1 the data was derived
4
from financial statements one reporting period prior to bankruptcy The average lead time of the financial statements was approximately seven and one-half months The financial ratios selected for model building were based on the balance sheet and income statement data In past studies a very large number of variables were found to be significant indicators of financial difficulties Therefore Altman compiled a list of 22 potentially important financial ratios for evaluation He classified these variables into five standard ratios categories liquidity profitability leverage solvency and activity ratios The ratios were chosen on the basis of their 1) popularity in the literature and 2) potential relevancy to the study The list included only a few ldquonewrdquo ratios In addition Altman did not consider cash flow ratios because of the lack of consistent and precise depreciation data From the original list of 22 financial ratios Altman selected five ratios for the profile as doing the ldquobestrdquo overall job in the prediction of corporate bankruptcy This profile did not contain all of the most significant variables measured independently Instead the contribution of the entire profile was evaluated To arrive at a final profile of variables Altman utilized the following procedures 1) observation of the statistical significance of various alternative functions including determination of the relative contributions of each independent variable 2) evaluation of inter-correlations between the relevant variables 3) observation of the predictive accuracy of the various profiles and 4) judgment of the analyst The final discriminant function estimated by Altman (1968) is as follows Z = 0012X1 + 0014X2 + 0033X3 + 0006X4 + 0 999X5 Or Z = 12X + 14X2 + 33X3 + 06X4 + 10X5 (when the first four variables are expressed in decimals eg 200) where X1 = Working capitalTotal assets X2 = Retained EarningsTotal assets X3 = Earnings before interest and taxesTotal assets X4 = Market value of equityBook value of total liabilities X5 = SalesTotal assets Z = Overall Index 1) The Working capitalTotal assets ratio (X1) is a measure of the net liquid assets of the firm relative to the total capitalization Working capital is defined as the difference between current assets and current liabilities When a firm is experiencing consistent operating losses it will have shrinking current assets in relation to total assets X1 proved to be the more valuable in analyses than the current ratio and the quick ratio This ratio explicitly considers liquidity and size dimensions 2) The Retained EarningsTotal assets ratio (X2) refers to the earned surplus of a firm over its entire life This measure of cumulative profitability over time is one of the two (the other is the use of the market value of equity in X4 instead of the book value) ldquonewrdquo ratios evaluated by Altman It considers implicitly the age of the firm due to its cumulative nature and the use of leverage in the firmrsquos financing of its asset growth 3) The Earnings before interest and taxesTotal assets ratio (X3) is a measure of the true productivity or profitability of the assets of a firm It is not affected by any tax or leverage factors It reflects the earning power of the assets that determines the value of assets In a bankrupt sense insolvency occurs when the total liabilities exceed this fair value 4) The Market value equityBook value of total liabilities ratio (X4) shows how much the assets of a firm can decline in value (measured by market value of equity plus debt) before the liabilities exceed the assets and the firm becomes insolvent This ratio adds a market value dimension to the model The reciprocal of this ratio ndash the familiar DebtEquity ratio ndash is used to measure financial leverage Indeed Altmanrsquos
5
use of the market value of equity was the first study utilizing market measures and was in some ways a predecessor to the so-called structural approach championed by Merton (1974) and commercialized by KMV 5) The SalesTotal Assets ratio is the standard capital-turnover ratio illustrating the sales generating ability of the assets of a firm It refers to the capability of management in dealing with competitive conditions This ratio was dropped in the Zrdquo-Score model Altman evaluated the importance of the five ratios in several ways Firstly he used the F test to evaluate the univariate difference between the average values of the ratios in each group to the variability (or spread) of values of the ratios within each group In this test variables from X1 to X4 were all significant at the 0001 p-level indicating significant difference in the variables between the groups However X5 did not show any significant difference on a univariate basis All five ratios indicated higher values for the non-bankrupt group which is consistent with the positive signs of the discriminant function Secondly Altman determined the relative contribution of each variable to the total discriminating power of the function using the scaled vector In this vector the profitability measure (X3) showed the highest contribution while the SalesTotal assets ratio (X5) gave the second highest contribution although it was insignificant on a univariate basis To explain this Altman found a negative correlation (-078) between X3 and X5 in the bankrupt group Usually negative correlations are more helpful than positive correlations in adding new information to the function Altman explains that this negative correlation will occur when bankrupting firms suffer losses and deteriorate toward failure and their assets are not replaced as much as they were in better times In addition cumulative losses further reduce the asset size through debits to retained earnings Thus the asset size reduction apparently dominates any sales movements 22 Zrsquo-Score and Zrsquorsquo-Score Models for private firms The original Z-Score Model was based on the market value of the firm and was thus applicable only to publicly traded companies Altman (1983 122) emphasized that the Z-Score Model is a publicly traded firm model and ad hoc adjustments are not scientifically valid Therefore Altman (1983) advocated a complete re-estimation of the model substituting the book value of equity for the market value in X4 Using the same data Altman extracted the following revised Zrsquo-Score Model Zrsquo = 0717X1 + 0847X2 + 3107X3 + 0420X4 + 0 998X5 where X1 = Working capitalTotal assets X2 = Retained EarningsTotal assets X3 = Earnings before interest and taxesTotal assets X4 = Book value of equityBook value of total liabilities X5 = SalesTotal assets Zrsquo = Overall Index
Altman did not test the Zrsquo-Score model on a secondary sample due to lack of a private firm data base However he analyzed the accuracy of a four-variable Zrsquorsquo-Score Model excluding the SalesTotal assets ratio X5 from the revised model because of a potential industry effect The industry effect is more likely to take place when this kind of industry-sensitive variable (asset turnover) is included into the model Thus in order to minimize the potential industry effect Altman estimated the following four-variable Zrsquorsquo-Score model (Altman 1983 124)
Zrsquorsquo = 325 + 656X1 + 326X2 + 672X3 + 105X4
6
where X1 = Working capitalTotal assets X2 = Retained EarningsTotal assets X3 = Earnings before interest and taxesTotal assets X4 = Book value of equityBook value of total liabilities Zrsquorsquo = Overall Index
The EBITTotal assets ratio X3 again made the highest contribution to discrimination power in this version of model The classification results for the Zrsquorsquo-Score Model were identical to the revised five-variable (Zrsquo-Score) model In this study our empirical analysis is focused on the performance of the Zrsquorsquo-Score model in bankruptcy prediction
In concluding remarks Altman (1983 125) regarded the general applicability of his Z-Score Model as debatable He admited that the model did not scrutinize very large and very small firms the observation period was quite long (almost two decades) and the analysis included only manufacturing companies Altman concluded as follows ldquoIdeally we would like to develop a bankruptcy predicting model utilizing a homogenous group of bankrupt companies and data as near to the present as possiblerdquo Therefore he advised the analysts interested in practical utilization of the Z-Score Model to be careful This advisement deals with the versions Zrsquo-Score and Zrsquorsquo-Score models of the original Z-Score model as well
3 Literature review of Z-Score Models For the literature review we searched for papers published from the year 2000 on4 in prominent international journals from SciVerse ScienceDirect JSTOR and Springer Link Cambridge Journals and Oxford Journals We selected 34 articles from the below mentioned journals in which the Z-Score was used as a failure prediction proxy or Z-Score methodology was assessed mostly in terms of predictive ability The journals in alphabetical order and one handbook were the following The British Accounting Review (1) Computational Economics (1) Empirical Economics (1) Journal of Accounting Research (2) Journal of Banking and Finance (4) Journal of Business Research (2) Journal of Contemporary Accounting and Economics (1) Journal of Empirical Finance (1) Journal of Finance (4) Journal of Financial Markets (1) Journal of Financial and Quantitative Analysis (2) Journal of Financial Stability (1) Mathematics and Financial Economics (1) Lecture Notes in Computer Science (2) Review of Accounting Studies (3) The Review of Financial Studies (2) Review of Finance (3) Review of Quantitative Finance and Accounting (2) and Handbook of Quantitative Finance and Risk Management (1) The review is presented in Table 1 Out of the 34 studies in 17 cases Altmanrsquos Z-Score Model5 was used as the measure of distress or financial strength (M) in 14 studies Altmanrsquos original model was verified andor modified (V) and in 3 cases it was used for robustness check (R)
(Table 1 here)
The wide usage of the Z-Score Model as a measure of financial distress or financial strength in the economic and financial research points out that it is widely accepted as a venerable simple and consistent measure of the distressed firm at risk In case of the modification of the Z-Score Model
4 Research devoted to the application of Z-Score Model before 2000 was reviewed by Grice andand Ingram
(2001) 5 Most of the models focused on stock exchange listed firms thus Zrsquo-Score Model was not used
7
the most important changes were (1) the use of firmsrsquo up-dated financial data in order to re-estimate coefficients and (2) the use of other estimation techniques in order to improve efficacy in comparison to the original model The use of Altmanrsquos ratios combined with other than MDA modeling techniques has improved the prediction ability Also the application of new data improved model performance in the case of both US and non-US firms In comparison with market-based models or hazard models Altmanrsquos Z-Score Model generally underperformed (4 studies) outperformed (2) or provided similar results In Reisz and Perlich (2007) it was assessed as a better measure for short-term bankruptcy prediction than the market-based models and in Das Hanouna and Sarin (2009) it was shown to perform comparably to the Merton structural market-based approach for CDS spread estimation The question of whether market data is better than acccounting data has been raised many times The same applies to accounting-based models vs market-based models (eg discussion in Bauer and Agarwal 2014) Recall however that the original Z-Score model is not solely an accounting-based approach since the market value of equity is utilized as well Our purpose is not to contribute to this strand of studies and we focus on an accounting-based approach as almost all the estimated models in this study were from privately held firms and by definition there are no market-based data for these firms
4 Research hypotheses
The literature survey shows that the Z-Score Model (publicly traded firms) Zrsquo-Score Model (private firms) and Zrsquorsquo-Score Model (private manufacturing and non-manufacturing firms) have been very widely adapted in different contexts for different purposes For these kinds of widely used studies performance plays the key role In this study we are firstly interested in assessing the performance of the original Zrsquorsquo-Score model in classifying bankrupt and non-bankrupt firms in an international context Mainly our study is focusing on assessing performance in a European context However we also validate the results in a set of non-European countries to get a more global view Secondly we will re-estimate the model using extensive international data and then use the re-estimated Zrsquorsquo-Score Model as a benchmark assessing the effects of different factors on the performance in terms of classification accuracy We will assess the effects of the following five factors on this performance year of bankruptcy size of firms age of firms industry and country of origin In all we shall test a set of hypotheses based on the effects on performance of the model on two different levels Firstly we will test a set hypotheses on a pooled set of all firms and secondly on data from each country individually In comparison to the previous research our contribution consists of the focus on an international context not just the model application or re-estimation for a given country data The hypotheses of the study are as follows
H1 Obsolescence of the coefficients The Zrsquorsquo-Score Model was estimated using the same sample of firms that was used to develop the original Z-Score Model The bankruptcies in the estimation data occurred during the period 1946-1965 Thus the oldest observations are from almost seventy years ago during the post-war period Altman (1983 125) recommended utilizing data as near to the present as possible when developing a bankruptcy prediction model It is obvious that the financial behaviour of firms and their business environment have significantly changed after that potentially making the importance of the financial ratios to differ from their original importance reflected by the coefficients of the model Therefore we suggest as the first hypothesis (H1) that the re-estimation of the coefficients of the four original variables of the Zrsquorsquo-Score model will improve the classification performance of the model in an international context It is supported by the previous research (eg Grice and Ingram 2001) and practice H1 aims to support this evidence on the international level
8
H2 Method of estimation The original Zrsquorsquo-Score Model has been estimated using a MDA suggested by Altman (1983) as the appropriate statistical technique However MDA is based on ordinary least squares method (OLS) and thus requires assumptions of multinormality homoscedasticity and linearity which are not often met in empirical financial ratio analysis Therefore we re-estimate the Zrsquorsquo-Score Model using the logistic regression analysis (LRA) to assess the effect of the method of estimation LRA does not require most of the restricting assumptions of MDA In LRA multivariate normality of the independent variables homoscedasticity and linearity are not required For the sake of OLS MDA can be more useful than LRA for small samples such as the original sample of 66 firms used in the estimation of the Zrsquorsquo-Score Model However in a large sample LRA may potentially perform better In this study we use large samples which is advantageous for LRA Therefore our second hypothesis (H2) suggests that the classification performance of the re-estimated Zrsquorsquo-Score Model will be improved when it is estimated using LRA instead of MDA The model re-estimated for the original variables using LRA and all pooled data is called here the Zrsquorsquo-Score LR-model The performance of this re-estimated model is used in this study as the benchmark for further analyses
H3 Bankruptcy year The model based on the relationship between bankruptcy and financial ratios is likely to be affected by the macro-economic environment These effects may significantly decrease the classification accuracy of the model If the model is estimated using data from one year and it will be applied to data from another year the validity of the model can be questioned Business cycles in terms of economic growth credit policy and interest rates can have an effect on the boundary between bankrupt and non-bankrupt firms The original Zrsquorsquo-Score Model is estimated using data from the period 1946-1965 which includes several business cycles Therefore the model is not focused on any specific stage of cycle and does not explicitly take account of the bankruptcy year Altman (1983 125) suggested gathering data from firms for the last couple of years when developing a prediction model In this study the benchmark Zrsquorsquo-Score LR-model will be estimated for a shorter period than in the original estimation which however covers several recent years on different stages of the business cycle in different countries Therefore the third hypothesis (H3) assumes that the classification accuracy of the benchmark model can be increased by explicitly taking account of the year of bankruptcy in the estimation of the model
H4 Size of the firm The boundary between bankrupt and non-bankrupt firms is different for small and larger firms which decreases the performance of the model estimated for data from one size category and applied for data from another size category For the bankrupt and non-bankrupt firms in the original data for Zrsquorsquo-Score Model estimation the range of asset size was about between 1 ndash 25 million US dollars The data did not include very small and very large firms Altman (1983 125) regarded the suitability of the original Z-Score Model (and in the same way Zrsquorsquo-Score Model) for all firms as debatable because it did not scrutinize very large or very small firms In this study the benchmark Zrsquorsquo-Score LR-model will be estimated for data from many size categories from very small firms to very large firms The fourth hypothesis (H4) assumes that the classification performance of the uniform benchmark LR-model based on the original four financial variables of the Zrsquorsquo-Score Model is increased when the size category of the firm is explicitly taken into account
H5 Age of the firm International insolvency statistics generally shows that bankruptcy risk is a function of the age of the firm Especially very young firms typically show a very high risk The original Zrsquorsquo-Score Model does not take explicitly account of the age However Altman (1983 107) noted that the age of a firm is implicitly considered in the Retained EarningsTotal Assets ratio (X2) that was regarded as a new ratio in bankruptcy prediction context A relatively young firm will probably show a low ratio because it has not has time to build up cumulative profits Thus a young firm is to some degree discriminated against in the model and its likelihood to be classified as
9
bankrupt is relatively higher than that of an older firm For this argument Altman (1987 107) concluded ldquoBut this is precisely the situation in the real worldrdquo The incidence of failure is much higher in the early years of a firm In spite of the fact that the age of the firm in this way is implicitly taken into account in X2 we expect that an explicit consideration of the age will improve the classification accuracy due to controlling for the age factor Therefore the fifth hypothesis (H5) proposes that the performance of the uniform benchmark model based on the original four financial variables of the Zrsquorsquo-Score Model is increased when the age of the firm is explicitly taken into account
H6 Industry of the firm The original Zrsquo-Score Model is estimated only for manufacturing firms Altman (1983 125) stated that ideally we would like to develop a bankruptcy prediction model utilizing a homogenous group of bankrupt firms If we are interested in a particular industry grouping we should gather data from bankrupt and non-bankrupt firms in these groupings Previous studies show that the financial distress analysis is influenced by industry effect (Smith and Liou 2007) Firms in different industries tend to report different levels of the same financial ratios which may have an effect on the boundary between bankrupt and non-bankrupt firms This industry effect may be present in the Zrsquo-Score Model especially due to the SalesTotal Assets ratio (X5) This ratio showed the least significance on a univariate basis but had a very significant contribution to the discriminant power of the multivariate model Altman (1983 108 124) recognized the potential industry effect due to a wide variation among industries in asset turnover and specified the Zrsquorsquo-Score Model without X5 for private non-manufacturing firms However the Zrsquorsquo-Score Model is also estimated using the original sample of manufacturing firms In our analysis the uniform benchmark model based on the original four financial variables of the Zrsquorsquo-Score Model is estimated for a statistical sample representing different industries Therefore the sixth hypothesis (H6) assumes that an explicit consideration of industry will improve the classification accuracy of this benchmark model
H7 Country of origin The original Zrsquorsquo-Score Model has been estimated only for US firms However in previous studies the Zrsquorsquo-Score model has been applied in countries all over the world It can be expected that the international applicability of the model to other countries is affected by country-specific differences Economic environment legislation culture financial markets and accounting practices in a country may affect the financial behaviour of firms and the boundary between bankrupt and non-bankrupt firms These factors may potentially weaken the classification performance of the model in other countries outside the country in which the model is originally estimated (Ooghe and Balcaen 2007) Therefore the seventh hypothesis (H7) assumes that taking account explicitly of the country of origin of a firm will improve the classification accuracy of the benchmark model In our empirical study the country effect will be assessed by including a variable of country risk
5 Empirical data and statistical methods
51 Sample of firms The principal data of this study are extracted from the ORBIS databases of Bureau Van Dijk (BvD) The main data are from ORBIS Europe that is a commercial database which at the moment of sampling contained administrative information on over 50 million European firms However income statement and balance sheet information was available for about 8 million companies More than 99 of the companies covered in this database are private companies from different industries justifying the use of the Zrsquorsquo-Score Model (for private manufacturing and non-manufacturing firms) instead of the original Z-Score Model (for publicly traded manufacturing firms) The ORBIS database
10
organizes the public data from administrative sources and filters them into various standard formats to facilitate searching and company comparisons The ORBIS formats have been derived from the most common formats used for the presentation of business accounts in the world (Ribeiro et al 2010) It is clear that international comparability may be a problem when administrative firm-level data are internationally pooled For administrative data the definition of variables is usually less harmonized This is less of a problem in the ORBIS database because of the common international format of balance sheets For example although some discrepancies in profitloss statements may arise because of differences in fiscal systems across countries balance sheet variables largely adhere to international standards Therefore ORBIS provides us with a useful and extremely large database for our study For statistical sampling several requirements are set for the empirical data Firstly we require that the firm to be selected must be an unlisted industrial (non-financial) company Secondly its owners must have limited liability (whereby partnerships and sole proprietors are left out of the study) Thirdly we set a minimum requirement for the size of the firm Because financial ratios in very small firms are generally too unstable for a failure prediction model these firms are excluded (Balcaen and Ooghe 2006) We require that the Total Assets must have exceeded 100 thousand EUR at least once in the available time series for a firm Fourthly we include in our estimation sample firms from all European countries where the number of failed firms is more than 60 If the number of failed firms for a country is less than 60 the firms from this country are only included in the test sample For other European countries the failed firms are randomly classified into the estimation and test samples so that the number of sample firms are about equal in both samples In all our estimation data include firms from 29 European countries while the number of countries in the test data is 32 Fifthly all failed firms that fulfil the requirements above are included into our samples However if the number of non-failed firms in a country is very high a sample is randomly selected from that country Finally the time span of fiscal years potentially available for this study ranges from 2002 to 2010 Because the last financial statements for failed firms in the database are from a financial period within 2007 and 2010 earlier years are excluded for comparability also for non-failed firms But all qualifying observations for non-failed firms from years 2007 to 2010 are included in the data sets As for failed firms we restrict the analyses to the last financial statements available before failure The four independent variables of the Zrsquorsquo-Score Model were winzorized at 1 and 99 to minimize outliers Our data is not restricted to European countries only The results are estimated and tested also for three non-European countries (United States China and Colombia) to get a more global view of the performance of the Zrsquorsquo-Score Model Therefore a sample of firms from these countries is randomly selected as for the estimation and test data from ORBIS World including middle-size (total assets over 15 Million Euro) and larger firms from all over the world The main principles for selecting these data follow the description outlined above for European firms Table 2 shows the resulting number of non-failed and failed firms in the estimation data and test data by country In all the estimation sample includes data from 2602563 non-failed and 38215 failed firms from 29 European and 3 non-European countries The test sample is slightly larger because it includes data from 32 European and 3 non-European countries From the country of origin of the Zrsquorsquo-Score Model the US the estimation sample only includes 56 bankrupt firms For the US data we made an exception by allowing listed (and delisted) firms to be included as otherwise there would have been no observations for the US in the database From China there are three samples Special Treatment-firms (ST)6 are included in the estimation sample although there are only 32 such firms altogether7 Private and delisted (DL)
6 See Zhang Altman and Yen (2010) for the rationale for using special-treatment firms as a proxy for
bankruptcies These are firms put on probation by the stock exchange for poor operating performance andor negative equity 7This is done because the results about predictability were good also for such a small sample
11
Chinese firms are separately analysed only in the test data8 ST firms are listed firms suffering from serious financial difficulties Delisted firms are firms delisted from the stock enchange (Table 2 here) 52 Status of failed firms ORBIS has five classes for potentially active firms (active default of payment receivership dormant branch) and seven classes for inactive firms which do not carry out business activities anymore (bankruptcy dissolved dissolved (merger) dissolved (demerger) in liquidation branch no precision) From these classes only active is selected to represent non-distressed firms In selecting the failed firms we try to avoid ambiguity as much as possible by considering (with exceptions described below) a firm failed if its status in ORBIS is stated as bankruptcy However because of the small number of bankrupt firms in some countries we also consider receivership (active) firms failed although they are active These firms generally suffer from serious financial distress However liquidation (inactive) firms are not included in the sample of failed firms (with one exception) Firms in liquidation may depending on the country contain firms that have ceased activities due to reasons other than failure (mergers discontinuing the operations of a daughter company or of a foreign branch etc) Therefore for most countries we select only firms that are coded as being bankrupt or under receivership However there are a number of special countries where failed firms are coded under a different status heading These special countries or samples are the following Country Status categories Bulgaria In liquidation Bankruptcy Denmark Inactive (no precision) Greece Active (receivership) In liquidation Bankruptcy Ireland In liquidation Active (receivership) Norway In liquidation Slovenia In liquidation Spain Active (receivership) In liquidation Bankruptcy Ukraine In liquidation Bankruptcy United Kingdom liquidation Inactive (In liquidation) China ST Active (Special Treatment) China delisted Active (delisted) In case no such category for failed firms could be identified that country was excluded from the study (for example Switzerland) If there was only a very small number of failed observations the country was dropped from the study (Luxembourg Liechtenstein Montenegro typically small countries) It should also be noted that the status classes (including the bankruptcy category) are not completely homogenous within European countries due to different legislations although there are obvious similarities in insolvency acts (Philippe et al 2002) China is a special case including samples with three different criteria of failure (bankruptcy Special Treatment delisted) For the UK there are two different samples (liquidation receivership) 53 Statistical methods
8These firms are included only in the test data because the predictability of failure was exceptionally poor
12
In this study seven research hypotheses are drawn for statistical testing The statistical analysis will begin with calculating the original Zrsquorsquo-Score for the firms in the data Following the original model this Zrsquorsquo-Score will be calculated for all sample firms as follows Zrsquorsquo = 325 + 656X1 + 326X2 + 672X3 + 105X4 where X1 = Working capitalTotal assets X2 = Retained EarningsTotal assets X3 = Earnings before interest and taxesTotal assets X4 = Book value of equityBook value of total liabilities
The classification performance of the original model is assessed by the AUC (Area Under Curve) measure extracted from the ROC (Receiver Operating Characteristic) curve ROC curve is a plot of true positive rate against false positive rate for all different possible cut-off-points These profiles show the trade-offs between Type I and Type II errors and represent statistically the cumulative probability distribution of failed events AUC measures the accuracy of the estimated model in relation to the perfect model With a perfect model AUC is 1 and with a random model 05 AUC has a close connection with the Accuracy Ratio (AR) since AR = 2 AUC ndash 1 AR equals 0 for a random model and 05 for a model with an average classification performance In all statistical analyses SAS software is used
The first hypothesis (H1) assumes that the coefficients of the original model are obsolete H1 is tested by re-estimating the coefficients of the Zrsquorsquo-Score Model using the original statistical method (the multiple discriminant analysis or MDA) In MDA the discriminant function is determined by a parametric method (a measure of generalized squared distance) and the distribution of independent variables within both groups is assumed to be multivariate normal The purpose is to estimate the new coefficients for the model to statistically represent the overall sample The problem is that the estimation sample includes different numbers of failed and non-failed firms from 31 countries In the original sample of Altman (1983) an equal number of bankrupt and non-bankrupt firms were selected from one country (US) Following the characteristics of these data we weight the firms so that the weights for the failed and non-failed firms are equal In this way the non-proportional sampling in different countries does not affect the re-estimated model The number of firms from different countries however varies significantly which leads to greater weights for larger countries To avoid this problem the observations are also weighted so that each country has an equal weight in the analysis Then the coefficients of the Zrsquorsquo-Score Model are re-estimated using these weighted data and the resulting AUC is compared with the one based on the original model The second hypothesis (H2) expects that the classification performance of the re-estimated Zrsquorsquo-Score Model improves when it is re-estimated by the logistic regression analysis (LR) that is based on less restrictive statistical assumptions than MDA In this estimation the dependent variable Y = 0 when the firm is non-failed and Y = 1 when it is failed LRA does not require that independent variables are multivariate normal or that groups have equal covariance matrices which are basic assumptions in MDA (Hosmer and Lemeshow 1989) LRA creates a score (logit) L for every firm It is assumed that the independent variables are linearly related to L This score or logit is used to determine the conditional probability of failure as follows
13
)|1( XYp = )( 441101
1
1
1XbXbbL ee
where bi (i =0hellip 4) are the coefficients and Xi (i =1hellip 4) are the four independent variables of the original Zrsquorsquo-Model The effect of the method on classification performance is assessed by testing the statistical significance of the difference between AUCs for this LR model and for the re-estimated MDA model The resulting model is here called the Zrsquorsquo-Score LR-Model and it is used as a benchmark for further statistical AUC comparisons because LR is applied as the principal method in testing of the rest of the research hypotheses
The third hypothesis (H3) is associated with the performance effect of taking account of the bankruptcy year in estimation This hypothesis is tested estimating a LR model based on the following logit
3
1
4
10
jjji
ii DcXbbL
where b0 is a constant Xi (i =1hellip 4) are the four independent variables of the original Zrsquorsquo-Model bi (i =1hellip 4) are their coefficients cj (j =1hellip 3) are coefficients of the dummy variables and
D1 = 1 when year = 2008 0 otherwise
D2 = 1 when year = 2009 0 otherwise
D3 = 1 when year = 2010 0 otherwise
The dummy variables do not directly refer to the bankruptcy year that is not given in the data base but to the last available year For failed firms there is about 1mdash2 years lead time to failure from this year In this model year 2007 is the base category If AUC of this extended LR model statistically significantly exceeds AUC of the Zrsquorsquo-Score LR-Model (benchmark) evidence supports hypothesis H3 The research hypotheses H4-H7 are statistically tested using the same approach as for the third hypothesis above However for each hypothesis appropriate variables are used instead of the year dummies Hypothesis H4 deals with the performance effect of taking account of size and it will be tested using in the LR model two additional variables of size In this LR model size is measured by natural logarithm of total assets and its squared form In this way the effect of logarithmic size can be reflected by a function following the second-order parabola Hypothesis H5 predicts that taking explicitly account of the age of the firm improves classification performance When testing this hypothesis the category 6-12 years is used as the base category and two dummy variables are incorporated in the LR model (D1 0-6 years D2 12- years) Hypothesis H6 is associated with the effect of the explicit consideration of industry on the classification performance It is tested here using dummy variables for seven industries (D1 restaurants and hotels D2 construction D3 whole sale and retailing D4 agriculture D5 manufacturing D6 energy and water production D7 information technology) all other industries acting as the base category Hypothesis H7 predicts that the explicit consideration of the country of origin improves classification performance This hypothesis is tested not using dummy variables for countries but using country risk measures instead The country risk of each country is measured by Standard amp Poorrsquos Country
14
Risk Rating per six months after annual closing of accounts The rating is numerically recoded in the way that the best rating AAA = 1 the second best rating AA+ = 2 and et cetera Finally the lowest rating D = 22 Thus H7 is tested estimating a LR model based on the four financial ratios of the original Zrsquorsquo-Score Model and a 22-step variable referring to country risk The five LR models with the orginal four financial ratios and the additional variables specified in the hypotheses are estimated for all data In addition a LR model including all additional variables is estimated for all data to assess the simultaneous effect of all variables Finally six of the seven hypotheses are tested for the data of each country separately In this country level testing hypothesis H7 is not tested because the additional variable (country risk) is constant within the country
6 Empirical results
61 All data coefficients of the Zrsquorsquo-Score Models
Table 3 presents descriptive statistics of the four independent variables (X1-X4) of the Zrsquorsquo-Score Model for all test data The variation in the ratios is significant as is shown by the standard deviation and the quartiles For X1 (WCTA) X2 (RETA) and X3 (EBITTA) the median and the mean for non-failed firms are close to each other referring to a symmetry of distributions However this is not the case for the failed firms For the faileddistressed firms the median exceeds the mean for these three ratios referring to negatively skewed distributions For X4 (BVETL) the means significantly exceed the median for both failed and non-failed firms indicating a positively skewed distribution For each of the four variables both the mean and the median are higher for non-failed firms than for failed firms which is consistent with the expectations The difference between the means of non-failed and failed firms is larger in the original US data than in our all data for RETA and EBITTA but about the same size for WCTA and BVETL (Altman 1983 123) These characteristics of the data may indicate lower classification accuracy than in the original sample (Table 3 here) Table 4 presents the coefficients of the different models estimated for all data All LRA estimates (Model 2 to Model 9) are statistically significant at 0001 due to their contributions and the large sample size The first column presents the coefficients of the original Zrsquorsquo-Score model Column ldquoModel 1rdquo shows the coefficients when they are re-estimated by the same statistical method or MDA The coefficients are here negative since the models are estimated using Y = 1 for the failed firms In our all data EBITTA has a significantly higher weight than in the original US data while the weights of WCTA and BVETL have proportionally decreased The re-estimated coeffient of BVETD is very small referring to a minor effect on the logit Column ldquoModel 2rdquo presents the coefficients for the Zrsquorsquo-Score LR-Model These coefficients are directly comparable with those of the MDA model which is expected for the sake of the exceptionally large sample The differences in the coefficients of the original four variables between the eight LR models (Models 1-8) are small For each model the coefficient of BVETD is very close to zero This indicates that the original four variables and the additional variables are quite independent of each other (Table 4 here) Table 4 also shows the coefficients of the additional variables beyond the original four in the LR models The negative coefficients of the dummy (year) variables of Model 3 indicate that after 2007 (the base category) this risk of failure has significantly decreased year by year The base year of 2007
15
refers to a failure emerged during 2008-2009 This phenomenon is caused by the global financial crisis The crisis played a significant role in the failure of key businesses and a downturn in economic activity leading to the 2008ndash2012 recession especially in Europe The coefficients of Model 4 for the size variables show that the contribution of size on the logit (risk measure) is at its maximum value when logarithmic total assets is 15 or when total assets is about 33 million Euro Model 5 confirms the riskiness of young firms since the risk to fail is very high for newly founded firms (less than 6 years old) as is shown by the coefficient of the first dummy variable The coefficients of the industry dummies in Model 6 show that construction is an exceptionally risky industry followed by manufacturing For Model 7 the coefficient of the country risk dummy is statistically significant (for the sake of the large sample) but negative and very close to zero Finally the coefficients of all variables in Model 8 are directly comparable with those in Models 3-7 62 All data performance of the Zrsquorsquo-Score Models Table 5 shows the resulted AUCs in the test data for the different ldquoall datardquo models by country Model 1 refers to the original Zrsquorsquo-Score Model The classification performance of the score at the level of all countries is fair since AUC = 0743 refers to AR = 0486 that is about average accuracy (05) However the score gives relatively good results (AUC gt 08) for China (ST firms) Poland Finland Estonia Czech Republic Croatia Bosnia Russia and Sweden Its performance is quite low (AUC lt 07) for Norway Latvia Iceland Ireland and Germany The lower part of the table shows the resulting AUCs for the countries only included in the test data The performance of the score is very low for Chinese private and delisted firms It is also low for the liquidation firms in the United Kingdom Appendix 1 shows the medians of the four ratios (X1 to X4) by status and country Table 6 presents the differences of these medians between the non-failed and failed firms by country In this table also the AUC of the Zrsquorsquo-Score and its correlation to the difference of medians are presented This correlation is high for each financial ratio showing that the effects of the ratios on AUC are well balanced For Chinarsquos ST firms the differences are not exceptionally large except for EBITTA This implies with the exceptionally high AUC that the ST firms systematically differ from the non-ST firms although the differences are not extremely large The differences between the medians are very large in Poland for each ratio justifying high AUC They are also large in Finland and also in Czech Republic where the difference in EBITTA is however average In Germany Latvia China (private and delisted) and UK (liquidation) the differences in all four ratios are below the average which is obviously associated with low AUC In the Chinese delisted firms the differences in RETA and EBITTA are even negative In Iceland and Ireland the differences only in EBITTA are exceptionally small (Table 5 here) (Table 6 here) Model 2 in Table 5 is the re-estimated Zrsquorsquo-Score Model where the coefficients are estimated by MDA for all data Its AUC (0745) is only slightly higher than for the original model (0743) supporting only very weakly if at all H1 (obsolescence of the coefficients) The classification accuracy AR (0490) is about the average level However the re-estimation of the coefficients has led to improved classification accuracy in a number of countries especially in Bosnia China (ST) Norway and Greece However it has impaired classification accuracy in UK and China (delisted) Column ldquoBenchmarkrdquo reports the results for the benchmark model (Zrsquorsquo-Score LR-model) showing the effect of the estimation method For the benchmark model AUC in all data is 0748 that is higher than for Model 1 and 2 The differences between AUCs are very small supporting only weakly H2 (estimation
16
method) The LR-model (benchmark) and the MDA model (Model 2) give almost identical AUCs for each country This result was expected since the coefficients of the models are directly comparable The similar results for the models may also indicate that the independent variables conform to multinormality This last result confirms what most researchers in the field of default classification models have concluded that accuracy levels are extremely similar despite any statistical violations like normality between MDA and logistical regression models Model 3 (LR-model with year dummies) leads in all test data to higher AUC (0752) than the benchmark model supporting H3 (bankruptcy year effect) However the AUC effects are not positive for all countries The effects are positive for example for Russia Estonia Germany Ireland and Latvia but these effects are not statistically significant There are statistically significant negative effects for China (ST) and Serbia There are notable negative effects especially for Bosnia Croatia Hungary Norway and Slovenia These diverse results are due to exceptional annual distributions of failed firms in these countries For the countries with negative effects the percent of failed firms from 2010 (D3 = 1) exceeds 50 while for the countries with positive effects it is only a couple of percent For each group non-failed firms are quite equally distributed over years When the coefficient of D3 is very low (-0666) it strongly decreases the risk estimates of most failed firms in the former countries but only in few failed firms in the latter countries This leads to the observed effects Model 4 (LR-model with size variables) performs better than the benchmark model which gives support to H4 (size effect) It leads to AUC = 0760 referring to AR = 0520 However it leads to significant improvements in AUC for example in China (delisted) and Austria For China (delisted) the increase in AUC is extremely strong There are also improvements in AUC for instance for Estonia Italia Slovakia Spain and UK Model 4 has also led to lower AUCs in few countries but the decrease is not significant Model 4 is based on the four original variables and the size effect following a second-order parabola This kind of size effect is very small for micro firms but increases approaching its maximum value in middle-sized firms The countries with a positive change in AUC have typically data where the percent of failed micro firms (in all failed firms) is relatively low (40-60) while there are a lot of middle-sized failed firms Because the size effect is strongest for middle-sized firms AUC will increase On contrary the countries with a negative change in AUC have data where the percent of failed micro firms is exceptionally high (70-80) Model 5 (LR-model with age category dummies) gives for all test data about the same AUC as the benchmark model (AUC = 0748) Thus empirical evidence does not support H5 (size effect) For each country the effect of the age on AUC is small For Austria the effect is however positive and notable For this country the percent of non-failed young firms (0-6 years) is only about 10 (of non-failed firms) whereas this percent for failed firms is more than 20 (of failed firms) Because Model 5 includes a strong positive age risk effect for young firms (D2) it increases the risk of many failed firms but that of only few nonfailed firms This obviously leads to an improvement in AUC Model 6 (LR-model with industry dummies) outperforms the benchmark model in AUC supporting H6 (industry effect) It gives AUC = 0751 leading to AR = 0502 However its AUC is notably higher than the benchmark AUC only in a couple of countries for example in France Latvia Portugal and Spain Model 6 makes a negative effect on failure risk for example in restaurants and hotels and information technology industries but a positive effect in construction and manufacturing industries For the countries with a positive effect on AUC the percent of nonfailed firms in restaurants and hotels and information technology is high while that of failed firms is low For the risky industries (construction and manufacturing) these distributions are reversed Thus Model 6 gives a positive (negative) risk effect for many failed (nonfailed) firms and a negative (positive) risk effect only for few
17
failed (nonfailed) firms Therefore AUC will be increased This situation is reversed for the countries with a negative effect on AUC (Austria and Slovenia) The samples of these countries include a high percent of nonfailed firms in the manufacturing industry leading to a decrease in AUC Model 7 (LR-model with country risk measure) leads to a marginally higher classification performance (AUC = 0749) than the benchmark model This result gives only very weak support for H7 (country of origin effect) However for each country the resulted AUC is almost identical with that given by the benchmark model This result was expected due to the neglible coefficient (-0003) of the country risk measure (SP Country rating rank) in Model 7 This result implies that country risk does not make any effect on the boundary between bankrupt and non-bankrupt firms Model 8 (LR-model with all variables) includes the four financial ratios and all additional variables It leads in all test data to a sizeable increase in AUC (AUC = 0771) in comparison to the benchmark AUC However the effect on AUCs largely varies and is either negative or positive in different countries The effect is large in several countries for example in Estonia France Iceland Italy Latvia and China (delisted) However it also makes a negative effect on AUC in several countries such as Bosnia Hungary and Norway These results show that the inclusion of additional variables into the original model will usually increase AUC but not in every country The ldquoall datardquo benchmark performs fairly well also for the US and the Colombian samples (the US firms being unlike the other firms in this study listed or delisted companies) The poor performance of Chinese private and delisted firms is associated with very small differences between the medians of the non-failed and failed groups as is shown in Table 6 It is clear that the status ldquodelistedrdquo is not comparable with ldquobankruptcyrdquo When the status is defined as ldquoSTrdquo the predictability of Chinese listed firms is very high Prior studies based on Chinese ST-firms have also demonstrated good predictability (Zhang et al 2010 Wang and Campbell 2010) see footnote 6 earlier Nevertheless this puzzle calls for additional research and modeling work regarding unlisted and delisted Chinese firms 63 Country-level data performance of the Zrsquorsquo-Score Models The heterogeneity of the firms and their distributions in ldquoall datardquo makes it difficult for a uniform all data model to increase AUCs in different countries Table 7 presents the test data AUCs for the different models estimated for each country separately (country-level models) In this table the ldquoall datardquo Zrsquorsquo-Score LR-model acts as the benchmark When the models are estimated from the country data this benchmark will be clearly outperformed by the resulting MDA (Model 1) and LR models (Model 2) only in a couple of countries (Bulgaria France Latvia Spain and Sweden) These results give however only weak support for H1 (obsolescence of the coefficients) at the country level because the effects are not significant In addition the benchmark leads to higher AUCs than Models 1 and 2 at least in Austria Bosnia Ireland Slovenia and United States The differences in AUCs given by Models 1 and 2 are generally small In Romania only Model 1 is clearly outperformed by Model 2 Thus country-level evidence does not support H2 (estimation method) Model 3 (LR-model with year dummies) leads in most countries to clearly higher AUC than the benchmark model This evidence gives support to H3 (bankruptcy year effect) Model 3 leads to lower AUC than the benchmark model in Austria Bosnia Slovenia and United States Model 4 (LR-model
18
with size variables) leads to improved performance almost in every country supporting H4 This improvement is significant however only in the United States where AUC is now 0816 when it is only 0710 for the benchmark model It is notable also in Bulgaria France Latvia Spain and United Kingdom Model 5 (LR-model with age category dummies) gives in several countries higher AUCs than the benchmark model but none of the improvements are significant The positive effect is strong especially in Bulgaria France and Iceland Although there are also negative effects on AUC this evidence weakly supports H5 (age effect) since these negative effects are relatively small Model 6 (LR-model with industry dummies) shows both negative and positive effects on AUCs when compared with the benchmark The only significant effect however is the negative effect found in Austria In Bulgaria and Slovenia AUC has also notably decreased due to the industry dummies However there are notable positive effects on AUC for example in France Iceland Latvia and Sweden Thus the effect is not systematic and gives only weak support to H6 (industry effect) Model 7 (LR-model with all variables) leads to a remarkable increase in AUC as compared with the benchmark model in Colombia Iceland and Unites States It also leads to notable improvements in AUC at least in Belgium Denmark Estonia France Germany Hungary Latvia Norway Spain and United Kingdom There are found negative effects on AUC only in Austria and Slovenia Thus as a conclusion we can state that the classification performance of ldquoall testrdquo data Zrsquorsquo-Score Model can in general remarkably increase in most countries when different effects are taken into account by additional variables This increase is found in most European countries and also in Colombia and United States In China the AUC for the ST sample is extremely high for the Zrsquorsquo-Score LR-model and it can only slightly be improved by additional variables (Table 7 here)
7 Summary of the study and a Suggested Extension
The purpose of this study was to assess the classification performance of the Zrsquorsquo-Score Model originally introduced by Altman (1983) This model was originally applied for small and middle-sized US manufacturing bankrupt and non-bankrupt firms but is applied widely all over the world in different industries and for different size categories for different purposes It is a modified version of the Z-Score Model (1968) developed for listed manufacturing firms The Zrsquorsquo-Score Model is modified to apply for private and non-manufacturing firms as well as manufacturers The literature review section summarizes recent articles in prominent academic journals that have utilized Altmanrsquos Z-Score or Zrsquorsquo-Score models or re-estimated versions of them in empirical analyses These models are typically used as benchmarks in failure prediction modeling studies where one or several alternative methods or approaches (hazard models contingent-claims intelligent algorithms etc) have been tested However in a considerable number of the reviewed studies failure prediction is not the primary focus Instead these models have been largely used as measures of financial strength As to the failure prediction studies the results have been somewhat uneven so that in some studies the models have performed well whereas in others they have been outperformed by competing models None of the reviewed studies were based on comprehensive international comparisons which makes the results difficult to generalize
19
In this study the classification performance of the Zrsquorsquo-Score model is assessed using very large data sets in an international context The purpose is to test how the original version of the Zrsquorsquo-Score Model performs in different countries and how re-estimation using another statistical method and different additional variables affect the classification performance when the data are very heterogeneous For this kind of testing in an international context seven research hypotheses on classification performance are extracted These research hypotheses are tested for all data and also separately for country data (country-level analysis) The hypotheses are associated with the following effects on the classification performance of the Zrsquorsquo-Score Model 1) re-estimation of coefficients 2) estimation method 3) year 4) size 5) age 6) industry and 7) country The estimation data are from 29 countries and the results are validated for 32 countries The countries are mainly from Europe but also three non-European countries are included (China Colombia and United States) The status used in the classification is mainly bankruptcyactive firms but also receivership firms are considered failed In Chinese data also ST (special treatment) and delisted firms are separately analysed as failed firms The analyses at the level of all data show that the original Zrsquorsquo-Score model performs very satisfactorily in an international context The effects of the four financial ratios on performance are well balanced although Book Value of Equity Total Liabilities (BVETD) showed a very small contribution in re-estimation The original model performs very well in several countries such as Poland Finland and China (ST firms) The re-estimation of the coefficients using MDA only marginally improved classification performance supporting weakly the obsolescence hypothesis (H1) or to put it differently shows that the original coefficients are extremely robust across countries and over time This same conclusion holds for the re-estimation of the model using LRA since the performance results are very similar as for MDA (H2) The use of additional variables in the model generally improved classification accuracy of the original model but the results for countries are dependent on the distribution of failed and nonfailed firms When the coefficients are estimated for all data the effects on performance in a country depend on how the distributions in that country correspond to the distributions in all data For all sets of additional variables performance is generally improved but the improvement is not strong and the effects vary country by country Thus evidence gives weak support to effects of all additional variables For the effects of bankruptcy year (H3) and size (H4) the effects are stronger but also the variations in the effects between countries are stronger The effects of age (H5) industry (H6) and country (H7) are marginal When all additional variables are included in the same model performance generally significantly increases but at the same time variations between countries become stronger In summary our evidence thus indicates that the original Zrsquorsquo-Score Model performs well in an international context It is however possible to extract a more efficient country model for most European countries and also for non-European countries using the four original variables accompanied with a set of additional background variables Considering practical applications it is obvious that while a general international model works reasonably well for most countries the classification accuracy may be somewhat improved with country-specific estimation In a country model the information provided even by simple additional variables may help boost the classification accuracy to a much higher level In finance and accounting research failure prediction models may be utilized as risk measures in many different contexts as was revealed by the literature review section Where failure prediction modeling is not the primary focus it would be time-consuming uneconomical and superfluous to first estimate a failure prediction model (or models) and only then proceed to study the phenomenon of interest In these kinds of instances a well tested general model that works reliably
20
and consistently across different countries is highly desirable Based on our empirical tests in this study the original Zrsquorsquo-Score Model and its re-estimated version containing the four Altman (1983) study variables with coefficients re-estimated using a large European data set work consistently well internationally and are easy to implement and interpret An extension to our work could include a comprehensive and more complete analysis of the Altman-Rijken (2011) thesis that a countryrsquos risk of default on its sovereign debt can be assessed by an analysis of the default probabilities of its private sector Our database permits extension of default estimates to non-publicly held firms by far the dominant population in most countries of the world and our analysis can include small and medium size firms as well as larger corporate entities
21
References
Acosta-Gonzaacutelez E Fernaacutendez-Rodriacuteguez F (2014) Forecasting financial failure of firms via genetic algorithms Computational Economics vol 43 p 133ndash157
Agarwal V Taffler R (2008) Comparing the performance of market-based and accounting-based bankruptcy prediction models Journal of Banking and Finance vol 32 p 1541ndash1551
Aktas N de Bodt E Lobez F Statnik J-C (2012) The information content of trade credit Journal of Banking and Finance vol 36 p 1402ndash1413
Allayannis G Brown GW Klapper LF (2003) Capital structure and financial risk Evidence from foreign debt use in East Asia The Journal of Finance vol 58 no 6 p 2667ndash2709
Altman EI (1968) Financial ratios discriminant analysis and the prediction of corporate bankruptcy The Journal of Finance vol 23 no 4 p 589ndash609
Altman EI (1983) Corporate Financial Distress A Complete Guide to Predicting Avoiding and
Dealing with Bankruptcy (Wiley Interscience John Wiley and Sons) also see E Altman amp E Hotchkiss
Corporate Financial Distress amp Bankruptcy 3rd edition John Wiley 2006
Altman EI Saunders A (1998) Credit risk measurement Developments over the last 20 years Journal of Banking and Finance vol 21 p 1721ndash1742
Altman EI Rijken H (2011) Toward a Bottom-Up Approach for Assessing Sovereign Default Risk Journal of Applied Corporate Finance vol 23 no 1 pp 20-31
Balcaen S Ooghe H (2006) 35 years of studies on business failure an overview of the classic statistical methodologies and their related problems The British Accounting Review vol 38 p 63ndash93
Bauer J Agarwal V (2014) Are hazard models superior to traditional bankruptcy prediction approaches A comprehensive test Journal of Banking and Finance vol 40 p 432ndash442
Beaver WH (1966) Financial ratios as predictors of failure Journal of Accounting Research vol 4 p 71ndash111
Beaver WH (1968) Alternative accounting measures as predictors of failure The Accounting Review vol 43 no 1 p 113ndash122
Begley J Ming J Watts S (1996) Bankruptcy classification errors in the 1980s An empirical analysis of Altmanrsquos and Ohlsonrsquos models Review of Accounting Studies vol 1 p 267ndash284
Bharath ST Shumway T (2008) Forecasting default with the Merton distance to default model Review of Financial Studies 21(3) 1339-1369
Butler AW Wan H (2010) Stock market liquidity and the long-run stock performance of debt issuers The Review of Financial Studies vol 23 no 11 p 3966ndash3995
Campbell J Hilscher J Szilagyi J 2008 In search of distress risk Journal of Finance 63 2899ndash2939 Carling K Jacobson T Lindeacute J Roszbach K (2007) Corporate credit risk modeling and the macroeconomy Journal of Banking and Finance vol 31 p 845ndash868
Chava S Jarrow RA (2004) Bankruptcy prediction with industry effects Review of Finance vol 8 p 537ndash569
Chen H Kacperczyk M Ortiz-Molina H (2012) Do nonfinancial stakeholders affect the pricing of risky debt Evidence from unionized workers Review of Finance vol 16 p 347ndash383
22
Clarke J Ferris SP Jayaraman N Lee J (2006) Are analyst recommendations biased Evidence from corporate bankruptcies Journal of Financial and Quantitative Analysis vol 41 no 1 p169ndash196
Clayton MJ Ravid SA (2002) The effect of leverage on bidding behavior Theory and evidence from the FCC auctions The Review of Financial Studies vol 15 no3 p 723ndash750
Das S Hanouna P Sarin A (2009) Accounting-Based versus Market-Based cross-sectional models for CDS spreads Journal of Banking amp Finance vol 33 pp 719-730
Dawkins MC Bhattacharya N Smith Bamber L (2007) Systematic share price fluctuations after bankruptcy filings and the investors who drive them Journal of Financial and Quantitative Analysis vol 42 no 2 p399ndash419
DeLong ER DeLong DM Clarke-Pearson DL (1988) Comparing the areas under two or more correlated receiver operating characteristic curves A nonparametric approach Biometrics 44(3) 837-845
Dichev I (1998) Is the Risk of Bankruptcy a Systematic Risk Journal of Finance vol 53 p 1131-1147
Dimitras AI Zanakis SH Zopounidis C (1996) Theory and methodology A survey of business failures with an emphasis on prediction methods and industrial applications European Journal of Operational Research vol 90 p 487ndash513
Eisdorfer A (2008) Empirical evidence of risk shifting in financially distressed firms The Journal of Finance vol 63 no 2 p 609ndash637
Fich EM Slezak SL (2008) Can corporate governance save distressed firms from bankruptcy An empirical analysis Review of Quantitative Finance and Accounting vol 30 p 225ndash251
Franzen LA Rodgers KJ Simin TT (2007) Measuring distress risk The effect of RandD intensity The Journal of Finance vol 62 no 6 p 2931ndash2967
Grice JS Dugan MT (2001) The limitations of bankruptcy prediction models Some cautions for the researcher Review of Quantitative Finance and Accounting vol 17 p 151ndash166
Grice JS Jr Dugan MT (2003) Re-estimations of the Zmijewski and Ohlson bankruptcy prediction models Advances in Accounting vol 20 p 77ndash93
Grice JS Ingram RW (2001) Tests of the generalizability of Altmanrsquos bankruptcy prediction model Journal of Business Research vol 54 p 53ndash61
Griffin JM Lemmon ML (2002) Book-to-market equity distress risk and stock returns The Journal of Finance vol 57 no 5 p 2317ndash2336
Hillegeist SA Keating EK Cram DP Lundstedt KG (2004) Assessing the probability of bankruptcy Review of Accounting Studies vol 9 p 5ndash34
Hirsch B T and Macpherson D A (2003) Union membership and coverage database from the Current Population Survey Note Industrial and Labor Relations Review 56 349ndash354
Ho C-Y McCarthy P Yang Y Ye X (2013) Bankruptcy in the pulp and paper industry marketrsquos reaction and prediction Empirical Economics vol 45 p 1205ndash1232
Holder-Webb LM Wilkins MS (2000) The incremental information content of SAS No 59 Going-concern opinions Journal of Accounting Research vol 38 no 1 p 209ndash219
Hosmer D Lemeshow S (1989) Applied Logistic Regression (Wiley Interscience Prentice Hall International)
Jackson RHG Wood A (2013) The performance of insolvency prediction and credit risk models in the UK A comparative study The British Accounting Review vol 45 p 183ndash202
23
Karels G Prakash AJ (1987) Multivariate normality and forecasting of business bankruptcy Journal of Business Finance and Accounting 14(4) 573-593
Kieschnick R La Plante M Moussawi R (2013) Working capital management and shareholdersrsquo wealth Review of Finance vol 17 p 1827ndash1852
Kumar PR Ravi V (2007) Bankruptcy prediction in banks and firms via statistical and intelligent techniques ndash A review European Journal of Operational Research vol 180 p 1ndash28
Kwak W Shi Y Cheh JJ Lee H (2005) Multiple criteria linear programming data mining approach An application for bankruptcy prediction Data Mining and Knowledge Management Lecture Notes in Computer Science vol 3327 p 164ndash173
Li M-YL Miu P (2010) A hybrid bankruptcy prediction model with dynamic loadings on accounting-ratio-based and market-based information A binary quantile regression approach Journal of Empirical Finance vol 17 p 818ndash833
Lyandres E Zhdanov A (2013) Investment opportunities and bankruptcy prediction Journal of Financial Markets vol 16 p 439ndash476
Merkevicius E Garšva G Girdzijauskas S (2006) A hybrid SOM-Altman model for bankruptcy prediction International Conference on Computational Science Lecture Notes in Computer Science vol 3994 p 364ndash371
Ohlson J (1980) Financial ratios and probabilistic prediction of bankruptcy Journal of Accounting Research vol 18 p 109-131
Ooghe H Balcaen S (2007) Are failure prediction models widely usable An empirical study using a Belgian dataset Multinational Finance Journal 11(12) 33-76
Philippe and Partners and Deloitte and Touche Corporate Finance (2002) Bankruptcy and a Fresh Start Stigma on Failure and Legal Consequences of Bankruptcy (International Insolvency Institute Brussels Belgium)
Philosophov LV Batten JA Philosophov VL (2008) Predicting the event and time horizon of bankruptcy using financial ratios and the maturity schedule of long-term debt Mathematics and Financial Economics vol 1 p 181ndash212
Pindado J Rodrigues L de la Torre C (2008) Estimating financial distress likelihood Journal of Business Research vol 61 p 995ndash1003
Piotroski JD (2000) Value investing The use of historical financial statement information to separate winners from losers Journal of Accounting Research vol 38 Supplement Studies on accounting information and the economics of the firm p 1ndash41
Reisz AS Perlich C (2007) A market-based framework for bankruptcy prediction Journal of Financial Stability vol 3 p 85ndash131
Shen C-H Chen Y-K Huang B-Y (2010) The prediction of default with outliers Robust logistic regression Handbook of Quantitative Finance and Risk Management p 965ndash977
Shumway T (2001) Forecasting bankruptcy more accurately A simple hazard model Journal of Business vol 74 p 101-124 Singhal R Zhu Y (2013) Bankruptcy risk costs and corporate diversification Journal of Banking and Finance vol 37 p 1475ndash1489
Smith M Liou D-K (2007) Industrial sector and financial distress Managerial Auditing Journal vol 22 Issue 4 p 376 - 391
24
Sun L (2007) A re-evaluation of auditorsrsquo opinions versus statistical models in bankruptcy prediction Review of Quantitative Finance and Accounting vol 28 p 55ndash78
Taffler RJ (1984) Empirical models for the monitoring of UK corporations Journal of Banking and Finance vol 8 Issue 2 p 199-227
Uhde A Heimeshoff U (2009) Consolidation in banking and financial stability in Europe Empirical evidence Journal of Banking and Finance vol 33 p 1299ndash1311 Vassalou M Xing Y (2004) Default Risk in Equity Returns Journal of Finance vol 59 p 831-868
Wang Y and Campbell M (2010) Business failure prediction for publicly listed companies in China Journal of Business and Management 16(1) 75-88
Wu Y Gaunt C Gray S (2010) A comparison of alternative bankruptcy prediction models Journal of Contemporary Accounting and Economics vol 6 p 34ndash45
Xu M Zhang C (2009) Bankruptcy prediction the case of Japanese listed companies Review of Accounting Studies vol 14 p 534ndash558
Zhang L Altman EI and Yen J (2010) Corporate financial distress diagnosis model and application in credit rating for listing firms in China Frontiers of Computer Science in China 4(2) 220-236
Zmijewski ME (1984) Methodological Issues Related to the Estimation of Financial Distress Prediction Models Journal of Accounting Research vol 22 Studies on Current Econometric Issues in Accounting Research p 59-82
25
Tables Table 1 Summary of the literature review of Z-Score Models from year 2000
Authors and year of publication
Period and population or sample Goal methodology and z-score application
Main conclusions
Holder-Webb LM Wilkins MS (2000)
217 firms filing for bankruptcy identified by NAARS or Wall Street Journal between 1975-1996
(M) Evaluation of the impact of implementation of auditing standard on going concern on information value for investors (bankruptcy surprise and audit opinion were assessed by investorsrsquo reactions to bankruptcy news in the event window) Authors implemented BKPRO variable based on z-score in the model as a ratio-based measure of financial distress
Bankruptcy surprise was greater in case of a clean going concern opinion The results hold after controlling for eg firmrsquos level of financial distress
Piotroski JD (2000) 14043 firms with high book-to-market (BM) values across 21 years (1976 -1996) in Compustat database
(M) The application of a simple accounting-based fundamental analysis strategy as a tool for broad portfolio management of high BM firms The author used z-score as financial distress measure in order to justify his own model
The author concluded that firms with lower level of financial distress earned significantly stronger future returns than the highly distressed firms Mean return for the investor involved in the high BM assets could be increased by selection of firms that are financially strong
Grice JS Ingram RW (2001)
972 companies for 1985ndash1987 in the estimation sample (148 distressed and 824 non-distressed) and 1002 companies for 1988ndash1991 in the prediction sample (148 distressed and 854 non-distressed) in Compustat database
(V) Verification of z-score model with 3 questions Is the model as useful as in the previous periods Is the model useful for predicting bankruptcy of non-manufacturing firms as it was for manufacturing firms Is the model useful for predicting financial stress other than bankruptcy
Prediction accuracy of the model declined over time and coefficients of the model significantly changed which means that the relation between financial ratios and financial distress has changed over time Model was sensitive to industry classification (better for manufacturing firms) and not sensitive to the type of financial distress Similar conclusions were drawn in case of Ohlsonrsquos (1980) and Zmijewskirsquos (1984)
26
model by Grice JS Dugan MT (2001)
Clayton MJ Ravid SA (2002)
Federal Communication Commission (FCC) spectrum auctions for 1994-1995 together with firm-specific and region-specific variables
(M) The authors examined the link between capital structure of firms and their bidding behaviour The authors used z-score as a proxy for financial strength and alternative measure of default risk
Empirical analysis showed that as the firmrsquos and the competitorrsquos debt level increase firms tend to submit lower bids which supported authors theoretical model
Griffin JM Lemmon ML (2002)
Sample similar to Fama and French (1992) Non-financial NYSE Nasdaq Amex stocks monthly returns for stocks with nonnegative book value of equity from July 1965 to June 1996
(R) The authors investigated relationship between book-to-market equity distress risk and stock returns They used Ohlsonrsquos o-score but additionally run robustness check with the use of z-score as measure of distress risk
In case of firms with the highest risk of distress the difference in return between high and low book-to-market equity securities was more than twice higher than in case of other groups
Allayannis G et al(2003)
SBC Warburg Dillon Read database with local foreign and synthetic local (hedged foreign) currency debt for 327 largest East Asian non-financial companies from 1996-1998
(M) The first research issue was to check determinants of firmrsquos choice of debt currency local foreign or synthetic local The second research issue was related to the relation of the type of debt and financial performance during the Asian crisis Asian financial crisis was treated as natural experiment They used modified z-score (2000) as one of the financial performance measures
The authors found no evidence that unhedged foreign debt was the cause of poor performance However the use of synthetic currency caused poor stock market performance because of the derivatives market illiquidity during the crisis
Hillegeist SA et al (2004)
Sample covered 78100 firm-year observations (representing 14303 individual industrial firms) for 1980-2000 period with 756 initial bankruptcies
(V) The authors confronted Altmanrsquos z-score and Ohlsonrsquos o-score (with original and up-dated coefficients) with the model based on BSM option pricing model (BSM-Prob) They used relative information content tests to compare the out-of-sample performance
BSM-Prob outperformed accounting based models Conclusions were robust to various modifications of both accounting based models BSM-Prob was not dependent on time horizon and difference in accounting standards in various countries Thus it allowed for international comparisons
Chava S Jarrow RA (2004)
US publicly listed companiesrsquo monthly and yearly data for 1962-1999 period with 1461 bankruptcies
(V) The authors employed extended bankruptcy database to prove the superiority of Shumwayrsquos model (2001) over Altmanrsquos (1968) and Zmijewskirsquos
In case of Shumwayrsquos model 744 (in the first decile) of the bankruptcies were correctly identified for Altmanrsquos model ndash it was 632 and for Zmijewskirsquos model - 432
27
(1984) models Three other goals were included into their research The authors re-estimated models over the 1962ndash1990 period and forecasted bankruptcies over 1991ndash1999
Market-based model outperformed also in case of ROC curve Market variables were better in predicting bankruptcy than accounting variables and the use of monthly data improved prediction
Kwak etal (2005) Data from 1992 to 1998 for bankrupt firms and 584 times more of control firms for the same period Standard and Poorrsquos database was used for US companies from major 3 stock exchanges
(V) Multiple Criteria Linear Programming (MCLP) was used to model 5 Altmanrsquos and 9 Ohlsonrsquos variables in order to apply it for bankruptcy prediction
In case of both models overall predication rate of Ohlsonrsquos model is similar to Altmanrsquos model (8676 vs 8856) with more control firms The MCLP approach performed better than Altmanrsquos model and give similar or better results than Ohlsonrsquos model
Merkevicius E et al (2006)
Data from two sources EDGAR PRO Online Database (ldquotraindatardquo with 1108 records) and database form Lithuanian bank (ldquotestdatardquo with 742 records) for year 2004
(V) The hybrid model was developed with the use of Altmanrsquos z-score model with the changed weights for variables and self-organizing map which was an unsupervised learning artificial neural network (called SOM-Altman model)
Hybrid SOM-Altmanrsquos model reached the prediction rate of 9235 It is easy to adopt for different data sets also from developed and developing countries
Clarke J et al (2006) The initial sample of 995 firms that filed for bankruptcy from 1995 to 2011 Analysts recommendations were taken from IBES database In the final sample the authors used 289 bankrupt firms and their non-bankrupt matches
(M) The research focus was to test if there is a bias in analystsrsquo recommendations for firms that filed for bankruptcy (chapter 11) Altmanrsquos z-score was calculated two years preceding the bankruptcy year
Analysts actively revised their recommendations downward in case of firms that faced bankruptcy The recommendation declined from ldquobuyrdquo about 2 years prior to bankruptcy The authors found no evidence of analystsrsquo bias and conflict of interest
Reisz AS Perlich C (2007)
The authors used 5784 industrial firms for 1988-2002 which gave 33238 non-bankrupt and 799 bankrupt firm-years
(V) The authors used barrier option model for bankruptcy prediction (DOC) and compared its discriminatory power with other market-based (BSM and KMV) and accounting-based models (Altmanrsquos z-score and zrdquo-score developed in 1993 for private firms)
The authors proved domination of Altmanrsquos z-score and zrdquo-score for short term bankruptcy prediction For medium- and long-term bankruptcy prediction DOC outperformed other models
28
Sun L (2007) US public traded firms on the major stock exchanges from 1991 to 2002 The final bankruptcy training sample consists in 344 firms (1657 firm-years) and the final non-bankruptcy training sample ndash 3183 (20918 firm-years) The test samples used respectively 243 and 1165 firms
(M) The main purpose of the research was to compare the performance of auditorsrsquo going concern opinions with the results of bankruptcy prediction models The author improved previous research by using a composite score of financial distress stock-market variables industry failure rate and applying hazard model Altmanrsquos z-score was one of the 4 criteria (besides auditorrsquos opinion Zmijewskirsquos probability and stock return) used as a ldquostressrdquo variable In the final model the author used Zmijewskirsquos probability as the best
The hazard model outperformed auditorrsquos going concern opinions so statistical models could be of any help for auditorsrsquo opinions Market variables had significant explanatory power for auditorrsquos opinion while industry failure rate did not have it Auditorsrsquo going concern opinions had incremental prediction ability beyond traditional financial ratios a composite measure of financial distress market variables and industry failure rate
Franzen LA et al (2007)
US firms listed on the major stock exchanges for the period 1981-2004 with sufficient data to compute accounting-based measures of financial distress RampD intensity and portfolio returns The number of firms filing for bankruptcy was 929
(M) The authors focused on the impact of RampD spending on financial distress prediction They used accounting based models with the special focus on Ohlsonrsquos o-score since it included only accounting based measures Altmanrsquos z-score was used for supporting purposes since it included also market data
Accounting-based measures less accurately classify firms with higher RampD spending In case of adjustment for conservative accounting treatment of RampD and tax effects the classification was better Z-score was used as a benchmark Z-score was more robust to the changes that distort the o-score due to the use of market value Adjustment of z-score for the conservative treatment of RampD improved the classification
Dawkins MC etal (2007)
272 US firms that filed for bankruptcy between 1993 and 2003 traded on the major stock exchanges Investorsrsquo intraday transactions were taken from Trade and Quote database (TAQ)
(M) The authors investigated pattern of returns and investors trades around and shortly after Chapter 11 bankruptcy announcement They divided the investigated period into bull and bear markets The authors used five event windows Altmanrsquos z-score was used as a measure of firmrsquos financial condition
Large traders were dominating transactions around and after bankruptcy filing The authors found a modest negative correlation between the price plunge and post-filing period returns Investorsrsquo reactions were anomalously optimistic in the period of a bull market
29
Agarwal V and Taffler R (2008)
Non-finance UK firms listed on the LSE at any time during the period 1985-2001 The final sample covered 2006 firms (15384 firm-years) and 103 failures
(V) In the paper the authors compared accounting-based models and market based models in terms of predictive ability information content and bank credit portfolio profitability Accounting- based models were represented by Tafflerrsquos (1984) UK z-score based on Altmanrsquos (1968)
In the case of the predictive ability there was a little difference between those two types of models however both carried unique information about firm failure The use of the z-score model generated much higher risk-adjusted return profit and return on risk-weighted assets
Philosophov LV et al (2008)
No sample of non-bankrupt firms 100 US non-financial firms that filed for bankruptcy between 1997 and 2002
(V) The authors appliedmulti-alternative decision rules for bankruptcy prediction (BMP) Bayesian-type forecasting rules used debt repayment schedule and traditional financial ratios Results of the new approach were compared with Altmanrsquos z-score
The authors have identified 4 factors important for multiperiod approach Two of them reflect quantity and quality of debt and the two others the ability to pay the debt back Those factors are similar to as those proposed in the z-score The set of factors did not change however the predictive ability decreased over time BPM outperformed z-score in total probability of correct predictions while ldquofalse alarmrdquo was comparable
Fich EM Slezak SL (2008)
The sample includes 781 companies with 34 that filed for bankruptcy The period covers 1992-2000 Except the availability of financial and market data the availability of corporate governance data from Edgar data retrieval system was a prerequisite
(M) The authors explored how governance characteristics affect firmrsquos ability to avoid bankruptcy and power of accountingfinancial information to predict bankruptcy with the use of hazard models Altmanrsquos z-score was applied as a measure of firmrsquos financial distress together with interest coverage ratio (ICR)
Corporate governance characteristics are important for bankruptcy prediction About 25-30 of the variation in the occurrence of bankruptcy was explained by governance characteristics Smaller and independent boards with a higher ratio of non-inside directors and with larger ownership stakes of inside directors are more effective at avoiding bankruptcy if the firm became distressed
Eisdorfer A (2008) US companies traded on the major stock exchanges for period from 1963 to 2002 representing 7114 firms (52112 firm-years)
(M) The author tested two hypotheses volatility has a positive effect on distressed firmsrsquo investment and investments of these firms generate less
In case of first hypothesis z-score results were stronger than those based on KMV but in case of the second hypothesis KMV results were stronger Empirical tests indicated that
30
value during high uncertainty periods with the use of real option approach Altmanrsquos z-score and KMV model were used as a measure of firmrsquos financial distress
risk-shifting considerations are taken into account by distressed firms
Pindado J et al (2008)
Sample covered 1583 US companies (15702 observations) and 2250 companies (18160 observations) for the other G-7 countries for the period from 1990 to 2002 from Compustat The data panel was unbalanced
(R)The authorsrsquo developed ex-ante model for estimation of financial distress likehood (FDL) and presented financially (not legally) based definition of distress Re-estimated Altmanrsquos z-score was used for robustness check
The model is stable in terms of magnitude sign and significance of the coefficients and it provides a measure of FDL more robust to time and countries than other models In case of the re-estimated z-score model only profitability and retained earnings maintained their significance for different years and countries
Xu M Zhang C (2009)
Non-financial Japanese listed companies from 1992 to 2005 The number of firms was 3510 with 76 bankruptcies
(V) The authors applied Altmanrsquos z-score Ohlsonrsquos o-score and Mertonrsquos distance-to-default (d-score) to Japanese firms in order to check if the models are useful for bankruptcy prediction in Japan They also ldquomergedrdquo the models into c-score They introduced Japan-unique variables in order to check if corporate structure variables have impact on the probability of bankruptcy (x-score)
The models were also useful for Japanese firms in bankruptcy prediction but the market-based model was more successful The developed c-score and x-score models improved bankruptcy prediction
Li M-YL Miu P (2010)
Non-financial firms from Compustat database from 2nd Quarter 1996 to 4th Quarter 2006 The sample covered 73 failed firms and 138 non-failed firms with at least rating B during the whole period
(M) Altmanrsquos z-score and Mertonrsquos distance-to-default (DD) were used as variables in the model The authors developed hybrid bankruptcy prediction model with constant and dynamic loadings with the use of binary quintile regression (BQR)
The results of the research pointed out the superiority of the model with dynamic loadings In the case of firms with relatively poor credit quality the prediction accuracy might be improved by putting more attention to DD and less to the z-score In case of firms with relatively good credit quality the recommendations are the opposite eg more attention should be put to the z-score
31
Wu Y et al (2010) NYSE- and AMEX-listed Compustat non-financial firms for the period from 1980 to 2006 The final sample covered 50611 firm-years with 887 bankruptcies and 49724 non-bankrupt firm-years
(V) Five models (Altman 1968 Ohlson 1980 Zmijewski 1984 Shumway 2001 Hillegeist et al 2004) from the literature are used by the authors in order to evaluate their performance with an up-to-date data set Based on them the authors build their own integrated model (multi-period logit model with expanded set of variables)
The integrated model using accounting and market data as well as firmsrsquo characteristics outperformed the other models Altmanrsquos z-score performed poorly in comparison to the other 4 models Shumwayrsquos model outperformed model of Hillegeist et al performed adequately and Ohlsonrsquos and Zmijewskirsquos models performed adequately but their performance deteriorated over time
Shen C-H et al (2010)
Non-financial companies listed on the Taiwan Stock Exchange covering the period from 1999 to 2004 There were 52 default companies and 156 non-default companies in the sample
(V) The authors applied a robust logit method to build up an empirical model based on Altmanrsquos z-score (one variable was omitted retained earnings to total assets) They took into account outliers which so far have been omitted in the models The results of robust logit method were compared with logit method
In the case of in-the-sample forecasts robust logit models preformed better than the logit model However in the case of out-the-sample forecast superiority of robust logit model disappeared Robust logit model was more aggressive in assigning firms as default
Butler AW Wan H (2010)
New debt offerings from 1975-1999 (4293 offerings within 632 convertible debt issue) Sample covered non-regulated utility and non-financial companies listed on major US stock exchanges The first offering in the sample period for a particular firm was used and the other offerings from the same firms within the following five years were excluded from the sample
(M) The aim of the paper was to assess long-term stock performance of debt and convertible debt issuers The authors revised the results of the previous research on the stock returns of bond issuing firms According to the authors previous models omitted liquidity factor Altmanrsquos z-score was used as a proxy for financial distress besides momentum as another matching criterion
Introduction of the liquidity factor into the model erased long-run underperformance of debt and convertible debt issuers Momentum and Altmanrsquos z-score did not erase this underperformance
Aktas N et al (2012) US listed non-financial firms with z-score higher than the median of the population from 1992 to 2007 The
(M) The article investigated the relationship between the use of trade credit and the quality of firmsrsquo
According to the empirical study the change in the trade credit signaled the future positive change in firmrsquos performance
32
sample consisted in 15928 firm-years from 2096 firms
investments Altmanrsquos z-score was used as one of three proxies for measuring the quality of firmrsquos investment projects (additionally return on assets and long-term abnormal returns) The authors developed a theoretical model for trade credit decision with the use of strategic game with imperfect information as well as empirical study
Empirical results supported conclusions from the theoretical model In the case of the use of next period change of the z-score the authors confirmed both CEO incentive and entrenchment however in the case of two other proxies only CEO incentive
Chen H et al (2012) US non-financial companies issuing debt securities from Lehman Brothers Bond Database data on unionization described in Hirsch and Macpherson (2003) supported by financial and demographic data The period covered years from 1984 to 1998 The sample consisted in 996 firms and 5557 firm-years observations
(M) The authors focused on the impact of ldquounionized workersrdquo on the pricing of corporate debt Altmanrsquos z-score was used as one of 5 measures of distress (accompanied by interest coverage book equity Ohlsonrsquos o-score and default measure developed by Bharath and Shumway in 2008)
The authors drew 4 conclusions In the case of more ldquounionizedrdquo industries the yield on bonds is lower the impact is stronger in firms with weak financial standing highly ldquounionizedrdquo firms invested less in RampD than in physical assets they were less likely to be the acquisition target According to the authors ldquounionized workersrdquo protected bondholdersrsquo and other fixed claimants wealth
Jackson RHG Wood A (2013)
LSE-listed non-financial UK firms The sample consisted in 101 failed firms of which failure was registered from 30 Sept 2000 to 31 Dec 2009 and 6494 non-failed firm-years from 1 Jan 2000 to 31 Dec 2009
(V) The authors tested 13 different models of bankruptcy prediction and assessed their efficacy with the use of ROC curve They selected 3 single variable models 3 accounting-based models (with Altmanrsquos z-score) in two versions with up-dated coefficients and neural network approach 4 contingent claims models
Contingent claims models outperformed the other models The best four models are contingent claims models based on European call and barrier options In the case of application of the neural network to accounting based models the predictive ability improved however was still lower than in case of market-based models
Singhal R Zhu Y (2013)
US non-financial firms Final sample covered 769 bankruptcy filings between 1 Jan 1991 to 31 Dec 2007 Failed firms were divided to two groups focused (622) and diversified (147)
(M) The focus of the study was to check bankruptcy risk and bankruptcy costs in the case of focused vs diversified firms Altmanrsquos z-score was used as a measure of financial distress
The mean and median z-score for diversified groups were higher than for focused groups The Z-score was highly correlated with the leverage in the authorsrsquo model Diversified firms represented a lower risk of bankruptcy however they underperformed focused firms
33
in other areas (like inefficient segment investment and longer time in the bankruptcy procedure what incurred higher bankruptcy costs)
Lyandres E Zhdanov A (2013)
US companies (financial and non-financial) listed on major stock-exchanges The sample covered period from 1985 to 2005 The number of bankruptcies was 948 (compiled from different sources like Thomson Financial and T Shumwayrsquos database) and the number of firm-years was 146836
(V) The authors posed the question if the inclusion of variables related to investment opportunities improved the predictive power of three models (Altmanrsquos z-score Zmijewskirsquos and Shumwayrsquos models) They used 3 proxies for investment opportunities (market-to-book value-to-book RampD-to-assets)
The measures of investment opportunities were related to the likehood of default Inclusion of either of three investment opportunities measures improved modelsrsquo out-of-sample forecasting ability
Ho C-Y et al (2013) North America publicly listed pulp and papers firms Sample includes 122 firms within 12 that filed for bankruptcy The period from 1990 to 2009 Data were compiled from different sources (like Compustat CRSP WRDS)
(R) The paper investigated bankruptcy prediction with the use of financial ratios and investorsrsquo reactions to bankruptcy filing The authors used Ohlsonrsquos model (original and re-estimated) to predict bankruptcy in the pulp and paper industry Altmanrsquos z-score (original and re-estimated) was used for robustness check
Investorsrsquo suffered significant losses during the month a bankruptcy occurred O-scores of failed firms were higher than in case of non-failed firms 1 to 2 year before the bankruptcy Re-estimated Ohlsonrsquos model performed better than the original In the case of Altmanrsquos z-score the re-estimated model performed better due to the reduction of Type II errors that occurred in the original one In both cases models were useful for bankruptcy prediction
Kieschnick R et al (2013)
Non-financial US companies from 1990 to 2006 There were 3786 companies in the sample (yearly average)
(M) The paper focused on the relationship between working capital management and shareholdersrsquo wealth as well as their determinants Altmanrsquos original (1968) and revised (2000) z-score were used as a measure of the financial distress
The authors concluded that ldquoincremental dollar invested in net operating capital is worth less than an incremental dollar held in cash for the average firmrdquo The impact on the shareholder value was determined by sales expectations access to external capital bankruptcy risk and debt load The higher the z-score was the more valuable its investment in working capital
34
Acosta-Gonzaacutelez E
Fernaacutendez-Rodriacuteguez
F (2014)
Spanish building industry firms For model estimation the sample covered 93 firms that failed in 2004 and 257 randomly selected non-failed firms for the period from 2000 to 2004 For ex-ante forecast accounting information from 2005 for randomly selected 400 out of which 80 failed in 2007
(V) The authors used genetic algorithms with Schwarz information criterion (GASIC) for variables selection (out of 32 preselected ratios) combined with the logit model for bankruptcy prediction Altmanrsquos z-score model was used as one of two benchmarks for authorsrsquo model evaluation
One step ahead forecast Altmanrsquos model was better in predicting failed firms but the type II error was high two and three steps ahead forecasts were similar in terms of failed firms but in the case of non-failed Altmanrsquos model prediction was worse four steps ahead forecasts GASIC model outperformed in the case of failed firms and was comparable in the case of non-failed firms
Note Based on the own review of studies
35
35
Table 2 Number of observations by country
Estimation data Test data
Country Non-failed Failed Non-failed Failed
Austria (AT) 7430 55 7526 44
Belgium (BE) 179979 2994 179818 2944
Bosnia (BA) 29391 35 29139 32
Bulgaria (BG) 50041 48 42351 44
China (CN) 39315 198
China delisted dataset
16291 29
China ST data 846 16 1020 16
Colombia (CO) 8366 139 6982 125
Greece (GR) 51763 28
Croatia (HR) 59541 249 58478 275
Czech Republic (CZ) 92835 556 92562 564
Denmark (DK) 167934 1334 168538 1398
Estonia (EE) 34313 234 34196 242
Finland (FI) 90878 481 91227 459
France (FR) 160749 6124 161653 6318
Germany (DE) 98814 910 99496 921
Hungary (HU) 19421 303 20155 313
Iceland (IS) 17399 248 17624 243
Ireland (IE) 6665 121 6406 139
Italy (IT) 167113 8101 166258 8124
Latvia (LV) 8064 433 8241 477
Lithuania (LT) 10000 56
Netherlands (NL) 20885 154 15854 147
Norway (NO) 172467 1294 170985 1206
Poland (PL) 87200 291 86233 264
Portugal (PT) 180114 3390 178646 3422
Romania (RO) 161992 97 164259 93
Russian Federation (RU) 116903 2534 115711 2481
Serbia (RS) 100100 68
Slovakia (SK) 7856 120 7788 124
Slovenia (SI) 14419 59 14081 41
Spain (ES) 156746 3036 158122 2991
Sweden (SE) 169810 2256 169999 2314
Ukraine (UA) 133342 1787 133980 1765
United Kingdom (GB) 171493 760 170930 716
UK (GB) liquidation dataset
342423
4990
United States (US) 9557 56 9929 53
In total 2602563 38215 3148079 43664
36
36
Table 3 Descriptive statistics (all data)
WCTA RETA EBITTA BVETD
Statistic Non-failed Failed Non-failed Failed
Non-failed Failed
Non-failed Failed
Median 0152 -0059 0189 -0024 0041 -0020 0451 0025
Mean 0147 -0213 0188 -0317 0055 -0108 3594 0703
Standard deviation 0442 0604 0509 0767 0227 0296 11499 5712
Upper quartile 0420 0142 0476 0087 0131 0042 1548 0215
Lower quartile -0040 -0440 0011 -0450 -0008 -0208 0100 -0240
Maximum 0956 0956 0958 0958 0785 0785 68606 68606
Minimum -1637 -1637 -2453 -2453 -0828 -0828 -0649 -0649
Legend WCTA = Working CapitalTotal Assets
RETA = Retained EarningsTotal Assets EBITTA = EBITTotal Assets
BVETD = Book Value of EquityTotal Liabilities SALTA = SalesTotal Assets
37
37
Table 4 The coefficients of the different models estimated for all data
Coefficients for different statistical models
Variable Zrsquo-Score
Model 1
Model 2
Model 3 Model 4
Model 5
Model 6
Model 7 Model 8
Constant 325 -0042 0035 0207 -13466 0007 0048 0049 -13302
WCTA 656 -0561 -0495 -0483 -0441 -0487 -0540 -0496 -0459
RETA 326 -0724 -0862 -0891 -1146 -0846 -0859 -0863 -1160
EBITTA 672 -1791 -1721 -1790 -1619 -1757 -1695 -1717 -1682
BVETD 105 -0021 -0017 -0016 -0012 -0017 -0016 -0017 -0013
Year dummies
Year 2008 -0055 -0034
Year 2009 -0179 -0150
Year 2010 -0666 -0631
Size variables Total assets (log)
1830
1837
Total assets squared (log)
-0061
-0061
Age dummies
Less than 6 years 0135 0186
Over 12 years -0058 -0099
Country risk SP Country rating rank
-0003 -0014
Industry dummies
Restaurants and hotels -0653 -0628
Construction 0445 0365
Whole sale and retailing -0112 -0157
Agriculture -0180 -0176
Manufacturing 0139 0095
Energy and water production -0454 -0472
Information technology -0913 -0915
Significance
38
38
Coefficients are statistically significant at 00001
Models
Zrsquo-Score = Original Altman (1983) Zrsquo-Score Model coefficients Model 1 = The MDA model
Model 2 = The LR model Model 3 = The LR model estimated for all data with year dummies
Model 4 = The LR model estimated for all data with size variables Model 5 = The LR model estimated for all data with age category dummies Model 6 = The LR model estimated for all data with industry dummies Model 7 = The LR model estimated for all data with country risk rank Model 8 = The LR model estimated for all data with all variables
39
39
40
40
Table 5 Test data AUCs for different countries based on all data model versions Comparisons are with AUC of the LR model estimated for all data (benchmark)
Test data AUC for different models
Country Benchmark Model 1 Model 2 Model 3 Model 4 Model 5 Model 6 Model 7 Model 8
All Data 0748 0743---- 0745---- 0752++++ 0760++++ 0748+++ 0751++++ 0749++++ 0771++++
Countries with estimation data
Austria (AT) 0800 0788 0797 0805 0818+ 0814+ 0782 0800 0819
Belgium (BE) 0772 0760 0770 0777 0747 0777 0765 0772 0758
Bosnia (BA) 0862 0805 0857 0776 0863 0847 0855 0862 0784
Bulgaria (BG) 0684 0630 0680 0654 0691 0680 0659 0684 0632
China ST companies 0985 0911---- 0983 0958- 0977 0978 0987 0985 0968
Colombia (CO) 0726 0724 0727 0715 0758 0728 0726 0726 0757
Croatia (HR) 0844 0812 0839 0803 0837 0835 0832 0844 0801
Czech Republic (CZ) 0811 0813 0811 0819 0828 0807 0820 0811 0838
Denmark (DK) 0803 0798 0800 0781 0813 0802 0801 0803 0796
Estonia (EE) 0823 0827 0823 0847 0866 0826 0833 0823 0890
Finland (FI) 0867 0864 0866 0835 0862 0870 0878 0867 0853
France (FR) 0739 0723 0735 0749 0771 0741 0762 0739 0799
Germany (DE) 0673 0658 0666 0695 0656 0684 0677 0673 0688
Hungary (HU) 0742 0746 0740 0660 0738 0755 0735 0742 0696
Iceland (IS) 0664 0674 0666 0694 0678 0673 0672 0664 0716
Ireland (IE) 0679 0672 0676 0708 0677 0681 0688 0679 0712
Italy (IT) 0806 0799 0804 0833 0835 0806 0799 0806 0849
Latvia (LV) 0678 0691 0678 0704 0676 0686 0698 0678 0724
Netherlands (NL) 0752 0754 0750 0775 0769 0754 0746 0752 0787
Norway (NO) 0716 0694 0713 0658 0682 0720 0715 0716 0645
41
41
Poland (PL) 0903 0904 0904 0908 0902 0903 0899 0903 0904
Portugal (PT) 0741 0724 0736 0749 0773 0738 0755 0741 0785
Romania (RO) 0758 0740 0754 0709 0749 0755 0748 0758 0703
Russian Federation (RU) 0811 0802 0812 0843 0799 0807 0799 0811 0814
Slovakia (SK) 0777 0774 0776 0780 0811 0769 0786 0777 0808
Slovenia (SI) 0737 0725 0733 0674 0740 0747 0718 0737 0721
Spain (ES) 0734 0713 0732 0707 0793 0728 0753 0734 0774
Sweden (SE) 0813 0801 0809 0799 0784 0817 0823 0814 0800
Ukraine (UA) 0708 0714 0710 0715 0721 0708 0702 0708 0722
United Kingdom (GB) 0699 0719 0699 0686 0736 0695 0706 0699 0729
United States (US) 0710 0701 0711 0709 0722 0705 0716 0710 0723
Countries only in test data
European
Greece (GR) 0715 0670 0702 0725 0711 0713 0717 0715 0718
Lithuania (LT) 0767 0782 0767 0764 0768 0769 0775 0767 0778
Serbia (RS) 0736 0713 0730 0603- 0826 0720 0753 0736 0738
United Kingdom Liquidation set 0606 0621 0603 0620 0618 0610 0607 0607 0635
Non-European
China (CN) 0558 0570 0557 0572 0543 0554 0567 0558 0556
China Delisted companies 0529 0546 0519 0563 0740++++ 0542 0520 0529 0707+++
Significance AUC better than benchmark 00001 = ++++ 0001 = +++ 001 = ++ 01 = +
AUC worse than benchmark 00001 = ---- 0001 = --- 001 = -- 01 = - Models
Benchmark = The LR model estimated for all data with Zrsquorsquo-model (1983) variables Model 1 = The original Altman (1983) Zrsquorsquo-Score Model
Model 2 = The MDA model estimated for all data Model 3 = The LR model estimated for all data with year dummies
42
42
Model 4 = The LR model estimated for all data with size variables Model 5 = The LR model estimated for all data with age category dummies Model 6 = The LR model estimated for all data with industry dummies Model 7 = The LR model estimated for all data with country risk rank Model 8 = The LR model estimated for all data with all variables
43
43
Table 6 Differences of medians between non-failed and failed groups
Country WCTA RETA EBITTA BVETD AUC of
Z-Score
Austria (AT) 0448 0405 0126 0487 0788
Belgium (BE) 0223 0264 0077 0431 0760
Bosnia (BA) 0106 0249 0088 0580 0805
Bulgaria (BG) 0114 0291 0094 0436 0630
China (CN) 0068 0032 0016 0280 0570
China delisted data 0089 -0061 -0032 0083 0546
China ST data 0298 0293 0139 0468 0911
Colombia (CO) 0226 0235 0099 0705 0724
Croatia (HR) 0275 0335 0044 0274 0812
Czech Republic (CZ) 0404 0397 0069 0667 0813
Denmark (DK) 0267 0356 0046 0733 0798
Estonia (EE) 0331 0388 0113 1033 0827
Finland (FI) 0402 0606 0207 0907 0864
France (FR) 0140 0213 0065 0424 0723
Germany (DE) 0131 0136 0032 0262 0658
Greece (GR) 0171 0262 0049 0349 0670
Hungary (HU) 0175 0224 0052 0587 0746
Iceland (IS) 0246 0261 0051 0337 0674
Ireland (IE) 0181 0266 0039 0560 0672
Italy (IT) 0277 0164 0073 0207 0799
Latvia (LV) 0117 0120 0042 0254 0691
Lithuania (LT) 0246 0218 0051 0569 0782
Netherlands (NL) 0204 0253 0077 0432 0754
Norway (NO) 0157 0219 0115 0329 0694
Poland (PL) 1340 0920 0124 1351 0904
Portugal (PT) 0215 0200 0052 0318 0724
Romania (RO) 0222 0271 0056 0298 0740
Russian Federation (RU) 0350 0242 0069 0245 0802
Serbia (RS) 0120 0148 0045 0389 0713
Slovakia (SK) 0256 0184 0061 0431 0774
Slovenia (SI) 0111 0172 0035 0326 0725
Spain (ES) 0143 0143 0076 0285 0713
Sweden (SE) 0255 0346 0099 0663 0801
Ukraine (UA) 0204 0200 0031 0449 0714
United Kingdom (GB) 0211 0245 0033 0472 0719
UK Liquidation set 0156 0234 0031 0447 0621
United States (US) 0195 0378 0248 0722 0701
44
44
Average of column items 0245 0265 0073 0481 0740
Correlation with Z-Score AUC 0611 0681 0516 0574 1000
Legend WCTA = Working CapitalTotal Assets
RETA = Retained EarningsTotal Assets EBITTA = EBITTotal Assets
BVETD = Book Value of EquityTotal Liabilities SALTA = SalesTotal Assets
AUC = Area under the ROC curve Z-Score = Altman (1983) Z-Score in the test data
45
45
Table 7 Test data AUCs for different estimated country models Comparisons are with AUC of the LR model estimated for all data (benchmark)
Test data AUC for different models
Country Benchmark Model 1 Model 2 Model 3 Model 4 Model 5 Model 6 Model 7
Austria (AT) 0800 0782 0770- 0774 0829 0787 0707- 0764
Belgium (BE) 0772 0779 0780 0826 0776 0783 0781 0834
Bosnia (BA) 0862 0850 0832 0833 0838 0838 0820 0853
Bulgaria (BG) 0684 0785 0785 0785 0796 0794 0677 0707
China (CN) ST companies 0985 0984 0982 0980 0986 0986 0986 0989
Colombia (CO) 0726 0755 0754 0818+ 0789 0749 0774 0824+
Croatia (HR) 0844 0862 0858 0865 0853 0863 0847 0863
Czech Republic (CZ) 0811 0812 0812 0823 0830 0813 0818 0842
Denmark (DK) 0803 0806 0809 0833 0818 0804 0813 0843
Estonia (EE) 0823 0824 0839 0866 0874 0839 0847 0899
Finland (FI) 0867 0867 0870 0885 0868 0873 0879 0894
France (FR) 0739 0773 0799 0805 0826 0800 0810 0845
Germany (DE) 0673 0684 0685 0734 0704 0701 0690 0762
Hungary (HU) 0742 0736 0743 0788 0767 0765 0747 0820
Iceland (IS) 0664 0670 0671 0784+ 0683 0714 0708 0824+
Ireland (IE) 0679 0663 0666 0718 0661 0665 0680 0724
Italy (IT) 0806 0802 0810 0835 0839 0809 0816 0868
Latvia (LV) 0678 0690 0707 0745 0720 0711 0730 0771
Netherlands (NL) 0752 0752 0756 0768 0784 0760 0759 0807
Norway (NO) 0716 0741 0741 0803 0749 0744 0743 0814
Poland (PL) 0903 0891 0897 0915 0899 0896 0895 0913
Portugal (PT) 0741 0753 0757 0761 0780 0758 0765 0797
Romania (RO) 0758 0718 0773 0805 0757 0755 0753 0774
Russian Federation (RU) 0811 0808 0810 0854 0811 0811 0818 0862
Slovakia (SK) 0777 0773 0775 0782 0810 0761 0773 0807
46
46
Slovenia (SI) 0737 0703 0719 0704 0711 0739 0686 0698
Spain (ES) 0734 0755 0767 0768 0849 0766 0776 0858
Sweden (SE) 0813 0826 0829 0843 0831 0831 0892 0901
Ukraine (UA) 0708 0712 0712 0720 0742 0718 0718 0758
United Kingdom (GB) 0699 0708 0713 0718 0764 0714 0731 0785
United States (US) 0710 0689 0687 0686 0816+ 0689 0714 0816+
Average of AUC 0768 0773 0778 0801 0799 0782 0779 0823
Significance AUC better than benchmark 00001 = ++++ 0001 = +++ 001 = ++ 01 = +
AUC worse than benchmark 00001 = ---- 0001 = --- 001 = -- 01 = - Models
Benchmark = The LR model estimated for all data with Zrsquorsquo-model (1983) variables Model 1 = The MDA model estimated for country data
Model 2 = The LR model estimated for country data Model 3 = The LR model estimated for country data with year dummies
Model 4 = The LR model estimated for country data with size variables Model 5 = The LR model estimated for country data with age category dummies Model 6 = The LR model estimated for country data with industry dummies
Model 7 = The LR model estimated for country data with all variables
47
47
Appendices
Appendix 1 Medians of the Altman (1983) model (Z) variables by status and country
Non-failed Failed
Non-failed Failed
Non-failed Failed Non-failed Failed
Country WCTA
RETA
EBITTA
BVETD
Austria (AT) 0170 -0278 0260 -0145 0055 -0071 0465 -0022
Belgium (BE) 0136 -0087 0157 -0107 0052 -0025 0460 0029
Bosnia (BA) 0087 -0019 0148 -0101 0032 -0056 0580 0000
Bulgaria (BG) 0216 0102 0272 -0019 0075 -0019 0504 0068
China (CN) 0105 0037 0064 0032 0064 0048 0870 0590
China delisted data 0158 0069 0286 0347 0059 0091 0923 0840
China ST data 0106 -0192 0281 -0012 0052 -0087 0776 0308
Colombia (CO) 0244 0018 0282 0047 0104 0005 0940 0235
Croatia (HR) 0093 -0182 0130 -0205 0030 -0014 0274 0000
Czech Republic (CZ) 0196 -0208 0230 -0167 0050 -0019 0591 -0076
Denmark (DK) 0128 -0139 0306 -0050 0005 -0041 0758 0025
Estonia (EE) 0222 -0109 0455 0067 0050 -0063 1169 0136
Finland (FI) 0233 -0169 0359 -0247 0082 -0125 0744 -0163
France (FR) 0146 0006 0223 0010 0059 -0006 0501 0077
Germany (DE) 0307 0176 0150 0014 0069 0037 0335 0073
Greece (GR) 0127 -0044 0049 -0213 0039 -0010 0460 0111
Hungary (HU) 0135 -0040 0271 0047 0054 0002 0717 0130
Iceland (IS) 0051 -0195 0046 -0215 0051 0000 0196 -0141
Ireland (IE) 0198 0017 0383 0117 0029 -0010 0728 0168
Italy (IT) 0107 -0170 0077 -0087 0032 -0041 0178 -0029
Latvia (LV) 0102 -0015 0150 0030 0069 0027 0342 0088
48
48
Lithuania (LT) 0205 -0041 0273 0055 0054 0003 0686 0117
Netherlands (NL) 0204 0000 0303 0050 0065 -0012 0511 0079
Norway (NO) 0185 0028 0139 -0080 0068 -0047 0398 0069
Poland (PL) 0198 -1142 0258 -0662 0076 -0048 0850 -0501
Portugal (PT) 0164 -0051 0133 -0067 0028 -0024 0343 0025
Romania (RO) 0071 -0151 0158 -0113 0041 -0015 0250 -0048
Russian Federation (RU) 0088 -0262 0106 -0136 0043 -0026 0194 -0051
Serbia (RS) 0093 -0027 0129 -0019 0027 -0018 0389 0000
Slovakia (SK) 0137 -0119 0185 0001 0060 -0001 0496 0065
Slovenia (SI) 0109 -0002 0215 0043 0039 0004 0434 0108
Spain (ES) 0117 -0026 0139 -0004 0029 -0047 0336 0051
Sweden (SE) 0266 0011 0357 0011 0058 -0041 0749 0086
Ukraine (UA) 0053 -0151 0034 -0166 0003 -0028 0442 -0007
United Kingdom (GB) 0179 -0032 0294 0049 0031 -0002 0579 0107
UK Liquidation set 0179 0023 0294 0060 0031 0000 0579 0132
United States (US) 0164 -0031 0374 -0004 0003 -0245 0800 0078
Average of medianssect 0153 -0092 0213 -0050 0048 -0025 0555 0075
Legend WCTA = Working CapitalTotal Assets
RETA = Retained EarningsTotal Assets EBITTA = EBITTotal assets
BVETD = Book Value of EquityTotal Liabilities sect = Because the two datasets for non-failed UK firms are identical the non-failed medians are used only once in the calculation of the averages

4
from financial statements one reporting period prior to bankruptcy The average lead time of the financial statements was approximately seven and one-half months The financial ratios selected for model building were based on the balance sheet and income statement data In past studies a very large number of variables were found to be significant indicators of financial difficulties Therefore Altman compiled a list of 22 potentially important financial ratios for evaluation He classified these variables into five standard ratios categories liquidity profitability leverage solvency and activity ratios The ratios were chosen on the basis of their 1) popularity in the literature and 2) potential relevancy to the study The list included only a few ldquonewrdquo ratios In addition Altman did not consider cash flow ratios because of the lack of consistent and precise depreciation data From the original list of 22 financial ratios Altman selected five ratios for the profile as doing the ldquobestrdquo overall job in the prediction of corporate bankruptcy This profile did not contain all of the most significant variables measured independently Instead the contribution of the entire profile was evaluated To arrive at a final profile of variables Altman utilized the following procedures 1) observation of the statistical significance of various alternative functions including determination of the relative contributions of each independent variable 2) evaluation of inter-correlations between the relevant variables 3) observation of the predictive accuracy of the various profiles and 4) judgment of the analyst The final discriminant function estimated by Altman (1968) is as follows Z = 0012X1 + 0014X2 + 0033X3 + 0006X4 + 0 999X5 Or Z = 12X + 14X2 + 33X3 + 06X4 + 10X5 (when the first four variables are expressed in decimals eg 200) where X1 = Working capitalTotal assets X2 = Retained EarningsTotal assets X3 = Earnings before interest and taxesTotal assets X4 = Market value of equityBook value of total liabilities X5 = SalesTotal assets Z = Overall Index 1) The Working capitalTotal assets ratio (X1) is a measure of the net liquid assets of the firm relative to the total capitalization Working capital is defined as the difference between current assets and current liabilities When a firm is experiencing consistent operating losses it will have shrinking current assets in relation to total assets X1 proved to be the more valuable in analyses than the current ratio and the quick ratio This ratio explicitly considers liquidity and size dimensions 2) The Retained EarningsTotal assets ratio (X2) refers to the earned surplus of a firm over its entire life This measure of cumulative profitability over time is one of the two (the other is the use of the market value of equity in X4 instead of the book value) ldquonewrdquo ratios evaluated by Altman It considers implicitly the age of the firm due to its cumulative nature and the use of leverage in the firmrsquos financing of its asset growth 3) The Earnings before interest and taxesTotal assets ratio (X3) is a measure of the true productivity or profitability of the assets of a firm It is not affected by any tax or leverage factors It reflects the earning power of the assets that determines the value of assets In a bankrupt sense insolvency occurs when the total liabilities exceed this fair value 4) The Market value equityBook value of total liabilities ratio (X4) shows how much the assets of a firm can decline in value (measured by market value of equity plus debt) before the liabilities exceed the assets and the firm becomes insolvent This ratio adds a market value dimension to the model The reciprocal of this ratio ndash the familiar DebtEquity ratio ndash is used to measure financial leverage Indeed Altmanrsquos
5
use of the market value of equity was the first study utilizing market measures and was in some ways a predecessor to the so-called structural approach championed by Merton (1974) and commercialized by KMV 5) The SalesTotal Assets ratio is the standard capital-turnover ratio illustrating the sales generating ability of the assets of a firm It refers to the capability of management in dealing with competitive conditions This ratio was dropped in the Zrdquo-Score model Altman evaluated the importance of the five ratios in several ways Firstly he used the F test to evaluate the univariate difference between the average values of the ratios in each group to the variability (or spread) of values of the ratios within each group In this test variables from X1 to X4 were all significant at the 0001 p-level indicating significant difference in the variables between the groups However X5 did not show any significant difference on a univariate basis All five ratios indicated higher values for the non-bankrupt group which is consistent with the positive signs of the discriminant function Secondly Altman determined the relative contribution of each variable to the total discriminating power of the function using the scaled vector In this vector the profitability measure (X3) showed the highest contribution while the SalesTotal assets ratio (X5) gave the second highest contribution although it was insignificant on a univariate basis To explain this Altman found a negative correlation (-078) between X3 and X5 in the bankrupt group Usually negative correlations are more helpful than positive correlations in adding new information to the function Altman explains that this negative correlation will occur when bankrupting firms suffer losses and deteriorate toward failure and their assets are not replaced as much as they were in better times In addition cumulative losses further reduce the asset size through debits to retained earnings Thus the asset size reduction apparently dominates any sales movements 22 Zrsquo-Score and Zrsquorsquo-Score Models for private firms The original Z-Score Model was based on the market value of the firm and was thus applicable only to publicly traded companies Altman (1983 122) emphasized that the Z-Score Model is a publicly traded firm model and ad hoc adjustments are not scientifically valid Therefore Altman (1983) advocated a complete re-estimation of the model substituting the book value of equity for the market value in X4 Using the same data Altman extracted the following revised Zrsquo-Score Model Zrsquo = 0717X1 + 0847X2 + 3107X3 + 0420X4 + 0 998X5 where X1 = Working capitalTotal assets X2 = Retained EarningsTotal assets X3 = Earnings before interest and taxesTotal assets X4 = Book value of equityBook value of total liabilities X5 = SalesTotal assets Zrsquo = Overall Index
Altman did not test the Zrsquo-Score model on a secondary sample due to lack of a private firm data base However he analyzed the accuracy of a four-variable Zrsquorsquo-Score Model excluding the SalesTotal assets ratio X5 from the revised model because of a potential industry effect The industry effect is more likely to take place when this kind of industry-sensitive variable (asset turnover) is included into the model Thus in order to minimize the potential industry effect Altman estimated the following four-variable Zrsquorsquo-Score model (Altman 1983 124)
Zrsquorsquo = 325 + 656X1 + 326X2 + 672X3 + 105X4
6
where X1 = Working capitalTotal assets X2 = Retained EarningsTotal assets X3 = Earnings before interest and taxesTotal assets X4 = Book value of equityBook value of total liabilities Zrsquorsquo = Overall Index
The EBITTotal assets ratio X3 again made the highest contribution to discrimination power in this version of model The classification results for the Zrsquorsquo-Score Model were identical to the revised five-variable (Zrsquo-Score) model In this study our empirical analysis is focused on the performance of the Zrsquorsquo-Score model in bankruptcy prediction
In concluding remarks Altman (1983 125) regarded the general applicability of his Z-Score Model as debatable He admited that the model did not scrutinize very large and very small firms the observation period was quite long (almost two decades) and the analysis included only manufacturing companies Altman concluded as follows ldquoIdeally we would like to develop a bankruptcy predicting model utilizing a homogenous group of bankrupt companies and data as near to the present as possiblerdquo Therefore he advised the analysts interested in practical utilization of the Z-Score Model to be careful This advisement deals with the versions Zrsquo-Score and Zrsquorsquo-Score models of the original Z-Score model as well
3 Literature review of Z-Score Models For the literature review we searched for papers published from the year 2000 on4 in prominent international journals from SciVerse ScienceDirect JSTOR and Springer Link Cambridge Journals and Oxford Journals We selected 34 articles from the below mentioned journals in which the Z-Score was used as a failure prediction proxy or Z-Score methodology was assessed mostly in terms of predictive ability The journals in alphabetical order and one handbook were the following The British Accounting Review (1) Computational Economics (1) Empirical Economics (1) Journal of Accounting Research (2) Journal of Banking and Finance (4) Journal of Business Research (2) Journal of Contemporary Accounting and Economics (1) Journal of Empirical Finance (1) Journal of Finance (4) Journal of Financial Markets (1) Journal of Financial and Quantitative Analysis (2) Journal of Financial Stability (1) Mathematics and Financial Economics (1) Lecture Notes in Computer Science (2) Review of Accounting Studies (3) The Review of Financial Studies (2) Review of Finance (3) Review of Quantitative Finance and Accounting (2) and Handbook of Quantitative Finance and Risk Management (1) The review is presented in Table 1 Out of the 34 studies in 17 cases Altmanrsquos Z-Score Model5 was used as the measure of distress or financial strength (M) in 14 studies Altmanrsquos original model was verified andor modified (V) and in 3 cases it was used for robustness check (R)
(Table 1 here)
The wide usage of the Z-Score Model as a measure of financial distress or financial strength in the economic and financial research points out that it is widely accepted as a venerable simple and consistent measure of the distressed firm at risk In case of the modification of the Z-Score Model
4 Research devoted to the application of Z-Score Model before 2000 was reviewed by Grice andand Ingram
(2001) 5 Most of the models focused on stock exchange listed firms thus Zrsquo-Score Model was not used
7
the most important changes were (1) the use of firmsrsquo up-dated financial data in order to re-estimate coefficients and (2) the use of other estimation techniques in order to improve efficacy in comparison to the original model The use of Altmanrsquos ratios combined with other than MDA modeling techniques has improved the prediction ability Also the application of new data improved model performance in the case of both US and non-US firms In comparison with market-based models or hazard models Altmanrsquos Z-Score Model generally underperformed (4 studies) outperformed (2) or provided similar results In Reisz and Perlich (2007) it was assessed as a better measure for short-term bankruptcy prediction than the market-based models and in Das Hanouna and Sarin (2009) it was shown to perform comparably to the Merton structural market-based approach for CDS spread estimation The question of whether market data is better than acccounting data has been raised many times The same applies to accounting-based models vs market-based models (eg discussion in Bauer and Agarwal 2014) Recall however that the original Z-Score model is not solely an accounting-based approach since the market value of equity is utilized as well Our purpose is not to contribute to this strand of studies and we focus on an accounting-based approach as almost all the estimated models in this study were from privately held firms and by definition there are no market-based data for these firms
4 Research hypotheses
The literature survey shows that the Z-Score Model (publicly traded firms) Zrsquo-Score Model (private firms) and Zrsquorsquo-Score Model (private manufacturing and non-manufacturing firms) have been very widely adapted in different contexts for different purposes For these kinds of widely used studies performance plays the key role In this study we are firstly interested in assessing the performance of the original Zrsquorsquo-Score model in classifying bankrupt and non-bankrupt firms in an international context Mainly our study is focusing on assessing performance in a European context However we also validate the results in a set of non-European countries to get a more global view Secondly we will re-estimate the model using extensive international data and then use the re-estimated Zrsquorsquo-Score Model as a benchmark assessing the effects of different factors on the performance in terms of classification accuracy We will assess the effects of the following five factors on this performance year of bankruptcy size of firms age of firms industry and country of origin In all we shall test a set of hypotheses based on the effects on performance of the model on two different levels Firstly we will test a set hypotheses on a pooled set of all firms and secondly on data from each country individually In comparison to the previous research our contribution consists of the focus on an international context not just the model application or re-estimation for a given country data The hypotheses of the study are as follows
H1 Obsolescence of the coefficients The Zrsquorsquo-Score Model was estimated using the same sample of firms that was used to develop the original Z-Score Model The bankruptcies in the estimation data occurred during the period 1946-1965 Thus the oldest observations are from almost seventy years ago during the post-war period Altman (1983 125) recommended utilizing data as near to the present as possible when developing a bankruptcy prediction model It is obvious that the financial behaviour of firms and their business environment have significantly changed after that potentially making the importance of the financial ratios to differ from their original importance reflected by the coefficients of the model Therefore we suggest as the first hypothesis (H1) that the re-estimation of the coefficients of the four original variables of the Zrsquorsquo-Score model will improve the classification performance of the model in an international context It is supported by the previous research (eg Grice and Ingram 2001) and practice H1 aims to support this evidence on the international level
8
H2 Method of estimation The original Zrsquorsquo-Score Model has been estimated using a MDA suggested by Altman (1983) as the appropriate statistical technique However MDA is based on ordinary least squares method (OLS) and thus requires assumptions of multinormality homoscedasticity and linearity which are not often met in empirical financial ratio analysis Therefore we re-estimate the Zrsquorsquo-Score Model using the logistic regression analysis (LRA) to assess the effect of the method of estimation LRA does not require most of the restricting assumptions of MDA In LRA multivariate normality of the independent variables homoscedasticity and linearity are not required For the sake of OLS MDA can be more useful than LRA for small samples such as the original sample of 66 firms used in the estimation of the Zrsquorsquo-Score Model However in a large sample LRA may potentially perform better In this study we use large samples which is advantageous for LRA Therefore our second hypothesis (H2) suggests that the classification performance of the re-estimated Zrsquorsquo-Score Model will be improved when it is estimated using LRA instead of MDA The model re-estimated for the original variables using LRA and all pooled data is called here the Zrsquorsquo-Score LR-model The performance of this re-estimated model is used in this study as the benchmark for further analyses
H3 Bankruptcy year The model based on the relationship between bankruptcy and financial ratios is likely to be affected by the macro-economic environment These effects may significantly decrease the classification accuracy of the model If the model is estimated using data from one year and it will be applied to data from another year the validity of the model can be questioned Business cycles in terms of economic growth credit policy and interest rates can have an effect on the boundary between bankrupt and non-bankrupt firms The original Zrsquorsquo-Score Model is estimated using data from the period 1946-1965 which includes several business cycles Therefore the model is not focused on any specific stage of cycle and does not explicitly take account of the bankruptcy year Altman (1983 125) suggested gathering data from firms for the last couple of years when developing a prediction model In this study the benchmark Zrsquorsquo-Score LR-model will be estimated for a shorter period than in the original estimation which however covers several recent years on different stages of the business cycle in different countries Therefore the third hypothesis (H3) assumes that the classification accuracy of the benchmark model can be increased by explicitly taking account of the year of bankruptcy in the estimation of the model
H4 Size of the firm The boundary between bankrupt and non-bankrupt firms is different for small and larger firms which decreases the performance of the model estimated for data from one size category and applied for data from another size category For the bankrupt and non-bankrupt firms in the original data for Zrsquorsquo-Score Model estimation the range of asset size was about between 1 ndash 25 million US dollars The data did not include very small and very large firms Altman (1983 125) regarded the suitability of the original Z-Score Model (and in the same way Zrsquorsquo-Score Model) for all firms as debatable because it did not scrutinize very large or very small firms In this study the benchmark Zrsquorsquo-Score LR-model will be estimated for data from many size categories from very small firms to very large firms The fourth hypothesis (H4) assumes that the classification performance of the uniform benchmark LR-model based on the original four financial variables of the Zrsquorsquo-Score Model is increased when the size category of the firm is explicitly taken into account
H5 Age of the firm International insolvency statistics generally shows that bankruptcy risk is a function of the age of the firm Especially very young firms typically show a very high risk The original Zrsquorsquo-Score Model does not take explicitly account of the age However Altman (1983 107) noted that the age of a firm is implicitly considered in the Retained EarningsTotal Assets ratio (X2) that was regarded as a new ratio in bankruptcy prediction context A relatively young firm will probably show a low ratio because it has not has time to build up cumulative profits Thus a young firm is to some degree discriminated against in the model and its likelihood to be classified as
9
bankrupt is relatively higher than that of an older firm For this argument Altman (1987 107) concluded ldquoBut this is precisely the situation in the real worldrdquo The incidence of failure is much higher in the early years of a firm In spite of the fact that the age of the firm in this way is implicitly taken into account in X2 we expect that an explicit consideration of the age will improve the classification accuracy due to controlling for the age factor Therefore the fifth hypothesis (H5) proposes that the performance of the uniform benchmark model based on the original four financial variables of the Zrsquorsquo-Score Model is increased when the age of the firm is explicitly taken into account
H6 Industry of the firm The original Zrsquo-Score Model is estimated only for manufacturing firms Altman (1983 125) stated that ideally we would like to develop a bankruptcy prediction model utilizing a homogenous group of bankrupt firms If we are interested in a particular industry grouping we should gather data from bankrupt and non-bankrupt firms in these groupings Previous studies show that the financial distress analysis is influenced by industry effect (Smith and Liou 2007) Firms in different industries tend to report different levels of the same financial ratios which may have an effect on the boundary between bankrupt and non-bankrupt firms This industry effect may be present in the Zrsquo-Score Model especially due to the SalesTotal Assets ratio (X5) This ratio showed the least significance on a univariate basis but had a very significant contribution to the discriminant power of the multivariate model Altman (1983 108 124) recognized the potential industry effect due to a wide variation among industries in asset turnover and specified the Zrsquorsquo-Score Model without X5 for private non-manufacturing firms However the Zrsquorsquo-Score Model is also estimated using the original sample of manufacturing firms In our analysis the uniform benchmark model based on the original four financial variables of the Zrsquorsquo-Score Model is estimated for a statistical sample representing different industries Therefore the sixth hypothesis (H6) assumes that an explicit consideration of industry will improve the classification accuracy of this benchmark model
H7 Country of origin The original Zrsquorsquo-Score Model has been estimated only for US firms However in previous studies the Zrsquorsquo-Score model has been applied in countries all over the world It can be expected that the international applicability of the model to other countries is affected by country-specific differences Economic environment legislation culture financial markets and accounting practices in a country may affect the financial behaviour of firms and the boundary between bankrupt and non-bankrupt firms These factors may potentially weaken the classification performance of the model in other countries outside the country in which the model is originally estimated (Ooghe and Balcaen 2007) Therefore the seventh hypothesis (H7) assumes that taking account explicitly of the country of origin of a firm will improve the classification accuracy of the benchmark model In our empirical study the country effect will be assessed by including a variable of country risk
5 Empirical data and statistical methods
51 Sample of firms The principal data of this study are extracted from the ORBIS databases of Bureau Van Dijk (BvD) The main data are from ORBIS Europe that is a commercial database which at the moment of sampling contained administrative information on over 50 million European firms However income statement and balance sheet information was available for about 8 million companies More than 99 of the companies covered in this database are private companies from different industries justifying the use of the Zrsquorsquo-Score Model (for private manufacturing and non-manufacturing firms) instead of the original Z-Score Model (for publicly traded manufacturing firms) The ORBIS database
10
organizes the public data from administrative sources and filters them into various standard formats to facilitate searching and company comparisons The ORBIS formats have been derived from the most common formats used for the presentation of business accounts in the world (Ribeiro et al 2010) It is clear that international comparability may be a problem when administrative firm-level data are internationally pooled For administrative data the definition of variables is usually less harmonized This is less of a problem in the ORBIS database because of the common international format of balance sheets For example although some discrepancies in profitloss statements may arise because of differences in fiscal systems across countries balance sheet variables largely adhere to international standards Therefore ORBIS provides us with a useful and extremely large database for our study For statistical sampling several requirements are set for the empirical data Firstly we require that the firm to be selected must be an unlisted industrial (non-financial) company Secondly its owners must have limited liability (whereby partnerships and sole proprietors are left out of the study) Thirdly we set a minimum requirement for the size of the firm Because financial ratios in very small firms are generally too unstable for a failure prediction model these firms are excluded (Balcaen and Ooghe 2006) We require that the Total Assets must have exceeded 100 thousand EUR at least once in the available time series for a firm Fourthly we include in our estimation sample firms from all European countries where the number of failed firms is more than 60 If the number of failed firms for a country is less than 60 the firms from this country are only included in the test sample For other European countries the failed firms are randomly classified into the estimation and test samples so that the number of sample firms are about equal in both samples In all our estimation data include firms from 29 European countries while the number of countries in the test data is 32 Fifthly all failed firms that fulfil the requirements above are included into our samples However if the number of non-failed firms in a country is very high a sample is randomly selected from that country Finally the time span of fiscal years potentially available for this study ranges from 2002 to 2010 Because the last financial statements for failed firms in the database are from a financial period within 2007 and 2010 earlier years are excluded for comparability also for non-failed firms But all qualifying observations for non-failed firms from years 2007 to 2010 are included in the data sets As for failed firms we restrict the analyses to the last financial statements available before failure The four independent variables of the Zrsquorsquo-Score Model were winzorized at 1 and 99 to minimize outliers Our data is not restricted to European countries only The results are estimated and tested also for three non-European countries (United States China and Colombia) to get a more global view of the performance of the Zrsquorsquo-Score Model Therefore a sample of firms from these countries is randomly selected as for the estimation and test data from ORBIS World including middle-size (total assets over 15 Million Euro) and larger firms from all over the world The main principles for selecting these data follow the description outlined above for European firms Table 2 shows the resulting number of non-failed and failed firms in the estimation data and test data by country In all the estimation sample includes data from 2602563 non-failed and 38215 failed firms from 29 European and 3 non-European countries The test sample is slightly larger because it includes data from 32 European and 3 non-European countries From the country of origin of the Zrsquorsquo-Score Model the US the estimation sample only includes 56 bankrupt firms For the US data we made an exception by allowing listed (and delisted) firms to be included as otherwise there would have been no observations for the US in the database From China there are three samples Special Treatment-firms (ST)6 are included in the estimation sample although there are only 32 such firms altogether7 Private and delisted (DL)
6 See Zhang Altman and Yen (2010) for the rationale for using special-treatment firms as a proxy for
bankruptcies These are firms put on probation by the stock exchange for poor operating performance andor negative equity 7This is done because the results about predictability were good also for such a small sample
11
Chinese firms are separately analysed only in the test data8 ST firms are listed firms suffering from serious financial difficulties Delisted firms are firms delisted from the stock enchange (Table 2 here) 52 Status of failed firms ORBIS has five classes for potentially active firms (active default of payment receivership dormant branch) and seven classes for inactive firms which do not carry out business activities anymore (bankruptcy dissolved dissolved (merger) dissolved (demerger) in liquidation branch no precision) From these classes only active is selected to represent non-distressed firms In selecting the failed firms we try to avoid ambiguity as much as possible by considering (with exceptions described below) a firm failed if its status in ORBIS is stated as bankruptcy However because of the small number of bankrupt firms in some countries we also consider receivership (active) firms failed although they are active These firms generally suffer from serious financial distress However liquidation (inactive) firms are not included in the sample of failed firms (with one exception) Firms in liquidation may depending on the country contain firms that have ceased activities due to reasons other than failure (mergers discontinuing the operations of a daughter company or of a foreign branch etc) Therefore for most countries we select only firms that are coded as being bankrupt or under receivership However there are a number of special countries where failed firms are coded under a different status heading These special countries or samples are the following Country Status categories Bulgaria In liquidation Bankruptcy Denmark Inactive (no precision) Greece Active (receivership) In liquidation Bankruptcy Ireland In liquidation Active (receivership) Norway In liquidation Slovenia In liquidation Spain Active (receivership) In liquidation Bankruptcy Ukraine In liquidation Bankruptcy United Kingdom liquidation Inactive (In liquidation) China ST Active (Special Treatment) China delisted Active (delisted) In case no such category for failed firms could be identified that country was excluded from the study (for example Switzerland) If there was only a very small number of failed observations the country was dropped from the study (Luxembourg Liechtenstein Montenegro typically small countries) It should also be noted that the status classes (including the bankruptcy category) are not completely homogenous within European countries due to different legislations although there are obvious similarities in insolvency acts (Philippe et al 2002) China is a special case including samples with three different criteria of failure (bankruptcy Special Treatment delisted) For the UK there are two different samples (liquidation receivership) 53 Statistical methods
8These firms are included only in the test data because the predictability of failure was exceptionally poor
12
In this study seven research hypotheses are drawn for statistical testing The statistical analysis will begin with calculating the original Zrsquorsquo-Score for the firms in the data Following the original model this Zrsquorsquo-Score will be calculated for all sample firms as follows Zrsquorsquo = 325 + 656X1 + 326X2 + 672X3 + 105X4 where X1 = Working capitalTotal assets X2 = Retained EarningsTotal assets X3 = Earnings before interest and taxesTotal assets X4 = Book value of equityBook value of total liabilities
The classification performance of the original model is assessed by the AUC (Area Under Curve) measure extracted from the ROC (Receiver Operating Characteristic) curve ROC curve is a plot of true positive rate against false positive rate for all different possible cut-off-points These profiles show the trade-offs between Type I and Type II errors and represent statistically the cumulative probability distribution of failed events AUC measures the accuracy of the estimated model in relation to the perfect model With a perfect model AUC is 1 and with a random model 05 AUC has a close connection with the Accuracy Ratio (AR) since AR = 2 AUC ndash 1 AR equals 0 for a random model and 05 for a model with an average classification performance In all statistical analyses SAS software is used
The first hypothesis (H1) assumes that the coefficients of the original model are obsolete H1 is tested by re-estimating the coefficients of the Zrsquorsquo-Score Model using the original statistical method (the multiple discriminant analysis or MDA) In MDA the discriminant function is determined by a parametric method (a measure of generalized squared distance) and the distribution of independent variables within both groups is assumed to be multivariate normal The purpose is to estimate the new coefficients for the model to statistically represent the overall sample The problem is that the estimation sample includes different numbers of failed and non-failed firms from 31 countries In the original sample of Altman (1983) an equal number of bankrupt and non-bankrupt firms were selected from one country (US) Following the characteristics of these data we weight the firms so that the weights for the failed and non-failed firms are equal In this way the non-proportional sampling in different countries does not affect the re-estimated model The number of firms from different countries however varies significantly which leads to greater weights for larger countries To avoid this problem the observations are also weighted so that each country has an equal weight in the analysis Then the coefficients of the Zrsquorsquo-Score Model are re-estimated using these weighted data and the resulting AUC is compared with the one based on the original model The second hypothesis (H2) expects that the classification performance of the re-estimated Zrsquorsquo-Score Model improves when it is re-estimated by the logistic regression analysis (LR) that is based on less restrictive statistical assumptions than MDA In this estimation the dependent variable Y = 0 when the firm is non-failed and Y = 1 when it is failed LRA does not require that independent variables are multivariate normal or that groups have equal covariance matrices which are basic assumptions in MDA (Hosmer and Lemeshow 1989) LRA creates a score (logit) L for every firm It is assumed that the independent variables are linearly related to L This score or logit is used to determine the conditional probability of failure as follows
13
)|1( XYp = )( 441101
1
1
1XbXbbL ee
where bi (i =0hellip 4) are the coefficients and Xi (i =1hellip 4) are the four independent variables of the original Zrsquorsquo-Model The effect of the method on classification performance is assessed by testing the statistical significance of the difference between AUCs for this LR model and for the re-estimated MDA model The resulting model is here called the Zrsquorsquo-Score LR-Model and it is used as a benchmark for further statistical AUC comparisons because LR is applied as the principal method in testing of the rest of the research hypotheses
The third hypothesis (H3) is associated with the performance effect of taking account of the bankruptcy year in estimation This hypothesis is tested estimating a LR model based on the following logit
3
1
4
10
jjji
ii DcXbbL
where b0 is a constant Xi (i =1hellip 4) are the four independent variables of the original Zrsquorsquo-Model bi (i =1hellip 4) are their coefficients cj (j =1hellip 3) are coefficients of the dummy variables and
D1 = 1 when year = 2008 0 otherwise
D2 = 1 when year = 2009 0 otherwise
D3 = 1 when year = 2010 0 otherwise
The dummy variables do not directly refer to the bankruptcy year that is not given in the data base but to the last available year For failed firms there is about 1mdash2 years lead time to failure from this year In this model year 2007 is the base category If AUC of this extended LR model statistically significantly exceeds AUC of the Zrsquorsquo-Score LR-Model (benchmark) evidence supports hypothesis H3 The research hypotheses H4-H7 are statistically tested using the same approach as for the third hypothesis above However for each hypothesis appropriate variables are used instead of the year dummies Hypothesis H4 deals with the performance effect of taking account of size and it will be tested using in the LR model two additional variables of size In this LR model size is measured by natural logarithm of total assets and its squared form In this way the effect of logarithmic size can be reflected by a function following the second-order parabola Hypothesis H5 predicts that taking explicitly account of the age of the firm improves classification performance When testing this hypothesis the category 6-12 years is used as the base category and two dummy variables are incorporated in the LR model (D1 0-6 years D2 12- years) Hypothesis H6 is associated with the effect of the explicit consideration of industry on the classification performance It is tested here using dummy variables for seven industries (D1 restaurants and hotels D2 construction D3 whole sale and retailing D4 agriculture D5 manufacturing D6 energy and water production D7 information technology) all other industries acting as the base category Hypothesis H7 predicts that the explicit consideration of the country of origin improves classification performance This hypothesis is tested not using dummy variables for countries but using country risk measures instead The country risk of each country is measured by Standard amp Poorrsquos Country
14
Risk Rating per six months after annual closing of accounts The rating is numerically recoded in the way that the best rating AAA = 1 the second best rating AA+ = 2 and et cetera Finally the lowest rating D = 22 Thus H7 is tested estimating a LR model based on the four financial ratios of the original Zrsquorsquo-Score Model and a 22-step variable referring to country risk The five LR models with the orginal four financial ratios and the additional variables specified in the hypotheses are estimated for all data In addition a LR model including all additional variables is estimated for all data to assess the simultaneous effect of all variables Finally six of the seven hypotheses are tested for the data of each country separately In this country level testing hypothesis H7 is not tested because the additional variable (country risk) is constant within the country
6 Empirical results
61 All data coefficients of the Zrsquorsquo-Score Models
Table 3 presents descriptive statistics of the four independent variables (X1-X4) of the Zrsquorsquo-Score Model for all test data The variation in the ratios is significant as is shown by the standard deviation and the quartiles For X1 (WCTA) X2 (RETA) and X3 (EBITTA) the median and the mean for non-failed firms are close to each other referring to a symmetry of distributions However this is not the case for the failed firms For the faileddistressed firms the median exceeds the mean for these three ratios referring to negatively skewed distributions For X4 (BVETL) the means significantly exceed the median for both failed and non-failed firms indicating a positively skewed distribution For each of the four variables both the mean and the median are higher for non-failed firms than for failed firms which is consistent with the expectations The difference between the means of non-failed and failed firms is larger in the original US data than in our all data for RETA and EBITTA but about the same size for WCTA and BVETL (Altman 1983 123) These characteristics of the data may indicate lower classification accuracy than in the original sample (Table 3 here) Table 4 presents the coefficients of the different models estimated for all data All LRA estimates (Model 2 to Model 9) are statistically significant at 0001 due to their contributions and the large sample size The first column presents the coefficients of the original Zrsquorsquo-Score model Column ldquoModel 1rdquo shows the coefficients when they are re-estimated by the same statistical method or MDA The coefficients are here negative since the models are estimated using Y = 1 for the failed firms In our all data EBITTA has a significantly higher weight than in the original US data while the weights of WCTA and BVETL have proportionally decreased The re-estimated coeffient of BVETD is very small referring to a minor effect on the logit Column ldquoModel 2rdquo presents the coefficients for the Zrsquorsquo-Score LR-Model These coefficients are directly comparable with those of the MDA model which is expected for the sake of the exceptionally large sample The differences in the coefficients of the original four variables between the eight LR models (Models 1-8) are small For each model the coefficient of BVETD is very close to zero This indicates that the original four variables and the additional variables are quite independent of each other (Table 4 here) Table 4 also shows the coefficients of the additional variables beyond the original four in the LR models The negative coefficients of the dummy (year) variables of Model 3 indicate that after 2007 (the base category) this risk of failure has significantly decreased year by year The base year of 2007
15
refers to a failure emerged during 2008-2009 This phenomenon is caused by the global financial crisis The crisis played a significant role in the failure of key businesses and a downturn in economic activity leading to the 2008ndash2012 recession especially in Europe The coefficients of Model 4 for the size variables show that the contribution of size on the logit (risk measure) is at its maximum value when logarithmic total assets is 15 or when total assets is about 33 million Euro Model 5 confirms the riskiness of young firms since the risk to fail is very high for newly founded firms (less than 6 years old) as is shown by the coefficient of the first dummy variable The coefficients of the industry dummies in Model 6 show that construction is an exceptionally risky industry followed by manufacturing For Model 7 the coefficient of the country risk dummy is statistically significant (for the sake of the large sample) but negative and very close to zero Finally the coefficients of all variables in Model 8 are directly comparable with those in Models 3-7 62 All data performance of the Zrsquorsquo-Score Models Table 5 shows the resulted AUCs in the test data for the different ldquoall datardquo models by country Model 1 refers to the original Zrsquorsquo-Score Model The classification performance of the score at the level of all countries is fair since AUC = 0743 refers to AR = 0486 that is about average accuracy (05) However the score gives relatively good results (AUC gt 08) for China (ST firms) Poland Finland Estonia Czech Republic Croatia Bosnia Russia and Sweden Its performance is quite low (AUC lt 07) for Norway Latvia Iceland Ireland and Germany The lower part of the table shows the resulting AUCs for the countries only included in the test data The performance of the score is very low for Chinese private and delisted firms It is also low for the liquidation firms in the United Kingdom Appendix 1 shows the medians of the four ratios (X1 to X4) by status and country Table 6 presents the differences of these medians between the non-failed and failed firms by country In this table also the AUC of the Zrsquorsquo-Score and its correlation to the difference of medians are presented This correlation is high for each financial ratio showing that the effects of the ratios on AUC are well balanced For Chinarsquos ST firms the differences are not exceptionally large except for EBITTA This implies with the exceptionally high AUC that the ST firms systematically differ from the non-ST firms although the differences are not extremely large The differences between the medians are very large in Poland for each ratio justifying high AUC They are also large in Finland and also in Czech Republic where the difference in EBITTA is however average In Germany Latvia China (private and delisted) and UK (liquidation) the differences in all four ratios are below the average which is obviously associated with low AUC In the Chinese delisted firms the differences in RETA and EBITTA are even negative In Iceland and Ireland the differences only in EBITTA are exceptionally small (Table 5 here) (Table 6 here) Model 2 in Table 5 is the re-estimated Zrsquorsquo-Score Model where the coefficients are estimated by MDA for all data Its AUC (0745) is only slightly higher than for the original model (0743) supporting only very weakly if at all H1 (obsolescence of the coefficients) The classification accuracy AR (0490) is about the average level However the re-estimation of the coefficients has led to improved classification accuracy in a number of countries especially in Bosnia China (ST) Norway and Greece However it has impaired classification accuracy in UK and China (delisted) Column ldquoBenchmarkrdquo reports the results for the benchmark model (Zrsquorsquo-Score LR-model) showing the effect of the estimation method For the benchmark model AUC in all data is 0748 that is higher than for Model 1 and 2 The differences between AUCs are very small supporting only weakly H2 (estimation
16
method) The LR-model (benchmark) and the MDA model (Model 2) give almost identical AUCs for each country This result was expected since the coefficients of the models are directly comparable The similar results for the models may also indicate that the independent variables conform to multinormality This last result confirms what most researchers in the field of default classification models have concluded that accuracy levels are extremely similar despite any statistical violations like normality between MDA and logistical regression models Model 3 (LR-model with year dummies) leads in all test data to higher AUC (0752) than the benchmark model supporting H3 (bankruptcy year effect) However the AUC effects are not positive for all countries The effects are positive for example for Russia Estonia Germany Ireland and Latvia but these effects are not statistically significant There are statistically significant negative effects for China (ST) and Serbia There are notable negative effects especially for Bosnia Croatia Hungary Norway and Slovenia These diverse results are due to exceptional annual distributions of failed firms in these countries For the countries with negative effects the percent of failed firms from 2010 (D3 = 1) exceeds 50 while for the countries with positive effects it is only a couple of percent For each group non-failed firms are quite equally distributed over years When the coefficient of D3 is very low (-0666) it strongly decreases the risk estimates of most failed firms in the former countries but only in few failed firms in the latter countries This leads to the observed effects Model 4 (LR-model with size variables) performs better than the benchmark model which gives support to H4 (size effect) It leads to AUC = 0760 referring to AR = 0520 However it leads to significant improvements in AUC for example in China (delisted) and Austria For China (delisted) the increase in AUC is extremely strong There are also improvements in AUC for instance for Estonia Italia Slovakia Spain and UK Model 4 has also led to lower AUCs in few countries but the decrease is not significant Model 4 is based on the four original variables and the size effect following a second-order parabola This kind of size effect is very small for micro firms but increases approaching its maximum value in middle-sized firms The countries with a positive change in AUC have typically data where the percent of failed micro firms (in all failed firms) is relatively low (40-60) while there are a lot of middle-sized failed firms Because the size effect is strongest for middle-sized firms AUC will increase On contrary the countries with a negative change in AUC have data where the percent of failed micro firms is exceptionally high (70-80) Model 5 (LR-model with age category dummies) gives for all test data about the same AUC as the benchmark model (AUC = 0748) Thus empirical evidence does not support H5 (size effect) For each country the effect of the age on AUC is small For Austria the effect is however positive and notable For this country the percent of non-failed young firms (0-6 years) is only about 10 (of non-failed firms) whereas this percent for failed firms is more than 20 (of failed firms) Because Model 5 includes a strong positive age risk effect for young firms (D2) it increases the risk of many failed firms but that of only few nonfailed firms This obviously leads to an improvement in AUC Model 6 (LR-model with industry dummies) outperforms the benchmark model in AUC supporting H6 (industry effect) It gives AUC = 0751 leading to AR = 0502 However its AUC is notably higher than the benchmark AUC only in a couple of countries for example in France Latvia Portugal and Spain Model 6 makes a negative effect on failure risk for example in restaurants and hotels and information technology industries but a positive effect in construction and manufacturing industries For the countries with a positive effect on AUC the percent of nonfailed firms in restaurants and hotels and information technology is high while that of failed firms is low For the risky industries (construction and manufacturing) these distributions are reversed Thus Model 6 gives a positive (negative) risk effect for many failed (nonfailed) firms and a negative (positive) risk effect only for few
17
failed (nonfailed) firms Therefore AUC will be increased This situation is reversed for the countries with a negative effect on AUC (Austria and Slovenia) The samples of these countries include a high percent of nonfailed firms in the manufacturing industry leading to a decrease in AUC Model 7 (LR-model with country risk measure) leads to a marginally higher classification performance (AUC = 0749) than the benchmark model This result gives only very weak support for H7 (country of origin effect) However for each country the resulted AUC is almost identical with that given by the benchmark model This result was expected due to the neglible coefficient (-0003) of the country risk measure (SP Country rating rank) in Model 7 This result implies that country risk does not make any effect on the boundary between bankrupt and non-bankrupt firms Model 8 (LR-model with all variables) includes the four financial ratios and all additional variables It leads in all test data to a sizeable increase in AUC (AUC = 0771) in comparison to the benchmark AUC However the effect on AUCs largely varies and is either negative or positive in different countries The effect is large in several countries for example in Estonia France Iceland Italy Latvia and China (delisted) However it also makes a negative effect on AUC in several countries such as Bosnia Hungary and Norway These results show that the inclusion of additional variables into the original model will usually increase AUC but not in every country The ldquoall datardquo benchmark performs fairly well also for the US and the Colombian samples (the US firms being unlike the other firms in this study listed or delisted companies) The poor performance of Chinese private and delisted firms is associated with very small differences between the medians of the non-failed and failed groups as is shown in Table 6 It is clear that the status ldquodelistedrdquo is not comparable with ldquobankruptcyrdquo When the status is defined as ldquoSTrdquo the predictability of Chinese listed firms is very high Prior studies based on Chinese ST-firms have also demonstrated good predictability (Zhang et al 2010 Wang and Campbell 2010) see footnote 6 earlier Nevertheless this puzzle calls for additional research and modeling work regarding unlisted and delisted Chinese firms 63 Country-level data performance of the Zrsquorsquo-Score Models The heterogeneity of the firms and their distributions in ldquoall datardquo makes it difficult for a uniform all data model to increase AUCs in different countries Table 7 presents the test data AUCs for the different models estimated for each country separately (country-level models) In this table the ldquoall datardquo Zrsquorsquo-Score LR-model acts as the benchmark When the models are estimated from the country data this benchmark will be clearly outperformed by the resulting MDA (Model 1) and LR models (Model 2) only in a couple of countries (Bulgaria France Latvia Spain and Sweden) These results give however only weak support for H1 (obsolescence of the coefficients) at the country level because the effects are not significant In addition the benchmark leads to higher AUCs than Models 1 and 2 at least in Austria Bosnia Ireland Slovenia and United States The differences in AUCs given by Models 1 and 2 are generally small In Romania only Model 1 is clearly outperformed by Model 2 Thus country-level evidence does not support H2 (estimation method) Model 3 (LR-model with year dummies) leads in most countries to clearly higher AUC than the benchmark model This evidence gives support to H3 (bankruptcy year effect) Model 3 leads to lower AUC than the benchmark model in Austria Bosnia Slovenia and United States Model 4 (LR-model
18
with size variables) leads to improved performance almost in every country supporting H4 This improvement is significant however only in the United States where AUC is now 0816 when it is only 0710 for the benchmark model It is notable also in Bulgaria France Latvia Spain and United Kingdom Model 5 (LR-model with age category dummies) gives in several countries higher AUCs than the benchmark model but none of the improvements are significant The positive effect is strong especially in Bulgaria France and Iceland Although there are also negative effects on AUC this evidence weakly supports H5 (age effect) since these negative effects are relatively small Model 6 (LR-model with industry dummies) shows both negative and positive effects on AUCs when compared with the benchmark The only significant effect however is the negative effect found in Austria In Bulgaria and Slovenia AUC has also notably decreased due to the industry dummies However there are notable positive effects on AUC for example in France Iceland Latvia and Sweden Thus the effect is not systematic and gives only weak support to H6 (industry effect) Model 7 (LR-model with all variables) leads to a remarkable increase in AUC as compared with the benchmark model in Colombia Iceland and Unites States It also leads to notable improvements in AUC at least in Belgium Denmark Estonia France Germany Hungary Latvia Norway Spain and United Kingdom There are found negative effects on AUC only in Austria and Slovenia Thus as a conclusion we can state that the classification performance of ldquoall testrdquo data Zrsquorsquo-Score Model can in general remarkably increase in most countries when different effects are taken into account by additional variables This increase is found in most European countries and also in Colombia and United States In China the AUC for the ST sample is extremely high for the Zrsquorsquo-Score LR-model and it can only slightly be improved by additional variables (Table 7 here)
7 Summary of the study and a Suggested Extension
The purpose of this study was to assess the classification performance of the Zrsquorsquo-Score Model originally introduced by Altman (1983) This model was originally applied for small and middle-sized US manufacturing bankrupt and non-bankrupt firms but is applied widely all over the world in different industries and for different size categories for different purposes It is a modified version of the Z-Score Model (1968) developed for listed manufacturing firms The Zrsquorsquo-Score Model is modified to apply for private and non-manufacturing firms as well as manufacturers The literature review section summarizes recent articles in prominent academic journals that have utilized Altmanrsquos Z-Score or Zrsquorsquo-Score models or re-estimated versions of them in empirical analyses These models are typically used as benchmarks in failure prediction modeling studies where one or several alternative methods or approaches (hazard models contingent-claims intelligent algorithms etc) have been tested However in a considerable number of the reviewed studies failure prediction is not the primary focus Instead these models have been largely used as measures of financial strength As to the failure prediction studies the results have been somewhat uneven so that in some studies the models have performed well whereas in others they have been outperformed by competing models None of the reviewed studies were based on comprehensive international comparisons which makes the results difficult to generalize
19
In this study the classification performance of the Zrsquorsquo-Score model is assessed using very large data sets in an international context The purpose is to test how the original version of the Zrsquorsquo-Score Model performs in different countries and how re-estimation using another statistical method and different additional variables affect the classification performance when the data are very heterogeneous For this kind of testing in an international context seven research hypotheses on classification performance are extracted These research hypotheses are tested for all data and also separately for country data (country-level analysis) The hypotheses are associated with the following effects on the classification performance of the Zrsquorsquo-Score Model 1) re-estimation of coefficients 2) estimation method 3) year 4) size 5) age 6) industry and 7) country The estimation data are from 29 countries and the results are validated for 32 countries The countries are mainly from Europe but also three non-European countries are included (China Colombia and United States) The status used in the classification is mainly bankruptcyactive firms but also receivership firms are considered failed In Chinese data also ST (special treatment) and delisted firms are separately analysed as failed firms The analyses at the level of all data show that the original Zrsquorsquo-Score model performs very satisfactorily in an international context The effects of the four financial ratios on performance are well balanced although Book Value of Equity Total Liabilities (BVETD) showed a very small contribution in re-estimation The original model performs very well in several countries such as Poland Finland and China (ST firms) The re-estimation of the coefficients using MDA only marginally improved classification performance supporting weakly the obsolescence hypothesis (H1) or to put it differently shows that the original coefficients are extremely robust across countries and over time This same conclusion holds for the re-estimation of the model using LRA since the performance results are very similar as for MDA (H2) The use of additional variables in the model generally improved classification accuracy of the original model but the results for countries are dependent on the distribution of failed and nonfailed firms When the coefficients are estimated for all data the effects on performance in a country depend on how the distributions in that country correspond to the distributions in all data For all sets of additional variables performance is generally improved but the improvement is not strong and the effects vary country by country Thus evidence gives weak support to effects of all additional variables For the effects of bankruptcy year (H3) and size (H4) the effects are stronger but also the variations in the effects between countries are stronger The effects of age (H5) industry (H6) and country (H7) are marginal When all additional variables are included in the same model performance generally significantly increases but at the same time variations between countries become stronger In summary our evidence thus indicates that the original Zrsquorsquo-Score Model performs well in an international context It is however possible to extract a more efficient country model for most European countries and also for non-European countries using the four original variables accompanied with a set of additional background variables Considering practical applications it is obvious that while a general international model works reasonably well for most countries the classification accuracy may be somewhat improved with country-specific estimation In a country model the information provided even by simple additional variables may help boost the classification accuracy to a much higher level In finance and accounting research failure prediction models may be utilized as risk measures in many different contexts as was revealed by the literature review section Where failure prediction modeling is not the primary focus it would be time-consuming uneconomical and superfluous to first estimate a failure prediction model (or models) and only then proceed to study the phenomenon of interest In these kinds of instances a well tested general model that works reliably
20
and consistently across different countries is highly desirable Based on our empirical tests in this study the original Zrsquorsquo-Score Model and its re-estimated version containing the four Altman (1983) study variables with coefficients re-estimated using a large European data set work consistently well internationally and are easy to implement and interpret An extension to our work could include a comprehensive and more complete analysis of the Altman-Rijken (2011) thesis that a countryrsquos risk of default on its sovereign debt can be assessed by an analysis of the default probabilities of its private sector Our database permits extension of default estimates to non-publicly held firms by far the dominant population in most countries of the world and our analysis can include small and medium size firms as well as larger corporate entities
21
References
Acosta-Gonzaacutelez E Fernaacutendez-Rodriacuteguez F (2014) Forecasting financial failure of firms via genetic algorithms Computational Economics vol 43 p 133ndash157
Agarwal V Taffler R (2008) Comparing the performance of market-based and accounting-based bankruptcy prediction models Journal of Banking and Finance vol 32 p 1541ndash1551
Aktas N de Bodt E Lobez F Statnik J-C (2012) The information content of trade credit Journal of Banking and Finance vol 36 p 1402ndash1413
Allayannis G Brown GW Klapper LF (2003) Capital structure and financial risk Evidence from foreign debt use in East Asia The Journal of Finance vol 58 no 6 p 2667ndash2709
Altman EI (1968) Financial ratios discriminant analysis and the prediction of corporate bankruptcy The Journal of Finance vol 23 no 4 p 589ndash609
Altman EI (1983) Corporate Financial Distress A Complete Guide to Predicting Avoiding and
Dealing with Bankruptcy (Wiley Interscience John Wiley and Sons) also see E Altman amp E Hotchkiss
Corporate Financial Distress amp Bankruptcy 3rd edition John Wiley 2006
Altman EI Saunders A (1998) Credit risk measurement Developments over the last 20 years Journal of Banking and Finance vol 21 p 1721ndash1742
Altman EI Rijken H (2011) Toward a Bottom-Up Approach for Assessing Sovereign Default Risk Journal of Applied Corporate Finance vol 23 no 1 pp 20-31
Balcaen S Ooghe H (2006) 35 years of studies on business failure an overview of the classic statistical methodologies and their related problems The British Accounting Review vol 38 p 63ndash93
Bauer J Agarwal V (2014) Are hazard models superior to traditional bankruptcy prediction approaches A comprehensive test Journal of Banking and Finance vol 40 p 432ndash442
Beaver WH (1966) Financial ratios as predictors of failure Journal of Accounting Research vol 4 p 71ndash111
Beaver WH (1968) Alternative accounting measures as predictors of failure The Accounting Review vol 43 no 1 p 113ndash122
Begley J Ming J Watts S (1996) Bankruptcy classification errors in the 1980s An empirical analysis of Altmanrsquos and Ohlsonrsquos models Review of Accounting Studies vol 1 p 267ndash284
Bharath ST Shumway T (2008) Forecasting default with the Merton distance to default model Review of Financial Studies 21(3) 1339-1369
Butler AW Wan H (2010) Stock market liquidity and the long-run stock performance of debt issuers The Review of Financial Studies vol 23 no 11 p 3966ndash3995
Campbell J Hilscher J Szilagyi J 2008 In search of distress risk Journal of Finance 63 2899ndash2939 Carling K Jacobson T Lindeacute J Roszbach K (2007) Corporate credit risk modeling and the macroeconomy Journal of Banking and Finance vol 31 p 845ndash868
Chava S Jarrow RA (2004) Bankruptcy prediction with industry effects Review of Finance vol 8 p 537ndash569
Chen H Kacperczyk M Ortiz-Molina H (2012) Do nonfinancial stakeholders affect the pricing of risky debt Evidence from unionized workers Review of Finance vol 16 p 347ndash383
22
Clarke J Ferris SP Jayaraman N Lee J (2006) Are analyst recommendations biased Evidence from corporate bankruptcies Journal of Financial and Quantitative Analysis vol 41 no 1 p169ndash196
Clayton MJ Ravid SA (2002) The effect of leverage on bidding behavior Theory and evidence from the FCC auctions The Review of Financial Studies vol 15 no3 p 723ndash750
Das S Hanouna P Sarin A (2009) Accounting-Based versus Market-Based cross-sectional models for CDS spreads Journal of Banking amp Finance vol 33 pp 719-730
Dawkins MC Bhattacharya N Smith Bamber L (2007) Systematic share price fluctuations after bankruptcy filings and the investors who drive them Journal of Financial and Quantitative Analysis vol 42 no 2 p399ndash419
DeLong ER DeLong DM Clarke-Pearson DL (1988) Comparing the areas under two or more correlated receiver operating characteristic curves A nonparametric approach Biometrics 44(3) 837-845
Dichev I (1998) Is the Risk of Bankruptcy a Systematic Risk Journal of Finance vol 53 p 1131-1147
Dimitras AI Zanakis SH Zopounidis C (1996) Theory and methodology A survey of business failures with an emphasis on prediction methods and industrial applications European Journal of Operational Research vol 90 p 487ndash513
Eisdorfer A (2008) Empirical evidence of risk shifting in financially distressed firms The Journal of Finance vol 63 no 2 p 609ndash637
Fich EM Slezak SL (2008) Can corporate governance save distressed firms from bankruptcy An empirical analysis Review of Quantitative Finance and Accounting vol 30 p 225ndash251
Franzen LA Rodgers KJ Simin TT (2007) Measuring distress risk The effect of RandD intensity The Journal of Finance vol 62 no 6 p 2931ndash2967
Grice JS Dugan MT (2001) The limitations of bankruptcy prediction models Some cautions for the researcher Review of Quantitative Finance and Accounting vol 17 p 151ndash166
Grice JS Jr Dugan MT (2003) Re-estimations of the Zmijewski and Ohlson bankruptcy prediction models Advances in Accounting vol 20 p 77ndash93
Grice JS Ingram RW (2001) Tests of the generalizability of Altmanrsquos bankruptcy prediction model Journal of Business Research vol 54 p 53ndash61
Griffin JM Lemmon ML (2002) Book-to-market equity distress risk and stock returns The Journal of Finance vol 57 no 5 p 2317ndash2336
Hillegeist SA Keating EK Cram DP Lundstedt KG (2004) Assessing the probability of bankruptcy Review of Accounting Studies vol 9 p 5ndash34
Hirsch B T and Macpherson D A (2003) Union membership and coverage database from the Current Population Survey Note Industrial and Labor Relations Review 56 349ndash354
Ho C-Y McCarthy P Yang Y Ye X (2013) Bankruptcy in the pulp and paper industry marketrsquos reaction and prediction Empirical Economics vol 45 p 1205ndash1232
Holder-Webb LM Wilkins MS (2000) The incremental information content of SAS No 59 Going-concern opinions Journal of Accounting Research vol 38 no 1 p 209ndash219
Hosmer D Lemeshow S (1989) Applied Logistic Regression (Wiley Interscience Prentice Hall International)
Jackson RHG Wood A (2013) The performance of insolvency prediction and credit risk models in the UK A comparative study The British Accounting Review vol 45 p 183ndash202
23
Karels G Prakash AJ (1987) Multivariate normality and forecasting of business bankruptcy Journal of Business Finance and Accounting 14(4) 573-593
Kieschnick R La Plante M Moussawi R (2013) Working capital management and shareholdersrsquo wealth Review of Finance vol 17 p 1827ndash1852
Kumar PR Ravi V (2007) Bankruptcy prediction in banks and firms via statistical and intelligent techniques ndash A review European Journal of Operational Research vol 180 p 1ndash28
Kwak W Shi Y Cheh JJ Lee H (2005) Multiple criteria linear programming data mining approach An application for bankruptcy prediction Data Mining and Knowledge Management Lecture Notes in Computer Science vol 3327 p 164ndash173
Li M-YL Miu P (2010) A hybrid bankruptcy prediction model with dynamic loadings on accounting-ratio-based and market-based information A binary quantile regression approach Journal of Empirical Finance vol 17 p 818ndash833
Lyandres E Zhdanov A (2013) Investment opportunities and bankruptcy prediction Journal of Financial Markets vol 16 p 439ndash476
Merkevicius E Garšva G Girdzijauskas S (2006) A hybrid SOM-Altman model for bankruptcy prediction International Conference on Computational Science Lecture Notes in Computer Science vol 3994 p 364ndash371
Ohlson J (1980) Financial ratios and probabilistic prediction of bankruptcy Journal of Accounting Research vol 18 p 109-131
Ooghe H Balcaen S (2007) Are failure prediction models widely usable An empirical study using a Belgian dataset Multinational Finance Journal 11(12) 33-76
Philippe and Partners and Deloitte and Touche Corporate Finance (2002) Bankruptcy and a Fresh Start Stigma on Failure and Legal Consequences of Bankruptcy (International Insolvency Institute Brussels Belgium)
Philosophov LV Batten JA Philosophov VL (2008) Predicting the event and time horizon of bankruptcy using financial ratios and the maturity schedule of long-term debt Mathematics and Financial Economics vol 1 p 181ndash212
Pindado J Rodrigues L de la Torre C (2008) Estimating financial distress likelihood Journal of Business Research vol 61 p 995ndash1003
Piotroski JD (2000) Value investing The use of historical financial statement information to separate winners from losers Journal of Accounting Research vol 38 Supplement Studies on accounting information and the economics of the firm p 1ndash41
Reisz AS Perlich C (2007) A market-based framework for bankruptcy prediction Journal of Financial Stability vol 3 p 85ndash131
Shen C-H Chen Y-K Huang B-Y (2010) The prediction of default with outliers Robust logistic regression Handbook of Quantitative Finance and Risk Management p 965ndash977
Shumway T (2001) Forecasting bankruptcy more accurately A simple hazard model Journal of Business vol 74 p 101-124 Singhal R Zhu Y (2013) Bankruptcy risk costs and corporate diversification Journal of Banking and Finance vol 37 p 1475ndash1489
Smith M Liou D-K (2007) Industrial sector and financial distress Managerial Auditing Journal vol 22 Issue 4 p 376 - 391
24
Sun L (2007) A re-evaluation of auditorsrsquo opinions versus statistical models in bankruptcy prediction Review of Quantitative Finance and Accounting vol 28 p 55ndash78
Taffler RJ (1984) Empirical models for the monitoring of UK corporations Journal of Banking and Finance vol 8 Issue 2 p 199-227
Uhde A Heimeshoff U (2009) Consolidation in banking and financial stability in Europe Empirical evidence Journal of Banking and Finance vol 33 p 1299ndash1311 Vassalou M Xing Y (2004) Default Risk in Equity Returns Journal of Finance vol 59 p 831-868
Wang Y and Campbell M (2010) Business failure prediction for publicly listed companies in China Journal of Business and Management 16(1) 75-88
Wu Y Gaunt C Gray S (2010) A comparison of alternative bankruptcy prediction models Journal of Contemporary Accounting and Economics vol 6 p 34ndash45
Xu M Zhang C (2009) Bankruptcy prediction the case of Japanese listed companies Review of Accounting Studies vol 14 p 534ndash558
Zhang L Altman EI and Yen J (2010) Corporate financial distress diagnosis model and application in credit rating for listing firms in China Frontiers of Computer Science in China 4(2) 220-236
Zmijewski ME (1984) Methodological Issues Related to the Estimation of Financial Distress Prediction Models Journal of Accounting Research vol 22 Studies on Current Econometric Issues in Accounting Research p 59-82
25
Tables Table 1 Summary of the literature review of Z-Score Models from year 2000
Authors and year of publication
Period and population or sample Goal methodology and z-score application
Main conclusions
Holder-Webb LM Wilkins MS (2000)
217 firms filing for bankruptcy identified by NAARS or Wall Street Journal between 1975-1996
(M) Evaluation of the impact of implementation of auditing standard on going concern on information value for investors (bankruptcy surprise and audit opinion were assessed by investorsrsquo reactions to bankruptcy news in the event window) Authors implemented BKPRO variable based on z-score in the model as a ratio-based measure of financial distress
Bankruptcy surprise was greater in case of a clean going concern opinion The results hold after controlling for eg firmrsquos level of financial distress
Piotroski JD (2000) 14043 firms with high book-to-market (BM) values across 21 years (1976 -1996) in Compustat database
(M) The application of a simple accounting-based fundamental analysis strategy as a tool for broad portfolio management of high BM firms The author used z-score as financial distress measure in order to justify his own model
The author concluded that firms with lower level of financial distress earned significantly stronger future returns than the highly distressed firms Mean return for the investor involved in the high BM assets could be increased by selection of firms that are financially strong
Grice JS Ingram RW (2001)
972 companies for 1985ndash1987 in the estimation sample (148 distressed and 824 non-distressed) and 1002 companies for 1988ndash1991 in the prediction sample (148 distressed and 854 non-distressed) in Compustat database
(V) Verification of z-score model with 3 questions Is the model as useful as in the previous periods Is the model useful for predicting bankruptcy of non-manufacturing firms as it was for manufacturing firms Is the model useful for predicting financial stress other than bankruptcy
Prediction accuracy of the model declined over time and coefficients of the model significantly changed which means that the relation between financial ratios and financial distress has changed over time Model was sensitive to industry classification (better for manufacturing firms) and not sensitive to the type of financial distress Similar conclusions were drawn in case of Ohlsonrsquos (1980) and Zmijewskirsquos (1984)
26
model by Grice JS Dugan MT (2001)
Clayton MJ Ravid SA (2002)
Federal Communication Commission (FCC) spectrum auctions for 1994-1995 together with firm-specific and region-specific variables
(M) The authors examined the link between capital structure of firms and their bidding behaviour The authors used z-score as a proxy for financial strength and alternative measure of default risk
Empirical analysis showed that as the firmrsquos and the competitorrsquos debt level increase firms tend to submit lower bids which supported authors theoretical model
Griffin JM Lemmon ML (2002)
Sample similar to Fama and French (1992) Non-financial NYSE Nasdaq Amex stocks monthly returns for stocks with nonnegative book value of equity from July 1965 to June 1996
(R) The authors investigated relationship between book-to-market equity distress risk and stock returns They used Ohlsonrsquos o-score but additionally run robustness check with the use of z-score as measure of distress risk
In case of firms with the highest risk of distress the difference in return between high and low book-to-market equity securities was more than twice higher than in case of other groups
Allayannis G et al(2003)
SBC Warburg Dillon Read database with local foreign and synthetic local (hedged foreign) currency debt for 327 largest East Asian non-financial companies from 1996-1998
(M) The first research issue was to check determinants of firmrsquos choice of debt currency local foreign or synthetic local The second research issue was related to the relation of the type of debt and financial performance during the Asian crisis Asian financial crisis was treated as natural experiment They used modified z-score (2000) as one of the financial performance measures
The authors found no evidence that unhedged foreign debt was the cause of poor performance However the use of synthetic currency caused poor stock market performance because of the derivatives market illiquidity during the crisis
Hillegeist SA et al (2004)
Sample covered 78100 firm-year observations (representing 14303 individual industrial firms) for 1980-2000 period with 756 initial bankruptcies
(V) The authors confronted Altmanrsquos z-score and Ohlsonrsquos o-score (with original and up-dated coefficients) with the model based on BSM option pricing model (BSM-Prob) They used relative information content tests to compare the out-of-sample performance
BSM-Prob outperformed accounting based models Conclusions were robust to various modifications of both accounting based models BSM-Prob was not dependent on time horizon and difference in accounting standards in various countries Thus it allowed for international comparisons
Chava S Jarrow RA (2004)
US publicly listed companiesrsquo monthly and yearly data for 1962-1999 period with 1461 bankruptcies
(V) The authors employed extended bankruptcy database to prove the superiority of Shumwayrsquos model (2001) over Altmanrsquos (1968) and Zmijewskirsquos
In case of Shumwayrsquos model 744 (in the first decile) of the bankruptcies were correctly identified for Altmanrsquos model ndash it was 632 and for Zmijewskirsquos model - 432
27
(1984) models Three other goals were included into their research The authors re-estimated models over the 1962ndash1990 period and forecasted bankruptcies over 1991ndash1999
Market-based model outperformed also in case of ROC curve Market variables were better in predicting bankruptcy than accounting variables and the use of monthly data improved prediction
Kwak etal (2005) Data from 1992 to 1998 for bankrupt firms and 584 times more of control firms for the same period Standard and Poorrsquos database was used for US companies from major 3 stock exchanges
(V) Multiple Criteria Linear Programming (MCLP) was used to model 5 Altmanrsquos and 9 Ohlsonrsquos variables in order to apply it for bankruptcy prediction
In case of both models overall predication rate of Ohlsonrsquos model is similar to Altmanrsquos model (8676 vs 8856) with more control firms The MCLP approach performed better than Altmanrsquos model and give similar or better results than Ohlsonrsquos model
Merkevicius E et al (2006)
Data from two sources EDGAR PRO Online Database (ldquotraindatardquo with 1108 records) and database form Lithuanian bank (ldquotestdatardquo with 742 records) for year 2004
(V) The hybrid model was developed with the use of Altmanrsquos z-score model with the changed weights for variables and self-organizing map which was an unsupervised learning artificial neural network (called SOM-Altman model)
Hybrid SOM-Altmanrsquos model reached the prediction rate of 9235 It is easy to adopt for different data sets also from developed and developing countries
Clarke J et al (2006) The initial sample of 995 firms that filed for bankruptcy from 1995 to 2011 Analysts recommendations were taken from IBES database In the final sample the authors used 289 bankrupt firms and their non-bankrupt matches
(M) The research focus was to test if there is a bias in analystsrsquo recommendations for firms that filed for bankruptcy (chapter 11) Altmanrsquos z-score was calculated two years preceding the bankruptcy year
Analysts actively revised their recommendations downward in case of firms that faced bankruptcy The recommendation declined from ldquobuyrdquo about 2 years prior to bankruptcy The authors found no evidence of analystsrsquo bias and conflict of interest
Reisz AS Perlich C (2007)
The authors used 5784 industrial firms for 1988-2002 which gave 33238 non-bankrupt and 799 bankrupt firm-years
(V) The authors used barrier option model for bankruptcy prediction (DOC) and compared its discriminatory power with other market-based (BSM and KMV) and accounting-based models (Altmanrsquos z-score and zrdquo-score developed in 1993 for private firms)
The authors proved domination of Altmanrsquos z-score and zrdquo-score for short term bankruptcy prediction For medium- and long-term bankruptcy prediction DOC outperformed other models
28
Sun L (2007) US public traded firms on the major stock exchanges from 1991 to 2002 The final bankruptcy training sample consists in 344 firms (1657 firm-years) and the final non-bankruptcy training sample ndash 3183 (20918 firm-years) The test samples used respectively 243 and 1165 firms
(M) The main purpose of the research was to compare the performance of auditorsrsquo going concern opinions with the results of bankruptcy prediction models The author improved previous research by using a composite score of financial distress stock-market variables industry failure rate and applying hazard model Altmanrsquos z-score was one of the 4 criteria (besides auditorrsquos opinion Zmijewskirsquos probability and stock return) used as a ldquostressrdquo variable In the final model the author used Zmijewskirsquos probability as the best
The hazard model outperformed auditorrsquos going concern opinions so statistical models could be of any help for auditorsrsquo opinions Market variables had significant explanatory power for auditorrsquos opinion while industry failure rate did not have it Auditorsrsquo going concern opinions had incremental prediction ability beyond traditional financial ratios a composite measure of financial distress market variables and industry failure rate
Franzen LA et al (2007)
US firms listed on the major stock exchanges for the period 1981-2004 with sufficient data to compute accounting-based measures of financial distress RampD intensity and portfolio returns The number of firms filing for bankruptcy was 929
(M) The authors focused on the impact of RampD spending on financial distress prediction They used accounting based models with the special focus on Ohlsonrsquos o-score since it included only accounting based measures Altmanrsquos z-score was used for supporting purposes since it included also market data
Accounting-based measures less accurately classify firms with higher RampD spending In case of adjustment for conservative accounting treatment of RampD and tax effects the classification was better Z-score was used as a benchmark Z-score was more robust to the changes that distort the o-score due to the use of market value Adjustment of z-score for the conservative treatment of RampD improved the classification
Dawkins MC etal (2007)
272 US firms that filed for bankruptcy between 1993 and 2003 traded on the major stock exchanges Investorsrsquo intraday transactions were taken from Trade and Quote database (TAQ)
(M) The authors investigated pattern of returns and investors trades around and shortly after Chapter 11 bankruptcy announcement They divided the investigated period into bull and bear markets The authors used five event windows Altmanrsquos z-score was used as a measure of firmrsquos financial condition
Large traders were dominating transactions around and after bankruptcy filing The authors found a modest negative correlation between the price plunge and post-filing period returns Investorsrsquo reactions were anomalously optimistic in the period of a bull market
29
Agarwal V and Taffler R (2008)
Non-finance UK firms listed on the LSE at any time during the period 1985-2001 The final sample covered 2006 firms (15384 firm-years) and 103 failures
(V) In the paper the authors compared accounting-based models and market based models in terms of predictive ability information content and bank credit portfolio profitability Accounting- based models were represented by Tafflerrsquos (1984) UK z-score based on Altmanrsquos (1968)
In the case of the predictive ability there was a little difference between those two types of models however both carried unique information about firm failure The use of the z-score model generated much higher risk-adjusted return profit and return on risk-weighted assets
Philosophov LV et al (2008)
No sample of non-bankrupt firms 100 US non-financial firms that filed for bankruptcy between 1997 and 2002
(V) The authors appliedmulti-alternative decision rules for bankruptcy prediction (BMP) Bayesian-type forecasting rules used debt repayment schedule and traditional financial ratios Results of the new approach were compared with Altmanrsquos z-score
The authors have identified 4 factors important for multiperiod approach Two of them reflect quantity and quality of debt and the two others the ability to pay the debt back Those factors are similar to as those proposed in the z-score The set of factors did not change however the predictive ability decreased over time BPM outperformed z-score in total probability of correct predictions while ldquofalse alarmrdquo was comparable
Fich EM Slezak SL (2008)
The sample includes 781 companies with 34 that filed for bankruptcy The period covers 1992-2000 Except the availability of financial and market data the availability of corporate governance data from Edgar data retrieval system was a prerequisite
(M) The authors explored how governance characteristics affect firmrsquos ability to avoid bankruptcy and power of accountingfinancial information to predict bankruptcy with the use of hazard models Altmanrsquos z-score was applied as a measure of firmrsquos financial distress together with interest coverage ratio (ICR)
Corporate governance characteristics are important for bankruptcy prediction About 25-30 of the variation in the occurrence of bankruptcy was explained by governance characteristics Smaller and independent boards with a higher ratio of non-inside directors and with larger ownership stakes of inside directors are more effective at avoiding bankruptcy if the firm became distressed
Eisdorfer A (2008) US companies traded on the major stock exchanges for period from 1963 to 2002 representing 7114 firms (52112 firm-years)
(M) The author tested two hypotheses volatility has a positive effect on distressed firmsrsquo investment and investments of these firms generate less
In case of first hypothesis z-score results were stronger than those based on KMV but in case of the second hypothesis KMV results were stronger Empirical tests indicated that
30
value during high uncertainty periods with the use of real option approach Altmanrsquos z-score and KMV model were used as a measure of firmrsquos financial distress
risk-shifting considerations are taken into account by distressed firms
Pindado J et al (2008)
Sample covered 1583 US companies (15702 observations) and 2250 companies (18160 observations) for the other G-7 countries for the period from 1990 to 2002 from Compustat The data panel was unbalanced
(R)The authorsrsquo developed ex-ante model for estimation of financial distress likehood (FDL) and presented financially (not legally) based definition of distress Re-estimated Altmanrsquos z-score was used for robustness check
The model is stable in terms of magnitude sign and significance of the coefficients and it provides a measure of FDL more robust to time and countries than other models In case of the re-estimated z-score model only profitability and retained earnings maintained their significance for different years and countries
Xu M Zhang C (2009)
Non-financial Japanese listed companies from 1992 to 2005 The number of firms was 3510 with 76 bankruptcies
(V) The authors applied Altmanrsquos z-score Ohlsonrsquos o-score and Mertonrsquos distance-to-default (d-score) to Japanese firms in order to check if the models are useful for bankruptcy prediction in Japan They also ldquomergedrdquo the models into c-score They introduced Japan-unique variables in order to check if corporate structure variables have impact on the probability of bankruptcy (x-score)
The models were also useful for Japanese firms in bankruptcy prediction but the market-based model was more successful The developed c-score and x-score models improved bankruptcy prediction
Li M-YL Miu P (2010)
Non-financial firms from Compustat database from 2nd Quarter 1996 to 4th Quarter 2006 The sample covered 73 failed firms and 138 non-failed firms with at least rating B during the whole period
(M) Altmanrsquos z-score and Mertonrsquos distance-to-default (DD) were used as variables in the model The authors developed hybrid bankruptcy prediction model with constant and dynamic loadings with the use of binary quintile regression (BQR)
The results of the research pointed out the superiority of the model with dynamic loadings In the case of firms with relatively poor credit quality the prediction accuracy might be improved by putting more attention to DD and less to the z-score In case of firms with relatively good credit quality the recommendations are the opposite eg more attention should be put to the z-score
31
Wu Y et al (2010) NYSE- and AMEX-listed Compustat non-financial firms for the period from 1980 to 2006 The final sample covered 50611 firm-years with 887 bankruptcies and 49724 non-bankrupt firm-years
(V) Five models (Altman 1968 Ohlson 1980 Zmijewski 1984 Shumway 2001 Hillegeist et al 2004) from the literature are used by the authors in order to evaluate their performance with an up-to-date data set Based on them the authors build their own integrated model (multi-period logit model with expanded set of variables)
The integrated model using accounting and market data as well as firmsrsquo characteristics outperformed the other models Altmanrsquos z-score performed poorly in comparison to the other 4 models Shumwayrsquos model outperformed model of Hillegeist et al performed adequately and Ohlsonrsquos and Zmijewskirsquos models performed adequately but their performance deteriorated over time
Shen C-H et al (2010)
Non-financial companies listed on the Taiwan Stock Exchange covering the period from 1999 to 2004 There were 52 default companies and 156 non-default companies in the sample
(V) The authors applied a robust logit method to build up an empirical model based on Altmanrsquos z-score (one variable was omitted retained earnings to total assets) They took into account outliers which so far have been omitted in the models The results of robust logit method were compared with logit method
In the case of in-the-sample forecasts robust logit models preformed better than the logit model However in the case of out-the-sample forecast superiority of robust logit model disappeared Robust logit model was more aggressive in assigning firms as default
Butler AW Wan H (2010)
New debt offerings from 1975-1999 (4293 offerings within 632 convertible debt issue) Sample covered non-regulated utility and non-financial companies listed on major US stock exchanges The first offering in the sample period for a particular firm was used and the other offerings from the same firms within the following five years were excluded from the sample
(M) The aim of the paper was to assess long-term stock performance of debt and convertible debt issuers The authors revised the results of the previous research on the stock returns of bond issuing firms According to the authors previous models omitted liquidity factor Altmanrsquos z-score was used as a proxy for financial distress besides momentum as another matching criterion
Introduction of the liquidity factor into the model erased long-run underperformance of debt and convertible debt issuers Momentum and Altmanrsquos z-score did not erase this underperformance
Aktas N et al (2012) US listed non-financial firms with z-score higher than the median of the population from 1992 to 2007 The
(M) The article investigated the relationship between the use of trade credit and the quality of firmsrsquo
According to the empirical study the change in the trade credit signaled the future positive change in firmrsquos performance
32
sample consisted in 15928 firm-years from 2096 firms
investments Altmanrsquos z-score was used as one of three proxies for measuring the quality of firmrsquos investment projects (additionally return on assets and long-term abnormal returns) The authors developed a theoretical model for trade credit decision with the use of strategic game with imperfect information as well as empirical study
Empirical results supported conclusions from the theoretical model In the case of the use of next period change of the z-score the authors confirmed both CEO incentive and entrenchment however in the case of two other proxies only CEO incentive
Chen H et al (2012) US non-financial companies issuing debt securities from Lehman Brothers Bond Database data on unionization described in Hirsch and Macpherson (2003) supported by financial and demographic data The period covered years from 1984 to 1998 The sample consisted in 996 firms and 5557 firm-years observations
(M) The authors focused on the impact of ldquounionized workersrdquo on the pricing of corporate debt Altmanrsquos z-score was used as one of 5 measures of distress (accompanied by interest coverage book equity Ohlsonrsquos o-score and default measure developed by Bharath and Shumway in 2008)
The authors drew 4 conclusions In the case of more ldquounionizedrdquo industries the yield on bonds is lower the impact is stronger in firms with weak financial standing highly ldquounionizedrdquo firms invested less in RampD than in physical assets they were less likely to be the acquisition target According to the authors ldquounionized workersrdquo protected bondholdersrsquo and other fixed claimants wealth
Jackson RHG Wood A (2013)
LSE-listed non-financial UK firms The sample consisted in 101 failed firms of which failure was registered from 30 Sept 2000 to 31 Dec 2009 and 6494 non-failed firm-years from 1 Jan 2000 to 31 Dec 2009
(V) The authors tested 13 different models of bankruptcy prediction and assessed their efficacy with the use of ROC curve They selected 3 single variable models 3 accounting-based models (with Altmanrsquos z-score) in two versions with up-dated coefficients and neural network approach 4 contingent claims models
Contingent claims models outperformed the other models The best four models are contingent claims models based on European call and barrier options In the case of application of the neural network to accounting based models the predictive ability improved however was still lower than in case of market-based models
Singhal R Zhu Y (2013)
US non-financial firms Final sample covered 769 bankruptcy filings between 1 Jan 1991 to 31 Dec 2007 Failed firms were divided to two groups focused (622) and diversified (147)
(M) The focus of the study was to check bankruptcy risk and bankruptcy costs in the case of focused vs diversified firms Altmanrsquos z-score was used as a measure of financial distress
The mean and median z-score for diversified groups were higher than for focused groups The Z-score was highly correlated with the leverage in the authorsrsquo model Diversified firms represented a lower risk of bankruptcy however they underperformed focused firms
33
in other areas (like inefficient segment investment and longer time in the bankruptcy procedure what incurred higher bankruptcy costs)
Lyandres E Zhdanov A (2013)
US companies (financial and non-financial) listed on major stock-exchanges The sample covered period from 1985 to 2005 The number of bankruptcies was 948 (compiled from different sources like Thomson Financial and T Shumwayrsquos database) and the number of firm-years was 146836
(V) The authors posed the question if the inclusion of variables related to investment opportunities improved the predictive power of three models (Altmanrsquos z-score Zmijewskirsquos and Shumwayrsquos models) They used 3 proxies for investment opportunities (market-to-book value-to-book RampD-to-assets)
The measures of investment opportunities were related to the likehood of default Inclusion of either of three investment opportunities measures improved modelsrsquo out-of-sample forecasting ability
Ho C-Y et al (2013) North America publicly listed pulp and papers firms Sample includes 122 firms within 12 that filed for bankruptcy The period from 1990 to 2009 Data were compiled from different sources (like Compustat CRSP WRDS)
(R) The paper investigated bankruptcy prediction with the use of financial ratios and investorsrsquo reactions to bankruptcy filing The authors used Ohlsonrsquos model (original and re-estimated) to predict bankruptcy in the pulp and paper industry Altmanrsquos z-score (original and re-estimated) was used for robustness check
Investorsrsquo suffered significant losses during the month a bankruptcy occurred O-scores of failed firms were higher than in case of non-failed firms 1 to 2 year before the bankruptcy Re-estimated Ohlsonrsquos model performed better than the original In the case of Altmanrsquos z-score the re-estimated model performed better due to the reduction of Type II errors that occurred in the original one In both cases models were useful for bankruptcy prediction
Kieschnick R et al (2013)
Non-financial US companies from 1990 to 2006 There were 3786 companies in the sample (yearly average)
(M) The paper focused on the relationship between working capital management and shareholdersrsquo wealth as well as their determinants Altmanrsquos original (1968) and revised (2000) z-score were used as a measure of the financial distress
The authors concluded that ldquoincremental dollar invested in net operating capital is worth less than an incremental dollar held in cash for the average firmrdquo The impact on the shareholder value was determined by sales expectations access to external capital bankruptcy risk and debt load The higher the z-score was the more valuable its investment in working capital
34
Acosta-Gonzaacutelez E
Fernaacutendez-Rodriacuteguez
F (2014)
Spanish building industry firms For model estimation the sample covered 93 firms that failed in 2004 and 257 randomly selected non-failed firms for the period from 2000 to 2004 For ex-ante forecast accounting information from 2005 for randomly selected 400 out of which 80 failed in 2007
(V) The authors used genetic algorithms with Schwarz information criterion (GASIC) for variables selection (out of 32 preselected ratios) combined with the logit model for bankruptcy prediction Altmanrsquos z-score model was used as one of two benchmarks for authorsrsquo model evaluation
One step ahead forecast Altmanrsquos model was better in predicting failed firms but the type II error was high two and three steps ahead forecasts were similar in terms of failed firms but in the case of non-failed Altmanrsquos model prediction was worse four steps ahead forecasts GASIC model outperformed in the case of failed firms and was comparable in the case of non-failed firms
Note Based on the own review of studies
35
35
Table 2 Number of observations by country
Estimation data Test data
Country Non-failed Failed Non-failed Failed
Austria (AT) 7430 55 7526 44
Belgium (BE) 179979 2994 179818 2944
Bosnia (BA) 29391 35 29139 32
Bulgaria (BG) 50041 48 42351 44
China (CN) 39315 198
China delisted dataset
16291 29
China ST data 846 16 1020 16
Colombia (CO) 8366 139 6982 125
Greece (GR) 51763 28
Croatia (HR) 59541 249 58478 275
Czech Republic (CZ) 92835 556 92562 564
Denmark (DK) 167934 1334 168538 1398
Estonia (EE) 34313 234 34196 242
Finland (FI) 90878 481 91227 459
France (FR) 160749 6124 161653 6318
Germany (DE) 98814 910 99496 921
Hungary (HU) 19421 303 20155 313
Iceland (IS) 17399 248 17624 243
Ireland (IE) 6665 121 6406 139
Italy (IT) 167113 8101 166258 8124
Latvia (LV) 8064 433 8241 477
Lithuania (LT) 10000 56
Netherlands (NL) 20885 154 15854 147
Norway (NO) 172467 1294 170985 1206
Poland (PL) 87200 291 86233 264
Portugal (PT) 180114 3390 178646 3422
Romania (RO) 161992 97 164259 93
Russian Federation (RU) 116903 2534 115711 2481
Serbia (RS) 100100 68
Slovakia (SK) 7856 120 7788 124
Slovenia (SI) 14419 59 14081 41
Spain (ES) 156746 3036 158122 2991
Sweden (SE) 169810 2256 169999 2314
Ukraine (UA) 133342 1787 133980 1765
United Kingdom (GB) 171493 760 170930 716
UK (GB) liquidation dataset
342423
4990
United States (US) 9557 56 9929 53
In total 2602563 38215 3148079 43664
36
36
Table 3 Descriptive statistics (all data)
WCTA RETA EBITTA BVETD
Statistic Non-failed Failed Non-failed Failed
Non-failed Failed
Non-failed Failed
Median 0152 -0059 0189 -0024 0041 -0020 0451 0025
Mean 0147 -0213 0188 -0317 0055 -0108 3594 0703
Standard deviation 0442 0604 0509 0767 0227 0296 11499 5712
Upper quartile 0420 0142 0476 0087 0131 0042 1548 0215
Lower quartile -0040 -0440 0011 -0450 -0008 -0208 0100 -0240
Maximum 0956 0956 0958 0958 0785 0785 68606 68606
Minimum -1637 -1637 -2453 -2453 -0828 -0828 -0649 -0649
Legend WCTA = Working CapitalTotal Assets
RETA = Retained EarningsTotal Assets EBITTA = EBITTotal Assets
BVETD = Book Value of EquityTotal Liabilities SALTA = SalesTotal Assets
37
37
Table 4 The coefficients of the different models estimated for all data
Coefficients for different statistical models
Variable Zrsquo-Score
Model 1
Model 2
Model 3 Model 4
Model 5
Model 6
Model 7 Model 8
Constant 325 -0042 0035 0207 -13466 0007 0048 0049 -13302
WCTA 656 -0561 -0495 -0483 -0441 -0487 -0540 -0496 -0459
RETA 326 -0724 -0862 -0891 -1146 -0846 -0859 -0863 -1160
EBITTA 672 -1791 -1721 -1790 -1619 -1757 -1695 -1717 -1682
BVETD 105 -0021 -0017 -0016 -0012 -0017 -0016 -0017 -0013
Year dummies
Year 2008 -0055 -0034
Year 2009 -0179 -0150
Year 2010 -0666 -0631
Size variables Total assets (log)
1830
1837
Total assets squared (log)
-0061
-0061
Age dummies
Less than 6 years 0135 0186
Over 12 years -0058 -0099
Country risk SP Country rating rank
-0003 -0014
Industry dummies
Restaurants and hotels -0653 -0628
Construction 0445 0365
Whole sale and retailing -0112 -0157
Agriculture -0180 -0176
Manufacturing 0139 0095
Energy and water production -0454 -0472
Information technology -0913 -0915
Significance
38
38
Coefficients are statistically significant at 00001
Models
Zrsquo-Score = Original Altman (1983) Zrsquo-Score Model coefficients Model 1 = The MDA model
Model 2 = The LR model Model 3 = The LR model estimated for all data with year dummies
Model 4 = The LR model estimated for all data with size variables Model 5 = The LR model estimated for all data with age category dummies Model 6 = The LR model estimated for all data with industry dummies Model 7 = The LR model estimated for all data with country risk rank Model 8 = The LR model estimated for all data with all variables
39
39
40
40
Table 5 Test data AUCs for different countries based on all data model versions Comparisons are with AUC of the LR model estimated for all data (benchmark)
Test data AUC for different models
Country Benchmark Model 1 Model 2 Model 3 Model 4 Model 5 Model 6 Model 7 Model 8
All Data 0748 0743---- 0745---- 0752++++ 0760++++ 0748+++ 0751++++ 0749++++ 0771++++
Countries with estimation data
Austria (AT) 0800 0788 0797 0805 0818+ 0814+ 0782 0800 0819
Belgium (BE) 0772 0760 0770 0777 0747 0777 0765 0772 0758
Bosnia (BA) 0862 0805 0857 0776 0863 0847 0855 0862 0784
Bulgaria (BG) 0684 0630 0680 0654 0691 0680 0659 0684 0632
China ST companies 0985 0911---- 0983 0958- 0977 0978 0987 0985 0968
Colombia (CO) 0726 0724 0727 0715 0758 0728 0726 0726 0757
Croatia (HR) 0844 0812 0839 0803 0837 0835 0832 0844 0801
Czech Republic (CZ) 0811 0813 0811 0819 0828 0807 0820 0811 0838
Denmark (DK) 0803 0798 0800 0781 0813 0802 0801 0803 0796
Estonia (EE) 0823 0827 0823 0847 0866 0826 0833 0823 0890
Finland (FI) 0867 0864 0866 0835 0862 0870 0878 0867 0853
France (FR) 0739 0723 0735 0749 0771 0741 0762 0739 0799
Germany (DE) 0673 0658 0666 0695 0656 0684 0677 0673 0688
Hungary (HU) 0742 0746 0740 0660 0738 0755 0735 0742 0696
Iceland (IS) 0664 0674 0666 0694 0678 0673 0672 0664 0716
Ireland (IE) 0679 0672 0676 0708 0677 0681 0688 0679 0712
Italy (IT) 0806 0799 0804 0833 0835 0806 0799 0806 0849
Latvia (LV) 0678 0691 0678 0704 0676 0686 0698 0678 0724
Netherlands (NL) 0752 0754 0750 0775 0769 0754 0746 0752 0787
Norway (NO) 0716 0694 0713 0658 0682 0720 0715 0716 0645
41
41
Poland (PL) 0903 0904 0904 0908 0902 0903 0899 0903 0904
Portugal (PT) 0741 0724 0736 0749 0773 0738 0755 0741 0785
Romania (RO) 0758 0740 0754 0709 0749 0755 0748 0758 0703
Russian Federation (RU) 0811 0802 0812 0843 0799 0807 0799 0811 0814
Slovakia (SK) 0777 0774 0776 0780 0811 0769 0786 0777 0808
Slovenia (SI) 0737 0725 0733 0674 0740 0747 0718 0737 0721
Spain (ES) 0734 0713 0732 0707 0793 0728 0753 0734 0774
Sweden (SE) 0813 0801 0809 0799 0784 0817 0823 0814 0800
Ukraine (UA) 0708 0714 0710 0715 0721 0708 0702 0708 0722
United Kingdom (GB) 0699 0719 0699 0686 0736 0695 0706 0699 0729
United States (US) 0710 0701 0711 0709 0722 0705 0716 0710 0723
Countries only in test data
European
Greece (GR) 0715 0670 0702 0725 0711 0713 0717 0715 0718
Lithuania (LT) 0767 0782 0767 0764 0768 0769 0775 0767 0778
Serbia (RS) 0736 0713 0730 0603- 0826 0720 0753 0736 0738
United Kingdom Liquidation set 0606 0621 0603 0620 0618 0610 0607 0607 0635
Non-European
China (CN) 0558 0570 0557 0572 0543 0554 0567 0558 0556
China Delisted companies 0529 0546 0519 0563 0740++++ 0542 0520 0529 0707+++
Significance AUC better than benchmark 00001 = ++++ 0001 = +++ 001 = ++ 01 = +
AUC worse than benchmark 00001 = ---- 0001 = --- 001 = -- 01 = - Models
Benchmark = The LR model estimated for all data with Zrsquorsquo-model (1983) variables Model 1 = The original Altman (1983) Zrsquorsquo-Score Model
Model 2 = The MDA model estimated for all data Model 3 = The LR model estimated for all data with year dummies
42
42
Model 4 = The LR model estimated for all data with size variables Model 5 = The LR model estimated for all data with age category dummies Model 6 = The LR model estimated for all data with industry dummies Model 7 = The LR model estimated for all data with country risk rank Model 8 = The LR model estimated for all data with all variables
43
43
Table 6 Differences of medians between non-failed and failed groups
Country WCTA RETA EBITTA BVETD AUC of
Z-Score
Austria (AT) 0448 0405 0126 0487 0788
Belgium (BE) 0223 0264 0077 0431 0760
Bosnia (BA) 0106 0249 0088 0580 0805
Bulgaria (BG) 0114 0291 0094 0436 0630
China (CN) 0068 0032 0016 0280 0570
China delisted data 0089 -0061 -0032 0083 0546
China ST data 0298 0293 0139 0468 0911
Colombia (CO) 0226 0235 0099 0705 0724
Croatia (HR) 0275 0335 0044 0274 0812
Czech Republic (CZ) 0404 0397 0069 0667 0813
Denmark (DK) 0267 0356 0046 0733 0798
Estonia (EE) 0331 0388 0113 1033 0827
Finland (FI) 0402 0606 0207 0907 0864
France (FR) 0140 0213 0065 0424 0723
Germany (DE) 0131 0136 0032 0262 0658
Greece (GR) 0171 0262 0049 0349 0670
Hungary (HU) 0175 0224 0052 0587 0746
Iceland (IS) 0246 0261 0051 0337 0674
Ireland (IE) 0181 0266 0039 0560 0672
Italy (IT) 0277 0164 0073 0207 0799
Latvia (LV) 0117 0120 0042 0254 0691
Lithuania (LT) 0246 0218 0051 0569 0782
Netherlands (NL) 0204 0253 0077 0432 0754
Norway (NO) 0157 0219 0115 0329 0694
Poland (PL) 1340 0920 0124 1351 0904
Portugal (PT) 0215 0200 0052 0318 0724
Romania (RO) 0222 0271 0056 0298 0740
Russian Federation (RU) 0350 0242 0069 0245 0802
Serbia (RS) 0120 0148 0045 0389 0713
Slovakia (SK) 0256 0184 0061 0431 0774
Slovenia (SI) 0111 0172 0035 0326 0725
Spain (ES) 0143 0143 0076 0285 0713
Sweden (SE) 0255 0346 0099 0663 0801
Ukraine (UA) 0204 0200 0031 0449 0714
United Kingdom (GB) 0211 0245 0033 0472 0719
UK Liquidation set 0156 0234 0031 0447 0621
United States (US) 0195 0378 0248 0722 0701
44
44
Average of column items 0245 0265 0073 0481 0740
Correlation with Z-Score AUC 0611 0681 0516 0574 1000
Legend WCTA = Working CapitalTotal Assets
RETA = Retained EarningsTotal Assets EBITTA = EBITTotal Assets
BVETD = Book Value of EquityTotal Liabilities SALTA = SalesTotal Assets
AUC = Area under the ROC curve Z-Score = Altman (1983) Z-Score in the test data
45
45
Table 7 Test data AUCs for different estimated country models Comparisons are with AUC of the LR model estimated for all data (benchmark)
Test data AUC for different models
Country Benchmark Model 1 Model 2 Model 3 Model 4 Model 5 Model 6 Model 7
Austria (AT) 0800 0782 0770- 0774 0829 0787 0707- 0764
Belgium (BE) 0772 0779 0780 0826 0776 0783 0781 0834
Bosnia (BA) 0862 0850 0832 0833 0838 0838 0820 0853
Bulgaria (BG) 0684 0785 0785 0785 0796 0794 0677 0707
China (CN) ST companies 0985 0984 0982 0980 0986 0986 0986 0989
Colombia (CO) 0726 0755 0754 0818+ 0789 0749 0774 0824+
Croatia (HR) 0844 0862 0858 0865 0853 0863 0847 0863
Czech Republic (CZ) 0811 0812 0812 0823 0830 0813 0818 0842
Denmark (DK) 0803 0806 0809 0833 0818 0804 0813 0843
Estonia (EE) 0823 0824 0839 0866 0874 0839 0847 0899
Finland (FI) 0867 0867 0870 0885 0868 0873 0879 0894
France (FR) 0739 0773 0799 0805 0826 0800 0810 0845
Germany (DE) 0673 0684 0685 0734 0704 0701 0690 0762
Hungary (HU) 0742 0736 0743 0788 0767 0765 0747 0820
Iceland (IS) 0664 0670 0671 0784+ 0683 0714 0708 0824+
Ireland (IE) 0679 0663 0666 0718 0661 0665 0680 0724
Italy (IT) 0806 0802 0810 0835 0839 0809 0816 0868
Latvia (LV) 0678 0690 0707 0745 0720 0711 0730 0771
Netherlands (NL) 0752 0752 0756 0768 0784 0760 0759 0807
Norway (NO) 0716 0741 0741 0803 0749 0744 0743 0814
Poland (PL) 0903 0891 0897 0915 0899 0896 0895 0913
Portugal (PT) 0741 0753 0757 0761 0780 0758 0765 0797
Romania (RO) 0758 0718 0773 0805 0757 0755 0753 0774
Russian Federation (RU) 0811 0808 0810 0854 0811 0811 0818 0862
Slovakia (SK) 0777 0773 0775 0782 0810 0761 0773 0807
46
46
Slovenia (SI) 0737 0703 0719 0704 0711 0739 0686 0698
Spain (ES) 0734 0755 0767 0768 0849 0766 0776 0858
Sweden (SE) 0813 0826 0829 0843 0831 0831 0892 0901
Ukraine (UA) 0708 0712 0712 0720 0742 0718 0718 0758
United Kingdom (GB) 0699 0708 0713 0718 0764 0714 0731 0785
United States (US) 0710 0689 0687 0686 0816+ 0689 0714 0816+
Average of AUC 0768 0773 0778 0801 0799 0782 0779 0823
Significance AUC better than benchmark 00001 = ++++ 0001 = +++ 001 = ++ 01 = +
AUC worse than benchmark 00001 = ---- 0001 = --- 001 = -- 01 = - Models
Benchmark = The LR model estimated for all data with Zrsquorsquo-model (1983) variables Model 1 = The MDA model estimated for country data
Model 2 = The LR model estimated for country data Model 3 = The LR model estimated for country data with year dummies
Model 4 = The LR model estimated for country data with size variables Model 5 = The LR model estimated for country data with age category dummies Model 6 = The LR model estimated for country data with industry dummies
Model 7 = The LR model estimated for country data with all variables
47
47
Appendices
Appendix 1 Medians of the Altman (1983) model (Z) variables by status and country
Non-failed Failed
Non-failed Failed
Non-failed Failed Non-failed Failed
Country WCTA
RETA
EBITTA
BVETD
Austria (AT) 0170 -0278 0260 -0145 0055 -0071 0465 -0022
Belgium (BE) 0136 -0087 0157 -0107 0052 -0025 0460 0029
Bosnia (BA) 0087 -0019 0148 -0101 0032 -0056 0580 0000
Bulgaria (BG) 0216 0102 0272 -0019 0075 -0019 0504 0068
China (CN) 0105 0037 0064 0032 0064 0048 0870 0590
China delisted data 0158 0069 0286 0347 0059 0091 0923 0840
China ST data 0106 -0192 0281 -0012 0052 -0087 0776 0308
Colombia (CO) 0244 0018 0282 0047 0104 0005 0940 0235
Croatia (HR) 0093 -0182 0130 -0205 0030 -0014 0274 0000
Czech Republic (CZ) 0196 -0208 0230 -0167 0050 -0019 0591 -0076
Denmark (DK) 0128 -0139 0306 -0050 0005 -0041 0758 0025
Estonia (EE) 0222 -0109 0455 0067 0050 -0063 1169 0136
Finland (FI) 0233 -0169 0359 -0247 0082 -0125 0744 -0163
France (FR) 0146 0006 0223 0010 0059 -0006 0501 0077
Germany (DE) 0307 0176 0150 0014 0069 0037 0335 0073
Greece (GR) 0127 -0044 0049 -0213 0039 -0010 0460 0111
Hungary (HU) 0135 -0040 0271 0047 0054 0002 0717 0130
Iceland (IS) 0051 -0195 0046 -0215 0051 0000 0196 -0141
Ireland (IE) 0198 0017 0383 0117 0029 -0010 0728 0168
Italy (IT) 0107 -0170 0077 -0087 0032 -0041 0178 -0029
Latvia (LV) 0102 -0015 0150 0030 0069 0027 0342 0088
48
48
Lithuania (LT) 0205 -0041 0273 0055 0054 0003 0686 0117
Netherlands (NL) 0204 0000 0303 0050 0065 -0012 0511 0079
Norway (NO) 0185 0028 0139 -0080 0068 -0047 0398 0069
Poland (PL) 0198 -1142 0258 -0662 0076 -0048 0850 -0501
Portugal (PT) 0164 -0051 0133 -0067 0028 -0024 0343 0025
Romania (RO) 0071 -0151 0158 -0113 0041 -0015 0250 -0048
Russian Federation (RU) 0088 -0262 0106 -0136 0043 -0026 0194 -0051
Serbia (RS) 0093 -0027 0129 -0019 0027 -0018 0389 0000
Slovakia (SK) 0137 -0119 0185 0001 0060 -0001 0496 0065
Slovenia (SI) 0109 -0002 0215 0043 0039 0004 0434 0108
Spain (ES) 0117 -0026 0139 -0004 0029 -0047 0336 0051
Sweden (SE) 0266 0011 0357 0011 0058 -0041 0749 0086
Ukraine (UA) 0053 -0151 0034 -0166 0003 -0028 0442 -0007
United Kingdom (GB) 0179 -0032 0294 0049 0031 -0002 0579 0107
UK Liquidation set 0179 0023 0294 0060 0031 0000 0579 0132
United States (US) 0164 -0031 0374 -0004 0003 -0245 0800 0078
Average of medianssect 0153 -0092 0213 -0050 0048 -0025 0555 0075
Legend WCTA = Working CapitalTotal Assets
RETA = Retained EarningsTotal Assets EBITTA = EBITTotal assets
BVETD = Book Value of EquityTotal Liabilities sect = Because the two datasets for non-failed UK firms are identical the non-failed medians are used only once in the calculation of the averages

10
organizes the public data from administrative sources and filters them into various standard formats to facilitate searching and company comparisons The ORBIS formats have been derived from the most common formats used for the presentation of business accounts in the world (Ribeiro et al 2010) It is clear that international comparability may be a problem when administrative firm-level data are internationally pooled For administrative data the definition of variables is usually less harmonized This is less of a problem in the ORBIS database because of the common international format of balance sheets For example although some discrepancies in profitloss statements may arise because of differences in fiscal systems across countries balance sheet variables largely adhere to international standards Therefore ORBIS provides us with a useful and extremely large database for our study For statistical sampling several requirements are set for the empirical data Firstly we require that the firm to be selected must be an unlisted industrial (non-financial) company Secondly its owners must have limited liability (whereby partnerships and sole proprietors are left out of the study) Thirdly we set a minimum requirement for the size of the firm Because financial ratios in very small firms are generally too unstable for a failure prediction model these firms are excluded (Balcaen and Ooghe 2006) We require that the Total Assets must have exceeded 100 thousand EUR at least once in the available time series for a firm Fourthly we include in our estimation sample firms from all European countries where the number of failed firms is more than 60 If the number of failed firms for a country is less than 60 the firms from this country are only included in the test sample For other European countries the failed firms are randomly classified into the estimation and test samples so that the number of sample firms are about equal in both samples In all our estimation data include firms from 29 European countries while the number of countries in the test data is 32 Fifthly all failed firms that fulfil the requirements above are included into our samples However if the number of non-failed firms in a country is very high a sample is randomly selected from that country Finally the time span of fiscal years potentially available for this study ranges from 2002 to 2010 Because the last financial statements for failed firms in the database are from a financial period within 2007 and 2010 earlier years are excluded for comparability also for non-failed firms But all qualifying observations for non-failed firms from years 2007 to 2010 are included in the data sets As for failed firms we restrict the analyses to the last financial statements available before failure The four independent variables of the Zrsquorsquo-Score Model were winzorized at 1 and 99 to minimize outliers Our data is not restricted to European countries only The results are estimated and tested also for three non-European countries (United States China and Colombia) to get a more global view of the performance of the Zrsquorsquo-Score Model Therefore a sample of firms from these countries is randomly selected as for the estimation and test data from ORBIS World including middle-size (total assets over 15 Million Euro) and larger firms from all over the world The main principles for selecting these data follow the description outlined above for European firms Table 2 shows the resulting number of non-failed and failed firms in the estimation data and test data by country In all the estimation sample includes data from 2602563 non-failed and 38215 failed firms from 29 European and 3 non-European countries The test sample is slightly larger because it includes data from 32 European and 3 non-European countries From the country of origin of the Zrsquorsquo-Score Model the US the estimation sample only includes 56 bankrupt firms For the US data we made an exception by allowing listed (and delisted) firms to be included as otherwise there would have been no observations for the US in the database From China there are three samples Special Treatment-firms (ST)6 are included in the estimation sample although there are only 32 such firms altogether7 Private and delisted (DL)
6 See Zhang Altman and Yen (2010) for the rationale for using special-treatment firms as a proxy for
bankruptcies These are firms put on probation by the stock exchange for poor operating performance andor negative equity 7This is done because the results about predictability were good also for such a small sample
11
Chinese firms are separately analysed only in the test data8 ST firms are listed firms suffering from serious financial difficulties Delisted firms are firms delisted from the stock enchange (Table 2 here) 52 Status of failed firms ORBIS has five classes for potentially active firms (active default of payment receivership dormant branch) and seven classes for inactive firms which do not carry out business activities anymore (bankruptcy dissolved dissolved (merger) dissolved (demerger) in liquidation branch no precision) From these classes only active is selected to represent non-distressed firms In selecting the failed firms we try to avoid ambiguity as much as possible by considering (with exceptions described below) a firm failed if its status in ORBIS is stated as bankruptcy However because of the small number of bankrupt firms in some countries we also consider receivership (active) firms failed although they are active These firms generally suffer from serious financial distress However liquidation (inactive) firms are not included in the sample of failed firms (with one exception) Firms in liquidation may depending on the country contain firms that have ceased activities due to reasons other than failure (mergers discontinuing the operations of a daughter company or of a foreign branch etc) Therefore for most countries we select only firms that are coded as being bankrupt or under receivership However there are a number of special countries where failed firms are coded under a different status heading These special countries or samples are the following Country Status categories Bulgaria In liquidation Bankruptcy Denmark Inactive (no precision) Greece Active (receivership) In liquidation Bankruptcy Ireland In liquidation Active (receivership) Norway In liquidation Slovenia In liquidation Spain Active (receivership) In liquidation Bankruptcy Ukraine In liquidation Bankruptcy United Kingdom liquidation Inactive (In liquidation) China ST Active (Special Treatment) China delisted Active (delisted) In case no such category for failed firms could be identified that country was excluded from the study (for example Switzerland) If there was only a very small number of failed observations the country was dropped from the study (Luxembourg Liechtenstein Montenegro typically small countries) It should also be noted that the status classes (including the bankruptcy category) are not completely homogenous within European countries due to different legislations although there are obvious similarities in insolvency acts (Philippe et al 2002) China is a special case including samples with three different criteria of failure (bankruptcy Special Treatment delisted) For the UK there are two different samples (liquidation receivership) 53 Statistical methods
8These firms are included only in the test data because the predictability of failure was exceptionally poor
12
In this study seven research hypotheses are drawn for statistical testing The statistical analysis will begin with calculating the original Zrsquorsquo-Score for the firms in the data Following the original model this Zrsquorsquo-Score will be calculated for all sample firms as follows Zrsquorsquo = 325 + 656X1 + 326X2 + 672X3 + 105X4 where X1 = Working capitalTotal assets X2 = Retained EarningsTotal assets X3 = Earnings before interest and taxesTotal assets X4 = Book value of equityBook value of total liabilities
The classification performance of the original model is assessed by the AUC (Area Under Curve) measure extracted from the ROC (Receiver Operating Characteristic) curve ROC curve is a plot of true positive rate against false positive rate for all different possible cut-off-points These profiles show the trade-offs between Type I and Type II errors and represent statistically the cumulative probability distribution of failed events AUC measures the accuracy of the estimated model in relation to the perfect model With a perfect model AUC is 1 and with a random model 05 AUC has a close connection with the Accuracy Ratio (AR) since AR = 2 AUC ndash 1 AR equals 0 for a random model and 05 for a model with an average classification performance In all statistical analyses SAS software is used
The first hypothesis (H1) assumes that the coefficients of the original model are obsolete H1 is tested by re-estimating the coefficients of the Zrsquorsquo-Score Model using the original statistical method (the multiple discriminant analysis or MDA) In MDA the discriminant function is determined by a parametric method (a measure of generalized squared distance) and the distribution of independent variables within both groups is assumed to be multivariate normal The purpose is to estimate the new coefficients for the model to statistically represent the overall sample The problem is that the estimation sample includes different numbers of failed and non-failed firms from 31 countries In the original sample of Altman (1983) an equal number of bankrupt and non-bankrupt firms were selected from one country (US) Following the characteristics of these data we weight the firms so that the weights for the failed and non-failed firms are equal In this way the non-proportional sampling in different countries does not affect the re-estimated model The number of firms from different countries however varies significantly which leads to greater weights for larger countries To avoid this problem the observations are also weighted so that each country has an equal weight in the analysis Then the coefficients of the Zrsquorsquo-Score Model are re-estimated using these weighted data and the resulting AUC is compared with the one based on the original model The second hypothesis (H2) expects that the classification performance of the re-estimated Zrsquorsquo-Score Model improves when it is re-estimated by the logistic regression analysis (LR) that is based on less restrictive statistical assumptions than MDA In this estimation the dependent variable Y = 0 when the firm is non-failed and Y = 1 when it is failed LRA does not require that independent variables are multivariate normal or that groups have equal covariance matrices which are basic assumptions in MDA (Hosmer and Lemeshow 1989) LRA creates a score (logit) L for every firm It is assumed that the independent variables are linearly related to L This score or logit is used to determine the conditional probability of failure as follows
13
)|1( XYp = )( 441101
1
1
1XbXbbL ee
where bi (i =0hellip 4) are the coefficients and Xi (i =1hellip 4) are the four independent variables of the original Zrsquorsquo-Model The effect of the method on classification performance is assessed by testing the statistical significance of the difference between AUCs for this LR model and for the re-estimated MDA model The resulting model is here called the Zrsquorsquo-Score LR-Model and it is used as a benchmark for further statistical AUC comparisons because LR is applied as the principal method in testing of the rest of the research hypotheses
The third hypothesis (H3) is associated with the performance effect of taking account of the bankruptcy year in estimation This hypothesis is tested estimating a LR model based on the following logit
3
1
4
10
jjji
ii DcXbbL
where b0 is a constant Xi (i =1hellip 4) are the four independent variables of the original Zrsquorsquo-Model bi (i =1hellip 4) are their coefficients cj (j =1hellip 3) are coefficients of the dummy variables and
D1 = 1 when year = 2008 0 otherwise
D2 = 1 when year = 2009 0 otherwise
D3 = 1 when year = 2010 0 otherwise
The dummy variables do not directly refer to the bankruptcy year that is not given in the data base but to the last available year For failed firms there is about 1mdash2 years lead time to failure from this year In this model year 2007 is the base category If AUC of this extended LR model statistically significantly exceeds AUC of the Zrsquorsquo-Score LR-Model (benchmark) evidence supports hypothesis H3 The research hypotheses H4-H7 are statistically tested using the same approach as for the third hypothesis above However for each hypothesis appropriate variables are used instead of the year dummies Hypothesis H4 deals with the performance effect of taking account of size and it will be tested using in the LR model two additional variables of size In this LR model size is measured by natural logarithm of total assets and its squared form In this way the effect of logarithmic size can be reflected by a function following the second-order parabola Hypothesis H5 predicts that taking explicitly account of the age of the firm improves classification performance When testing this hypothesis the category 6-12 years is used as the base category and two dummy variables are incorporated in the LR model (D1 0-6 years D2 12- years) Hypothesis H6 is associated with the effect of the explicit consideration of industry on the classification performance It is tested here using dummy variables for seven industries (D1 restaurants and hotels D2 construction D3 whole sale and retailing D4 agriculture D5 manufacturing D6 energy and water production D7 information technology) all other industries acting as the base category Hypothesis H7 predicts that the explicit consideration of the country of origin improves classification performance This hypothesis is tested not using dummy variables for countries but using country risk measures instead The country risk of each country is measured by Standard amp Poorrsquos Country
14
Risk Rating per six months after annual closing of accounts The rating is numerically recoded in the way that the best rating AAA = 1 the second best rating AA+ = 2 and et cetera Finally the lowest rating D = 22 Thus H7 is tested estimating a LR model based on the four financial ratios of the original Zrsquorsquo-Score Model and a 22-step variable referring to country risk The five LR models with the orginal four financial ratios and the additional variables specified in the hypotheses are estimated for all data In addition a LR model including all additional variables is estimated for all data to assess the simultaneous effect of all variables Finally six of the seven hypotheses are tested for the data of each country separately In this country level testing hypothesis H7 is not tested because the additional variable (country risk) is constant within the country
6 Empirical results
61 All data coefficients of the Zrsquorsquo-Score Models
Table 3 presents descriptive statistics of the four independent variables (X1-X4) of the Zrsquorsquo-Score Model for all test data The variation in the ratios is significant as is shown by the standard deviation and the quartiles For X1 (WCTA) X2 (RETA) and X3 (EBITTA) the median and the mean for non-failed firms are close to each other referring to a symmetry of distributions However this is not the case for the failed firms For the faileddistressed firms the median exceeds the mean for these three ratios referring to negatively skewed distributions For X4 (BVETL) the means significantly exceed the median for both failed and non-failed firms indicating a positively skewed distribution For each of the four variables both the mean and the median are higher for non-failed firms than for failed firms which is consistent with the expectations The difference between the means of non-failed and failed firms is larger in the original US data than in our all data for RETA and EBITTA but about the same size for WCTA and BVETL (Altman 1983 123) These characteristics of the data may indicate lower classification accuracy than in the original sample (Table 3 here) Table 4 presents the coefficients of the different models estimated for all data All LRA estimates (Model 2 to Model 9) are statistically significant at 0001 due to their contributions and the large sample size The first column presents the coefficients of the original Zrsquorsquo-Score model Column ldquoModel 1rdquo shows the coefficients when they are re-estimated by the same statistical method or MDA The coefficients are here negative since the models are estimated using Y = 1 for the failed firms In our all data EBITTA has a significantly higher weight than in the original US data while the weights of WCTA and BVETL have proportionally decreased The re-estimated coeffient of BVETD is very small referring to a minor effect on the logit Column ldquoModel 2rdquo presents the coefficients for the Zrsquorsquo-Score LR-Model These coefficients are directly comparable with those of the MDA model which is expected for the sake of the exceptionally large sample The differences in the coefficients of the original four variables between the eight LR models (Models 1-8) are small For each model the coefficient of BVETD is very close to zero This indicates that the original four variables and the additional variables are quite independent of each other (Table 4 here) Table 4 also shows the coefficients of the additional variables beyond the original four in the LR models The negative coefficients of the dummy (year) variables of Model 3 indicate that after 2007 (the base category) this risk of failure has significantly decreased year by year The base year of 2007
15
refers to a failure emerged during 2008-2009 This phenomenon is caused by the global financial crisis The crisis played a significant role in the failure of key businesses and a downturn in economic activity leading to the 2008ndash2012 recession especially in Europe The coefficients of Model 4 for the size variables show that the contribution of size on the logit (risk measure) is at its maximum value when logarithmic total assets is 15 or when total assets is about 33 million Euro Model 5 confirms the riskiness of young firms since the risk to fail is very high for newly founded firms (less than 6 years old) as is shown by the coefficient of the first dummy variable The coefficients of the industry dummies in Model 6 show that construction is an exceptionally risky industry followed by manufacturing For Model 7 the coefficient of the country risk dummy is statistically significant (for the sake of the large sample) but negative and very close to zero Finally the coefficients of all variables in Model 8 are directly comparable with those in Models 3-7 62 All data performance of the Zrsquorsquo-Score Models Table 5 shows the resulted AUCs in the test data for the different ldquoall datardquo models by country Model 1 refers to the original Zrsquorsquo-Score Model The classification performance of the score at the level of all countries is fair since AUC = 0743 refers to AR = 0486 that is about average accuracy (05) However the score gives relatively good results (AUC gt 08) for China (ST firms) Poland Finland Estonia Czech Republic Croatia Bosnia Russia and Sweden Its performance is quite low (AUC lt 07) for Norway Latvia Iceland Ireland and Germany The lower part of the table shows the resulting AUCs for the countries only included in the test data The performance of the score is very low for Chinese private and delisted firms It is also low for the liquidation firms in the United Kingdom Appendix 1 shows the medians of the four ratios (X1 to X4) by status and country Table 6 presents the differences of these medians between the non-failed and failed firms by country In this table also the AUC of the Zrsquorsquo-Score and its correlation to the difference of medians are presented This correlation is high for each financial ratio showing that the effects of the ratios on AUC are well balanced For Chinarsquos ST firms the differences are not exceptionally large except for EBITTA This implies with the exceptionally high AUC that the ST firms systematically differ from the non-ST firms although the differences are not extremely large The differences between the medians are very large in Poland for each ratio justifying high AUC They are also large in Finland and also in Czech Republic where the difference in EBITTA is however average In Germany Latvia China (private and delisted) and UK (liquidation) the differences in all four ratios are below the average which is obviously associated with low AUC In the Chinese delisted firms the differences in RETA and EBITTA are even negative In Iceland and Ireland the differences only in EBITTA are exceptionally small (Table 5 here) (Table 6 here) Model 2 in Table 5 is the re-estimated Zrsquorsquo-Score Model where the coefficients are estimated by MDA for all data Its AUC (0745) is only slightly higher than for the original model (0743) supporting only very weakly if at all H1 (obsolescence of the coefficients) The classification accuracy AR (0490) is about the average level However the re-estimation of the coefficients has led to improved classification accuracy in a number of countries especially in Bosnia China (ST) Norway and Greece However it has impaired classification accuracy in UK and China (delisted) Column ldquoBenchmarkrdquo reports the results for the benchmark model (Zrsquorsquo-Score LR-model) showing the effect of the estimation method For the benchmark model AUC in all data is 0748 that is higher than for Model 1 and 2 The differences between AUCs are very small supporting only weakly H2 (estimation
16
method) The LR-model (benchmark) and the MDA model (Model 2) give almost identical AUCs for each country This result was expected since the coefficients of the models are directly comparable The similar results for the models may also indicate that the independent variables conform to multinormality This last result confirms what most researchers in the field of default classification models have concluded that accuracy levels are extremely similar despite any statistical violations like normality between MDA and logistical regression models Model 3 (LR-model with year dummies) leads in all test data to higher AUC (0752) than the benchmark model supporting H3 (bankruptcy year effect) However the AUC effects are not positive for all countries The effects are positive for example for Russia Estonia Germany Ireland and Latvia but these effects are not statistically significant There are statistically significant negative effects for China (ST) and Serbia There are notable negative effects especially for Bosnia Croatia Hungary Norway and Slovenia These diverse results are due to exceptional annual distributions of failed firms in these countries For the countries with negative effects the percent of failed firms from 2010 (D3 = 1) exceeds 50 while for the countries with positive effects it is only a couple of percent For each group non-failed firms are quite equally distributed over years When the coefficient of D3 is very low (-0666) it strongly decreases the risk estimates of most failed firms in the former countries but only in few failed firms in the latter countries This leads to the observed effects Model 4 (LR-model with size variables) performs better than the benchmark model which gives support to H4 (size effect) It leads to AUC = 0760 referring to AR = 0520 However it leads to significant improvements in AUC for example in China (delisted) and Austria For China (delisted) the increase in AUC is extremely strong There are also improvements in AUC for instance for Estonia Italia Slovakia Spain and UK Model 4 has also led to lower AUCs in few countries but the decrease is not significant Model 4 is based on the four original variables and the size effect following a second-order parabola This kind of size effect is very small for micro firms but increases approaching its maximum value in middle-sized firms The countries with a positive change in AUC have typically data where the percent of failed micro firms (in all failed firms) is relatively low (40-60) while there are a lot of middle-sized failed firms Because the size effect is strongest for middle-sized firms AUC will increase On contrary the countries with a negative change in AUC have data where the percent of failed micro firms is exceptionally high (70-80) Model 5 (LR-model with age category dummies) gives for all test data about the same AUC as the benchmark model (AUC = 0748) Thus empirical evidence does not support H5 (size effect) For each country the effect of the age on AUC is small For Austria the effect is however positive and notable For this country the percent of non-failed young firms (0-6 years) is only about 10 (of non-failed firms) whereas this percent for failed firms is more than 20 (of failed firms) Because Model 5 includes a strong positive age risk effect for young firms (D2) it increases the risk of many failed firms but that of only few nonfailed firms This obviously leads to an improvement in AUC Model 6 (LR-model with industry dummies) outperforms the benchmark model in AUC supporting H6 (industry effect) It gives AUC = 0751 leading to AR = 0502 However its AUC is notably higher than the benchmark AUC only in a couple of countries for example in France Latvia Portugal and Spain Model 6 makes a negative effect on failure risk for example in restaurants and hotels and information technology industries but a positive effect in construction and manufacturing industries For the countries with a positive effect on AUC the percent of nonfailed firms in restaurants and hotels and information technology is high while that of failed firms is low For the risky industries (construction and manufacturing) these distributions are reversed Thus Model 6 gives a positive (negative) risk effect for many failed (nonfailed) firms and a negative (positive) risk effect only for few
17
failed (nonfailed) firms Therefore AUC will be increased This situation is reversed for the countries with a negative effect on AUC (Austria and Slovenia) The samples of these countries include a high percent of nonfailed firms in the manufacturing industry leading to a decrease in AUC Model 7 (LR-model with country risk measure) leads to a marginally higher classification performance (AUC = 0749) than the benchmark model This result gives only very weak support for H7 (country of origin effect) However for each country the resulted AUC is almost identical with that given by the benchmark model This result was expected due to the neglible coefficient (-0003) of the country risk measure (SP Country rating rank) in Model 7 This result implies that country risk does not make any effect on the boundary between bankrupt and non-bankrupt firms Model 8 (LR-model with all variables) includes the four financial ratios and all additional variables It leads in all test data to a sizeable increase in AUC (AUC = 0771) in comparison to the benchmark AUC However the effect on AUCs largely varies and is either negative or positive in different countries The effect is large in several countries for example in Estonia France Iceland Italy Latvia and China (delisted) However it also makes a negative effect on AUC in several countries such as Bosnia Hungary and Norway These results show that the inclusion of additional variables into the original model will usually increase AUC but not in every country The ldquoall datardquo benchmark performs fairly well also for the US and the Colombian samples (the US firms being unlike the other firms in this study listed or delisted companies) The poor performance of Chinese private and delisted firms is associated with very small differences between the medians of the non-failed and failed groups as is shown in Table 6 It is clear that the status ldquodelistedrdquo is not comparable with ldquobankruptcyrdquo When the status is defined as ldquoSTrdquo the predictability of Chinese listed firms is very high Prior studies based on Chinese ST-firms have also demonstrated good predictability (Zhang et al 2010 Wang and Campbell 2010) see footnote 6 earlier Nevertheless this puzzle calls for additional research and modeling work regarding unlisted and delisted Chinese firms 63 Country-level data performance of the Zrsquorsquo-Score Models The heterogeneity of the firms and their distributions in ldquoall datardquo makes it difficult for a uniform all data model to increase AUCs in different countries Table 7 presents the test data AUCs for the different models estimated for each country separately (country-level models) In this table the ldquoall datardquo Zrsquorsquo-Score LR-model acts as the benchmark When the models are estimated from the country data this benchmark will be clearly outperformed by the resulting MDA (Model 1) and LR models (Model 2) only in a couple of countries (Bulgaria France Latvia Spain and Sweden) These results give however only weak support for H1 (obsolescence of the coefficients) at the country level because the effects are not significant In addition the benchmark leads to higher AUCs than Models 1 and 2 at least in Austria Bosnia Ireland Slovenia and United States The differences in AUCs given by Models 1 and 2 are generally small In Romania only Model 1 is clearly outperformed by Model 2 Thus country-level evidence does not support H2 (estimation method) Model 3 (LR-model with year dummies) leads in most countries to clearly higher AUC than the benchmark model This evidence gives support to H3 (bankruptcy year effect) Model 3 leads to lower AUC than the benchmark model in Austria Bosnia Slovenia and United States Model 4 (LR-model
18
with size variables) leads to improved performance almost in every country supporting H4 This improvement is significant however only in the United States where AUC is now 0816 when it is only 0710 for the benchmark model It is notable also in Bulgaria France Latvia Spain and United Kingdom Model 5 (LR-model with age category dummies) gives in several countries higher AUCs than the benchmark model but none of the improvements are significant The positive effect is strong especially in Bulgaria France and Iceland Although there are also negative effects on AUC this evidence weakly supports H5 (age effect) since these negative effects are relatively small Model 6 (LR-model with industry dummies) shows both negative and positive effects on AUCs when compared with the benchmark The only significant effect however is the negative effect found in Austria In Bulgaria and Slovenia AUC has also notably decreased due to the industry dummies However there are notable positive effects on AUC for example in France Iceland Latvia and Sweden Thus the effect is not systematic and gives only weak support to H6 (industry effect) Model 7 (LR-model with all variables) leads to a remarkable increase in AUC as compared with the benchmark model in Colombia Iceland and Unites States It also leads to notable improvements in AUC at least in Belgium Denmark Estonia France Germany Hungary Latvia Norway Spain and United Kingdom There are found negative effects on AUC only in Austria and Slovenia Thus as a conclusion we can state that the classification performance of ldquoall testrdquo data Zrsquorsquo-Score Model can in general remarkably increase in most countries when different effects are taken into account by additional variables This increase is found in most European countries and also in Colombia and United States In China the AUC for the ST sample is extremely high for the Zrsquorsquo-Score LR-model and it can only slightly be improved by additional variables (Table 7 here)
7 Summary of the study and a Suggested Extension
The purpose of this study was to assess the classification performance of the Zrsquorsquo-Score Model originally introduced by Altman (1983) This model was originally applied for small and middle-sized US manufacturing bankrupt and non-bankrupt firms but is applied widely all over the world in different industries and for different size categories for different purposes It is a modified version of the Z-Score Model (1968) developed for listed manufacturing firms The Zrsquorsquo-Score Model is modified to apply for private and non-manufacturing firms as well as manufacturers The literature review section summarizes recent articles in prominent academic journals that have utilized Altmanrsquos Z-Score or Zrsquorsquo-Score models or re-estimated versions of them in empirical analyses These models are typically used as benchmarks in failure prediction modeling studies where one or several alternative methods or approaches (hazard models contingent-claims intelligent algorithms etc) have been tested However in a considerable number of the reviewed studies failure prediction is not the primary focus Instead these models have been largely used as measures of financial strength As to the failure prediction studies the results have been somewhat uneven so that in some studies the models have performed well whereas in others they have been outperformed by competing models None of the reviewed studies were based on comprehensive international comparisons which makes the results difficult to generalize
19
In this study the classification performance of the Zrsquorsquo-Score model is assessed using very large data sets in an international context The purpose is to test how the original version of the Zrsquorsquo-Score Model performs in different countries and how re-estimation using another statistical method and different additional variables affect the classification performance when the data are very heterogeneous For this kind of testing in an international context seven research hypotheses on classification performance are extracted These research hypotheses are tested for all data and also separately for country data (country-level analysis) The hypotheses are associated with the following effects on the classification performance of the Zrsquorsquo-Score Model 1) re-estimation of coefficients 2) estimation method 3) year 4) size 5) age 6) industry and 7) country The estimation data are from 29 countries and the results are validated for 32 countries The countries are mainly from Europe but also three non-European countries are included (China Colombia and United States) The status used in the classification is mainly bankruptcyactive firms but also receivership firms are considered failed In Chinese data also ST (special treatment) and delisted firms are separately analysed as failed firms The analyses at the level of all data show that the original Zrsquorsquo-Score model performs very satisfactorily in an international context The effects of the four financial ratios on performance are well balanced although Book Value of Equity Total Liabilities (BVETD) showed a very small contribution in re-estimation The original model performs very well in several countries such as Poland Finland and China (ST firms) The re-estimation of the coefficients using MDA only marginally improved classification performance supporting weakly the obsolescence hypothesis (H1) or to put it differently shows that the original coefficients are extremely robust across countries and over time This same conclusion holds for the re-estimation of the model using LRA since the performance results are very similar as for MDA (H2) The use of additional variables in the model generally improved classification accuracy of the original model but the results for countries are dependent on the distribution of failed and nonfailed firms When the coefficients are estimated for all data the effects on performance in a country depend on how the distributions in that country correspond to the distributions in all data For all sets of additional variables performance is generally improved but the improvement is not strong and the effects vary country by country Thus evidence gives weak support to effects of all additional variables For the effects of bankruptcy year (H3) and size (H4) the effects are stronger but also the variations in the effects between countries are stronger The effects of age (H5) industry (H6) and country (H7) are marginal When all additional variables are included in the same model performance generally significantly increases but at the same time variations between countries become stronger In summary our evidence thus indicates that the original Zrsquorsquo-Score Model performs well in an international context It is however possible to extract a more efficient country model for most European countries and also for non-European countries using the four original variables accompanied with a set of additional background variables Considering practical applications it is obvious that while a general international model works reasonably well for most countries the classification accuracy may be somewhat improved with country-specific estimation In a country model the information provided even by simple additional variables may help boost the classification accuracy to a much higher level In finance and accounting research failure prediction models may be utilized as risk measures in many different contexts as was revealed by the literature review section Where failure prediction modeling is not the primary focus it would be time-consuming uneconomical and superfluous to first estimate a failure prediction model (or models) and only then proceed to study the phenomenon of interest In these kinds of instances a well tested general model that works reliably
20
and consistently across different countries is highly desirable Based on our empirical tests in this study the original Zrsquorsquo-Score Model and its re-estimated version containing the four Altman (1983) study variables with coefficients re-estimated using a large European data set work consistently well internationally and are easy to implement and interpret An extension to our work could include a comprehensive and more complete analysis of the Altman-Rijken (2011) thesis that a countryrsquos risk of default on its sovereign debt can be assessed by an analysis of the default probabilities of its private sector Our database permits extension of default estimates to non-publicly held firms by far the dominant population in most countries of the world and our analysis can include small and medium size firms as well as larger corporate entities
21
References
Acosta-Gonzaacutelez E Fernaacutendez-Rodriacuteguez F (2014) Forecasting financial failure of firms via genetic algorithms Computational Economics vol 43 p 133ndash157
Agarwal V Taffler R (2008) Comparing the performance of market-based and accounting-based bankruptcy prediction models Journal of Banking and Finance vol 32 p 1541ndash1551
Aktas N de Bodt E Lobez F Statnik J-C (2012) The information content of trade credit Journal of Banking and Finance vol 36 p 1402ndash1413
Allayannis G Brown GW Klapper LF (2003) Capital structure and financial risk Evidence from foreign debt use in East Asia The Journal of Finance vol 58 no 6 p 2667ndash2709
Altman EI (1968) Financial ratios discriminant analysis and the prediction of corporate bankruptcy The Journal of Finance vol 23 no 4 p 589ndash609
Altman EI (1983) Corporate Financial Distress A Complete Guide to Predicting Avoiding and
Dealing with Bankruptcy (Wiley Interscience John Wiley and Sons) also see E Altman amp E Hotchkiss
Corporate Financial Distress amp Bankruptcy 3rd edition John Wiley 2006
Altman EI Saunders A (1998) Credit risk measurement Developments over the last 20 years Journal of Banking and Finance vol 21 p 1721ndash1742
Altman EI Rijken H (2011) Toward a Bottom-Up Approach for Assessing Sovereign Default Risk Journal of Applied Corporate Finance vol 23 no 1 pp 20-31
Balcaen S Ooghe H (2006) 35 years of studies on business failure an overview of the classic statistical methodologies and their related problems The British Accounting Review vol 38 p 63ndash93
Bauer J Agarwal V (2014) Are hazard models superior to traditional bankruptcy prediction approaches A comprehensive test Journal of Banking and Finance vol 40 p 432ndash442
Beaver WH (1966) Financial ratios as predictors of failure Journal of Accounting Research vol 4 p 71ndash111
Beaver WH (1968) Alternative accounting measures as predictors of failure The Accounting Review vol 43 no 1 p 113ndash122
Begley J Ming J Watts S (1996) Bankruptcy classification errors in the 1980s An empirical analysis of Altmanrsquos and Ohlsonrsquos models Review of Accounting Studies vol 1 p 267ndash284
Bharath ST Shumway T (2008) Forecasting default with the Merton distance to default model Review of Financial Studies 21(3) 1339-1369
Butler AW Wan H (2010) Stock market liquidity and the long-run stock performance of debt issuers The Review of Financial Studies vol 23 no 11 p 3966ndash3995
Campbell J Hilscher J Szilagyi J 2008 In search of distress risk Journal of Finance 63 2899ndash2939 Carling K Jacobson T Lindeacute J Roszbach K (2007) Corporate credit risk modeling and the macroeconomy Journal of Banking and Finance vol 31 p 845ndash868
Chava S Jarrow RA (2004) Bankruptcy prediction with industry effects Review of Finance vol 8 p 537ndash569
Chen H Kacperczyk M Ortiz-Molina H (2012) Do nonfinancial stakeholders affect the pricing of risky debt Evidence from unionized workers Review of Finance vol 16 p 347ndash383
22
Clarke J Ferris SP Jayaraman N Lee J (2006) Are analyst recommendations biased Evidence from corporate bankruptcies Journal of Financial and Quantitative Analysis vol 41 no 1 p169ndash196
Clayton MJ Ravid SA (2002) The effect of leverage on bidding behavior Theory and evidence from the FCC auctions The Review of Financial Studies vol 15 no3 p 723ndash750
Das S Hanouna P Sarin A (2009) Accounting-Based versus Market-Based cross-sectional models for CDS spreads Journal of Banking amp Finance vol 33 pp 719-730
Dawkins MC Bhattacharya N Smith Bamber L (2007) Systematic share price fluctuations after bankruptcy filings and the investors who drive them Journal of Financial and Quantitative Analysis vol 42 no 2 p399ndash419
DeLong ER DeLong DM Clarke-Pearson DL (1988) Comparing the areas under two or more correlated receiver operating characteristic curves A nonparametric approach Biometrics 44(3) 837-845
Dichev I (1998) Is the Risk of Bankruptcy a Systematic Risk Journal of Finance vol 53 p 1131-1147
Dimitras AI Zanakis SH Zopounidis C (1996) Theory and methodology A survey of business failures with an emphasis on prediction methods and industrial applications European Journal of Operational Research vol 90 p 487ndash513
Eisdorfer A (2008) Empirical evidence of risk shifting in financially distressed firms The Journal of Finance vol 63 no 2 p 609ndash637
Fich EM Slezak SL (2008) Can corporate governance save distressed firms from bankruptcy An empirical analysis Review of Quantitative Finance and Accounting vol 30 p 225ndash251
Franzen LA Rodgers KJ Simin TT (2007) Measuring distress risk The effect of RandD intensity The Journal of Finance vol 62 no 6 p 2931ndash2967
Grice JS Dugan MT (2001) The limitations of bankruptcy prediction models Some cautions for the researcher Review of Quantitative Finance and Accounting vol 17 p 151ndash166
Grice JS Jr Dugan MT (2003) Re-estimations of the Zmijewski and Ohlson bankruptcy prediction models Advances in Accounting vol 20 p 77ndash93
Grice JS Ingram RW (2001) Tests of the generalizability of Altmanrsquos bankruptcy prediction model Journal of Business Research vol 54 p 53ndash61
Griffin JM Lemmon ML (2002) Book-to-market equity distress risk and stock returns The Journal of Finance vol 57 no 5 p 2317ndash2336
Hillegeist SA Keating EK Cram DP Lundstedt KG (2004) Assessing the probability of bankruptcy Review of Accounting Studies vol 9 p 5ndash34
Hirsch B T and Macpherson D A (2003) Union membership and coverage database from the Current Population Survey Note Industrial and Labor Relations Review 56 349ndash354
Ho C-Y McCarthy P Yang Y Ye X (2013) Bankruptcy in the pulp and paper industry marketrsquos reaction and prediction Empirical Economics vol 45 p 1205ndash1232
Holder-Webb LM Wilkins MS (2000) The incremental information content of SAS No 59 Going-concern opinions Journal of Accounting Research vol 38 no 1 p 209ndash219
Hosmer D Lemeshow S (1989) Applied Logistic Regression (Wiley Interscience Prentice Hall International)
Jackson RHG Wood A (2013) The performance of insolvency prediction and credit risk models in the UK A comparative study The British Accounting Review vol 45 p 183ndash202
23
Karels G Prakash AJ (1987) Multivariate normality and forecasting of business bankruptcy Journal of Business Finance and Accounting 14(4) 573-593
Kieschnick R La Plante M Moussawi R (2013) Working capital management and shareholdersrsquo wealth Review of Finance vol 17 p 1827ndash1852
Kumar PR Ravi V (2007) Bankruptcy prediction in banks and firms via statistical and intelligent techniques ndash A review European Journal of Operational Research vol 180 p 1ndash28
Kwak W Shi Y Cheh JJ Lee H (2005) Multiple criteria linear programming data mining approach An application for bankruptcy prediction Data Mining and Knowledge Management Lecture Notes in Computer Science vol 3327 p 164ndash173
Li M-YL Miu P (2010) A hybrid bankruptcy prediction model with dynamic loadings on accounting-ratio-based and market-based information A binary quantile regression approach Journal of Empirical Finance vol 17 p 818ndash833
Lyandres E Zhdanov A (2013) Investment opportunities and bankruptcy prediction Journal of Financial Markets vol 16 p 439ndash476
Merkevicius E Garšva G Girdzijauskas S (2006) A hybrid SOM-Altman model for bankruptcy prediction International Conference on Computational Science Lecture Notes in Computer Science vol 3994 p 364ndash371
Ohlson J (1980) Financial ratios and probabilistic prediction of bankruptcy Journal of Accounting Research vol 18 p 109-131
Ooghe H Balcaen S (2007) Are failure prediction models widely usable An empirical study using a Belgian dataset Multinational Finance Journal 11(12) 33-76
Philippe and Partners and Deloitte and Touche Corporate Finance (2002) Bankruptcy and a Fresh Start Stigma on Failure and Legal Consequences of Bankruptcy (International Insolvency Institute Brussels Belgium)
Philosophov LV Batten JA Philosophov VL (2008) Predicting the event and time horizon of bankruptcy using financial ratios and the maturity schedule of long-term debt Mathematics and Financial Economics vol 1 p 181ndash212
Pindado J Rodrigues L de la Torre C (2008) Estimating financial distress likelihood Journal of Business Research vol 61 p 995ndash1003
Piotroski JD (2000) Value investing The use of historical financial statement information to separate winners from losers Journal of Accounting Research vol 38 Supplement Studies on accounting information and the economics of the firm p 1ndash41
Reisz AS Perlich C (2007) A market-based framework for bankruptcy prediction Journal of Financial Stability vol 3 p 85ndash131
Shen C-H Chen Y-K Huang B-Y (2010) The prediction of default with outliers Robust logistic regression Handbook of Quantitative Finance and Risk Management p 965ndash977
Shumway T (2001) Forecasting bankruptcy more accurately A simple hazard model Journal of Business vol 74 p 101-124 Singhal R Zhu Y (2013) Bankruptcy risk costs and corporate diversification Journal of Banking and Finance vol 37 p 1475ndash1489
Smith M Liou D-K (2007) Industrial sector and financial distress Managerial Auditing Journal vol 22 Issue 4 p 376 - 391
24
Sun L (2007) A re-evaluation of auditorsrsquo opinions versus statistical models in bankruptcy prediction Review of Quantitative Finance and Accounting vol 28 p 55ndash78
Taffler RJ (1984) Empirical models for the monitoring of UK corporations Journal of Banking and Finance vol 8 Issue 2 p 199-227
Uhde A Heimeshoff U (2009) Consolidation in banking and financial stability in Europe Empirical evidence Journal of Banking and Finance vol 33 p 1299ndash1311 Vassalou M Xing Y (2004) Default Risk in Equity Returns Journal of Finance vol 59 p 831-868
Wang Y and Campbell M (2010) Business failure prediction for publicly listed companies in China Journal of Business and Management 16(1) 75-88
Wu Y Gaunt C Gray S (2010) A comparison of alternative bankruptcy prediction models Journal of Contemporary Accounting and Economics vol 6 p 34ndash45
Xu M Zhang C (2009) Bankruptcy prediction the case of Japanese listed companies Review of Accounting Studies vol 14 p 534ndash558
Zhang L Altman EI and Yen J (2010) Corporate financial distress diagnosis model and application in credit rating for listing firms in China Frontiers of Computer Science in China 4(2) 220-236
Zmijewski ME (1984) Methodological Issues Related to the Estimation of Financial Distress Prediction Models Journal of Accounting Research vol 22 Studies on Current Econometric Issues in Accounting Research p 59-82
25
Tables Table 1 Summary of the literature review of Z-Score Models from year 2000
Authors and year of publication
Period and population or sample Goal methodology and z-score application
Main conclusions
Holder-Webb LM Wilkins MS (2000)
217 firms filing for bankruptcy identified by NAARS or Wall Street Journal between 1975-1996
(M) Evaluation of the impact of implementation of auditing standard on going concern on information value for investors (bankruptcy surprise and audit opinion were assessed by investorsrsquo reactions to bankruptcy news in the event window) Authors implemented BKPRO variable based on z-score in the model as a ratio-based measure of financial distress
Bankruptcy surprise was greater in case of a clean going concern opinion The results hold after controlling for eg firmrsquos level of financial distress
Piotroski JD (2000) 14043 firms with high book-to-market (BM) values across 21 years (1976 -1996) in Compustat database
(M) The application of a simple accounting-based fundamental analysis strategy as a tool for broad portfolio management of high BM firms The author used z-score as financial distress measure in order to justify his own model
The author concluded that firms with lower level of financial distress earned significantly stronger future returns than the highly distressed firms Mean return for the investor involved in the high BM assets could be increased by selection of firms that are financially strong
Grice JS Ingram RW (2001)
972 companies for 1985ndash1987 in the estimation sample (148 distressed and 824 non-distressed) and 1002 companies for 1988ndash1991 in the prediction sample (148 distressed and 854 non-distressed) in Compustat database
(V) Verification of z-score model with 3 questions Is the model as useful as in the previous periods Is the model useful for predicting bankruptcy of non-manufacturing firms as it was for manufacturing firms Is the model useful for predicting financial stress other than bankruptcy
Prediction accuracy of the model declined over time and coefficients of the model significantly changed which means that the relation between financial ratios and financial distress has changed over time Model was sensitive to industry classification (better for manufacturing firms) and not sensitive to the type of financial distress Similar conclusions were drawn in case of Ohlsonrsquos (1980) and Zmijewskirsquos (1984)
26
model by Grice JS Dugan MT (2001)
Clayton MJ Ravid SA (2002)
Federal Communication Commission (FCC) spectrum auctions for 1994-1995 together with firm-specific and region-specific variables
(M) The authors examined the link between capital structure of firms and their bidding behaviour The authors used z-score as a proxy for financial strength and alternative measure of default risk
Empirical analysis showed that as the firmrsquos and the competitorrsquos debt level increase firms tend to submit lower bids which supported authors theoretical model
Griffin JM Lemmon ML (2002)
Sample similar to Fama and French (1992) Non-financial NYSE Nasdaq Amex stocks monthly returns for stocks with nonnegative book value of equity from July 1965 to June 1996
(R) The authors investigated relationship between book-to-market equity distress risk and stock returns They used Ohlsonrsquos o-score but additionally run robustness check with the use of z-score as measure of distress risk
In case of firms with the highest risk of distress the difference in return between high and low book-to-market equity securities was more than twice higher than in case of other groups
Allayannis G et al(2003)
SBC Warburg Dillon Read database with local foreign and synthetic local (hedged foreign) currency debt for 327 largest East Asian non-financial companies from 1996-1998
(M) The first research issue was to check determinants of firmrsquos choice of debt currency local foreign or synthetic local The second research issue was related to the relation of the type of debt and financial performance during the Asian crisis Asian financial crisis was treated as natural experiment They used modified z-score (2000) as one of the financial performance measures
The authors found no evidence that unhedged foreign debt was the cause of poor performance However the use of synthetic currency caused poor stock market performance because of the derivatives market illiquidity during the crisis
Hillegeist SA et al (2004)
Sample covered 78100 firm-year observations (representing 14303 individual industrial firms) for 1980-2000 period with 756 initial bankruptcies
(V) The authors confronted Altmanrsquos z-score and Ohlsonrsquos o-score (with original and up-dated coefficients) with the model based on BSM option pricing model (BSM-Prob) They used relative information content tests to compare the out-of-sample performance
BSM-Prob outperformed accounting based models Conclusions were robust to various modifications of both accounting based models BSM-Prob was not dependent on time horizon and difference in accounting standards in various countries Thus it allowed for international comparisons
Chava S Jarrow RA (2004)
US publicly listed companiesrsquo monthly and yearly data for 1962-1999 period with 1461 bankruptcies
(V) The authors employed extended bankruptcy database to prove the superiority of Shumwayrsquos model (2001) over Altmanrsquos (1968) and Zmijewskirsquos
In case of Shumwayrsquos model 744 (in the first decile) of the bankruptcies were correctly identified for Altmanrsquos model ndash it was 632 and for Zmijewskirsquos model - 432
27
(1984) models Three other goals were included into their research The authors re-estimated models over the 1962ndash1990 period and forecasted bankruptcies over 1991ndash1999
Market-based model outperformed also in case of ROC curve Market variables were better in predicting bankruptcy than accounting variables and the use of monthly data improved prediction
Kwak etal (2005) Data from 1992 to 1998 for bankrupt firms and 584 times more of control firms for the same period Standard and Poorrsquos database was used for US companies from major 3 stock exchanges
(V) Multiple Criteria Linear Programming (MCLP) was used to model 5 Altmanrsquos and 9 Ohlsonrsquos variables in order to apply it for bankruptcy prediction
In case of both models overall predication rate of Ohlsonrsquos model is similar to Altmanrsquos model (8676 vs 8856) with more control firms The MCLP approach performed better than Altmanrsquos model and give similar or better results than Ohlsonrsquos model
Merkevicius E et al (2006)
Data from two sources EDGAR PRO Online Database (ldquotraindatardquo with 1108 records) and database form Lithuanian bank (ldquotestdatardquo with 742 records) for year 2004
(V) The hybrid model was developed with the use of Altmanrsquos z-score model with the changed weights for variables and self-organizing map which was an unsupervised learning artificial neural network (called SOM-Altman model)
Hybrid SOM-Altmanrsquos model reached the prediction rate of 9235 It is easy to adopt for different data sets also from developed and developing countries
Clarke J et al (2006) The initial sample of 995 firms that filed for bankruptcy from 1995 to 2011 Analysts recommendations were taken from IBES database In the final sample the authors used 289 bankrupt firms and their non-bankrupt matches
(M) The research focus was to test if there is a bias in analystsrsquo recommendations for firms that filed for bankruptcy (chapter 11) Altmanrsquos z-score was calculated two years preceding the bankruptcy year
Analysts actively revised their recommendations downward in case of firms that faced bankruptcy The recommendation declined from ldquobuyrdquo about 2 years prior to bankruptcy The authors found no evidence of analystsrsquo bias and conflict of interest
Reisz AS Perlich C (2007)
The authors used 5784 industrial firms for 1988-2002 which gave 33238 non-bankrupt and 799 bankrupt firm-years
(V) The authors used barrier option model for bankruptcy prediction (DOC) and compared its discriminatory power with other market-based (BSM and KMV) and accounting-based models (Altmanrsquos z-score and zrdquo-score developed in 1993 for private firms)
The authors proved domination of Altmanrsquos z-score and zrdquo-score for short term bankruptcy prediction For medium- and long-term bankruptcy prediction DOC outperformed other models
28
Sun L (2007) US public traded firms on the major stock exchanges from 1991 to 2002 The final bankruptcy training sample consists in 344 firms (1657 firm-years) and the final non-bankruptcy training sample ndash 3183 (20918 firm-years) The test samples used respectively 243 and 1165 firms
(M) The main purpose of the research was to compare the performance of auditorsrsquo going concern opinions with the results of bankruptcy prediction models The author improved previous research by using a composite score of financial distress stock-market variables industry failure rate and applying hazard model Altmanrsquos z-score was one of the 4 criteria (besides auditorrsquos opinion Zmijewskirsquos probability and stock return) used as a ldquostressrdquo variable In the final model the author used Zmijewskirsquos probability as the best
The hazard model outperformed auditorrsquos going concern opinions so statistical models could be of any help for auditorsrsquo opinions Market variables had significant explanatory power for auditorrsquos opinion while industry failure rate did not have it Auditorsrsquo going concern opinions had incremental prediction ability beyond traditional financial ratios a composite measure of financial distress market variables and industry failure rate
Franzen LA et al (2007)
US firms listed on the major stock exchanges for the period 1981-2004 with sufficient data to compute accounting-based measures of financial distress RampD intensity and portfolio returns The number of firms filing for bankruptcy was 929
(M) The authors focused on the impact of RampD spending on financial distress prediction They used accounting based models with the special focus on Ohlsonrsquos o-score since it included only accounting based measures Altmanrsquos z-score was used for supporting purposes since it included also market data
Accounting-based measures less accurately classify firms with higher RampD spending In case of adjustment for conservative accounting treatment of RampD and tax effects the classification was better Z-score was used as a benchmark Z-score was more robust to the changes that distort the o-score due to the use of market value Adjustment of z-score for the conservative treatment of RampD improved the classification
Dawkins MC etal (2007)
272 US firms that filed for bankruptcy between 1993 and 2003 traded on the major stock exchanges Investorsrsquo intraday transactions were taken from Trade and Quote database (TAQ)
(M) The authors investigated pattern of returns and investors trades around and shortly after Chapter 11 bankruptcy announcement They divided the investigated period into bull and bear markets The authors used five event windows Altmanrsquos z-score was used as a measure of firmrsquos financial condition
Large traders were dominating transactions around and after bankruptcy filing The authors found a modest negative correlation between the price plunge and post-filing period returns Investorsrsquo reactions were anomalously optimistic in the period of a bull market
29
Agarwal V and Taffler R (2008)
Non-finance UK firms listed on the LSE at any time during the period 1985-2001 The final sample covered 2006 firms (15384 firm-years) and 103 failures
(V) In the paper the authors compared accounting-based models and market based models in terms of predictive ability information content and bank credit portfolio profitability Accounting- based models were represented by Tafflerrsquos (1984) UK z-score based on Altmanrsquos (1968)
In the case of the predictive ability there was a little difference between those two types of models however both carried unique information about firm failure The use of the z-score model generated much higher risk-adjusted return profit and return on risk-weighted assets
Philosophov LV et al (2008)
No sample of non-bankrupt firms 100 US non-financial firms that filed for bankruptcy between 1997 and 2002
(V) The authors appliedmulti-alternative decision rules for bankruptcy prediction (BMP) Bayesian-type forecasting rules used debt repayment schedule and traditional financial ratios Results of the new approach were compared with Altmanrsquos z-score
The authors have identified 4 factors important for multiperiod approach Two of them reflect quantity and quality of debt and the two others the ability to pay the debt back Those factors are similar to as those proposed in the z-score The set of factors did not change however the predictive ability decreased over time BPM outperformed z-score in total probability of correct predictions while ldquofalse alarmrdquo was comparable
Fich EM Slezak SL (2008)
The sample includes 781 companies with 34 that filed for bankruptcy The period covers 1992-2000 Except the availability of financial and market data the availability of corporate governance data from Edgar data retrieval system was a prerequisite
(M) The authors explored how governance characteristics affect firmrsquos ability to avoid bankruptcy and power of accountingfinancial information to predict bankruptcy with the use of hazard models Altmanrsquos z-score was applied as a measure of firmrsquos financial distress together with interest coverage ratio (ICR)
Corporate governance characteristics are important for bankruptcy prediction About 25-30 of the variation in the occurrence of bankruptcy was explained by governance characteristics Smaller and independent boards with a higher ratio of non-inside directors and with larger ownership stakes of inside directors are more effective at avoiding bankruptcy if the firm became distressed
Eisdorfer A (2008) US companies traded on the major stock exchanges for period from 1963 to 2002 representing 7114 firms (52112 firm-years)
(M) The author tested two hypotheses volatility has a positive effect on distressed firmsrsquo investment and investments of these firms generate less
In case of first hypothesis z-score results were stronger than those based on KMV but in case of the second hypothesis KMV results were stronger Empirical tests indicated that
30
value during high uncertainty periods with the use of real option approach Altmanrsquos z-score and KMV model were used as a measure of firmrsquos financial distress
risk-shifting considerations are taken into account by distressed firms
Pindado J et al (2008)
Sample covered 1583 US companies (15702 observations) and 2250 companies (18160 observations) for the other G-7 countries for the period from 1990 to 2002 from Compustat The data panel was unbalanced
(R)The authorsrsquo developed ex-ante model for estimation of financial distress likehood (FDL) and presented financially (not legally) based definition of distress Re-estimated Altmanrsquos z-score was used for robustness check
The model is stable in terms of magnitude sign and significance of the coefficients and it provides a measure of FDL more robust to time and countries than other models In case of the re-estimated z-score model only profitability and retained earnings maintained their significance for different years and countries
Xu M Zhang C (2009)
Non-financial Japanese listed companies from 1992 to 2005 The number of firms was 3510 with 76 bankruptcies
(V) The authors applied Altmanrsquos z-score Ohlsonrsquos o-score and Mertonrsquos distance-to-default (d-score) to Japanese firms in order to check if the models are useful for bankruptcy prediction in Japan They also ldquomergedrdquo the models into c-score They introduced Japan-unique variables in order to check if corporate structure variables have impact on the probability of bankruptcy (x-score)
The models were also useful for Japanese firms in bankruptcy prediction but the market-based model was more successful The developed c-score and x-score models improved bankruptcy prediction
Li M-YL Miu P (2010)
Non-financial firms from Compustat database from 2nd Quarter 1996 to 4th Quarter 2006 The sample covered 73 failed firms and 138 non-failed firms with at least rating B during the whole period
(M) Altmanrsquos z-score and Mertonrsquos distance-to-default (DD) were used as variables in the model The authors developed hybrid bankruptcy prediction model with constant and dynamic loadings with the use of binary quintile regression (BQR)
The results of the research pointed out the superiority of the model with dynamic loadings In the case of firms with relatively poor credit quality the prediction accuracy might be improved by putting more attention to DD and less to the z-score In case of firms with relatively good credit quality the recommendations are the opposite eg more attention should be put to the z-score
31
Wu Y et al (2010) NYSE- and AMEX-listed Compustat non-financial firms for the period from 1980 to 2006 The final sample covered 50611 firm-years with 887 bankruptcies and 49724 non-bankrupt firm-years
(V) Five models (Altman 1968 Ohlson 1980 Zmijewski 1984 Shumway 2001 Hillegeist et al 2004) from the literature are used by the authors in order to evaluate their performance with an up-to-date data set Based on them the authors build their own integrated model (multi-period logit model with expanded set of variables)
The integrated model using accounting and market data as well as firmsrsquo characteristics outperformed the other models Altmanrsquos z-score performed poorly in comparison to the other 4 models Shumwayrsquos model outperformed model of Hillegeist et al performed adequately and Ohlsonrsquos and Zmijewskirsquos models performed adequately but their performance deteriorated over time
Shen C-H et al (2010)
Non-financial companies listed on the Taiwan Stock Exchange covering the period from 1999 to 2004 There were 52 default companies and 156 non-default companies in the sample
(V) The authors applied a robust logit method to build up an empirical model based on Altmanrsquos z-score (one variable was omitted retained earnings to total assets) They took into account outliers which so far have been omitted in the models The results of robust logit method were compared with logit method
In the case of in-the-sample forecasts robust logit models preformed better than the logit model However in the case of out-the-sample forecast superiority of robust logit model disappeared Robust logit model was more aggressive in assigning firms as default
Butler AW Wan H (2010)
New debt offerings from 1975-1999 (4293 offerings within 632 convertible debt issue) Sample covered non-regulated utility and non-financial companies listed on major US stock exchanges The first offering in the sample period for a particular firm was used and the other offerings from the same firms within the following five years were excluded from the sample
(M) The aim of the paper was to assess long-term stock performance of debt and convertible debt issuers The authors revised the results of the previous research on the stock returns of bond issuing firms According to the authors previous models omitted liquidity factor Altmanrsquos z-score was used as a proxy for financial distress besides momentum as another matching criterion
Introduction of the liquidity factor into the model erased long-run underperformance of debt and convertible debt issuers Momentum and Altmanrsquos z-score did not erase this underperformance
Aktas N et al (2012) US listed non-financial firms with z-score higher than the median of the population from 1992 to 2007 The
(M) The article investigated the relationship between the use of trade credit and the quality of firmsrsquo
According to the empirical study the change in the trade credit signaled the future positive change in firmrsquos performance
32
sample consisted in 15928 firm-years from 2096 firms
investments Altmanrsquos z-score was used as one of three proxies for measuring the quality of firmrsquos investment projects (additionally return on assets and long-term abnormal returns) The authors developed a theoretical model for trade credit decision with the use of strategic game with imperfect information as well as empirical study
Empirical results supported conclusions from the theoretical model In the case of the use of next period change of the z-score the authors confirmed both CEO incentive and entrenchment however in the case of two other proxies only CEO incentive
Chen H et al (2012) US non-financial companies issuing debt securities from Lehman Brothers Bond Database data on unionization described in Hirsch and Macpherson (2003) supported by financial and demographic data The period covered years from 1984 to 1998 The sample consisted in 996 firms and 5557 firm-years observations
(M) The authors focused on the impact of ldquounionized workersrdquo on the pricing of corporate debt Altmanrsquos z-score was used as one of 5 measures of distress (accompanied by interest coverage book equity Ohlsonrsquos o-score and default measure developed by Bharath and Shumway in 2008)
The authors drew 4 conclusions In the case of more ldquounionizedrdquo industries the yield on bonds is lower the impact is stronger in firms with weak financial standing highly ldquounionizedrdquo firms invested less in RampD than in physical assets they were less likely to be the acquisition target According to the authors ldquounionized workersrdquo protected bondholdersrsquo and other fixed claimants wealth
Jackson RHG Wood A (2013)
LSE-listed non-financial UK firms The sample consisted in 101 failed firms of which failure was registered from 30 Sept 2000 to 31 Dec 2009 and 6494 non-failed firm-years from 1 Jan 2000 to 31 Dec 2009
(V) The authors tested 13 different models of bankruptcy prediction and assessed their efficacy with the use of ROC curve They selected 3 single variable models 3 accounting-based models (with Altmanrsquos z-score) in two versions with up-dated coefficients and neural network approach 4 contingent claims models
Contingent claims models outperformed the other models The best four models are contingent claims models based on European call and barrier options In the case of application of the neural network to accounting based models the predictive ability improved however was still lower than in case of market-based models
Singhal R Zhu Y (2013)
US non-financial firms Final sample covered 769 bankruptcy filings between 1 Jan 1991 to 31 Dec 2007 Failed firms were divided to two groups focused (622) and diversified (147)
(M) The focus of the study was to check bankruptcy risk and bankruptcy costs in the case of focused vs diversified firms Altmanrsquos z-score was used as a measure of financial distress
The mean and median z-score for diversified groups were higher than for focused groups The Z-score was highly correlated with the leverage in the authorsrsquo model Diversified firms represented a lower risk of bankruptcy however they underperformed focused firms
33
in other areas (like inefficient segment investment and longer time in the bankruptcy procedure what incurred higher bankruptcy costs)
Lyandres E Zhdanov A (2013)
US companies (financial and non-financial) listed on major stock-exchanges The sample covered period from 1985 to 2005 The number of bankruptcies was 948 (compiled from different sources like Thomson Financial and T Shumwayrsquos database) and the number of firm-years was 146836
(V) The authors posed the question if the inclusion of variables related to investment opportunities improved the predictive power of three models (Altmanrsquos z-score Zmijewskirsquos and Shumwayrsquos models) They used 3 proxies for investment opportunities (market-to-book value-to-book RampD-to-assets)
The measures of investment opportunities were related to the likehood of default Inclusion of either of three investment opportunities measures improved modelsrsquo out-of-sample forecasting ability
Ho C-Y et al (2013) North America publicly listed pulp and papers firms Sample includes 122 firms within 12 that filed for bankruptcy The period from 1990 to 2009 Data were compiled from different sources (like Compustat CRSP WRDS)
(R) The paper investigated bankruptcy prediction with the use of financial ratios and investorsrsquo reactions to bankruptcy filing The authors used Ohlsonrsquos model (original and re-estimated) to predict bankruptcy in the pulp and paper industry Altmanrsquos z-score (original and re-estimated) was used for robustness check
Investorsrsquo suffered significant losses during the month a bankruptcy occurred O-scores of failed firms were higher than in case of non-failed firms 1 to 2 year before the bankruptcy Re-estimated Ohlsonrsquos model performed better than the original In the case of Altmanrsquos z-score the re-estimated model performed better due to the reduction of Type II errors that occurred in the original one In both cases models were useful for bankruptcy prediction
Kieschnick R et al (2013)
Non-financial US companies from 1990 to 2006 There were 3786 companies in the sample (yearly average)
(M) The paper focused on the relationship between working capital management and shareholdersrsquo wealth as well as their determinants Altmanrsquos original (1968) and revised (2000) z-score were used as a measure of the financial distress
The authors concluded that ldquoincremental dollar invested in net operating capital is worth less than an incremental dollar held in cash for the average firmrdquo The impact on the shareholder value was determined by sales expectations access to external capital bankruptcy risk and debt load The higher the z-score was the more valuable its investment in working capital
34
Acosta-Gonzaacutelez E
Fernaacutendez-Rodriacuteguez
F (2014)
Spanish building industry firms For model estimation the sample covered 93 firms that failed in 2004 and 257 randomly selected non-failed firms for the period from 2000 to 2004 For ex-ante forecast accounting information from 2005 for randomly selected 400 out of which 80 failed in 2007
(V) The authors used genetic algorithms with Schwarz information criterion (GASIC) for variables selection (out of 32 preselected ratios) combined with the logit model for bankruptcy prediction Altmanrsquos z-score model was used as one of two benchmarks for authorsrsquo model evaluation
One step ahead forecast Altmanrsquos model was better in predicting failed firms but the type II error was high two and three steps ahead forecasts were similar in terms of failed firms but in the case of non-failed Altmanrsquos model prediction was worse four steps ahead forecasts GASIC model outperformed in the case of failed firms and was comparable in the case of non-failed firms
Note Based on the own review of studies
35
35
Table 2 Number of observations by country
Estimation data Test data
Country Non-failed Failed Non-failed Failed
Austria (AT) 7430 55 7526 44
Belgium (BE) 179979 2994 179818 2944
Bosnia (BA) 29391 35 29139 32
Bulgaria (BG) 50041 48 42351 44
China (CN) 39315 198
China delisted dataset
16291 29
China ST data 846 16 1020 16
Colombia (CO) 8366 139 6982 125
Greece (GR) 51763 28
Croatia (HR) 59541 249 58478 275
Czech Republic (CZ) 92835 556 92562 564
Denmark (DK) 167934 1334 168538 1398
Estonia (EE) 34313 234 34196 242
Finland (FI) 90878 481 91227 459
France (FR) 160749 6124 161653 6318
Germany (DE) 98814 910 99496 921
Hungary (HU) 19421 303 20155 313
Iceland (IS) 17399 248 17624 243
Ireland (IE) 6665 121 6406 139
Italy (IT) 167113 8101 166258 8124
Latvia (LV) 8064 433 8241 477
Lithuania (LT) 10000 56
Netherlands (NL) 20885 154 15854 147
Norway (NO) 172467 1294 170985 1206
Poland (PL) 87200 291 86233 264
Portugal (PT) 180114 3390 178646 3422
Romania (RO) 161992 97 164259 93
Russian Federation (RU) 116903 2534 115711 2481
Serbia (RS) 100100 68
Slovakia (SK) 7856 120 7788 124
Slovenia (SI) 14419 59 14081 41
Spain (ES) 156746 3036 158122 2991
Sweden (SE) 169810 2256 169999 2314
Ukraine (UA) 133342 1787 133980 1765
United Kingdom (GB) 171493 760 170930 716
UK (GB) liquidation dataset
342423
4990
United States (US) 9557 56 9929 53
In total 2602563 38215 3148079 43664
36
36
Table 3 Descriptive statistics (all data)
WCTA RETA EBITTA BVETD
Statistic Non-failed Failed Non-failed Failed
Non-failed Failed
Non-failed Failed
Median 0152 -0059 0189 -0024 0041 -0020 0451 0025
Mean 0147 -0213 0188 -0317 0055 -0108 3594 0703
Standard deviation 0442 0604 0509 0767 0227 0296 11499 5712
Upper quartile 0420 0142 0476 0087 0131 0042 1548 0215
Lower quartile -0040 -0440 0011 -0450 -0008 -0208 0100 -0240
Maximum 0956 0956 0958 0958 0785 0785 68606 68606
Minimum -1637 -1637 -2453 -2453 -0828 -0828 -0649 -0649
Legend WCTA = Working CapitalTotal Assets
RETA = Retained EarningsTotal Assets EBITTA = EBITTotal Assets
BVETD = Book Value of EquityTotal Liabilities SALTA = SalesTotal Assets
37
37
Table 4 The coefficients of the different models estimated for all data
Coefficients for different statistical models
Variable Zrsquo-Score
Model 1
Model 2
Model 3 Model 4
Model 5
Model 6
Model 7 Model 8
Constant 325 -0042 0035 0207 -13466 0007 0048 0049 -13302
WCTA 656 -0561 -0495 -0483 -0441 -0487 -0540 -0496 -0459
RETA 326 -0724 -0862 -0891 -1146 -0846 -0859 -0863 -1160
EBITTA 672 -1791 -1721 -1790 -1619 -1757 -1695 -1717 -1682
BVETD 105 -0021 -0017 -0016 -0012 -0017 -0016 -0017 -0013
Year dummies
Year 2008 -0055 -0034
Year 2009 -0179 -0150
Year 2010 -0666 -0631
Size variables Total assets (log)
1830
1837
Total assets squared (log)
-0061
-0061
Age dummies
Less than 6 years 0135 0186
Over 12 years -0058 -0099
Country risk SP Country rating rank
-0003 -0014
Industry dummies
Restaurants and hotels -0653 -0628
Construction 0445 0365
Whole sale and retailing -0112 -0157
Agriculture -0180 -0176
Manufacturing 0139 0095
Energy and water production -0454 -0472
Information technology -0913 -0915
Significance
38
38
Coefficients are statistically significant at 00001
Models
Zrsquo-Score = Original Altman (1983) Zrsquo-Score Model coefficients Model 1 = The MDA model
Model 2 = The LR model Model 3 = The LR model estimated for all data with year dummies
Model 4 = The LR model estimated for all data with size variables Model 5 = The LR model estimated for all data with age category dummies Model 6 = The LR model estimated for all data with industry dummies Model 7 = The LR model estimated for all data with country risk rank Model 8 = The LR model estimated for all data with all variables
39
39
40
40
Table 5 Test data AUCs for different countries based on all data model versions Comparisons are with AUC of the LR model estimated for all data (benchmark)
Test data AUC for different models
Country Benchmark Model 1 Model 2 Model 3 Model 4 Model 5 Model 6 Model 7 Model 8
All Data 0748 0743---- 0745---- 0752++++ 0760++++ 0748+++ 0751++++ 0749++++ 0771++++
Countries with estimation data
Austria (AT) 0800 0788 0797 0805 0818+ 0814+ 0782 0800 0819
Belgium (BE) 0772 0760 0770 0777 0747 0777 0765 0772 0758
Bosnia (BA) 0862 0805 0857 0776 0863 0847 0855 0862 0784
Bulgaria (BG) 0684 0630 0680 0654 0691 0680 0659 0684 0632
China ST companies 0985 0911---- 0983 0958- 0977 0978 0987 0985 0968
Colombia (CO) 0726 0724 0727 0715 0758 0728 0726 0726 0757
Croatia (HR) 0844 0812 0839 0803 0837 0835 0832 0844 0801
Czech Republic (CZ) 0811 0813 0811 0819 0828 0807 0820 0811 0838
Denmark (DK) 0803 0798 0800 0781 0813 0802 0801 0803 0796
Estonia (EE) 0823 0827 0823 0847 0866 0826 0833 0823 0890
Finland (FI) 0867 0864 0866 0835 0862 0870 0878 0867 0853
France (FR) 0739 0723 0735 0749 0771 0741 0762 0739 0799
Germany (DE) 0673 0658 0666 0695 0656 0684 0677 0673 0688
Hungary (HU) 0742 0746 0740 0660 0738 0755 0735 0742 0696
Iceland (IS) 0664 0674 0666 0694 0678 0673 0672 0664 0716
Ireland (IE) 0679 0672 0676 0708 0677 0681 0688 0679 0712
Italy (IT) 0806 0799 0804 0833 0835 0806 0799 0806 0849
Latvia (LV) 0678 0691 0678 0704 0676 0686 0698 0678 0724
Netherlands (NL) 0752 0754 0750 0775 0769 0754 0746 0752 0787
Norway (NO) 0716 0694 0713 0658 0682 0720 0715 0716 0645
41
41
Poland (PL) 0903 0904 0904 0908 0902 0903 0899 0903 0904
Portugal (PT) 0741 0724 0736 0749 0773 0738 0755 0741 0785
Romania (RO) 0758 0740 0754 0709 0749 0755 0748 0758 0703
Russian Federation (RU) 0811 0802 0812 0843 0799 0807 0799 0811 0814
Slovakia (SK) 0777 0774 0776 0780 0811 0769 0786 0777 0808
Slovenia (SI) 0737 0725 0733 0674 0740 0747 0718 0737 0721
Spain (ES) 0734 0713 0732 0707 0793 0728 0753 0734 0774
Sweden (SE) 0813 0801 0809 0799 0784 0817 0823 0814 0800
Ukraine (UA) 0708 0714 0710 0715 0721 0708 0702 0708 0722
United Kingdom (GB) 0699 0719 0699 0686 0736 0695 0706 0699 0729
United States (US) 0710 0701 0711 0709 0722 0705 0716 0710 0723
Countries only in test data
European
Greece (GR) 0715 0670 0702 0725 0711 0713 0717 0715 0718
Lithuania (LT) 0767 0782 0767 0764 0768 0769 0775 0767 0778
Serbia (RS) 0736 0713 0730 0603- 0826 0720 0753 0736 0738
United Kingdom Liquidation set 0606 0621 0603 0620 0618 0610 0607 0607 0635
Non-European
China (CN) 0558 0570 0557 0572 0543 0554 0567 0558 0556
China Delisted companies 0529 0546 0519 0563 0740++++ 0542 0520 0529 0707+++
Significance AUC better than benchmark 00001 = ++++ 0001 = +++ 001 = ++ 01 = +
AUC worse than benchmark 00001 = ---- 0001 = --- 001 = -- 01 = - Models
Benchmark = The LR model estimated for all data with Zrsquorsquo-model (1983) variables Model 1 = The original Altman (1983) Zrsquorsquo-Score Model
Model 2 = The MDA model estimated for all data Model 3 = The LR model estimated for all data with year dummies
42
42
Model 4 = The LR model estimated for all data with size variables Model 5 = The LR model estimated for all data with age category dummies Model 6 = The LR model estimated for all data with industry dummies Model 7 = The LR model estimated for all data with country risk rank Model 8 = The LR model estimated for all data with all variables
43
43
Table 6 Differences of medians between non-failed and failed groups
Country WCTA RETA EBITTA BVETD AUC of
Z-Score
Austria (AT) 0448 0405 0126 0487 0788
Belgium (BE) 0223 0264 0077 0431 0760
Bosnia (BA) 0106 0249 0088 0580 0805
Bulgaria (BG) 0114 0291 0094 0436 0630
China (CN) 0068 0032 0016 0280 0570
China delisted data 0089 -0061 -0032 0083 0546
China ST data 0298 0293 0139 0468 0911
Colombia (CO) 0226 0235 0099 0705 0724
Croatia (HR) 0275 0335 0044 0274 0812
Czech Republic (CZ) 0404 0397 0069 0667 0813
Denmark (DK) 0267 0356 0046 0733 0798
Estonia (EE) 0331 0388 0113 1033 0827
Finland (FI) 0402 0606 0207 0907 0864
France (FR) 0140 0213 0065 0424 0723
Germany (DE) 0131 0136 0032 0262 0658
Greece (GR) 0171 0262 0049 0349 0670
Hungary (HU) 0175 0224 0052 0587 0746
Iceland (IS) 0246 0261 0051 0337 0674
Ireland (IE) 0181 0266 0039 0560 0672
Italy (IT) 0277 0164 0073 0207 0799
Latvia (LV) 0117 0120 0042 0254 0691
Lithuania (LT) 0246 0218 0051 0569 0782
Netherlands (NL) 0204 0253 0077 0432 0754
Norway (NO) 0157 0219 0115 0329 0694
Poland (PL) 1340 0920 0124 1351 0904
Portugal (PT) 0215 0200 0052 0318 0724
Romania (RO) 0222 0271 0056 0298 0740
Russian Federation (RU) 0350 0242 0069 0245 0802
Serbia (RS) 0120 0148 0045 0389 0713
Slovakia (SK) 0256 0184 0061 0431 0774
Slovenia (SI) 0111 0172 0035 0326 0725
Spain (ES) 0143 0143 0076 0285 0713
Sweden (SE) 0255 0346 0099 0663 0801
Ukraine (UA) 0204 0200 0031 0449 0714
United Kingdom (GB) 0211 0245 0033 0472 0719
UK Liquidation set 0156 0234 0031 0447 0621
United States (US) 0195 0378 0248 0722 0701
44
44
Average of column items 0245 0265 0073 0481 0740
Correlation with Z-Score AUC 0611 0681 0516 0574 1000
Legend WCTA = Working CapitalTotal Assets
RETA = Retained EarningsTotal Assets EBITTA = EBITTotal Assets
BVETD = Book Value of EquityTotal Liabilities SALTA = SalesTotal Assets
AUC = Area under the ROC curve Z-Score = Altman (1983) Z-Score in the test data
45
45
Table 7 Test data AUCs for different estimated country models Comparisons are with AUC of the LR model estimated for all data (benchmark)
Test data AUC for different models
Country Benchmark Model 1 Model 2 Model 3 Model 4 Model 5 Model 6 Model 7
Austria (AT) 0800 0782 0770- 0774 0829 0787 0707- 0764
Belgium (BE) 0772 0779 0780 0826 0776 0783 0781 0834
Bosnia (BA) 0862 0850 0832 0833 0838 0838 0820 0853
Bulgaria (BG) 0684 0785 0785 0785 0796 0794 0677 0707
China (CN) ST companies 0985 0984 0982 0980 0986 0986 0986 0989
Colombia (CO) 0726 0755 0754 0818+ 0789 0749 0774 0824+
Croatia (HR) 0844 0862 0858 0865 0853 0863 0847 0863
Czech Republic (CZ) 0811 0812 0812 0823 0830 0813 0818 0842
Denmark (DK) 0803 0806 0809 0833 0818 0804 0813 0843
Estonia (EE) 0823 0824 0839 0866 0874 0839 0847 0899
Finland (FI) 0867 0867 0870 0885 0868 0873 0879 0894
France (FR) 0739 0773 0799 0805 0826 0800 0810 0845
Germany (DE) 0673 0684 0685 0734 0704 0701 0690 0762
Hungary (HU) 0742 0736 0743 0788 0767 0765 0747 0820
Iceland (IS) 0664 0670 0671 0784+ 0683 0714 0708 0824+
Ireland (IE) 0679 0663 0666 0718 0661 0665 0680 0724
Italy (IT) 0806 0802 0810 0835 0839 0809 0816 0868
Latvia (LV) 0678 0690 0707 0745 0720 0711 0730 0771
Netherlands (NL) 0752 0752 0756 0768 0784 0760 0759 0807
Norway (NO) 0716 0741 0741 0803 0749 0744 0743 0814
Poland (PL) 0903 0891 0897 0915 0899 0896 0895 0913
Portugal (PT) 0741 0753 0757 0761 0780 0758 0765 0797
Romania (RO) 0758 0718 0773 0805 0757 0755 0753 0774
Russian Federation (RU) 0811 0808 0810 0854 0811 0811 0818 0862
Slovakia (SK) 0777 0773 0775 0782 0810 0761 0773 0807
46
46
Slovenia (SI) 0737 0703 0719 0704 0711 0739 0686 0698
Spain (ES) 0734 0755 0767 0768 0849 0766 0776 0858
Sweden (SE) 0813 0826 0829 0843 0831 0831 0892 0901
Ukraine (UA) 0708 0712 0712 0720 0742 0718 0718 0758
United Kingdom (GB) 0699 0708 0713 0718 0764 0714 0731 0785
United States (US) 0710 0689 0687 0686 0816+ 0689 0714 0816+
Average of AUC 0768 0773 0778 0801 0799 0782 0779 0823
Significance AUC better than benchmark 00001 = ++++ 0001 = +++ 001 = ++ 01 = +
AUC worse than benchmark 00001 = ---- 0001 = --- 001 = -- 01 = - Models
Benchmark = The LR model estimated for all data with Zrsquorsquo-model (1983) variables Model 1 = The MDA model estimated for country data
Model 2 = The LR model estimated for country data Model 3 = The LR model estimated for country data with year dummies
Model 4 = The LR model estimated for country data with size variables Model 5 = The LR model estimated for country data with age category dummies Model 6 = The LR model estimated for country data with industry dummies
Model 7 = The LR model estimated for country data with all variables
47
47
Appendices
Appendix 1 Medians of the Altman (1983) model (Z) variables by status and country
Non-failed Failed
Non-failed Failed
Non-failed Failed Non-failed Failed
Country WCTA
RETA
EBITTA
BVETD
Austria (AT) 0170 -0278 0260 -0145 0055 -0071 0465 -0022
Belgium (BE) 0136 -0087 0157 -0107 0052 -0025 0460 0029
Bosnia (BA) 0087 -0019 0148 -0101 0032 -0056 0580 0000
Bulgaria (BG) 0216 0102 0272 -0019 0075 -0019 0504 0068
China (CN) 0105 0037 0064 0032 0064 0048 0870 0590
China delisted data 0158 0069 0286 0347 0059 0091 0923 0840
China ST data 0106 -0192 0281 -0012 0052 -0087 0776 0308
Colombia (CO) 0244 0018 0282 0047 0104 0005 0940 0235
Croatia (HR) 0093 -0182 0130 -0205 0030 -0014 0274 0000
Czech Republic (CZ) 0196 -0208 0230 -0167 0050 -0019 0591 -0076
Denmark (DK) 0128 -0139 0306 -0050 0005 -0041 0758 0025
Estonia (EE) 0222 -0109 0455 0067 0050 -0063 1169 0136
Finland (FI) 0233 -0169 0359 -0247 0082 -0125 0744 -0163
France (FR) 0146 0006 0223 0010 0059 -0006 0501 0077
Germany (DE) 0307 0176 0150 0014 0069 0037 0335 0073
Greece (GR) 0127 -0044 0049 -0213 0039 -0010 0460 0111
Hungary (HU) 0135 -0040 0271 0047 0054 0002 0717 0130
Iceland (IS) 0051 -0195 0046 -0215 0051 0000 0196 -0141
Ireland (IE) 0198 0017 0383 0117 0029 -0010 0728 0168
Italy (IT) 0107 -0170 0077 -0087 0032 -0041 0178 -0029
Latvia (LV) 0102 -0015 0150 0030 0069 0027 0342 0088
48
48
Lithuania (LT) 0205 -0041 0273 0055 0054 0003 0686 0117
Netherlands (NL) 0204 0000 0303 0050 0065 -0012 0511 0079
Norway (NO) 0185 0028 0139 -0080 0068 -0047 0398 0069
Poland (PL) 0198 -1142 0258 -0662 0076 -0048 0850 -0501
Portugal (PT) 0164 -0051 0133 -0067 0028 -0024 0343 0025
Romania (RO) 0071 -0151 0158 -0113 0041 -0015 0250 -0048
Russian Federation (RU) 0088 -0262 0106 -0136 0043 -0026 0194 -0051
Serbia (RS) 0093 -0027 0129 -0019 0027 -0018 0389 0000
Slovakia (SK) 0137 -0119 0185 0001 0060 -0001 0496 0065
Slovenia (SI) 0109 -0002 0215 0043 0039 0004 0434 0108
Spain (ES) 0117 -0026 0139 -0004 0029 -0047 0336 0051
Sweden (SE) 0266 0011 0357 0011 0058 -0041 0749 0086
Ukraine (UA) 0053 -0151 0034 -0166 0003 -0028 0442 -0007
United Kingdom (GB) 0179 -0032 0294 0049 0031 -0002 0579 0107
UK Liquidation set 0179 0023 0294 0060 0031 0000 0579 0132
United States (US) 0164 -0031 0374 -0004 0003 -0245 0800 0078
Average of medianssect 0153 -0092 0213 -0050 0048 -0025 0555 0075
Legend WCTA = Working CapitalTotal Assets
RETA = Retained EarningsTotal Assets EBITTA = EBITTotal assets
BVETD = Book Value of EquityTotal Liabilities sect = Because the two datasets for non-failed UK firms are identical the non-failed medians are used only once in the calculation of the averages
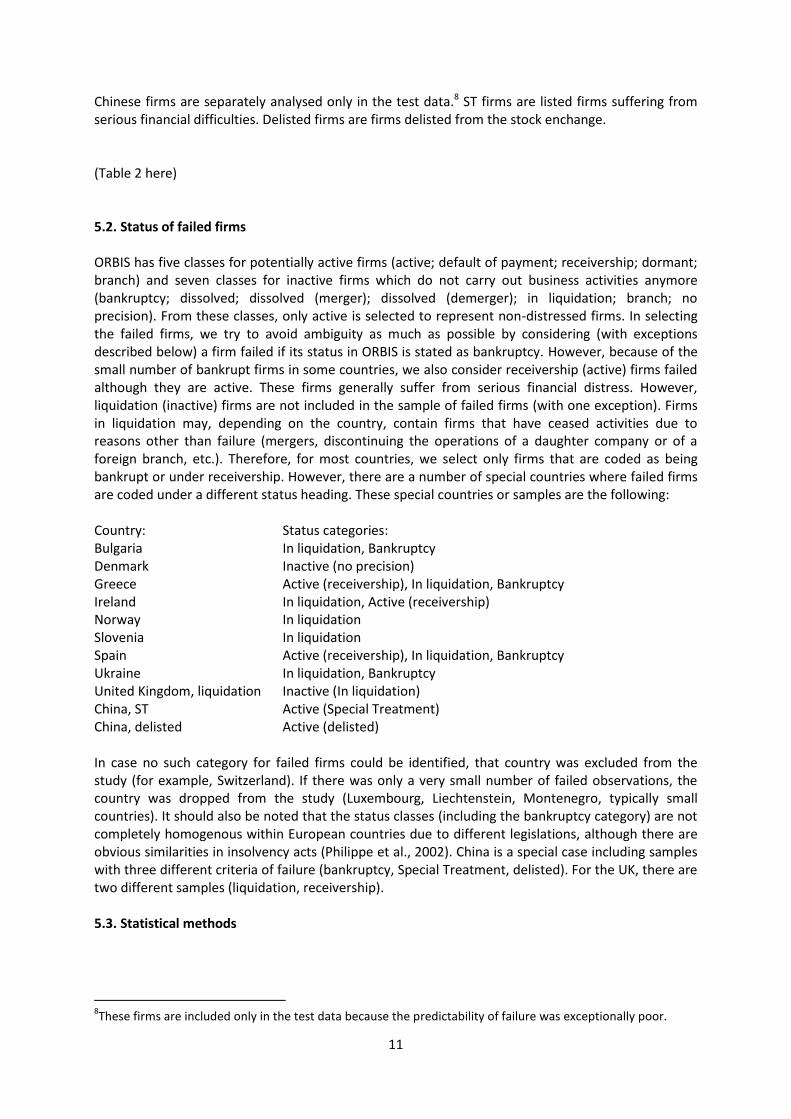
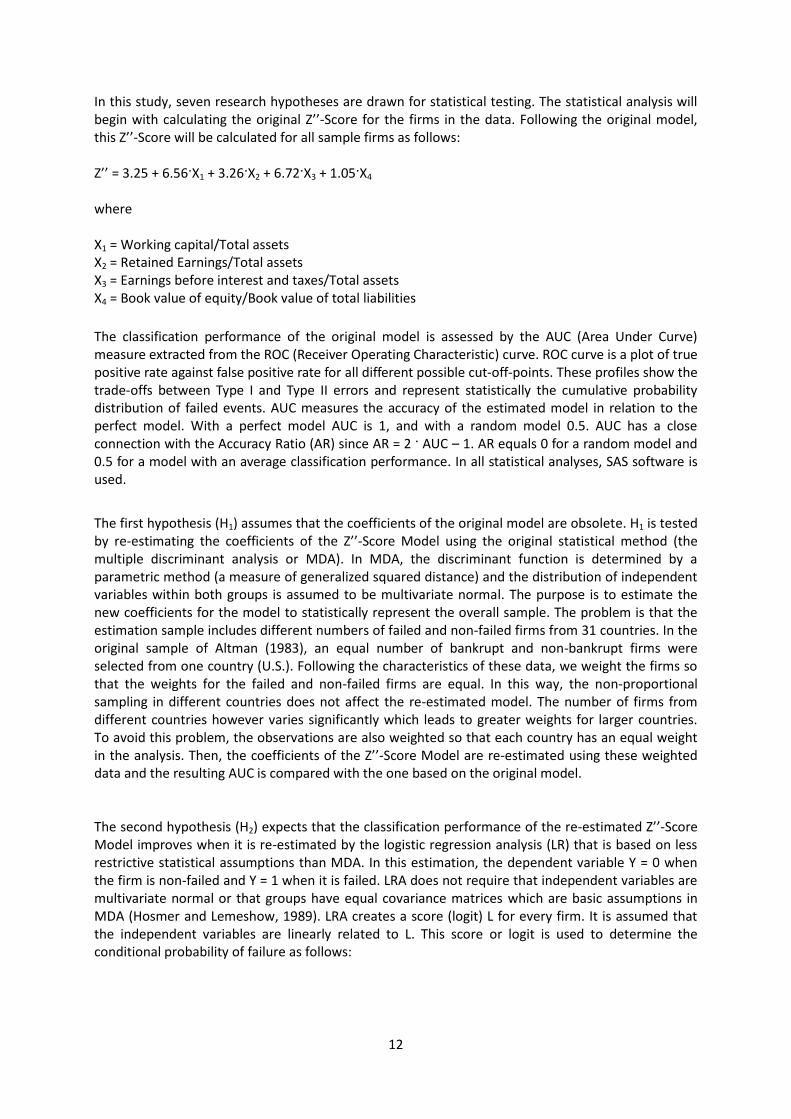
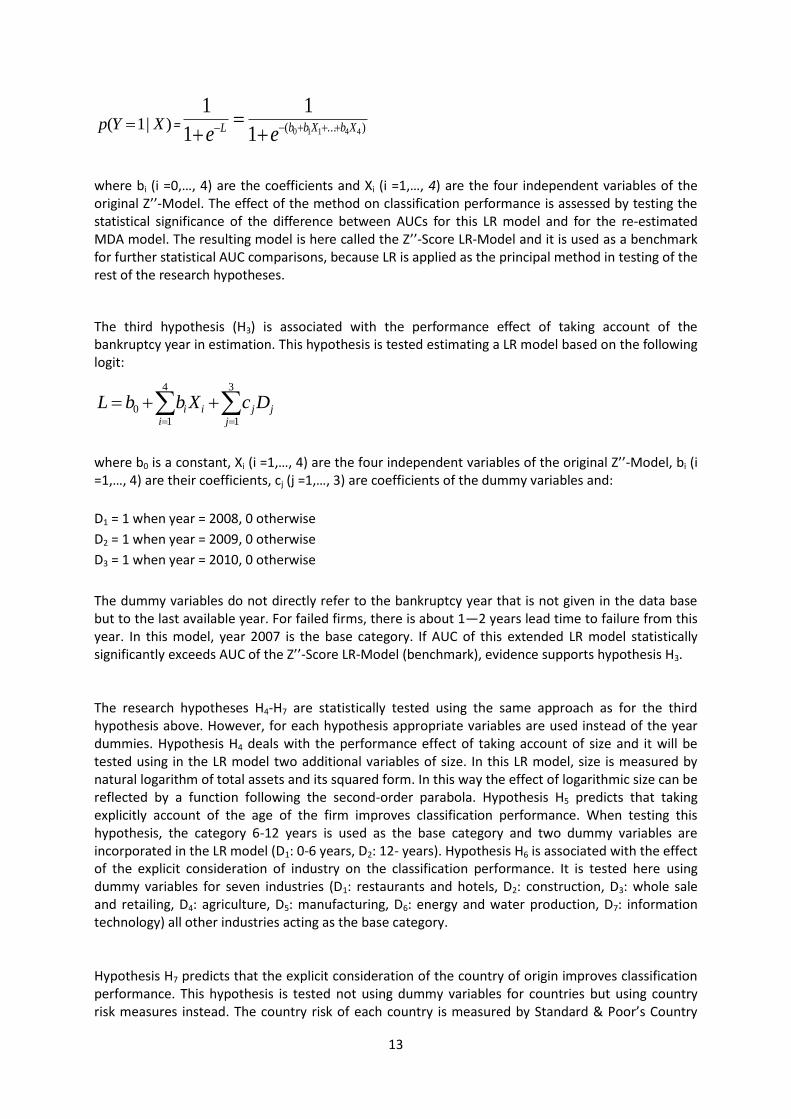
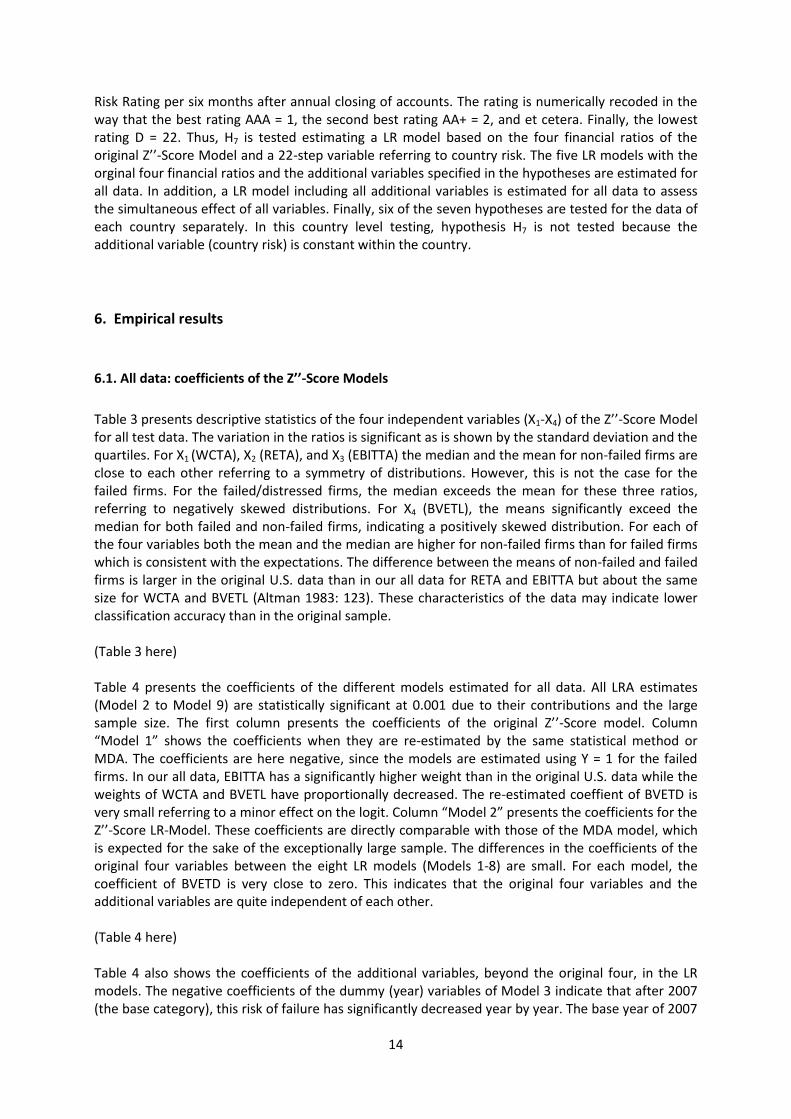
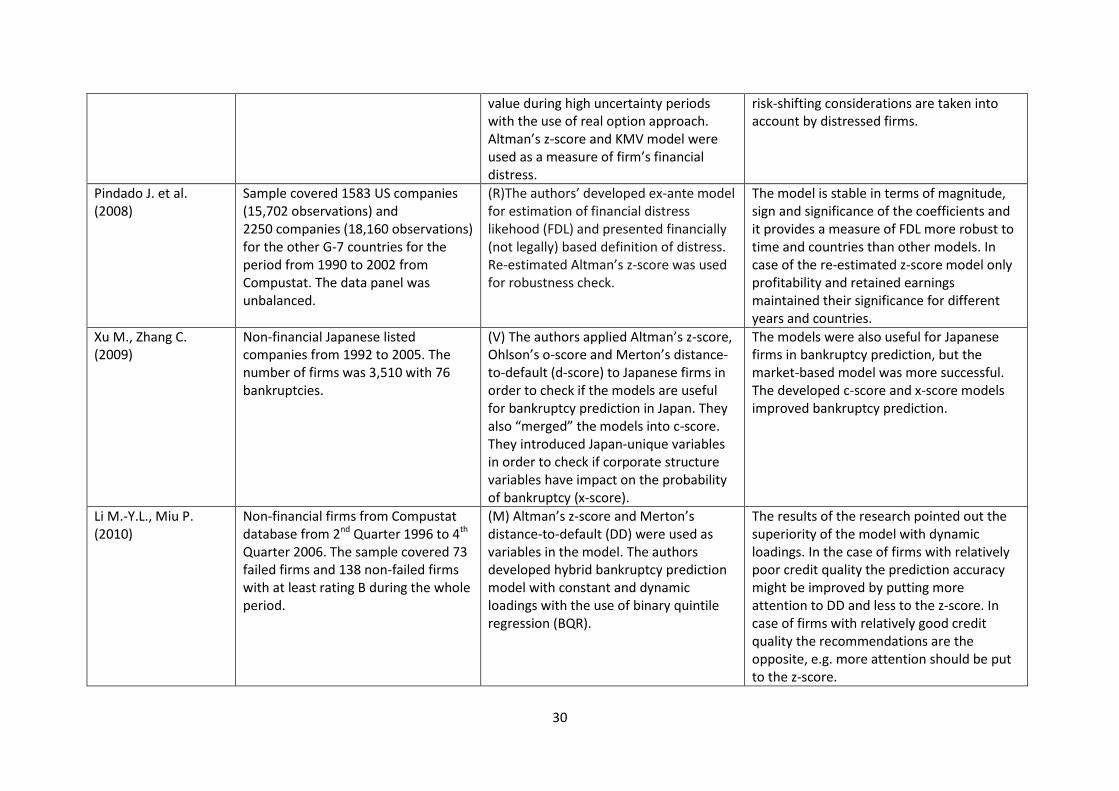
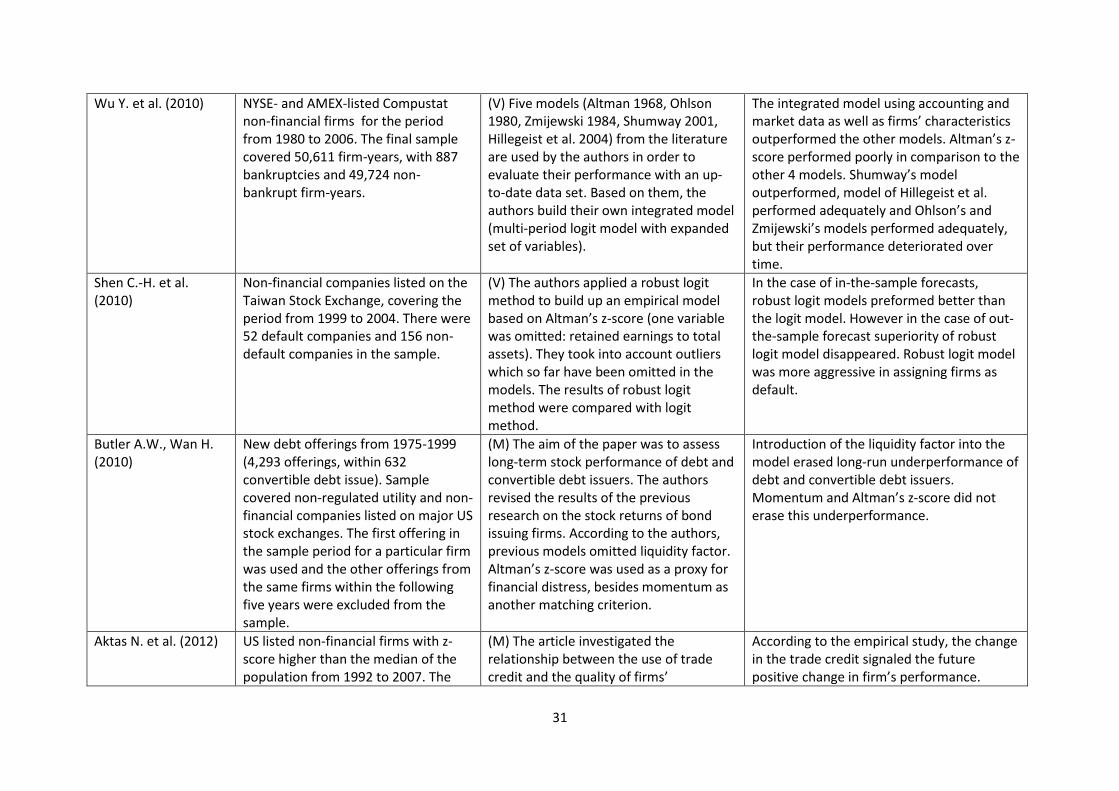
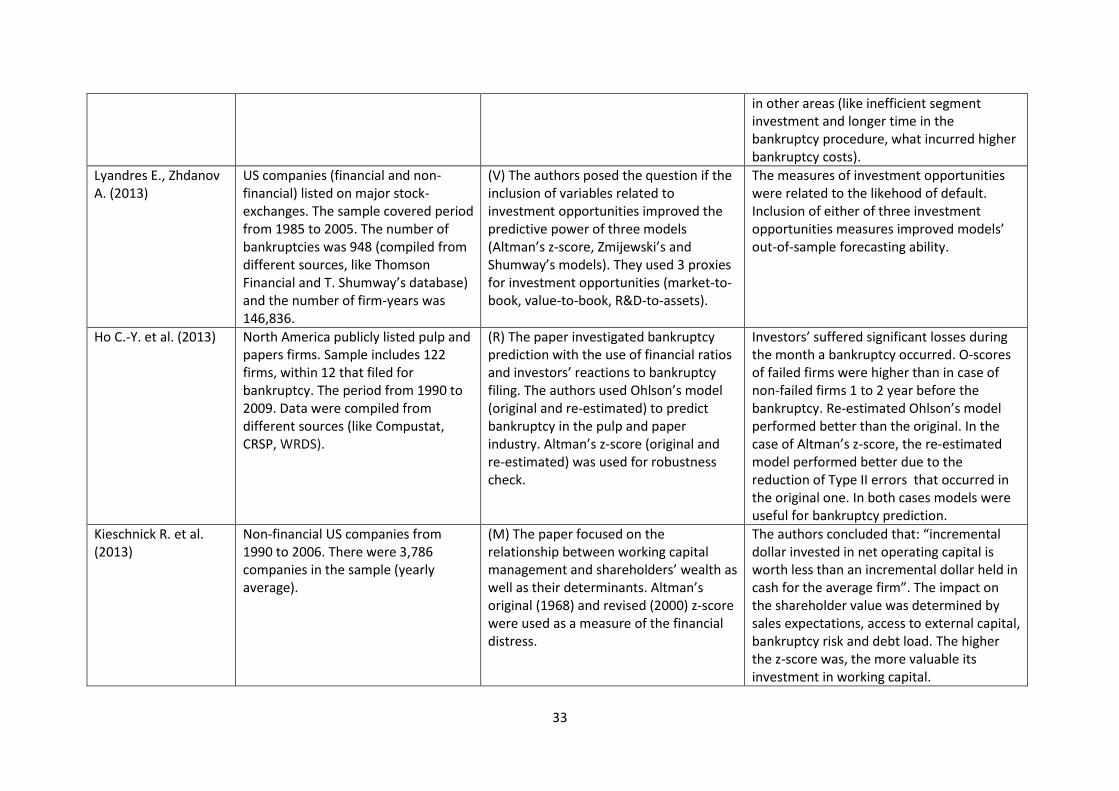
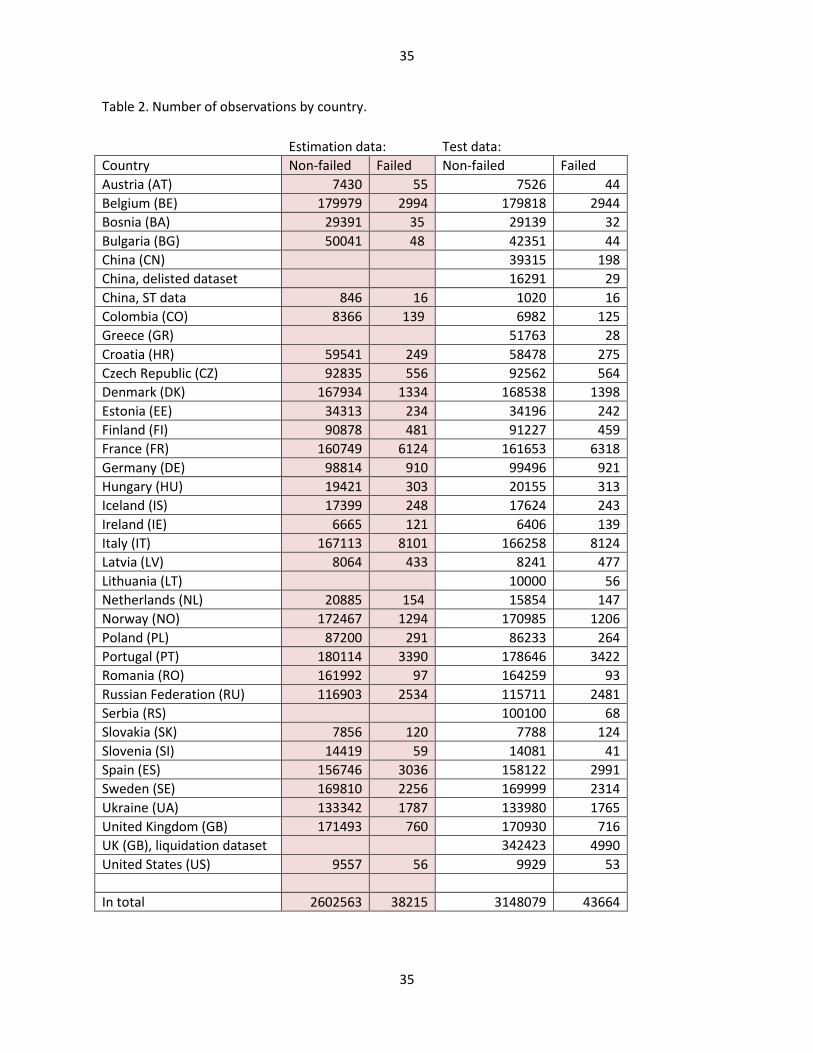
35
35
Table 2 Number of observations by country
Estimation data Test data
Country Non-failed Failed Non-failed Failed
Austria (AT) 7430 55 7526 44
Belgium (BE) 179979 2994 179818 2944
Bosnia (BA) 29391 35 29139 32
Bulgaria (BG) 50041 48 42351 44
China (CN) 39315 198
China delisted dataset
16291 29
China ST data 846 16 1020 16
Colombia (CO) 8366 139 6982 125
Greece (GR) 51763 28
Croatia (HR) 59541 249 58478 275
Czech Republic (CZ) 92835 556 92562 564
Denmark (DK) 167934 1334 168538 1398
Estonia (EE) 34313 234 34196 242
Finland (FI) 90878 481 91227 459
France (FR) 160749 6124 161653 6318
Germany (DE) 98814 910 99496 921
Hungary (HU) 19421 303 20155 313
Iceland (IS) 17399 248 17624 243
Ireland (IE) 6665 121 6406 139
Italy (IT) 167113 8101 166258 8124
Latvia (LV) 8064 433 8241 477
Lithuania (LT) 10000 56
Netherlands (NL) 20885 154 15854 147
Norway (NO) 172467 1294 170985 1206
Poland (PL) 87200 291 86233 264
Portugal (PT) 180114 3390 178646 3422
Romania (RO) 161992 97 164259 93
Russian Federation (RU) 116903 2534 115711 2481
Serbia (RS) 100100 68
Slovakia (SK) 7856 120 7788 124
Slovenia (SI) 14419 59 14081 41
Spain (ES) 156746 3036 158122 2991
Sweden (SE) 169810 2256 169999 2314
Ukraine (UA) 133342 1787 133980 1765
United Kingdom (GB) 171493 760 170930 716
UK (GB) liquidation dataset
342423
4990
United States (US) 9557 56 9929 53
In total 2602563 38215 3148079 43664
36
36
Table 3 Descriptive statistics (all data)
WCTA RETA EBITTA BVETD
Statistic Non-failed Failed Non-failed Failed
Non-failed Failed
Non-failed Failed
Median 0152 -0059 0189 -0024 0041 -0020 0451 0025
Mean 0147 -0213 0188 -0317 0055 -0108 3594 0703
Standard deviation 0442 0604 0509 0767 0227 0296 11499 5712
Upper quartile 0420 0142 0476 0087 0131 0042 1548 0215
Lower quartile -0040 -0440 0011 -0450 -0008 -0208 0100 -0240
Maximum 0956 0956 0958 0958 0785 0785 68606 68606
Minimum -1637 -1637 -2453 -2453 -0828 -0828 -0649 -0649
Legend WCTA = Working CapitalTotal Assets
RETA = Retained EarningsTotal Assets EBITTA = EBITTotal Assets
BVETD = Book Value of EquityTotal Liabilities SALTA = SalesTotal Assets
37
37
Table 4 The coefficients of the different models estimated for all data
Coefficients for different statistical models
Variable Zrsquo-Score
Model 1
Model 2
Model 3 Model 4
Model 5
Model 6
Model 7 Model 8
Constant 325 -0042 0035 0207 -13466 0007 0048 0049 -13302
WCTA 656 -0561 -0495 -0483 -0441 -0487 -0540 -0496 -0459
RETA 326 -0724 -0862 -0891 -1146 -0846 -0859 -0863 -1160
EBITTA 672 -1791 -1721 -1790 -1619 -1757 -1695 -1717 -1682
BVETD 105 -0021 -0017 -0016 -0012 -0017 -0016 -0017 -0013
Year dummies
Year 2008 -0055 -0034
Year 2009 -0179 -0150
Year 2010 -0666 -0631
Size variables Total assets (log)
1830
1837
Total assets squared (log)
-0061
-0061
Age dummies
Less than 6 years 0135 0186
Over 12 years -0058 -0099
Country risk SP Country rating rank
-0003 -0014
Industry dummies
Restaurants and hotels -0653 -0628
Construction 0445 0365
Whole sale and retailing -0112 -0157
Agriculture -0180 -0176
Manufacturing 0139 0095
Energy and water production -0454 -0472
Information technology -0913 -0915
Significance
38
38
Coefficients are statistically significant at 00001
Models
Zrsquo-Score = Original Altman (1983) Zrsquo-Score Model coefficients Model 1 = The MDA model
Model 2 = The LR model Model 3 = The LR model estimated for all data with year dummies
Model 4 = The LR model estimated for all data with size variables Model 5 = The LR model estimated for all data with age category dummies Model 6 = The LR model estimated for all data with industry dummies Model 7 = The LR model estimated for all data with country risk rank Model 8 = The LR model estimated for all data with all variables
39
39
40
40
Table 5 Test data AUCs for different countries based on all data model versions Comparisons are with AUC of the LR model estimated for all data (benchmark)
Test data AUC for different models
Country Benchmark Model 1 Model 2 Model 3 Model 4 Model 5 Model 6 Model 7 Model 8
All Data 0748 0743---- 0745---- 0752++++ 0760++++ 0748+++ 0751++++ 0749++++ 0771++++
Countries with estimation data
Austria (AT) 0800 0788 0797 0805 0818+ 0814+ 0782 0800 0819
Belgium (BE) 0772 0760 0770 0777 0747 0777 0765 0772 0758
Bosnia (BA) 0862 0805 0857 0776 0863 0847 0855 0862 0784
Bulgaria (BG) 0684 0630 0680 0654 0691 0680 0659 0684 0632
China ST companies 0985 0911---- 0983 0958- 0977 0978 0987 0985 0968
Colombia (CO) 0726 0724 0727 0715 0758 0728 0726 0726 0757
Croatia (HR) 0844 0812 0839 0803 0837 0835 0832 0844 0801
Czech Republic (CZ) 0811 0813 0811 0819 0828 0807 0820 0811 0838
Denmark (DK) 0803 0798 0800 0781 0813 0802 0801 0803 0796
Estonia (EE) 0823 0827 0823 0847 0866 0826 0833 0823 0890
Finland (FI) 0867 0864 0866 0835 0862 0870 0878 0867 0853
France (FR) 0739 0723 0735 0749 0771 0741 0762 0739 0799
Germany (DE) 0673 0658 0666 0695 0656 0684 0677 0673 0688
Hungary (HU) 0742 0746 0740 0660 0738 0755 0735 0742 0696
Iceland (IS) 0664 0674 0666 0694 0678 0673 0672 0664 0716
Ireland (IE) 0679 0672 0676 0708 0677 0681 0688 0679 0712
Italy (IT) 0806 0799 0804 0833 0835 0806 0799 0806 0849
Latvia (LV) 0678 0691 0678 0704 0676 0686 0698 0678 0724
Netherlands (NL) 0752 0754 0750 0775 0769 0754 0746 0752 0787
Norway (NO) 0716 0694 0713 0658 0682 0720 0715 0716 0645
41
41
Poland (PL) 0903 0904 0904 0908 0902 0903 0899 0903 0904
Portugal (PT) 0741 0724 0736 0749 0773 0738 0755 0741 0785
Romania (RO) 0758 0740 0754 0709 0749 0755 0748 0758 0703
Russian Federation (RU) 0811 0802 0812 0843 0799 0807 0799 0811 0814
Slovakia (SK) 0777 0774 0776 0780 0811 0769 0786 0777 0808
Slovenia (SI) 0737 0725 0733 0674 0740 0747 0718 0737 0721
Spain (ES) 0734 0713 0732 0707 0793 0728 0753 0734 0774
Sweden (SE) 0813 0801 0809 0799 0784 0817 0823 0814 0800
Ukraine (UA) 0708 0714 0710 0715 0721 0708 0702 0708 0722
United Kingdom (GB) 0699 0719 0699 0686 0736 0695 0706 0699 0729
United States (US) 0710 0701 0711 0709 0722 0705 0716 0710 0723
Countries only in test data
European
Greece (GR) 0715 0670 0702 0725 0711 0713 0717 0715 0718
Lithuania (LT) 0767 0782 0767 0764 0768 0769 0775 0767 0778
Serbia (RS) 0736 0713 0730 0603- 0826 0720 0753 0736 0738
United Kingdom Liquidation set 0606 0621 0603 0620 0618 0610 0607 0607 0635
Non-European
China (CN) 0558 0570 0557 0572 0543 0554 0567 0558 0556
China Delisted companies 0529 0546 0519 0563 0740++++ 0542 0520 0529 0707+++
Significance AUC better than benchmark 00001 = ++++ 0001 = +++ 001 = ++ 01 = +
AUC worse than benchmark 00001 = ---- 0001 = --- 001 = -- 01 = - Models
Benchmark = The LR model estimated for all data with Zrsquorsquo-model (1983) variables Model 1 = The original Altman (1983) Zrsquorsquo-Score Model
Model 2 = The MDA model estimated for all data Model 3 = The LR model estimated for all data with year dummies
42
42
Model 4 = The LR model estimated for all data with size variables Model 5 = The LR model estimated for all data with age category dummies Model 6 = The LR model estimated for all data with industry dummies Model 7 = The LR model estimated for all data with country risk rank Model 8 = The LR model estimated for all data with all variables
43
43
Table 6 Differences of medians between non-failed and failed groups
Country WCTA RETA EBITTA BVETD AUC of
Z-Score
Austria (AT) 0448 0405 0126 0487 0788
Belgium (BE) 0223 0264 0077 0431 0760
Bosnia (BA) 0106 0249 0088 0580 0805
Bulgaria (BG) 0114 0291 0094 0436 0630
China (CN) 0068 0032 0016 0280 0570
China delisted data 0089 -0061 -0032 0083 0546
China ST data 0298 0293 0139 0468 0911
Colombia (CO) 0226 0235 0099 0705 0724
Croatia (HR) 0275 0335 0044 0274 0812
Czech Republic (CZ) 0404 0397 0069 0667 0813
Denmark (DK) 0267 0356 0046 0733 0798
Estonia (EE) 0331 0388 0113 1033 0827
Finland (FI) 0402 0606 0207 0907 0864
France (FR) 0140 0213 0065 0424 0723
Germany (DE) 0131 0136 0032 0262 0658
Greece (GR) 0171 0262 0049 0349 0670
Hungary (HU) 0175 0224 0052 0587 0746
Iceland (IS) 0246 0261 0051 0337 0674
Ireland (IE) 0181 0266 0039 0560 0672
Italy (IT) 0277 0164 0073 0207 0799
Latvia (LV) 0117 0120 0042 0254 0691
Lithuania (LT) 0246 0218 0051 0569 0782
Netherlands (NL) 0204 0253 0077 0432 0754
Norway (NO) 0157 0219 0115 0329 0694
Poland (PL) 1340 0920 0124 1351 0904
Portugal (PT) 0215 0200 0052 0318 0724
Romania (RO) 0222 0271 0056 0298 0740
Russian Federation (RU) 0350 0242 0069 0245 0802
Serbia (RS) 0120 0148 0045 0389 0713
Slovakia (SK) 0256 0184 0061 0431 0774
Slovenia (SI) 0111 0172 0035 0326 0725
Spain (ES) 0143 0143 0076 0285 0713
Sweden (SE) 0255 0346 0099 0663 0801
Ukraine (UA) 0204 0200 0031 0449 0714
United Kingdom (GB) 0211 0245 0033 0472 0719
UK Liquidation set 0156 0234 0031 0447 0621
United States (US) 0195 0378 0248 0722 0701
44
44
Average of column items 0245 0265 0073 0481 0740
Correlation with Z-Score AUC 0611 0681 0516 0574 1000
Legend WCTA = Working CapitalTotal Assets
RETA = Retained EarningsTotal Assets EBITTA = EBITTotal Assets
BVETD = Book Value of EquityTotal Liabilities SALTA = SalesTotal Assets
AUC = Area under the ROC curve Z-Score = Altman (1983) Z-Score in the test data
45
45
Table 7 Test data AUCs for different estimated country models Comparisons are with AUC of the LR model estimated for all data (benchmark)
Test data AUC for different models
Country Benchmark Model 1 Model 2 Model 3 Model 4 Model 5 Model 6 Model 7
Austria (AT) 0800 0782 0770- 0774 0829 0787 0707- 0764
Belgium (BE) 0772 0779 0780 0826 0776 0783 0781 0834
Bosnia (BA) 0862 0850 0832 0833 0838 0838 0820 0853
Bulgaria (BG) 0684 0785 0785 0785 0796 0794 0677 0707
China (CN) ST companies 0985 0984 0982 0980 0986 0986 0986 0989
Colombia (CO) 0726 0755 0754 0818+ 0789 0749 0774 0824+
Croatia (HR) 0844 0862 0858 0865 0853 0863 0847 0863
Czech Republic (CZ) 0811 0812 0812 0823 0830 0813 0818 0842
Denmark (DK) 0803 0806 0809 0833 0818 0804 0813 0843
Estonia (EE) 0823 0824 0839 0866 0874 0839 0847 0899
Finland (FI) 0867 0867 0870 0885 0868 0873 0879 0894
France (FR) 0739 0773 0799 0805 0826 0800 0810 0845
Germany (DE) 0673 0684 0685 0734 0704 0701 0690 0762
Hungary (HU) 0742 0736 0743 0788 0767 0765 0747 0820
Iceland (IS) 0664 0670 0671 0784+ 0683 0714 0708 0824+
Ireland (IE) 0679 0663 0666 0718 0661 0665 0680 0724
Italy (IT) 0806 0802 0810 0835 0839 0809 0816 0868
Latvia (LV) 0678 0690 0707 0745 0720 0711 0730 0771
Netherlands (NL) 0752 0752 0756 0768 0784 0760 0759 0807
Norway (NO) 0716 0741 0741 0803 0749 0744 0743 0814
Poland (PL) 0903 0891 0897 0915 0899 0896 0895 0913
Portugal (PT) 0741 0753 0757 0761 0780 0758 0765 0797
Romania (RO) 0758 0718 0773 0805 0757 0755 0753 0774
Russian Federation (RU) 0811 0808 0810 0854 0811 0811 0818 0862
Slovakia (SK) 0777 0773 0775 0782 0810 0761 0773 0807
46
46
Slovenia (SI) 0737 0703 0719 0704 0711 0739 0686 0698
Spain (ES) 0734 0755 0767 0768 0849 0766 0776 0858
Sweden (SE) 0813 0826 0829 0843 0831 0831 0892 0901
Ukraine (UA) 0708 0712 0712 0720 0742 0718 0718 0758
United Kingdom (GB) 0699 0708 0713 0718 0764 0714 0731 0785
United States (US) 0710 0689 0687 0686 0816+ 0689 0714 0816+
Average of AUC 0768 0773 0778 0801 0799 0782 0779 0823
Significance AUC better than benchmark 00001 = ++++ 0001 = +++ 001 = ++ 01 = +
AUC worse than benchmark 00001 = ---- 0001 = --- 001 = -- 01 = - Models
Benchmark = The LR model estimated for all data with Zrsquorsquo-model (1983) variables Model 1 = The MDA model estimated for country data
Model 2 = The LR model estimated for country data Model 3 = The LR model estimated for country data with year dummies
Model 4 = The LR model estimated for country data with size variables Model 5 = The LR model estimated for country data with age category dummies Model 6 = The LR model estimated for country data with industry dummies
Model 7 = The LR model estimated for country data with all variables
47
47
Appendices
Appendix 1 Medians of the Altman (1983) model (Z) variables by status and country
Non-failed Failed
Non-failed Failed
Non-failed Failed Non-failed Failed
Country WCTA
RETA
EBITTA
BVETD
Austria (AT) 0170 -0278 0260 -0145 0055 -0071 0465 -0022
Belgium (BE) 0136 -0087 0157 -0107 0052 -0025 0460 0029
Bosnia (BA) 0087 -0019 0148 -0101 0032 -0056 0580 0000
Bulgaria (BG) 0216 0102 0272 -0019 0075 -0019 0504 0068
China (CN) 0105 0037 0064 0032 0064 0048 0870 0590
China delisted data 0158 0069 0286 0347 0059 0091 0923 0840
China ST data 0106 -0192 0281 -0012 0052 -0087 0776 0308
Colombia (CO) 0244 0018 0282 0047 0104 0005 0940 0235
Croatia (HR) 0093 -0182 0130 -0205 0030 -0014 0274 0000
Czech Republic (CZ) 0196 -0208 0230 -0167 0050 -0019 0591 -0076
Denmark (DK) 0128 -0139 0306 -0050 0005 -0041 0758 0025
Estonia (EE) 0222 -0109 0455 0067 0050 -0063 1169 0136
Finland (FI) 0233 -0169 0359 -0247 0082 -0125 0744 -0163
France (FR) 0146 0006 0223 0010 0059 -0006 0501 0077
Germany (DE) 0307 0176 0150 0014 0069 0037 0335 0073
Greece (GR) 0127 -0044 0049 -0213 0039 -0010 0460 0111
Hungary (HU) 0135 -0040 0271 0047 0054 0002 0717 0130
Iceland (IS) 0051 -0195 0046 -0215 0051 0000 0196 -0141
Ireland (IE) 0198 0017 0383 0117 0029 -0010 0728 0168
Italy (IT) 0107 -0170 0077 -0087 0032 -0041 0178 -0029
Latvia (LV) 0102 -0015 0150 0030 0069 0027 0342 0088
48
48
Lithuania (LT) 0205 -0041 0273 0055 0054 0003 0686 0117
Netherlands (NL) 0204 0000 0303 0050 0065 -0012 0511 0079
Norway (NO) 0185 0028 0139 -0080 0068 -0047 0398 0069
Poland (PL) 0198 -1142 0258 -0662 0076 -0048 0850 -0501
Portugal (PT) 0164 -0051 0133 -0067 0028 -0024 0343 0025
Romania (RO) 0071 -0151 0158 -0113 0041 -0015 0250 -0048
Russian Federation (RU) 0088 -0262 0106 -0136 0043 -0026 0194 -0051
Serbia (RS) 0093 -0027 0129 -0019 0027 -0018 0389 0000
Slovakia (SK) 0137 -0119 0185 0001 0060 -0001 0496 0065
Slovenia (SI) 0109 -0002 0215 0043 0039 0004 0434 0108
Spain (ES) 0117 -0026 0139 -0004 0029 -0047 0336 0051
Sweden (SE) 0266 0011 0357 0011 0058 -0041 0749 0086
Ukraine (UA) 0053 -0151 0034 -0166 0003 -0028 0442 -0007
United Kingdom (GB) 0179 -0032 0294 0049 0031 -0002 0579 0107
UK Liquidation set 0179 0023 0294 0060 0031 0000 0579 0132
United States (US) 0164 -0031 0374 -0004 0003 -0245 0800 0078
Average of medianssect 0153 -0092 0213 -0050 0048 -0025 0555 0075
Legend WCTA = Working CapitalTotal Assets
RETA = Retained EarningsTotal Assets EBITTA = EBITTotal assets
BVETD = Book Value of EquityTotal Liabilities sect = Because the two datasets for non-failed UK firms are identical the non-failed medians are used only once in the calculation of the averages

36
36
Table 3 Descriptive statistics (all data)
WCTA RETA EBITTA BVETD
Statistic Non-failed Failed Non-failed Failed
Non-failed Failed
Non-failed Failed
Median 0152 -0059 0189 -0024 0041 -0020 0451 0025
Mean 0147 -0213 0188 -0317 0055 -0108 3594 0703
Standard deviation 0442 0604 0509 0767 0227 0296 11499 5712
Upper quartile 0420 0142 0476 0087 0131 0042 1548 0215
Lower quartile -0040 -0440 0011 -0450 -0008 -0208 0100 -0240
Maximum 0956 0956 0958 0958 0785 0785 68606 68606
Minimum -1637 -1637 -2453 -2453 -0828 -0828 -0649 -0649
Legend WCTA = Working CapitalTotal Assets
RETA = Retained EarningsTotal Assets EBITTA = EBITTotal Assets
BVETD = Book Value of EquityTotal Liabilities SALTA = SalesTotal Assets
37
37
Table 4 The coefficients of the different models estimated for all data
Coefficients for different statistical models
Variable Zrsquo-Score
Model 1
Model 2
Model 3 Model 4
Model 5
Model 6
Model 7 Model 8
Constant 325 -0042 0035 0207 -13466 0007 0048 0049 -13302
WCTA 656 -0561 -0495 -0483 -0441 -0487 -0540 -0496 -0459
RETA 326 -0724 -0862 -0891 -1146 -0846 -0859 -0863 -1160
EBITTA 672 -1791 -1721 -1790 -1619 -1757 -1695 -1717 -1682
BVETD 105 -0021 -0017 -0016 -0012 -0017 -0016 -0017 -0013
Year dummies
Year 2008 -0055 -0034
Year 2009 -0179 -0150
Year 2010 -0666 -0631
Size variables Total assets (log)
1830
1837
Total assets squared (log)
-0061
-0061
Age dummies
Less than 6 years 0135 0186
Over 12 years -0058 -0099
Country risk SP Country rating rank
-0003 -0014
Industry dummies
Restaurants and hotels -0653 -0628
Construction 0445 0365
Whole sale and retailing -0112 -0157
Agriculture -0180 -0176
Manufacturing 0139 0095
Energy and water production -0454 -0472
Information technology -0913 -0915
Significance
38
38
Coefficients are statistically significant at 00001
Models
Zrsquo-Score = Original Altman (1983) Zrsquo-Score Model coefficients Model 1 = The MDA model
Model 2 = The LR model Model 3 = The LR model estimated for all data with year dummies
Model 4 = The LR model estimated for all data with size variables Model 5 = The LR model estimated for all data with age category dummies Model 6 = The LR model estimated for all data with industry dummies Model 7 = The LR model estimated for all data with country risk rank Model 8 = The LR model estimated for all data with all variables
39
39
40
40
Table 5 Test data AUCs for different countries based on all data model versions Comparisons are with AUC of the LR model estimated for all data (benchmark)
Test data AUC for different models
Country Benchmark Model 1 Model 2 Model 3 Model 4 Model 5 Model 6 Model 7 Model 8
All Data 0748 0743---- 0745---- 0752++++ 0760++++ 0748+++ 0751++++ 0749++++ 0771++++
Countries with estimation data
Austria (AT) 0800 0788 0797 0805 0818+ 0814+ 0782 0800 0819
Belgium (BE) 0772 0760 0770 0777 0747 0777 0765 0772 0758
Bosnia (BA) 0862 0805 0857 0776 0863 0847 0855 0862 0784
Bulgaria (BG) 0684 0630 0680 0654 0691 0680 0659 0684 0632
China ST companies 0985 0911---- 0983 0958- 0977 0978 0987 0985 0968
Colombia (CO) 0726 0724 0727 0715 0758 0728 0726 0726 0757
Croatia (HR) 0844 0812 0839 0803 0837 0835 0832 0844 0801
Czech Republic (CZ) 0811 0813 0811 0819 0828 0807 0820 0811 0838
Denmark (DK) 0803 0798 0800 0781 0813 0802 0801 0803 0796
Estonia (EE) 0823 0827 0823 0847 0866 0826 0833 0823 0890
Finland (FI) 0867 0864 0866 0835 0862 0870 0878 0867 0853
France (FR) 0739 0723 0735 0749 0771 0741 0762 0739 0799
Germany (DE) 0673 0658 0666 0695 0656 0684 0677 0673 0688
Hungary (HU) 0742 0746 0740 0660 0738 0755 0735 0742 0696
Iceland (IS) 0664 0674 0666 0694 0678 0673 0672 0664 0716
Ireland (IE) 0679 0672 0676 0708 0677 0681 0688 0679 0712
Italy (IT) 0806 0799 0804 0833 0835 0806 0799 0806 0849
Latvia (LV) 0678 0691 0678 0704 0676 0686 0698 0678 0724
Netherlands (NL) 0752 0754 0750 0775 0769 0754 0746 0752 0787
Norway (NO) 0716 0694 0713 0658 0682 0720 0715 0716 0645
41
41
Poland (PL) 0903 0904 0904 0908 0902 0903 0899 0903 0904
Portugal (PT) 0741 0724 0736 0749 0773 0738 0755 0741 0785
Romania (RO) 0758 0740 0754 0709 0749 0755 0748 0758 0703
Russian Federation (RU) 0811 0802 0812 0843 0799 0807 0799 0811 0814
Slovakia (SK) 0777 0774 0776 0780 0811 0769 0786 0777 0808
Slovenia (SI) 0737 0725 0733 0674 0740 0747 0718 0737 0721
Spain (ES) 0734 0713 0732 0707 0793 0728 0753 0734 0774
Sweden (SE) 0813 0801 0809 0799 0784 0817 0823 0814 0800
Ukraine (UA) 0708 0714 0710 0715 0721 0708 0702 0708 0722
United Kingdom (GB) 0699 0719 0699 0686 0736 0695 0706 0699 0729
United States (US) 0710 0701 0711 0709 0722 0705 0716 0710 0723
Countries only in test data
European
Greece (GR) 0715 0670 0702 0725 0711 0713 0717 0715 0718
Lithuania (LT) 0767 0782 0767 0764 0768 0769 0775 0767 0778
Serbia (RS) 0736 0713 0730 0603- 0826 0720 0753 0736 0738
United Kingdom Liquidation set 0606 0621 0603 0620 0618 0610 0607 0607 0635
Non-European
China (CN) 0558 0570 0557 0572 0543 0554 0567 0558 0556
China Delisted companies 0529 0546 0519 0563 0740++++ 0542 0520 0529 0707+++
Significance AUC better than benchmark 00001 = ++++ 0001 = +++ 001 = ++ 01 = +
AUC worse than benchmark 00001 = ---- 0001 = --- 001 = -- 01 = - Models
Benchmark = The LR model estimated for all data with Zrsquorsquo-model (1983) variables Model 1 = The original Altman (1983) Zrsquorsquo-Score Model
Model 2 = The MDA model estimated for all data Model 3 = The LR model estimated for all data with year dummies
42
42
Model 4 = The LR model estimated for all data with size variables Model 5 = The LR model estimated for all data with age category dummies Model 6 = The LR model estimated for all data with industry dummies Model 7 = The LR model estimated for all data with country risk rank Model 8 = The LR model estimated for all data with all variables
43
43
Table 6 Differences of medians between non-failed and failed groups
Country WCTA RETA EBITTA BVETD AUC of
Z-Score
Austria (AT) 0448 0405 0126 0487 0788
Belgium (BE) 0223 0264 0077 0431 0760
Bosnia (BA) 0106 0249 0088 0580 0805
Bulgaria (BG) 0114 0291 0094 0436 0630
China (CN) 0068 0032 0016 0280 0570
China delisted data 0089 -0061 -0032 0083 0546
China ST data 0298 0293 0139 0468 0911
Colombia (CO) 0226 0235 0099 0705 0724
Croatia (HR) 0275 0335 0044 0274 0812
Czech Republic (CZ) 0404 0397 0069 0667 0813
Denmark (DK) 0267 0356 0046 0733 0798
Estonia (EE) 0331 0388 0113 1033 0827
Finland (FI) 0402 0606 0207 0907 0864
France (FR) 0140 0213 0065 0424 0723
Germany (DE) 0131 0136 0032 0262 0658
Greece (GR) 0171 0262 0049 0349 0670
Hungary (HU) 0175 0224 0052 0587 0746
Iceland (IS) 0246 0261 0051 0337 0674
Ireland (IE) 0181 0266 0039 0560 0672
Italy (IT) 0277 0164 0073 0207 0799
Latvia (LV) 0117 0120 0042 0254 0691
Lithuania (LT) 0246 0218 0051 0569 0782
Netherlands (NL) 0204 0253 0077 0432 0754
Norway (NO) 0157 0219 0115 0329 0694
Poland (PL) 1340 0920 0124 1351 0904
Portugal (PT) 0215 0200 0052 0318 0724
Romania (RO) 0222 0271 0056 0298 0740
Russian Federation (RU) 0350 0242 0069 0245 0802
Serbia (RS) 0120 0148 0045 0389 0713
Slovakia (SK) 0256 0184 0061 0431 0774
Slovenia (SI) 0111 0172 0035 0326 0725
Spain (ES) 0143 0143 0076 0285 0713
Sweden (SE) 0255 0346 0099 0663 0801
Ukraine (UA) 0204 0200 0031 0449 0714
United Kingdom (GB) 0211 0245 0033 0472 0719
UK Liquidation set 0156 0234 0031 0447 0621
United States (US) 0195 0378 0248 0722 0701
44
44
Average of column items 0245 0265 0073 0481 0740
Correlation with Z-Score AUC 0611 0681 0516 0574 1000
Legend WCTA = Working CapitalTotal Assets
RETA = Retained EarningsTotal Assets EBITTA = EBITTotal Assets
BVETD = Book Value of EquityTotal Liabilities SALTA = SalesTotal Assets
AUC = Area under the ROC curve Z-Score = Altman (1983) Z-Score in the test data
45
45
Table 7 Test data AUCs for different estimated country models Comparisons are with AUC of the LR model estimated for all data (benchmark)
Test data AUC for different models
Country Benchmark Model 1 Model 2 Model 3 Model 4 Model 5 Model 6 Model 7
Austria (AT) 0800 0782 0770- 0774 0829 0787 0707- 0764
Belgium (BE) 0772 0779 0780 0826 0776 0783 0781 0834
Bosnia (BA) 0862 0850 0832 0833 0838 0838 0820 0853
Bulgaria (BG) 0684 0785 0785 0785 0796 0794 0677 0707
China (CN) ST companies 0985 0984 0982 0980 0986 0986 0986 0989
Colombia (CO) 0726 0755 0754 0818+ 0789 0749 0774 0824+
Croatia (HR) 0844 0862 0858 0865 0853 0863 0847 0863
Czech Republic (CZ) 0811 0812 0812 0823 0830 0813 0818 0842
Denmark (DK) 0803 0806 0809 0833 0818 0804 0813 0843
Estonia (EE) 0823 0824 0839 0866 0874 0839 0847 0899
Finland (FI) 0867 0867 0870 0885 0868 0873 0879 0894
France (FR) 0739 0773 0799 0805 0826 0800 0810 0845
Germany (DE) 0673 0684 0685 0734 0704 0701 0690 0762
Hungary (HU) 0742 0736 0743 0788 0767 0765 0747 0820
Iceland (IS) 0664 0670 0671 0784+ 0683 0714 0708 0824+
Ireland (IE) 0679 0663 0666 0718 0661 0665 0680 0724
Italy (IT) 0806 0802 0810 0835 0839 0809 0816 0868
Latvia (LV) 0678 0690 0707 0745 0720 0711 0730 0771
Netherlands (NL) 0752 0752 0756 0768 0784 0760 0759 0807
Norway (NO) 0716 0741 0741 0803 0749 0744 0743 0814
Poland (PL) 0903 0891 0897 0915 0899 0896 0895 0913
Portugal (PT) 0741 0753 0757 0761 0780 0758 0765 0797
Romania (RO) 0758 0718 0773 0805 0757 0755 0753 0774
Russian Federation (RU) 0811 0808 0810 0854 0811 0811 0818 0862
Slovakia (SK) 0777 0773 0775 0782 0810 0761 0773 0807
46
46
Slovenia (SI) 0737 0703 0719 0704 0711 0739 0686 0698
Spain (ES) 0734 0755 0767 0768 0849 0766 0776 0858
Sweden (SE) 0813 0826 0829 0843 0831 0831 0892 0901
Ukraine (UA) 0708 0712 0712 0720 0742 0718 0718 0758
United Kingdom (GB) 0699 0708 0713 0718 0764 0714 0731 0785
United States (US) 0710 0689 0687 0686 0816+ 0689 0714 0816+
Average of AUC 0768 0773 0778 0801 0799 0782 0779 0823
Significance AUC better than benchmark 00001 = ++++ 0001 = +++ 001 = ++ 01 = +
AUC worse than benchmark 00001 = ---- 0001 = --- 001 = -- 01 = - Models
Benchmark = The LR model estimated for all data with Zrsquorsquo-model (1983) variables Model 1 = The MDA model estimated for country data
Model 2 = The LR model estimated for country data Model 3 = The LR model estimated for country data with year dummies
Model 4 = The LR model estimated for country data with size variables Model 5 = The LR model estimated for country data with age category dummies Model 6 = The LR model estimated for country data with industry dummies
Model 7 = The LR model estimated for country data with all variables
47
47
Appendices
Appendix 1 Medians of the Altman (1983) model (Z) variables by status and country
Non-failed Failed
Non-failed Failed
Non-failed Failed Non-failed Failed
Country WCTA
RETA
EBITTA
BVETD
Austria (AT) 0170 -0278 0260 -0145 0055 -0071 0465 -0022
Belgium (BE) 0136 -0087 0157 -0107 0052 -0025 0460 0029
Bosnia (BA) 0087 -0019 0148 -0101 0032 -0056 0580 0000
Bulgaria (BG) 0216 0102 0272 -0019 0075 -0019 0504 0068
China (CN) 0105 0037 0064 0032 0064 0048 0870 0590
China delisted data 0158 0069 0286 0347 0059 0091 0923 0840
China ST data 0106 -0192 0281 -0012 0052 -0087 0776 0308
Colombia (CO) 0244 0018 0282 0047 0104 0005 0940 0235
Croatia (HR) 0093 -0182 0130 -0205 0030 -0014 0274 0000
Czech Republic (CZ) 0196 -0208 0230 -0167 0050 -0019 0591 -0076
Denmark (DK) 0128 -0139 0306 -0050 0005 -0041 0758 0025
Estonia (EE) 0222 -0109 0455 0067 0050 -0063 1169 0136
Finland (FI) 0233 -0169 0359 -0247 0082 -0125 0744 -0163
France (FR) 0146 0006 0223 0010 0059 -0006 0501 0077
Germany (DE) 0307 0176 0150 0014 0069 0037 0335 0073
Greece (GR) 0127 -0044 0049 -0213 0039 -0010 0460 0111
Hungary (HU) 0135 -0040 0271 0047 0054 0002 0717 0130
Iceland (IS) 0051 -0195 0046 -0215 0051 0000 0196 -0141
Ireland (IE) 0198 0017 0383 0117 0029 -0010 0728 0168
Italy (IT) 0107 -0170 0077 -0087 0032 -0041 0178 -0029
Latvia (LV) 0102 -0015 0150 0030 0069 0027 0342 0088
48
48
Lithuania (LT) 0205 -0041 0273 0055 0054 0003 0686 0117
Netherlands (NL) 0204 0000 0303 0050 0065 -0012 0511 0079
Norway (NO) 0185 0028 0139 -0080 0068 -0047 0398 0069
Poland (PL) 0198 -1142 0258 -0662 0076 -0048 0850 -0501
Portugal (PT) 0164 -0051 0133 -0067 0028 -0024 0343 0025
Romania (RO) 0071 -0151 0158 -0113 0041 -0015 0250 -0048
Russian Federation (RU) 0088 -0262 0106 -0136 0043 -0026 0194 -0051
Serbia (RS) 0093 -0027 0129 -0019 0027 -0018 0389 0000
Slovakia (SK) 0137 -0119 0185 0001 0060 -0001 0496 0065
Slovenia (SI) 0109 -0002 0215 0043 0039 0004 0434 0108
Spain (ES) 0117 -0026 0139 -0004 0029 -0047 0336 0051
Sweden (SE) 0266 0011 0357 0011 0058 -0041 0749 0086
Ukraine (UA) 0053 -0151 0034 -0166 0003 -0028 0442 -0007
United Kingdom (GB) 0179 -0032 0294 0049 0031 -0002 0579 0107
UK Liquidation set 0179 0023 0294 0060 0031 0000 0579 0132
United States (US) 0164 -0031 0374 -0004 0003 -0245 0800 0078
Average of medianssect 0153 -0092 0213 -0050 0048 -0025 0555 0075
Legend WCTA = Working CapitalTotal Assets
RETA = Retained EarningsTotal Assets EBITTA = EBITTotal assets
BVETD = Book Value of EquityTotal Liabilities sect = Because the two datasets for non-failed UK firms are identical the non-failed medians are used only once in the calculation of the averages

37
37
Table 4 The coefficients of the different models estimated for all data
Coefficients for different statistical models
Variable Zrsquo-Score
Model 1
Model 2
Model 3 Model 4
Model 5
Model 6
Model 7 Model 8
Constant 325 -0042 0035 0207 -13466 0007 0048 0049 -13302
WCTA 656 -0561 -0495 -0483 -0441 -0487 -0540 -0496 -0459
RETA 326 -0724 -0862 -0891 -1146 -0846 -0859 -0863 -1160
EBITTA 672 -1791 -1721 -1790 -1619 -1757 -1695 -1717 -1682
BVETD 105 -0021 -0017 -0016 -0012 -0017 -0016 -0017 -0013
Year dummies
Year 2008 -0055 -0034
Year 2009 -0179 -0150
Year 2010 -0666 -0631
Size variables Total assets (log)
1830
1837
Total assets squared (log)
-0061
-0061
Age dummies
Less than 6 years 0135 0186
Over 12 years -0058 -0099
Country risk SP Country rating rank
-0003 -0014
Industry dummies
Restaurants and hotels -0653 -0628
Construction 0445 0365
Whole sale and retailing -0112 -0157
Agriculture -0180 -0176
Manufacturing 0139 0095
Energy and water production -0454 -0472
Information technology -0913 -0915
Significance
38
38
Coefficients are statistically significant at 00001
Models
Zrsquo-Score = Original Altman (1983) Zrsquo-Score Model coefficients Model 1 = The MDA model
Model 2 = The LR model Model 3 = The LR model estimated for all data with year dummies
Model 4 = The LR model estimated for all data with size variables Model 5 = The LR model estimated for all data with age category dummies Model 6 = The LR model estimated for all data with industry dummies Model 7 = The LR model estimated for all data with country risk rank Model 8 = The LR model estimated for all data with all variables
39
39
40
40
Table 5 Test data AUCs for different countries based on all data model versions Comparisons are with AUC of the LR model estimated for all data (benchmark)
Test data AUC for different models
Country Benchmark Model 1 Model 2 Model 3 Model 4 Model 5 Model 6 Model 7 Model 8
All Data 0748 0743---- 0745---- 0752++++ 0760++++ 0748+++ 0751++++ 0749++++ 0771++++
Countries with estimation data
Austria (AT) 0800 0788 0797 0805 0818+ 0814+ 0782 0800 0819
Belgium (BE) 0772 0760 0770 0777 0747 0777 0765 0772 0758
Bosnia (BA) 0862 0805 0857 0776 0863 0847 0855 0862 0784
Bulgaria (BG) 0684 0630 0680 0654 0691 0680 0659 0684 0632
China ST companies 0985 0911---- 0983 0958- 0977 0978 0987 0985 0968
Colombia (CO) 0726 0724 0727 0715 0758 0728 0726 0726 0757
Croatia (HR) 0844 0812 0839 0803 0837 0835 0832 0844 0801
Czech Republic (CZ) 0811 0813 0811 0819 0828 0807 0820 0811 0838
Denmark (DK) 0803 0798 0800 0781 0813 0802 0801 0803 0796
Estonia (EE) 0823 0827 0823 0847 0866 0826 0833 0823 0890
Finland (FI) 0867 0864 0866 0835 0862 0870 0878 0867 0853
France (FR) 0739 0723 0735 0749 0771 0741 0762 0739 0799
Germany (DE) 0673 0658 0666 0695 0656 0684 0677 0673 0688
Hungary (HU) 0742 0746 0740 0660 0738 0755 0735 0742 0696
Iceland (IS) 0664 0674 0666 0694 0678 0673 0672 0664 0716
Ireland (IE) 0679 0672 0676 0708 0677 0681 0688 0679 0712
Italy (IT) 0806 0799 0804 0833 0835 0806 0799 0806 0849
Latvia (LV) 0678 0691 0678 0704 0676 0686 0698 0678 0724
Netherlands (NL) 0752 0754 0750 0775 0769 0754 0746 0752 0787
Norway (NO) 0716 0694 0713 0658 0682 0720 0715 0716 0645
41
41
Poland (PL) 0903 0904 0904 0908 0902 0903 0899 0903 0904
Portugal (PT) 0741 0724 0736 0749 0773 0738 0755 0741 0785
Romania (RO) 0758 0740 0754 0709 0749 0755 0748 0758 0703
Russian Federation (RU) 0811 0802 0812 0843 0799 0807 0799 0811 0814
Slovakia (SK) 0777 0774 0776 0780 0811 0769 0786 0777 0808
Slovenia (SI) 0737 0725 0733 0674 0740 0747 0718 0737 0721
Spain (ES) 0734 0713 0732 0707 0793 0728 0753 0734 0774
Sweden (SE) 0813 0801 0809 0799 0784 0817 0823 0814 0800
Ukraine (UA) 0708 0714 0710 0715 0721 0708 0702 0708 0722
United Kingdom (GB) 0699 0719 0699 0686 0736 0695 0706 0699 0729
United States (US) 0710 0701 0711 0709 0722 0705 0716 0710 0723
Countries only in test data
European
Greece (GR) 0715 0670 0702 0725 0711 0713 0717 0715 0718
Lithuania (LT) 0767 0782 0767 0764 0768 0769 0775 0767 0778
Serbia (RS) 0736 0713 0730 0603- 0826 0720 0753 0736 0738
United Kingdom Liquidation set 0606 0621 0603 0620 0618 0610 0607 0607 0635
Non-European
China (CN) 0558 0570 0557 0572 0543 0554 0567 0558 0556
China Delisted companies 0529 0546 0519 0563 0740++++ 0542 0520 0529 0707+++
Significance AUC better than benchmark 00001 = ++++ 0001 = +++ 001 = ++ 01 = +
AUC worse than benchmark 00001 = ---- 0001 = --- 001 = -- 01 = - Models
Benchmark = The LR model estimated for all data with Zrsquorsquo-model (1983) variables Model 1 = The original Altman (1983) Zrsquorsquo-Score Model
Model 2 = The MDA model estimated for all data Model 3 = The LR model estimated for all data with year dummies
42
42
Model 4 = The LR model estimated for all data with size variables Model 5 = The LR model estimated for all data with age category dummies Model 6 = The LR model estimated for all data with industry dummies Model 7 = The LR model estimated for all data with country risk rank Model 8 = The LR model estimated for all data with all variables
43
43
Table 6 Differences of medians between non-failed and failed groups
Country WCTA RETA EBITTA BVETD AUC of
Z-Score
Austria (AT) 0448 0405 0126 0487 0788
Belgium (BE) 0223 0264 0077 0431 0760
Bosnia (BA) 0106 0249 0088 0580 0805
Bulgaria (BG) 0114 0291 0094 0436 0630
China (CN) 0068 0032 0016 0280 0570
China delisted data 0089 -0061 -0032 0083 0546
China ST data 0298 0293 0139 0468 0911
Colombia (CO) 0226 0235 0099 0705 0724
Croatia (HR) 0275 0335 0044 0274 0812
Czech Republic (CZ) 0404 0397 0069 0667 0813
Denmark (DK) 0267 0356 0046 0733 0798
Estonia (EE) 0331 0388 0113 1033 0827
Finland (FI) 0402 0606 0207 0907 0864
France (FR) 0140 0213 0065 0424 0723
Germany (DE) 0131 0136 0032 0262 0658
Greece (GR) 0171 0262 0049 0349 0670
Hungary (HU) 0175 0224 0052 0587 0746
Iceland (IS) 0246 0261 0051 0337 0674
Ireland (IE) 0181 0266 0039 0560 0672
Italy (IT) 0277 0164 0073 0207 0799
Latvia (LV) 0117 0120 0042 0254 0691
Lithuania (LT) 0246 0218 0051 0569 0782
Netherlands (NL) 0204 0253 0077 0432 0754
Norway (NO) 0157 0219 0115 0329 0694
Poland (PL) 1340 0920 0124 1351 0904
Portugal (PT) 0215 0200 0052 0318 0724
Romania (RO) 0222 0271 0056 0298 0740
Russian Federation (RU) 0350 0242 0069 0245 0802
Serbia (RS) 0120 0148 0045 0389 0713
Slovakia (SK) 0256 0184 0061 0431 0774
Slovenia (SI) 0111 0172 0035 0326 0725
Spain (ES) 0143 0143 0076 0285 0713
Sweden (SE) 0255 0346 0099 0663 0801
Ukraine (UA) 0204 0200 0031 0449 0714
United Kingdom (GB) 0211 0245 0033 0472 0719
UK Liquidation set 0156 0234 0031 0447 0621
United States (US) 0195 0378 0248 0722 0701
44
44
Average of column items 0245 0265 0073 0481 0740
Correlation with Z-Score AUC 0611 0681 0516 0574 1000
Legend WCTA = Working CapitalTotal Assets
RETA = Retained EarningsTotal Assets EBITTA = EBITTotal Assets
BVETD = Book Value of EquityTotal Liabilities SALTA = SalesTotal Assets
AUC = Area under the ROC curve Z-Score = Altman (1983) Z-Score in the test data
45
45
Table 7 Test data AUCs for different estimated country models Comparisons are with AUC of the LR model estimated for all data (benchmark)
Test data AUC for different models
Country Benchmark Model 1 Model 2 Model 3 Model 4 Model 5 Model 6 Model 7
Austria (AT) 0800 0782 0770- 0774 0829 0787 0707- 0764
Belgium (BE) 0772 0779 0780 0826 0776 0783 0781 0834
Bosnia (BA) 0862 0850 0832 0833 0838 0838 0820 0853
Bulgaria (BG) 0684 0785 0785 0785 0796 0794 0677 0707
China (CN) ST companies 0985 0984 0982 0980 0986 0986 0986 0989
Colombia (CO) 0726 0755 0754 0818+ 0789 0749 0774 0824+
Croatia (HR) 0844 0862 0858 0865 0853 0863 0847 0863
Czech Republic (CZ) 0811 0812 0812 0823 0830 0813 0818 0842
Denmark (DK) 0803 0806 0809 0833 0818 0804 0813 0843
Estonia (EE) 0823 0824 0839 0866 0874 0839 0847 0899
Finland (FI) 0867 0867 0870 0885 0868 0873 0879 0894
France (FR) 0739 0773 0799 0805 0826 0800 0810 0845
Germany (DE) 0673 0684 0685 0734 0704 0701 0690 0762
Hungary (HU) 0742 0736 0743 0788 0767 0765 0747 0820
Iceland (IS) 0664 0670 0671 0784+ 0683 0714 0708 0824+
Ireland (IE) 0679 0663 0666 0718 0661 0665 0680 0724
Italy (IT) 0806 0802 0810 0835 0839 0809 0816 0868
Latvia (LV) 0678 0690 0707 0745 0720 0711 0730 0771
Netherlands (NL) 0752 0752 0756 0768 0784 0760 0759 0807
Norway (NO) 0716 0741 0741 0803 0749 0744 0743 0814
Poland (PL) 0903 0891 0897 0915 0899 0896 0895 0913
Portugal (PT) 0741 0753 0757 0761 0780 0758 0765 0797
Romania (RO) 0758 0718 0773 0805 0757 0755 0753 0774
Russian Federation (RU) 0811 0808 0810 0854 0811 0811 0818 0862
Slovakia (SK) 0777 0773 0775 0782 0810 0761 0773 0807
46
46
Slovenia (SI) 0737 0703 0719 0704 0711 0739 0686 0698
Spain (ES) 0734 0755 0767 0768 0849 0766 0776 0858
Sweden (SE) 0813 0826 0829 0843 0831 0831 0892 0901
Ukraine (UA) 0708 0712 0712 0720 0742 0718 0718 0758
United Kingdom (GB) 0699 0708 0713 0718 0764 0714 0731 0785
United States (US) 0710 0689 0687 0686 0816+ 0689 0714 0816+
Average of AUC 0768 0773 0778 0801 0799 0782 0779 0823
Significance AUC better than benchmark 00001 = ++++ 0001 = +++ 001 = ++ 01 = +
AUC worse than benchmark 00001 = ---- 0001 = --- 001 = -- 01 = - Models
Benchmark = The LR model estimated for all data with Zrsquorsquo-model (1983) variables Model 1 = The MDA model estimated for country data
Model 2 = The LR model estimated for country data Model 3 = The LR model estimated for country data with year dummies
Model 4 = The LR model estimated for country data with size variables Model 5 = The LR model estimated for country data with age category dummies Model 6 = The LR model estimated for country data with industry dummies
Model 7 = The LR model estimated for country data with all variables
47
47
Appendices
Appendix 1 Medians of the Altman (1983) model (Z) variables by status and country
Non-failed Failed
Non-failed Failed
Non-failed Failed Non-failed Failed
Country WCTA
RETA
EBITTA
BVETD
Austria (AT) 0170 -0278 0260 -0145 0055 -0071 0465 -0022
Belgium (BE) 0136 -0087 0157 -0107 0052 -0025 0460 0029
Bosnia (BA) 0087 -0019 0148 -0101 0032 -0056 0580 0000
Bulgaria (BG) 0216 0102 0272 -0019 0075 -0019 0504 0068
China (CN) 0105 0037 0064 0032 0064 0048 0870 0590
China delisted data 0158 0069 0286 0347 0059 0091 0923 0840
China ST data 0106 -0192 0281 -0012 0052 -0087 0776 0308
Colombia (CO) 0244 0018 0282 0047 0104 0005 0940 0235
Croatia (HR) 0093 -0182 0130 -0205 0030 -0014 0274 0000
Czech Republic (CZ) 0196 -0208 0230 -0167 0050 -0019 0591 -0076
Denmark (DK) 0128 -0139 0306 -0050 0005 -0041 0758 0025
Estonia (EE) 0222 -0109 0455 0067 0050 -0063 1169 0136
Finland (FI) 0233 -0169 0359 -0247 0082 -0125 0744 -0163
France (FR) 0146 0006 0223 0010 0059 -0006 0501 0077
Germany (DE) 0307 0176 0150 0014 0069 0037 0335 0073
Greece (GR) 0127 -0044 0049 -0213 0039 -0010 0460 0111
Hungary (HU) 0135 -0040 0271 0047 0054 0002 0717 0130
Iceland (IS) 0051 -0195 0046 -0215 0051 0000 0196 -0141
Ireland (IE) 0198 0017 0383 0117 0029 -0010 0728 0168
Italy (IT) 0107 -0170 0077 -0087 0032 -0041 0178 -0029
Latvia (LV) 0102 -0015 0150 0030 0069 0027 0342 0088
48
48
Lithuania (LT) 0205 -0041 0273 0055 0054 0003 0686 0117
Netherlands (NL) 0204 0000 0303 0050 0065 -0012 0511 0079
Norway (NO) 0185 0028 0139 -0080 0068 -0047 0398 0069
Poland (PL) 0198 -1142 0258 -0662 0076 -0048 0850 -0501
Portugal (PT) 0164 -0051 0133 -0067 0028 -0024 0343 0025
Romania (RO) 0071 -0151 0158 -0113 0041 -0015 0250 -0048
Russian Federation (RU) 0088 -0262 0106 -0136 0043 -0026 0194 -0051
Serbia (RS) 0093 -0027 0129 -0019 0027 -0018 0389 0000
Slovakia (SK) 0137 -0119 0185 0001 0060 -0001 0496 0065
Slovenia (SI) 0109 -0002 0215 0043 0039 0004 0434 0108
Spain (ES) 0117 -0026 0139 -0004 0029 -0047 0336 0051
Sweden (SE) 0266 0011 0357 0011 0058 -0041 0749 0086
Ukraine (UA) 0053 -0151 0034 -0166 0003 -0028 0442 -0007
United Kingdom (GB) 0179 -0032 0294 0049 0031 -0002 0579 0107
UK Liquidation set 0179 0023 0294 0060 0031 0000 0579 0132
United States (US) 0164 -0031 0374 -0004 0003 -0245 0800 0078
Average of medianssect 0153 -0092 0213 -0050 0048 -0025 0555 0075
Legend WCTA = Working CapitalTotal Assets
RETA = Retained EarningsTotal Assets EBITTA = EBITTotal assets
BVETD = Book Value of EquityTotal Liabilities sect = Because the two datasets for non-failed UK firms are identical the non-failed medians are used only once in the calculation of the averages

38
38
Coefficients are statistically significant at 00001
Models
Zrsquo-Score = Original Altman (1983) Zrsquo-Score Model coefficients Model 1 = The MDA model
Model 2 = The LR model Model 3 = The LR model estimated for all data with year dummies
Model 4 = The LR model estimated for all data with size variables Model 5 = The LR model estimated for all data with age category dummies Model 6 = The LR model estimated for all data with industry dummies Model 7 = The LR model estimated for all data with country risk rank Model 8 = The LR model estimated for all data with all variables
39
39
40
40
Table 5 Test data AUCs for different countries based on all data model versions Comparisons are with AUC of the LR model estimated for all data (benchmark)
Test data AUC for different models
Country Benchmark Model 1 Model 2 Model 3 Model 4 Model 5 Model 6 Model 7 Model 8
All Data 0748 0743---- 0745---- 0752++++ 0760++++ 0748+++ 0751++++ 0749++++ 0771++++
Countries with estimation data
Austria (AT) 0800 0788 0797 0805 0818+ 0814+ 0782 0800 0819
Belgium (BE) 0772 0760 0770 0777 0747 0777 0765 0772 0758
Bosnia (BA) 0862 0805 0857 0776 0863 0847 0855 0862 0784
Bulgaria (BG) 0684 0630 0680 0654 0691 0680 0659 0684 0632
China ST companies 0985 0911---- 0983 0958- 0977 0978 0987 0985 0968
Colombia (CO) 0726 0724 0727 0715 0758 0728 0726 0726 0757
Croatia (HR) 0844 0812 0839 0803 0837 0835 0832 0844 0801
Czech Republic (CZ) 0811 0813 0811 0819 0828 0807 0820 0811 0838
Denmark (DK) 0803 0798 0800 0781 0813 0802 0801 0803 0796
Estonia (EE) 0823 0827 0823 0847 0866 0826 0833 0823 0890
Finland (FI) 0867 0864 0866 0835 0862 0870 0878 0867 0853
France (FR) 0739 0723 0735 0749 0771 0741 0762 0739 0799
Germany (DE) 0673 0658 0666 0695 0656 0684 0677 0673 0688
Hungary (HU) 0742 0746 0740 0660 0738 0755 0735 0742 0696
Iceland (IS) 0664 0674 0666 0694 0678 0673 0672 0664 0716
Ireland (IE) 0679 0672 0676 0708 0677 0681 0688 0679 0712
Italy (IT) 0806 0799 0804 0833 0835 0806 0799 0806 0849
Latvia (LV) 0678 0691 0678 0704 0676 0686 0698 0678 0724
Netherlands (NL) 0752 0754 0750 0775 0769 0754 0746 0752 0787
Norway (NO) 0716 0694 0713 0658 0682 0720 0715 0716 0645
41
41
Poland (PL) 0903 0904 0904 0908 0902 0903 0899 0903 0904
Portugal (PT) 0741 0724 0736 0749 0773 0738 0755 0741 0785
Romania (RO) 0758 0740 0754 0709 0749 0755 0748 0758 0703
Russian Federation (RU) 0811 0802 0812 0843 0799 0807 0799 0811 0814
Slovakia (SK) 0777 0774 0776 0780 0811 0769 0786 0777 0808
Slovenia (SI) 0737 0725 0733 0674 0740 0747 0718 0737 0721
Spain (ES) 0734 0713 0732 0707 0793 0728 0753 0734 0774
Sweden (SE) 0813 0801 0809 0799 0784 0817 0823 0814 0800
Ukraine (UA) 0708 0714 0710 0715 0721 0708 0702 0708 0722
United Kingdom (GB) 0699 0719 0699 0686 0736 0695 0706 0699 0729
United States (US) 0710 0701 0711 0709 0722 0705 0716 0710 0723
Countries only in test data
European
Greece (GR) 0715 0670 0702 0725 0711 0713 0717 0715 0718
Lithuania (LT) 0767 0782 0767 0764 0768 0769 0775 0767 0778
Serbia (RS) 0736 0713 0730 0603- 0826 0720 0753 0736 0738
United Kingdom Liquidation set 0606 0621 0603 0620 0618 0610 0607 0607 0635
Non-European
China (CN) 0558 0570 0557 0572 0543 0554 0567 0558 0556
China Delisted companies 0529 0546 0519 0563 0740++++ 0542 0520 0529 0707+++
Significance AUC better than benchmark 00001 = ++++ 0001 = +++ 001 = ++ 01 = +
AUC worse than benchmark 00001 = ---- 0001 = --- 001 = -- 01 = - Models
Benchmark = The LR model estimated for all data with Zrsquorsquo-model (1983) variables Model 1 = The original Altman (1983) Zrsquorsquo-Score Model
Model 2 = The MDA model estimated for all data Model 3 = The LR model estimated for all data with year dummies
42
42
Model 4 = The LR model estimated for all data with size variables Model 5 = The LR model estimated for all data with age category dummies Model 6 = The LR model estimated for all data with industry dummies Model 7 = The LR model estimated for all data with country risk rank Model 8 = The LR model estimated for all data with all variables
43
43
Table 6 Differences of medians between non-failed and failed groups
Country WCTA RETA EBITTA BVETD AUC of
Z-Score
Austria (AT) 0448 0405 0126 0487 0788
Belgium (BE) 0223 0264 0077 0431 0760
Bosnia (BA) 0106 0249 0088 0580 0805
Bulgaria (BG) 0114 0291 0094 0436 0630
China (CN) 0068 0032 0016 0280 0570
China delisted data 0089 -0061 -0032 0083 0546
China ST data 0298 0293 0139 0468 0911
Colombia (CO) 0226 0235 0099 0705 0724
Croatia (HR) 0275 0335 0044 0274 0812
Czech Republic (CZ) 0404 0397 0069 0667 0813
Denmark (DK) 0267 0356 0046 0733 0798
Estonia (EE) 0331 0388 0113 1033 0827
Finland (FI) 0402 0606 0207 0907 0864
France (FR) 0140 0213 0065 0424 0723
Germany (DE) 0131 0136 0032 0262 0658
Greece (GR) 0171 0262 0049 0349 0670
Hungary (HU) 0175 0224 0052 0587 0746
Iceland (IS) 0246 0261 0051 0337 0674
Ireland (IE) 0181 0266 0039 0560 0672
Italy (IT) 0277 0164 0073 0207 0799
Latvia (LV) 0117 0120 0042 0254 0691
Lithuania (LT) 0246 0218 0051 0569 0782
Netherlands (NL) 0204 0253 0077 0432 0754
Norway (NO) 0157 0219 0115 0329 0694
Poland (PL) 1340 0920 0124 1351 0904
Portugal (PT) 0215 0200 0052 0318 0724
Romania (RO) 0222 0271 0056 0298 0740
Russian Federation (RU) 0350 0242 0069 0245 0802
Serbia (RS) 0120 0148 0045 0389 0713
Slovakia (SK) 0256 0184 0061 0431 0774
Slovenia (SI) 0111 0172 0035 0326 0725
Spain (ES) 0143 0143 0076 0285 0713
Sweden (SE) 0255 0346 0099 0663 0801
Ukraine (UA) 0204 0200 0031 0449 0714
United Kingdom (GB) 0211 0245 0033 0472 0719
UK Liquidation set 0156 0234 0031 0447 0621
United States (US) 0195 0378 0248 0722 0701
44
44
Average of column items 0245 0265 0073 0481 0740
Correlation with Z-Score AUC 0611 0681 0516 0574 1000
Legend WCTA = Working CapitalTotal Assets
RETA = Retained EarningsTotal Assets EBITTA = EBITTotal Assets
BVETD = Book Value of EquityTotal Liabilities SALTA = SalesTotal Assets
AUC = Area under the ROC curve Z-Score = Altman (1983) Z-Score in the test data
45
45
Table 7 Test data AUCs for different estimated country models Comparisons are with AUC of the LR model estimated for all data (benchmark)
Test data AUC for different models
Country Benchmark Model 1 Model 2 Model 3 Model 4 Model 5 Model 6 Model 7
Austria (AT) 0800 0782 0770- 0774 0829 0787 0707- 0764
Belgium (BE) 0772 0779 0780 0826 0776 0783 0781 0834
Bosnia (BA) 0862 0850 0832 0833 0838 0838 0820 0853
Bulgaria (BG) 0684 0785 0785 0785 0796 0794 0677 0707
China (CN) ST companies 0985 0984 0982 0980 0986 0986 0986 0989
Colombia (CO) 0726 0755 0754 0818+ 0789 0749 0774 0824+
Croatia (HR) 0844 0862 0858 0865 0853 0863 0847 0863
Czech Republic (CZ) 0811 0812 0812 0823 0830 0813 0818 0842
Denmark (DK) 0803 0806 0809 0833 0818 0804 0813 0843
Estonia (EE) 0823 0824 0839 0866 0874 0839 0847 0899
Finland (FI) 0867 0867 0870 0885 0868 0873 0879 0894
France (FR) 0739 0773 0799 0805 0826 0800 0810 0845
Germany (DE) 0673 0684 0685 0734 0704 0701 0690 0762
Hungary (HU) 0742 0736 0743 0788 0767 0765 0747 0820
Iceland (IS) 0664 0670 0671 0784+ 0683 0714 0708 0824+
Ireland (IE) 0679 0663 0666 0718 0661 0665 0680 0724
Italy (IT) 0806 0802 0810 0835 0839 0809 0816 0868
Latvia (LV) 0678 0690 0707 0745 0720 0711 0730 0771
Netherlands (NL) 0752 0752 0756 0768 0784 0760 0759 0807
Norway (NO) 0716 0741 0741 0803 0749 0744 0743 0814
Poland (PL) 0903 0891 0897 0915 0899 0896 0895 0913
Portugal (PT) 0741 0753 0757 0761 0780 0758 0765 0797
Romania (RO) 0758 0718 0773 0805 0757 0755 0753 0774
Russian Federation (RU) 0811 0808 0810 0854 0811 0811 0818 0862
Slovakia (SK) 0777 0773 0775 0782 0810 0761 0773 0807
46
46
Slovenia (SI) 0737 0703 0719 0704 0711 0739 0686 0698
Spain (ES) 0734 0755 0767 0768 0849 0766 0776 0858
Sweden (SE) 0813 0826 0829 0843 0831 0831 0892 0901
Ukraine (UA) 0708 0712 0712 0720 0742 0718 0718 0758
United Kingdom (GB) 0699 0708 0713 0718 0764 0714 0731 0785
United States (US) 0710 0689 0687 0686 0816+ 0689 0714 0816+
Average of AUC 0768 0773 0778 0801 0799 0782 0779 0823
Significance AUC better than benchmark 00001 = ++++ 0001 = +++ 001 = ++ 01 = +
AUC worse than benchmark 00001 = ---- 0001 = --- 001 = -- 01 = - Models
Benchmark = The LR model estimated for all data with Zrsquorsquo-model (1983) variables Model 1 = The MDA model estimated for country data
Model 2 = The LR model estimated for country data Model 3 = The LR model estimated for country data with year dummies
Model 4 = The LR model estimated for country data with size variables Model 5 = The LR model estimated for country data with age category dummies Model 6 = The LR model estimated for country data with industry dummies
Model 7 = The LR model estimated for country data with all variables
47
47
Appendices
Appendix 1 Medians of the Altman (1983) model (Z) variables by status and country
Non-failed Failed
Non-failed Failed
Non-failed Failed Non-failed Failed
Country WCTA
RETA
EBITTA
BVETD
Austria (AT) 0170 -0278 0260 -0145 0055 -0071 0465 -0022
Belgium (BE) 0136 -0087 0157 -0107 0052 -0025 0460 0029
Bosnia (BA) 0087 -0019 0148 -0101 0032 -0056 0580 0000
Bulgaria (BG) 0216 0102 0272 -0019 0075 -0019 0504 0068
China (CN) 0105 0037 0064 0032 0064 0048 0870 0590
China delisted data 0158 0069 0286 0347 0059 0091 0923 0840
China ST data 0106 -0192 0281 -0012 0052 -0087 0776 0308
Colombia (CO) 0244 0018 0282 0047 0104 0005 0940 0235
Croatia (HR) 0093 -0182 0130 -0205 0030 -0014 0274 0000
Czech Republic (CZ) 0196 -0208 0230 -0167 0050 -0019 0591 -0076
Denmark (DK) 0128 -0139 0306 -0050 0005 -0041 0758 0025
Estonia (EE) 0222 -0109 0455 0067 0050 -0063 1169 0136
Finland (FI) 0233 -0169 0359 -0247 0082 -0125 0744 -0163
France (FR) 0146 0006 0223 0010 0059 -0006 0501 0077
Germany (DE) 0307 0176 0150 0014 0069 0037 0335 0073
Greece (GR) 0127 -0044 0049 -0213 0039 -0010 0460 0111
Hungary (HU) 0135 -0040 0271 0047 0054 0002 0717 0130
Iceland (IS) 0051 -0195 0046 -0215 0051 0000 0196 -0141
Ireland (IE) 0198 0017 0383 0117 0029 -0010 0728 0168
Italy (IT) 0107 -0170 0077 -0087 0032 -0041 0178 -0029
Latvia (LV) 0102 -0015 0150 0030 0069 0027 0342 0088
48
48
Lithuania (LT) 0205 -0041 0273 0055 0054 0003 0686 0117
Netherlands (NL) 0204 0000 0303 0050 0065 -0012 0511 0079
Norway (NO) 0185 0028 0139 -0080 0068 -0047 0398 0069
Poland (PL) 0198 -1142 0258 -0662 0076 -0048 0850 -0501
Portugal (PT) 0164 -0051 0133 -0067 0028 -0024 0343 0025
Romania (RO) 0071 -0151 0158 -0113 0041 -0015 0250 -0048
Russian Federation (RU) 0088 -0262 0106 -0136 0043 -0026 0194 -0051
Serbia (RS) 0093 -0027 0129 -0019 0027 -0018 0389 0000
Slovakia (SK) 0137 -0119 0185 0001 0060 -0001 0496 0065
Slovenia (SI) 0109 -0002 0215 0043 0039 0004 0434 0108
Spain (ES) 0117 -0026 0139 -0004 0029 -0047 0336 0051
Sweden (SE) 0266 0011 0357 0011 0058 -0041 0749 0086
Ukraine (UA) 0053 -0151 0034 -0166 0003 -0028 0442 -0007
United Kingdom (GB) 0179 -0032 0294 0049 0031 -0002 0579 0107
UK Liquidation set 0179 0023 0294 0060 0031 0000 0579 0132
United States (US) 0164 -0031 0374 -0004 0003 -0245 0800 0078
Average of medianssect 0153 -0092 0213 -0050 0048 -0025 0555 0075
Legend WCTA = Working CapitalTotal Assets
RETA = Retained EarningsTotal Assets EBITTA = EBITTotal assets
BVETD = Book Value of EquityTotal Liabilities sect = Because the two datasets for non-failed UK firms are identical the non-failed medians are used only once in the calculation of the averages

39
39
40
40
Table 5 Test data AUCs for different countries based on all data model versions Comparisons are with AUC of the LR model estimated for all data (benchmark)
Test data AUC for different models
Country Benchmark Model 1 Model 2 Model 3 Model 4 Model 5 Model 6 Model 7 Model 8
All Data 0748 0743---- 0745---- 0752++++ 0760++++ 0748+++ 0751++++ 0749++++ 0771++++
Countries with estimation data
Austria (AT) 0800 0788 0797 0805 0818+ 0814+ 0782 0800 0819
Belgium (BE) 0772 0760 0770 0777 0747 0777 0765 0772 0758
Bosnia (BA) 0862 0805 0857 0776 0863 0847 0855 0862 0784
Bulgaria (BG) 0684 0630 0680 0654 0691 0680 0659 0684 0632
China ST companies 0985 0911---- 0983 0958- 0977 0978 0987 0985 0968
Colombia (CO) 0726 0724 0727 0715 0758 0728 0726 0726 0757
Croatia (HR) 0844 0812 0839 0803 0837 0835 0832 0844 0801
Czech Republic (CZ) 0811 0813 0811 0819 0828 0807 0820 0811 0838
Denmark (DK) 0803 0798 0800 0781 0813 0802 0801 0803 0796
Estonia (EE) 0823 0827 0823 0847 0866 0826 0833 0823 0890
Finland (FI) 0867 0864 0866 0835 0862 0870 0878 0867 0853
France (FR) 0739 0723 0735 0749 0771 0741 0762 0739 0799
Germany (DE) 0673 0658 0666 0695 0656 0684 0677 0673 0688
Hungary (HU) 0742 0746 0740 0660 0738 0755 0735 0742 0696
Iceland (IS) 0664 0674 0666 0694 0678 0673 0672 0664 0716
Ireland (IE) 0679 0672 0676 0708 0677 0681 0688 0679 0712
Italy (IT) 0806 0799 0804 0833 0835 0806 0799 0806 0849
Latvia (LV) 0678 0691 0678 0704 0676 0686 0698 0678 0724
Netherlands (NL) 0752 0754 0750 0775 0769 0754 0746 0752 0787
Norway (NO) 0716 0694 0713 0658 0682 0720 0715 0716 0645
41
41
Poland (PL) 0903 0904 0904 0908 0902 0903 0899 0903 0904
Portugal (PT) 0741 0724 0736 0749 0773 0738 0755 0741 0785
Romania (RO) 0758 0740 0754 0709 0749 0755 0748 0758 0703
Russian Federation (RU) 0811 0802 0812 0843 0799 0807 0799 0811 0814
Slovakia (SK) 0777 0774 0776 0780 0811 0769 0786 0777 0808
Slovenia (SI) 0737 0725 0733 0674 0740 0747 0718 0737 0721
Spain (ES) 0734 0713 0732 0707 0793 0728 0753 0734 0774
Sweden (SE) 0813 0801 0809 0799 0784 0817 0823 0814 0800
Ukraine (UA) 0708 0714 0710 0715 0721 0708 0702 0708 0722
United Kingdom (GB) 0699 0719 0699 0686 0736 0695 0706 0699 0729
United States (US) 0710 0701 0711 0709 0722 0705 0716 0710 0723
Countries only in test data
European
Greece (GR) 0715 0670 0702 0725 0711 0713 0717 0715 0718
Lithuania (LT) 0767 0782 0767 0764 0768 0769 0775 0767 0778
Serbia (RS) 0736 0713 0730 0603- 0826 0720 0753 0736 0738
United Kingdom Liquidation set 0606 0621 0603 0620 0618 0610 0607 0607 0635
Non-European
China (CN) 0558 0570 0557 0572 0543 0554 0567 0558 0556
China Delisted companies 0529 0546 0519 0563 0740++++ 0542 0520 0529 0707+++
Significance AUC better than benchmark 00001 = ++++ 0001 = +++ 001 = ++ 01 = +
AUC worse than benchmark 00001 = ---- 0001 = --- 001 = -- 01 = - Models
Benchmark = The LR model estimated for all data with Zrsquorsquo-model (1983) variables Model 1 = The original Altman (1983) Zrsquorsquo-Score Model
Model 2 = The MDA model estimated for all data Model 3 = The LR model estimated for all data with year dummies
42
42
Model 4 = The LR model estimated for all data with size variables Model 5 = The LR model estimated for all data with age category dummies Model 6 = The LR model estimated for all data with industry dummies Model 7 = The LR model estimated for all data with country risk rank Model 8 = The LR model estimated for all data with all variables
43
43
Table 6 Differences of medians between non-failed and failed groups
Country WCTA RETA EBITTA BVETD AUC of
Z-Score
Austria (AT) 0448 0405 0126 0487 0788
Belgium (BE) 0223 0264 0077 0431 0760
Bosnia (BA) 0106 0249 0088 0580 0805
Bulgaria (BG) 0114 0291 0094 0436 0630
China (CN) 0068 0032 0016 0280 0570
China delisted data 0089 -0061 -0032 0083 0546
China ST data 0298 0293 0139 0468 0911
Colombia (CO) 0226 0235 0099 0705 0724
Croatia (HR) 0275 0335 0044 0274 0812
Czech Republic (CZ) 0404 0397 0069 0667 0813
Denmark (DK) 0267 0356 0046 0733 0798
Estonia (EE) 0331 0388 0113 1033 0827
Finland (FI) 0402 0606 0207 0907 0864
France (FR) 0140 0213 0065 0424 0723
Germany (DE) 0131 0136 0032 0262 0658
Greece (GR) 0171 0262 0049 0349 0670
Hungary (HU) 0175 0224 0052 0587 0746
Iceland (IS) 0246 0261 0051 0337 0674
Ireland (IE) 0181 0266 0039 0560 0672
Italy (IT) 0277 0164 0073 0207 0799
Latvia (LV) 0117 0120 0042 0254 0691
Lithuania (LT) 0246 0218 0051 0569 0782
Netherlands (NL) 0204 0253 0077 0432 0754
Norway (NO) 0157 0219 0115 0329 0694
Poland (PL) 1340 0920 0124 1351 0904
Portugal (PT) 0215 0200 0052 0318 0724
Romania (RO) 0222 0271 0056 0298 0740
Russian Federation (RU) 0350 0242 0069 0245 0802
Serbia (RS) 0120 0148 0045 0389 0713
Slovakia (SK) 0256 0184 0061 0431 0774
Slovenia (SI) 0111 0172 0035 0326 0725
Spain (ES) 0143 0143 0076 0285 0713
Sweden (SE) 0255 0346 0099 0663 0801
Ukraine (UA) 0204 0200 0031 0449 0714
United Kingdom (GB) 0211 0245 0033 0472 0719
UK Liquidation set 0156 0234 0031 0447 0621
United States (US) 0195 0378 0248 0722 0701
44
44
Average of column items 0245 0265 0073 0481 0740
Correlation with Z-Score AUC 0611 0681 0516 0574 1000
Legend WCTA = Working CapitalTotal Assets
RETA = Retained EarningsTotal Assets EBITTA = EBITTotal Assets
BVETD = Book Value of EquityTotal Liabilities SALTA = SalesTotal Assets
AUC = Area under the ROC curve Z-Score = Altman (1983) Z-Score in the test data
45
45
Table 7 Test data AUCs for different estimated country models Comparisons are with AUC of the LR model estimated for all data (benchmark)
Test data AUC for different models
Country Benchmark Model 1 Model 2 Model 3 Model 4 Model 5 Model 6 Model 7
Austria (AT) 0800 0782 0770- 0774 0829 0787 0707- 0764
Belgium (BE) 0772 0779 0780 0826 0776 0783 0781 0834
Bosnia (BA) 0862 0850 0832 0833 0838 0838 0820 0853
Bulgaria (BG) 0684 0785 0785 0785 0796 0794 0677 0707
China (CN) ST companies 0985 0984 0982 0980 0986 0986 0986 0989
Colombia (CO) 0726 0755 0754 0818+ 0789 0749 0774 0824+
Croatia (HR) 0844 0862 0858 0865 0853 0863 0847 0863
Czech Republic (CZ) 0811 0812 0812 0823 0830 0813 0818 0842
Denmark (DK) 0803 0806 0809 0833 0818 0804 0813 0843
Estonia (EE) 0823 0824 0839 0866 0874 0839 0847 0899
Finland (FI) 0867 0867 0870 0885 0868 0873 0879 0894
France (FR) 0739 0773 0799 0805 0826 0800 0810 0845
Germany (DE) 0673 0684 0685 0734 0704 0701 0690 0762
Hungary (HU) 0742 0736 0743 0788 0767 0765 0747 0820
Iceland (IS) 0664 0670 0671 0784+ 0683 0714 0708 0824+
Ireland (IE) 0679 0663 0666 0718 0661 0665 0680 0724
Italy (IT) 0806 0802 0810 0835 0839 0809 0816 0868
Latvia (LV) 0678 0690 0707 0745 0720 0711 0730 0771
Netherlands (NL) 0752 0752 0756 0768 0784 0760 0759 0807
Norway (NO) 0716 0741 0741 0803 0749 0744 0743 0814
Poland (PL) 0903 0891 0897 0915 0899 0896 0895 0913
Portugal (PT) 0741 0753 0757 0761 0780 0758 0765 0797
Romania (RO) 0758 0718 0773 0805 0757 0755 0753 0774
Russian Federation (RU) 0811 0808 0810 0854 0811 0811 0818 0862
Slovakia (SK) 0777 0773 0775 0782 0810 0761 0773 0807
46
46
Slovenia (SI) 0737 0703 0719 0704 0711 0739 0686 0698
Spain (ES) 0734 0755 0767 0768 0849 0766 0776 0858
Sweden (SE) 0813 0826 0829 0843 0831 0831 0892 0901
Ukraine (UA) 0708 0712 0712 0720 0742 0718 0718 0758
United Kingdom (GB) 0699 0708 0713 0718 0764 0714 0731 0785
United States (US) 0710 0689 0687 0686 0816+ 0689 0714 0816+
Average of AUC 0768 0773 0778 0801 0799 0782 0779 0823
Significance AUC better than benchmark 00001 = ++++ 0001 = +++ 001 = ++ 01 = +
AUC worse than benchmark 00001 = ---- 0001 = --- 001 = -- 01 = - Models
Benchmark = The LR model estimated for all data with Zrsquorsquo-model (1983) variables Model 1 = The MDA model estimated for country data
Model 2 = The LR model estimated for country data Model 3 = The LR model estimated for country data with year dummies
Model 4 = The LR model estimated for country data with size variables Model 5 = The LR model estimated for country data with age category dummies Model 6 = The LR model estimated for country data with industry dummies
Model 7 = The LR model estimated for country data with all variables
47
47
Appendices
Appendix 1 Medians of the Altman (1983) model (Z) variables by status and country
Non-failed Failed
Non-failed Failed
Non-failed Failed Non-failed Failed
Country WCTA
RETA
EBITTA
BVETD
Austria (AT) 0170 -0278 0260 -0145 0055 -0071 0465 -0022
Belgium (BE) 0136 -0087 0157 -0107 0052 -0025 0460 0029
Bosnia (BA) 0087 -0019 0148 -0101 0032 -0056 0580 0000
Bulgaria (BG) 0216 0102 0272 -0019 0075 -0019 0504 0068
China (CN) 0105 0037 0064 0032 0064 0048 0870 0590
China delisted data 0158 0069 0286 0347 0059 0091 0923 0840
China ST data 0106 -0192 0281 -0012 0052 -0087 0776 0308
Colombia (CO) 0244 0018 0282 0047 0104 0005 0940 0235
Croatia (HR) 0093 -0182 0130 -0205 0030 -0014 0274 0000
Czech Republic (CZ) 0196 -0208 0230 -0167 0050 -0019 0591 -0076
Denmark (DK) 0128 -0139 0306 -0050 0005 -0041 0758 0025
Estonia (EE) 0222 -0109 0455 0067 0050 -0063 1169 0136
Finland (FI) 0233 -0169 0359 -0247 0082 -0125 0744 -0163
France (FR) 0146 0006 0223 0010 0059 -0006 0501 0077
Germany (DE) 0307 0176 0150 0014 0069 0037 0335 0073
Greece (GR) 0127 -0044 0049 -0213 0039 -0010 0460 0111
Hungary (HU) 0135 -0040 0271 0047 0054 0002 0717 0130
Iceland (IS) 0051 -0195 0046 -0215 0051 0000 0196 -0141
Ireland (IE) 0198 0017 0383 0117 0029 -0010 0728 0168
Italy (IT) 0107 -0170 0077 -0087 0032 -0041 0178 -0029
Latvia (LV) 0102 -0015 0150 0030 0069 0027 0342 0088
48
48
Lithuania (LT) 0205 -0041 0273 0055 0054 0003 0686 0117
Netherlands (NL) 0204 0000 0303 0050 0065 -0012 0511 0079
Norway (NO) 0185 0028 0139 -0080 0068 -0047 0398 0069
Poland (PL) 0198 -1142 0258 -0662 0076 -0048 0850 -0501
Portugal (PT) 0164 -0051 0133 -0067 0028 -0024 0343 0025
Romania (RO) 0071 -0151 0158 -0113 0041 -0015 0250 -0048
Russian Federation (RU) 0088 -0262 0106 -0136 0043 -0026 0194 -0051
Serbia (RS) 0093 -0027 0129 -0019 0027 -0018 0389 0000
Slovakia (SK) 0137 -0119 0185 0001 0060 -0001 0496 0065
Slovenia (SI) 0109 -0002 0215 0043 0039 0004 0434 0108
Spain (ES) 0117 -0026 0139 -0004 0029 -0047 0336 0051
Sweden (SE) 0266 0011 0357 0011 0058 -0041 0749 0086
Ukraine (UA) 0053 -0151 0034 -0166 0003 -0028 0442 -0007
United Kingdom (GB) 0179 -0032 0294 0049 0031 -0002 0579 0107
UK Liquidation set 0179 0023 0294 0060 0031 0000 0579 0132
United States (US) 0164 -0031 0374 -0004 0003 -0245 0800 0078
Average of medianssect 0153 -0092 0213 -0050 0048 -0025 0555 0075
Legend WCTA = Working CapitalTotal Assets
RETA = Retained EarningsTotal Assets EBITTA = EBITTotal assets
BVETD = Book Value of EquityTotal Liabilities sect = Because the two datasets for non-failed UK firms are identical the non-failed medians are used only once in the calculation of the averages

40
40
Table 5 Test data AUCs for different countries based on all data model versions Comparisons are with AUC of the LR model estimated for all data (benchmark)
Test data AUC for different models
Country Benchmark Model 1 Model 2 Model 3 Model 4 Model 5 Model 6 Model 7 Model 8
All Data 0748 0743---- 0745---- 0752++++ 0760++++ 0748+++ 0751++++ 0749++++ 0771++++
Countries with estimation data
Austria (AT) 0800 0788 0797 0805 0818+ 0814+ 0782 0800 0819
Belgium (BE) 0772 0760 0770 0777 0747 0777 0765 0772 0758
Bosnia (BA) 0862 0805 0857 0776 0863 0847 0855 0862 0784
Bulgaria (BG) 0684 0630 0680 0654 0691 0680 0659 0684 0632
China ST companies 0985 0911---- 0983 0958- 0977 0978 0987 0985 0968
Colombia (CO) 0726 0724 0727 0715 0758 0728 0726 0726 0757
Croatia (HR) 0844 0812 0839 0803 0837 0835 0832 0844 0801
Czech Republic (CZ) 0811 0813 0811 0819 0828 0807 0820 0811 0838
Denmark (DK) 0803 0798 0800 0781 0813 0802 0801 0803 0796
Estonia (EE) 0823 0827 0823 0847 0866 0826 0833 0823 0890
Finland (FI) 0867 0864 0866 0835 0862 0870 0878 0867 0853
France (FR) 0739 0723 0735 0749 0771 0741 0762 0739 0799
Germany (DE) 0673 0658 0666 0695 0656 0684 0677 0673 0688
Hungary (HU) 0742 0746 0740 0660 0738 0755 0735 0742 0696
Iceland (IS) 0664 0674 0666 0694 0678 0673 0672 0664 0716
Ireland (IE) 0679 0672 0676 0708 0677 0681 0688 0679 0712
Italy (IT) 0806 0799 0804 0833 0835 0806 0799 0806 0849
Latvia (LV) 0678 0691 0678 0704 0676 0686 0698 0678 0724
Netherlands (NL) 0752 0754 0750 0775 0769 0754 0746 0752 0787
Norway (NO) 0716 0694 0713 0658 0682 0720 0715 0716 0645
41
41
Poland (PL) 0903 0904 0904 0908 0902 0903 0899 0903 0904
Portugal (PT) 0741 0724 0736 0749 0773 0738 0755 0741 0785
Romania (RO) 0758 0740 0754 0709 0749 0755 0748 0758 0703
Russian Federation (RU) 0811 0802 0812 0843 0799 0807 0799 0811 0814
Slovakia (SK) 0777 0774 0776 0780 0811 0769 0786 0777 0808
Slovenia (SI) 0737 0725 0733 0674 0740 0747 0718 0737 0721
Spain (ES) 0734 0713 0732 0707 0793 0728 0753 0734 0774
Sweden (SE) 0813 0801 0809 0799 0784 0817 0823 0814 0800
Ukraine (UA) 0708 0714 0710 0715 0721 0708 0702 0708 0722
United Kingdom (GB) 0699 0719 0699 0686 0736 0695 0706 0699 0729
United States (US) 0710 0701 0711 0709 0722 0705 0716 0710 0723
Countries only in test data
European
Greece (GR) 0715 0670 0702 0725 0711 0713 0717 0715 0718
Lithuania (LT) 0767 0782 0767 0764 0768 0769 0775 0767 0778
Serbia (RS) 0736 0713 0730 0603- 0826 0720 0753 0736 0738
United Kingdom Liquidation set 0606 0621 0603 0620 0618 0610 0607 0607 0635
Non-European
China (CN) 0558 0570 0557 0572 0543 0554 0567 0558 0556
China Delisted companies 0529 0546 0519 0563 0740++++ 0542 0520 0529 0707+++
Significance AUC better than benchmark 00001 = ++++ 0001 = +++ 001 = ++ 01 = +
AUC worse than benchmark 00001 = ---- 0001 = --- 001 = -- 01 = - Models
Benchmark = The LR model estimated for all data with Zrsquorsquo-model (1983) variables Model 1 = The original Altman (1983) Zrsquorsquo-Score Model
Model 2 = The MDA model estimated for all data Model 3 = The LR model estimated for all data with year dummies
42
42
Model 4 = The LR model estimated for all data with size variables Model 5 = The LR model estimated for all data with age category dummies Model 6 = The LR model estimated for all data with industry dummies Model 7 = The LR model estimated for all data with country risk rank Model 8 = The LR model estimated for all data with all variables
43
43
Table 6 Differences of medians between non-failed and failed groups
Country WCTA RETA EBITTA BVETD AUC of
Z-Score
Austria (AT) 0448 0405 0126 0487 0788
Belgium (BE) 0223 0264 0077 0431 0760
Bosnia (BA) 0106 0249 0088 0580 0805
Bulgaria (BG) 0114 0291 0094 0436 0630
China (CN) 0068 0032 0016 0280 0570
China delisted data 0089 -0061 -0032 0083 0546
China ST data 0298 0293 0139 0468 0911
Colombia (CO) 0226 0235 0099 0705 0724
Croatia (HR) 0275 0335 0044 0274 0812
Czech Republic (CZ) 0404 0397 0069 0667 0813
Denmark (DK) 0267 0356 0046 0733 0798
Estonia (EE) 0331 0388 0113 1033 0827
Finland (FI) 0402 0606 0207 0907 0864
France (FR) 0140 0213 0065 0424 0723
Germany (DE) 0131 0136 0032 0262 0658
Greece (GR) 0171 0262 0049 0349 0670
Hungary (HU) 0175 0224 0052 0587 0746
Iceland (IS) 0246 0261 0051 0337 0674
Ireland (IE) 0181 0266 0039 0560 0672
Italy (IT) 0277 0164 0073 0207 0799
Latvia (LV) 0117 0120 0042 0254 0691
Lithuania (LT) 0246 0218 0051 0569 0782
Netherlands (NL) 0204 0253 0077 0432 0754
Norway (NO) 0157 0219 0115 0329 0694
Poland (PL) 1340 0920 0124 1351 0904
Portugal (PT) 0215 0200 0052 0318 0724
Romania (RO) 0222 0271 0056 0298 0740
Russian Federation (RU) 0350 0242 0069 0245 0802
Serbia (RS) 0120 0148 0045 0389 0713
Slovakia (SK) 0256 0184 0061 0431 0774
Slovenia (SI) 0111 0172 0035 0326 0725
Spain (ES) 0143 0143 0076 0285 0713
Sweden (SE) 0255 0346 0099 0663 0801
Ukraine (UA) 0204 0200 0031 0449 0714
United Kingdom (GB) 0211 0245 0033 0472 0719
UK Liquidation set 0156 0234 0031 0447 0621
United States (US) 0195 0378 0248 0722 0701
44
44
Average of column items 0245 0265 0073 0481 0740
Correlation with Z-Score AUC 0611 0681 0516 0574 1000
Legend WCTA = Working CapitalTotal Assets
RETA = Retained EarningsTotal Assets EBITTA = EBITTotal Assets
BVETD = Book Value of EquityTotal Liabilities SALTA = SalesTotal Assets
AUC = Area under the ROC curve Z-Score = Altman (1983) Z-Score in the test data
45
45
Table 7 Test data AUCs for different estimated country models Comparisons are with AUC of the LR model estimated for all data (benchmark)
Test data AUC for different models
Country Benchmark Model 1 Model 2 Model 3 Model 4 Model 5 Model 6 Model 7
Austria (AT) 0800 0782 0770- 0774 0829 0787 0707- 0764
Belgium (BE) 0772 0779 0780 0826 0776 0783 0781 0834
Bosnia (BA) 0862 0850 0832 0833 0838 0838 0820 0853
Bulgaria (BG) 0684 0785 0785 0785 0796 0794 0677 0707
China (CN) ST companies 0985 0984 0982 0980 0986 0986 0986 0989
Colombia (CO) 0726 0755 0754 0818+ 0789 0749 0774 0824+
Croatia (HR) 0844 0862 0858 0865 0853 0863 0847 0863
Czech Republic (CZ) 0811 0812 0812 0823 0830 0813 0818 0842
Denmark (DK) 0803 0806 0809 0833 0818 0804 0813 0843
Estonia (EE) 0823 0824 0839 0866 0874 0839 0847 0899
Finland (FI) 0867 0867 0870 0885 0868 0873 0879 0894
France (FR) 0739 0773 0799 0805 0826 0800 0810 0845
Germany (DE) 0673 0684 0685 0734 0704 0701 0690 0762
Hungary (HU) 0742 0736 0743 0788 0767 0765 0747 0820
Iceland (IS) 0664 0670 0671 0784+ 0683 0714 0708 0824+
Ireland (IE) 0679 0663 0666 0718 0661 0665 0680 0724
Italy (IT) 0806 0802 0810 0835 0839 0809 0816 0868
Latvia (LV) 0678 0690 0707 0745 0720 0711 0730 0771
Netherlands (NL) 0752 0752 0756 0768 0784 0760 0759 0807
Norway (NO) 0716 0741 0741 0803 0749 0744 0743 0814
Poland (PL) 0903 0891 0897 0915 0899 0896 0895 0913
Portugal (PT) 0741 0753 0757 0761 0780 0758 0765 0797
Romania (RO) 0758 0718 0773 0805 0757 0755 0753 0774
Russian Federation (RU) 0811 0808 0810 0854 0811 0811 0818 0862
Slovakia (SK) 0777 0773 0775 0782 0810 0761 0773 0807
46
46
Slovenia (SI) 0737 0703 0719 0704 0711 0739 0686 0698
Spain (ES) 0734 0755 0767 0768 0849 0766 0776 0858
Sweden (SE) 0813 0826 0829 0843 0831 0831 0892 0901
Ukraine (UA) 0708 0712 0712 0720 0742 0718 0718 0758
United Kingdom (GB) 0699 0708 0713 0718 0764 0714 0731 0785
United States (US) 0710 0689 0687 0686 0816+ 0689 0714 0816+
Average of AUC 0768 0773 0778 0801 0799 0782 0779 0823
Significance AUC better than benchmark 00001 = ++++ 0001 = +++ 001 = ++ 01 = +
AUC worse than benchmark 00001 = ---- 0001 = --- 001 = -- 01 = - Models
Benchmark = The LR model estimated for all data with Zrsquorsquo-model (1983) variables Model 1 = The MDA model estimated for country data
Model 2 = The LR model estimated for country data Model 3 = The LR model estimated for country data with year dummies
Model 4 = The LR model estimated for country data with size variables Model 5 = The LR model estimated for country data with age category dummies Model 6 = The LR model estimated for country data with industry dummies
Model 7 = The LR model estimated for country data with all variables
47
47
Appendices
Appendix 1 Medians of the Altman (1983) model (Z) variables by status and country
Non-failed Failed
Non-failed Failed
Non-failed Failed Non-failed Failed
Country WCTA
RETA
EBITTA
BVETD
Austria (AT) 0170 -0278 0260 -0145 0055 -0071 0465 -0022
Belgium (BE) 0136 -0087 0157 -0107 0052 -0025 0460 0029
Bosnia (BA) 0087 -0019 0148 -0101 0032 -0056 0580 0000
Bulgaria (BG) 0216 0102 0272 -0019 0075 -0019 0504 0068
China (CN) 0105 0037 0064 0032 0064 0048 0870 0590
China delisted data 0158 0069 0286 0347 0059 0091 0923 0840
China ST data 0106 -0192 0281 -0012 0052 -0087 0776 0308
Colombia (CO) 0244 0018 0282 0047 0104 0005 0940 0235
Croatia (HR) 0093 -0182 0130 -0205 0030 -0014 0274 0000
Czech Republic (CZ) 0196 -0208 0230 -0167 0050 -0019 0591 -0076
Denmark (DK) 0128 -0139 0306 -0050 0005 -0041 0758 0025
Estonia (EE) 0222 -0109 0455 0067 0050 -0063 1169 0136
Finland (FI) 0233 -0169 0359 -0247 0082 -0125 0744 -0163
France (FR) 0146 0006 0223 0010 0059 -0006 0501 0077
Germany (DE) 0307 0176 0150 0014 0069 0037 0335 0073
Greece (GR) 0127 -0044 0049 -0213 0039 -0010 0460 0111
Hungary (HU) 0135 -0040 0271 0047 0054 0002 0717 0130
Iceland (IS) 0051 -0195 0046 -0215 0051 0000 0196 -0141
Ireland (IE) 0198 0017 0383 0117 0029 -0010 0728 0168
Italy (IT) 0107 -0170 0077 -0087 0032 -0041 0178 -0029
Latvia (LV) 0102 -0015 0150 0030 0069 0027 0342 0088
48
48
Lithuania (LT) 0205 -0041 0273 0055 0054 0003 0686 0117
Netherlands (NL) 0204 0000 0303 0050 0065 -0012 0511 0079
Norway (NO) 0185 0028 0139 -0080 0068 -0047 0398 0069
Poland (PL) 0198 -1142 0258 -0662 0076 -0048 0850 -0501
Portugal (PT) 0164 -0051 0133 -0067 0028 -0024 0343 0025
Romania (RO) 0071 -0151 0158 -0113 0041 -0015 0250 -0048
Russian Federation (RU) 0088 -0262 0106 -0136 0043 -0026 0194 -0051
Serbia (RS) 0093 -0027 0129 -0019 0027 -0018 0389 0000
Slovakia (SK) 0137 -0119 0185 0001 0060 -0001 0496 0065
Slovenia (SI) 0109 -0002 0215 0043 0039 0004 0434 0108
Spain (ES) 0117 -0026 0139 -0004 0029 -0047 0336 0051
Sweden (SE) 0266 0011 0357 0011 0058 -0041 0749 0086
Ukraine (UA) 0053 -0151 0034 -0166 0003 -0028 0442 -0007
United Kingdom (GB) 0179 -0032 0294 0049 0031 -0002 0579 0107
UK Liquidation set 0179 0023 0294 0060 0031 0000 0579 0132
United States (US) 0164 -0031 0374 -0004 0003 -0245 0800 0078
Average of medianssect 0153 -0092 0213 -0050 0048 -0025 0555 0075
Legend WCTA = Working CapitalTotal Assets
RETA = Retained EarningsTotal Assets EBITTA = EBITTotal assets
BVETD = Book Value of EquityTotal Liabilities sect = Because the two datasets for non-failed UK firms are identical the non-failed medians are used only once in the calculation of the averages

41
41
Poland (PL) 0903 0904 0904 0908 0902 0903 0899 0903 0904
Portugal (PT) 0741 0724 0736 0749 0773 0738 0755 0741 0785
Romania (RO) 0758 0740 0754 0709 0749 0755 0748 0758 0703
Russian Federation (RU) 0811 0802 0812 0843 0799 0807 0799 0811 0814
Slovakia (SK) 0777 0774 0776 0780 0811 0769 0786 0777 0808
Slovenia (SI) 0737 0725 0733 0674 0740 0747 0718 0737 0721
Spain (ES) 0734 0713 0732 0707 0793 0728 0753 0734 0774
Sweden (SE) 0813 0801 0809 0799 0784 0817 0823 0814 0800
Ukraine (UA) 0708 0714 0710 0715 0721 0708 0702 0708 0722
United Kingdom (GB) 0699 0719 0699 0686 0736 0695 0706 0699 0729
United States (US) 0710 0701 0711 0709 0722 0705 0716 0710 0723
Countries only in test data
European
Greece (GR) 0715 0670 0702 0725 0711 0713 0717 0715 0718
Lithuania (LT) 0767 0782 0767 0764 0768 0769 0775 0767 0778
Serbia (RS) 0736 0713 0730 0603- 0826 0720 0753 0736 0738
United Kingdom Liquidation set 0606 0621 0603 0620 0618 0610 0607 0607 0635
Non-European
China (CN) 0558 0570 0557 0572 0543 0554 0567 0558 0556
China Delisted companies 0529 0546 0519 0563 0740++++ 0542 0520 0529 0707+++
Significance AUC better than benchmark 00001 = ++++ 0001 = +++ 001 = ++ 01 = +
AUC worse than benchmark 00001 = ---- 0001 = --- 001 = -- 01 = - Models
Benchmark = The LR model estimated for all data with Zrsquorsquo-model (1983) variables Model 1 = The original Altman (1983) Zrsquorsquo-Score Model
Model 2 = The MDA model estimated for all data Model 3 = The LR model estimated for all data with year dummies
42
42
Model 4 = The LR model estimated for all data with size variables Model 5 = The LR model estimated for all data with age category dummies Model 6 = The LR model estimated for all data with industry dummies Model 7 = The LR model estimated for all data with country risk rank Model 8 = The LR model estimated for all data with all variables
43
43
Table 6 Differences of medians between non-failed and failed groups
Country WCTA RETA EBITTA BVETD AUC of
Z-Score
Austria (AT) 0448 0405 0126 0487 0788
Belgium (BE) 0223 0264 0077 0431 0760
Bosnia (BA) 0106 0249 0088 0580 0805
Bulgaria (BG) 0114 0291 0094 0436 0630
China (CN) 0068 0032 0016 0280 0570
China delisted data 0089 -0061 -0032 0083 0546
China ST data 0298 0293 0139 0468 0911
Colombia (CO) 0226 0235 0099 0705 0724
Croatia (HR) 0275 0335 0044 0274 0812
Czech Republic (CZ) 0404 0397 0069 0667 0813
Denmark (DK) 0267 0356 0046 0733 0798
Estonia (EE) 0331 0388 0113 1033 0827
Finland (FI) 0402 0606 0207 0907 0864
France (FR) 0140 0213 0065 0424 0723
Germany (DE) 0131 0136 0032 0262 0658
Greece (GR) 0171 0262 0049 0349 0670
Hungary (HU) 0175 0224 0052 0587 0746
Iceland (IS) 0246 0261 0051 0337 0674
Ireland (IE) 0181 0266 0039 0560 0672
Italy (IT) 0277 0164 0073 0207 0799
Latvia (LV) 0117 0120 0042 0254 0691
Lithuania (LT) 0246 0218 0051 0569 0782
Netherlands (NL) 0204 0253 0077 0432 0754
Norway (NO) 0157 0219 0115 0329 0694
Poland (PL) 1340 0920 0124 1351 0904
Portugal (PT) 0215 0200 0052 0318 0724
Romania (RO) 0222 0271 0056 0298 0740
Russian Federation (RU) 0350 0242 0069 0245 0802
Serbia (RS) 0120 0148 0045 0389 0713
Slovakia (SK) 0256 0184 0061 0431 0774
Slovenia (SI) 0111 0172 0035 0326 0725
Spain (ES) 0143 0143 0076 0285 0713
Sweden (SE) 0255 0346 0099 0663 0801
Ukraine (UA) 0204 0200 0031 0449 0714
United Kingdom (GB) 0211 0245 0033 0472 0719
UK Liquidation set 0156 0234 0031 0447 0621
United States (US) 0195 0378 0248 0722 0701
44
44
Average of column items 0245 0265 0073 0481 0740
Correlation with Z-Score AUC 0611 0681 0516 0574 1000
Legend WCTA = Working CapitalTotal Assets
RETA = Retained EarningsTotal Assets EBITTA = EBITTotal Assets
BVETD = Book Value of EquityTotal Liabilities SALTA = SalesTotal Assets
AUC = Area under the ROC curve Z-Score = Altman (1983) Z-Score in the test data
45
45
Table 7 Test data AUCs for different estimated country models Comparisons are with AUC of the LR model estimated for all data (benchmark)
Test data AUC for different models
Country Benchmark Model 1 Model 2 Model 3 Model 4 Model 5 Model 6 Model 7
Austria (AT) 0800 0782 0770- 0774 0829 0787 0707- 0764
Belgium (BE) 0772 0779 0780 0826 0776 0783 0781 0834
Bosnia (BA) 0862 0850 0832 0833 0838 0838 0820 0853
Bulgaria (BG) 0684 0785 0785 0785 0796 0794 0677 0707
China (CN) ST companies 0985 0984 0982 0980 0986 0986 0986 0989
Colombia (CO) 0726 0755 0754 0818+ 0789 0749 0774 0824+
Croatia (HR) 0844 0862 0858 0865 0853 0863 0847 0863
Czech Republic (CZ) 0811 0812 0812 0823 0830 0813 0818 0842
Denmark (DK) 0803 0806 0809 0833 0818 0804 0813 0843
Estonia (EE) 0823 0824 0839 0866 0874 0839 0847 0899
Finland (FI) 0867 0867 0870 0885 0868 0873 0879 0894
France (FR) 0739 0773 0799 0805 0826 0800 0810 0845
Germany (DE) 0673 0684 0685 0734 0704 0701 0690 0762
Hungary (HU) 0742 0736 0743 0788 0767 0765 0747 0820
Iceland (IS) 0664 0670 0671 0784+ 0683 0714 0708 0824+
Ireland (IE) 0679 0663 0666 0718 0661 0665 0680 0724
Italy (IT) 0806 0802 0810 0835 0839 0809 0816 0868
Latvia (LV) 0678 0690 0707 0745 0720 0711 0730 0771
Netherlands (NL) 0752 0752 0756 0768 0784 0760 0759 0807
Norway (NO) 0716 0741 0741 0803 0749 0744 0743 0814
Poland (PL) 0903 0891 0897 0915 0899 0896 0895 0913
Portugal (PT) 0741 0753 0757 0761 0780 0758 0765 0797
Romania (RO) 0758 0718 0773 0805 0757 0755 0753 0774
Russian Federation (RU) 0811 0808 0810 0854 0811 0811 0818 0862
Slovakia (SK) 0777 0773 0775 0782 0810 0761 0773 0807
46
46
Slovenia (SI) 0737 0703 0719 0704 0711 0739 0686 0698
Spain (ES) 0734 0755 0767 0768 0849 0766 0776 0858
Sweden (SE) 0813 0826 0829 0843 0831 0831 0892 0901
Ukraine (UA) 0708 0712 0712 0720 0742 0718 0718 0758
United Kingdom (GB) 0699 0708 0713 0718 0764 0714 0731 0785
United States (US) 0710 0689 0687 0686 0816+ 0689 0714 0816+
Average of AUC 0768 0773 0778 0801 0799 0782 0779 0823
Significance AUC better than benchmark 00001 = ++++ 0001 = +++ 001 = ++ 01 = +
AUC worse than benchmark 00001 = ---- 0001 = --- 001 = -- 01 = - Models
Benchmark = The LR model estimated for all data with Zrsquorsquo-model (1983) variables Model 1 = The MDA model estimated for country data
Model 2 = The LR model estimated for country data Model 3 = The LR model estimated for country data with year dummies
Model 4 = The LR model estimated for country data with size variables Model 5 = The LR model estimated for country data with age category dummies Model 6 = The LR model estimated for country data with industry dummies
Model 7 = The LR model estimated for country data with all variables
47
47
Appendices
Appendix 1 Medians of the Altman (1983) model (Z) variables by status and country
Non-failed Failed
Non-failed Failed
Non-failed Failed Non-failed Failed
Country WCTA
RETA
EBITTA
BVETD
Austria (AT) 0170 -0278 0260 -0145 0055 -0071 0465 -0022
Belgium (BE) 0136 -0087 0157 -0107 0052 -0025 0460 0029
Bosnia (BA) 0087 -0019 0148 -0101 0032 -0056 0580 0000
Bulgaria (BG) 0216 0102 0272 -0019 0075 -0019 0504 0068
China (CN) 0105 0037 0064 0032 0064 0048 0870 0590
China delisted data 0158 0069 0286 0347 0059 0091 0923 0840
China ST data 0106 -0192 0281 -0012 0052 -0087 0776 0308
Colombia (CO) 0244 0018 0282 0047 0104 0005 0940 0235
Croatia (HR) 0093 -0182 0130 -0205 0030 -0014 0274 0000
Czech Republic (CZ) 0196 -0208 0230 -0167 0050 -0019 0591 -0076
Denmark (DK) 0128 -0139 0306 -0050 0005 -0041 0758 0025
Estonia (EE) 0222 -0109 0455 0067 0050 -0063 1169 0136
Finland (FI) 0233 -0169 0359 -0247 0082 -0125 0744 -0163
France (FR) 0146 0006 0223 0010 0059 -0006 0501 0077
Germany (DE) 0307 0176 0150 0014 0069 0037 0335 0073
Greece (GR) 0127 -0044 0049 -0213 0039 -0010 0460 0111
Hungary (HU) 0135 -0040 0271 0047 0054 0002 0717 0130
Iceland (IS) 0051 -0195 0046 -0215 0051 0000 0196 -0141
Ireland (IE) 0198 0017 0383 0117 0029 -0010 0728 0168
Italy (IT) 0107 -0170 0077 -0087 0032 -0041 0178 -0029
Latvia (LV) 0102 -0015 0150 0030 0069 0027 0342 0088
48
48
Lithuania (LT) 0205 -0041 0273 0055 0054 0003 0686 0117
Netherlands (NL) 0204 0000 0303 0050 0065 -0012 0511 0079
Norway (NO) 0185 0028 0139 -0080 0068 -0047 0398 0069
Poland (PL) 0198 -1142 0258 -0662 0076 -0048 0850 -0501
Portugal (PT) 0164 -0051 0133 -0067 0028 -0024 0343 0025
Romania (RO) 0071 -0151 0158 -0113 0041 -0015 0250 -0048
Russian Federation (RU) 0088 -0262 0106 -0136 0043 -0026 0194 -0051
Serbia (RS) 0093 -0027 0129 -0019 0027 -0018 0389 0000
Slovakia (SK) 0137 -0119 0185 0001 0060 -0001 0496 0065
Slovenia (SI) 0109 -0002 0215 0043 0039 0004 0434 0108
Spain (ES) 0117 -0026 0139 -0004 0029 -0047 0336 0051
Sweden (SE) 0266 0011 0357 0011 0058 -0041 0749 0086
Ukraine (UA) 0053 -0151 0034 -0166 0003 -0028 0442 -0007
United Kingdom (GB) 0179 -0032 0294 0049 0031 -0002 0579 0107
UK Liquidation set 0179 0023 0294 0060 0031 0000 0579 0132
United States (US) 0164 -0031 0374 -0004 0003 -0245 0800 0078
Average of medianssect 0153 -0092 0213 -0050 0048 -0025 0555 0075
Legend WCTA = Working CapitalTotal Assets
RETA = Retained EarningsTotal Assets EBITTA = EBITTotal assets
BVETD = Book Value of EquityTotal Liabilities sect = Because the two datasets for non-failed UK firms are identical the non-failed medians are used only once in the calculation of the averages

42
42
Model 4 = The LR model estimated for all data with size variables Model 5 = The LR model estimated for all data with age category dummies Model 6 = The LR model estimated for all data with industry dummies Model 7 = The LR model estimated for all data with country risk rank Model 8 = The LR model estimated for all data with all variables
43
43
Table 6 Differences of medians between non-failed and failed groups
Country WCTA RETA EBITTA BVETD AUC of
Z-Score
Austria (AT) 0448 0405 0126 0487 0788
Belgium (BE) 0223 0264 0077 0431 0760
Bosnia (BA) 0106 0249 0088 0580 0805
Bulgaria (BG) 0114 0291 0094 0436 0630
China (CN) 0068 0032 0016 0280 0570
China delisted data 0089 -0061 -0032 0083 0546
China ST data 0298 0293 0139 0468 0911
Colombia (CO) 0226 0235 0099 0705 0724
Croatia (HR) 0275 0335 0044 0274 0812
Czech Republic (CZ) 0404 0397 0069 0667 0813
Denmark (DK) 0267 0356 0046 0733 0798
Estonia (EE) 0331 0388 0113 1033 0827
Finland (FI) 0402 0606 0207 0907 0864
France (FR) 0140 0213 0065 0424 0723
Germany (DE) 0131 0136 0032 0262 0658
Greece (GR) 0171 0262 0049 0349 0670
Hungary (HU) 0175 0224 0052 0587 0746
Iceland (IS) 0246 0261 0051 0337 0674
Ireland (IE) 0181 0266 0039 0560 0672
Italy (IT) 0277 0164 0073 0207 0799
Latvia (LV) 0117 0120 0042 0254 0691
Lithuania (LT) 0246 0218 0051 0569 0782
Netherlands (NL) 0204 0253 0077 0432 0754
Norway (NO) 0157 0219 0115 0329 0694
Poland (PL) 1340 0920 0124 1351 0904
Portugal (PT) 0215 0200 0052 0318 0724
Romania (RO) 0222 0271 0056 0298 0740
Russian Federation (RU) 0350 0242 0069 0245 0802
Serbia (RS) 0120 0148 0045 0389 0713
Slovakia (SK) 0256 0184 0061 0431 0774
Slovenia (SI) 0111 0172 0035 0326 0725
Spain (ES) 0143 0143 0076 0285 0713
Sweden (SE) 0255 0346 0099 0663 0801
Ukraine (UA) 0204 0200 0031 0449 0714
United Kingdom (GB) 0211 0245 0033 0472 0719
UK Liquidation set 0156 0234 0031 0447 0621
United States (US) 0195 0378 0248 0722 0701
44
44
Average of column items 0245 0265 0073 0481 0740
Correlation with Z-Score AUC 0611 0681 0516 0574 1000
Legend WCTA = Working CapitalTotal Assets
RETA = Retained EarningsTotal Assets EBITTA = EBITTotal Assets
BVETD = Book Value of EquityTotal Liabilities SALTA = SalesTotal Assets
AUC = Area under the ROC curve Z-Score = Altman (1983) Z-Score in the test data
45
45
Table 7 Test data AUCs for different estimated country models Comparisons are with AUC of the LR model estimated for all data (benchmark)
Test data AUC for different models
Country Benchmark Model 1 Model 2 Model 3 Model 4 Model 5 Model 6 Model 7
Austria (AT) 0800 0782 0770- 0774 0829 0787 0707- 0764
Belgium (BE) 0772 0779 0780 0826 0776 0783 0781 0834
Bosnia (BA) 0862 0850 0832 0833 0838 0838 0820 0853
Bulgaria (BG) 0684 0785 0785 0785 0796 0794 0677 0707
China (CN) ST companies 0985 0984 0982 0980 0986 0986 0986 0989
Colombia (CO) 0726 0755 0754 0818+ 0789 0749 0774 0824+
Croatia (HR) 0844 0862 0858 0865 0853 0863 0847 0863
Czech Republic (CZ) 0811 0812 0812 0823 0830 0813 0818 0842
Denmark (DK) 0803 0806 0809 0833 0818 0804 0813 0843
Estonia (EE) 0823 0824 0839 0866 0874 0839 0847 0899
Finland (FI) 0867 0867 0870 0885 0868 0873 0879 0894
France (FR) 0739 0773 0799 0805 0826 0800 0810 0845
Germany (DE) 0673 0684 0685 0734 0704 0701 0690 0762
Hungary (HU) 0742 0736 0743 0788 0767 0765 0747 0820
Iceland (IS) 0664 0670 0671 0784+ 0683 0714 0708 0824+
Ireland (IE) 0679 0663 0666 0718 0661 0665 0680 0724
Italy (IT) 0806 0802 0810 0835 0839 0809 0816 0868
Latvia (LV) 0678 0690 0707 0745 0720 0711 0730 0771
Netherlands (NL) 0752 0752 0756 0768 0784 0760 0759 0807
Norway (NO) 0716 0741 0741 0803 0749 0744 0743 0814
Poland (PL) 0903 0891 0897 0915 0899 0896 0895 0913
Portugal (PT) 0741 0753 0757 0761 0780 0758 0765 0797
Romania (RO) 0758 0718 0773 0805 0757 0755 0753 0774
Russian Federation (RU) 0811 0808 0810 0854 0811 0811 0818 0862
Slovakia (SK) 0777 0773 0775 0782 0810 0761 0773 0807
46
46
Slovenia (SI) 0737 0703 0719 0704 0711 0739 0686 0698
Spain (ES) 0734 0755 0767 0768 0849 0766 0776 0858
Sweden (SE) 0813 0826 0829 0843 0831 0831 0892 0901
Ukraine (UA) 0708 0712 0712 0720 0742 0718 0718 0758
United Kingdom (GB) 0699 0708 0713 0718 0764 0714 0731 0785
United States (US) 0710 0689 0687 0686 0816+ 0689 0714 0816+
Average of AUC 0768 0773 0778 0801 0799 0782 0779 0823
Significance AUC better than benchmark 00001 = ++++ 0001 = +++ 001 = ++ 01 = +
AUC worse than benchmark 00001 = ---- 0001 = --- 001 = -- 01 = - Models
Benchmark = The LR model estimated for all data with Zrsquorsquo-model (1983) variables Model 1 = The MDA model estimated for country data
Model 2 = The LR model estimated for country data Model 3 = The LR model estimated for country data with year dummies
Model 4 = The LR model estimated for country data with size variables Model 5 = The LR model estimated for country data with age category dummies Model 6 = The LR model estimated for country data with industry dummies
Model 7 = The LR model estimated for country data with all variables
47
47
Appendices
Appendix 1 Medians of the Altman (1983) model (Z) variables by status and country
Non-failed Failed
Non-failed Failed
Non-failed Failed Non-failed Failed
Country WCTA
RETA
EBITTA
BVETD
Austria (AT) 0170 -0278 0260 -0145 0055 -0071 0465 -0022
Belgium (BE) 0136 -0087 0157 -0107 0052 -0025 0460 0029
Bosnia (BA) 0087 -0019 0148 -0101 0032 -0056 0580 0000
Bulgaria (BG) 0216 0102 0272 -0019 0075 -0019 0504 0068
China (CN) 0105 0037 0064 0032 0064 0048 0870 0590
China delisted data 0158 0069 0286 0347 0059 0091 0923 0840
China ST data 0106 -0192 0281 -0012 0052 -0087 0776 0308
Colombia (CO) 0244 0018 0282 0047 0104 0005 0940 0235
Croatia (HR) 0093 -0182 0130 -0205 0030 -0014 0274 0000
Czech Republic (CZ) 0196 -0208 0230 -0167 0050 -0019 0591 -0076
Denmark (DK) 0128 -0139 0306 -0050 0005 -0041 0758 0025
Estonia (EE) 0222 -0109 0455 0067 0050 -0063 1169 0136
Finland (FI) 0233 -0169 0359 -0247 0082 -0125 0744 -0163
France (FR) 0146 0006 0223 0010 0059 -0006 0501 0077
Germany (DE) 0307 0176 0150 0014 0069 0037 0335 0073
Greece (GR) 0127 -0044 0049 -0213 0039 -0010 0460 0111
Hungary (HU) 0135 -0040 0271 0047 0054 0002 0717 0130
Iceland (IS) 0051 -0195 0046 -0215 0051 0000 0196 -0141
Ireland (IE) 0198 0017 0383 0117 0029 -0010 0728 0168
Italy (IT) 0107 -0170 0077 -0087 0032 -0041 0178 -0029
Latvia (LV) 0102 -0015 0150 0030 0069 0027 0342 0088
48
48
Lithuania (LT) 0205 -0041 0273 0055 0054 0003 0686 0117
Netherlands (NL) 0204 0000 0303 0050 0065 -0012 0511 0079
Norway (NO) 0185 0028 0139 -0080 0068 -0047 0398 0069
Poland (PL) 0198 -1142 0258 -0662 0076 -0048 0850 -0501
Portugal (PT) 0164 -0051 0133 -0067 0028 -0024 0343 0025
Romania (RO) 0071 -0151 0158 -0113 0041 -0015 0250 -0048
Russian Federation (RU) 0088 -0262 0106 -0136 0043 -0026 0194 -0051
Serbia (RS) 0093 -0027 0129 -0019 0027 -0018 0389 0000
Slovakia (SK) 0137 -0119 0185 0001 0060 -0001 0496 0065
Slovenia (SI) 0109 -0002 0215 0043 0039 0004 0434 0108
Spain (ES) 0117 -0026 0139 -0004 0029 -0047 0336 0051
Sweden (SE) 0266 0011 0357 0011 0058 -0041 0749 0086
Ukraine (UA) 0053 -0151 0034 -0166 0003 -0028 0442 -0007
United Kingdom (GB) 0179 -0032 0294 0049 0031 -0002 0579 0107
UK Liquidation set 0179 0023 0294 0060 0031 0000 0579 0132
United States (US) 0164 -0031 0374 -0004 0003 -0245 0800 0078
Average of medianssect 0153 -0092 0213 -0050 0048 -0025 0555 0075
Legend WCTA = Working CapitalTotal Assets
RETA = Retained EarningsTotal Assets EBITTA = EBITTotal assets
BVETD = Book Value of EquityTotal Liabilities sect = Because the two datasets for non-failed UK firms are identical the non-failed medians are used only once in the calculation of the averages
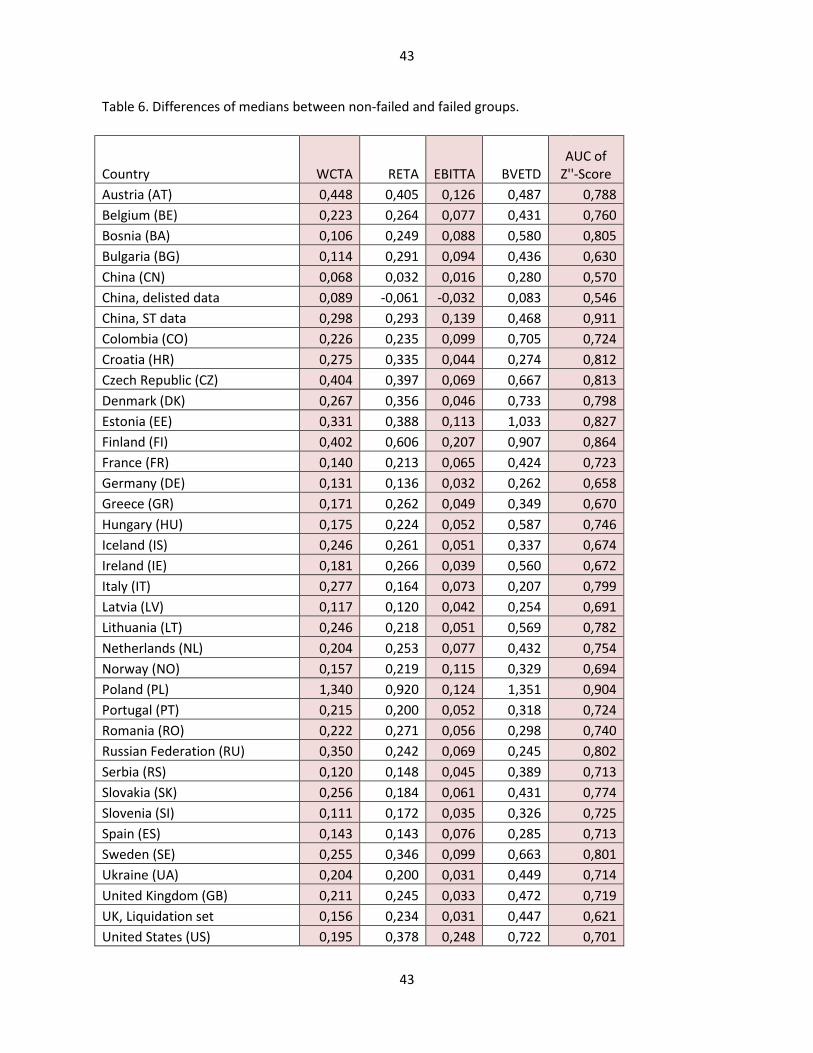
43
43
Table 6 Differences of medians between non-failed and failed groups
Country WCTA RETA EBITTA BVETD AUC of
Z-Score
Austria (AT) 0448 0405 0126 0487 0788
Belgium (BE) 0223 0264 0077 0431 0760
Bosnia (BA) 0106 0249 0088 0580 0805
Bulgaria (BG) 0114 0291 0094 0436 0630
China (CN) 0068 0032 0016 0280 0570
China delisted data 0089 -0061 -0032 0083 0546
China ST data 0298 0293 0139 0468 0911
Colombia (CO) 0226 0235 0099 0705 0724
Croatia (HR) 0275 0335 0044 0274 0812
Czech Republic (CZ) 0404 0397 0069 0667 0813
Denmark (DK) 0267 0356 0046 0733 0798
Estonia (EE) 0331 0388 0113 1033 0827
Finland (FI) 0402 0606 0207 0907 0864
France (FR) 0140 0213 0065 0424 0723
Germany (DE) 0131 0136 0032 0262 0658
Greece (GR) 0171 0262 0049 0349 0670
Hungary (HU) 0175 0224 0052 0587 0746
Iceland (IS) 0246 0261 0051 0337 0674
Ireland (IE) 0181 0266 0039 0560 0672
Italy (IT) 0277 0164 0073 0207 0799
Latvia (LV) 0117 0120 0042 0254 0691
Lithuania (LT) 0246 0218 0051 0569 0782
Netherlands (NL) 0204 0253 0077 0432 0754
Norway (NO) 0157 0219 0115 0329 0694
Poland (PL) 1340 0920 0124 1351 0904
Portugal (PT) 0215 0200 0052 0318 0724
Romania (RO) 0222 0271 0056 0298 0740
Russian Federation (RU) 0350 0242 0069 0245 0802
Serbia (RS) 0120 0148 0045 0389 0713
Slovakia (SK) 0256 0184 0061 0431 0774
Slovenia (SI) 0111 0172 0035 0326 0725
Spain (ES) 0143 0143 0076 0285 0713
Sweden (SE) 0255 0346 0099 0663 0801
Ukraine (UA) 0204 0200 0031 0449 0714
United Kingdom (GB) 0211 0245 0033 0472 0719
UK Liquidation set 0156 0234 0031 0447 0621
United States (US) 0195 0378 0248 0722 0701
44
44
Average of column items 0245 0265 0073 0481 0740
Correlation with Z-Score AUC 0611 0681 0516 0574 1000
Legend WCTA = Working CapitalTotal Assets
RETA = Retained EarningsTotal Assets EBITTA = EBITTotal Assets
BVETD = Book Value of EquityTotal Liabilities SALTA = SalesTotal Assets
AUC = Area under the ROC curve Z-Score = Altman (1983) Z-Score in the test data
45
45
Table 7 Test data AUCs for different estimated country models Comparisons are with AUC of the LR model estimated for all data (benchmark)
Test data AUC for different models
Country Benchmark Model 1 Model 2 Model 3 Model 4 Model 5 Model 6 Model 7
Austria (AT) 0800 0782 0770- 0774 0829 0787 0707- 0764
Belgium (BE) 0772 0779 0780 0826 0776 0783 0781 0834
Bosnia (BA) 0862 0850 0832 0833 0838 0838 0820 0853
Bulgaria (BG) 0684 0785 0785 0785 0796 0794 0677 0707
China (CN) ST companies 0985 0984 0982 0980 0986 0986 0986 0989
Colombia (CO) 0726 0755 0754 0818+ 0789 0749 0774 0824+
Croatia (HR) 0844 0862 0858 0865 0853 0863 0847 0863
Czech Republic (CZ) 0811 0812 0812 0823 0830 0813 0818 0842
Denmark (DK) 0803 0806 0809 0833 0818 0804 0813 0843
Estonia (EE) 0823 0824 0839 0866 0874 0839 0847 0899
Finland (FI) 0867 0867 0870 0885 0868 0873 0879 0894
France (FR) 0739 0773 0799 0805 0826 0800 0810 0845
Germany (DE) 0673 0684 0685 0734 0704 0701 0690 0762
Hungary (HU) 0742 0736 0743 0788 0767 0765 0747 0820
Iceland (IS) 0664 0670 0671 0784+ 0683 0714 0708 0824+
Ireland (IE) 0679 0663 0666 0718 0661 0665 0680 0724
Italy (IT) 0806 0802 0810 0835 0839 0809 0816 0868
Latvia (LV) 0678 0690 0707 0745 0720 0711 0730 0771
Netherlands (NL) 0752 0752 0756 0768 0784 0760 0759 0807
Norway (NO) 0716 0741 0741 0803 0749 0744 0743 0814
Poland (PL) 0903 0891 0897 0915 0899 0896 0895 0913
Portugal (PT) 0741 0753 0757 0761 0780 0758 0765 0797
Romania (RO) 0758 0718 0773 0805 0757 0755 0753 0774
Russian Federation (RU) 0811 0808 0810 0854 0811 0811 0818 0862
Slovakia (SK) 0777 0773 0775 0782 0810 0761 0773 0807
46
46
Slovenia (SI) 0737 0703 0719 0704 0711 0739 0686 0698
Spain (ES) 0734 0755 0767 0768 0849 0766 0776 0858
Sweden (SE) 0813 0826 0829 0843 0831 0831 0892 0901
Ukraine (UA) 0708 0712 0712 0720 0742 0718 0718 0758
United Kingdom (GB) 0699 0708 0713 0718 0764 0714 0731 0785
United States (US) 0710 0689 0687 0686 0816+ 0689 0714 0816+
Average of AUC 0768 0773 0778 0801 0799 0782 0779 0823
Significance AUC better than benchmark 00001 = ++++ 0001 = +++ 001 = ++ 01 = +
AUC worse than benchmark 00001 = ---- 0001 = --- 001 = -- 01 = - Models
Benchmark = The LR model estimated for all data with Zrsquorsquo-model (1983) variables Model 1 = The MDA model estimated for country data
Model 2 = The LR model estimated for country data Model 3 = The LR model estimated for country data with year dummies
Model 4 = The LR model estimated for country data with size variables Model 5 = The LR model estimated for country data with age category dummies Model 6 = The LR model estimated for country data with industry dummies
Model 7 = The LR model estimated for country data with all variables
47
47
Appendices
Appendix 1 Medians of the Altman (1983) model (Z) variables by status and country
Non-failed Failed
Non-failed Failed
Non-failed Failed Non-failed Failed
Country WCTA
RETA
EBITTA
BVETD
Austria (AT) 0170 -0278 0260 -0145 0055 -0071 0465 -0022
Belgium (BE) 0136 -0087 0157 -0107 0052 -0025 0460 0029
Bosnia (BA) 0087 -0019 0148 -0101 0032 -0056 0580 0000
Bulgaria (BG) 0216 0102 0272 -0019 0075 -0019 0504 0068
China (CN) 0105 0037 0064 0032 0064 0048 0870 0590
China delisted data 0158 0069 0286 0347 0059 0091 0923 0840
China ST data 0106 -0192 0281 -0012 0052 -0087 0776 0308
Colombia (CO) 0244 0018 0282 0047 0104 0005 0940 0235
Croatia (HR) 0093 -0182 0130 -0205 0030 -0014 0274 0000
Czech Republic (CZ) 0196 -0208 0230 -0167 0050 -0019 0591 -0076
Denmark (DK) 0128 -0139 0306 -0050 0005 -0041 0758 0025
Estonia (EE) 0222 -0109 0455 0067 0050 -0063 1169 0136
Finland (FI) 0233 -0169 0359 -0247 0082 -0125 0744 -0163
France (FR) 0146 0006 0223 0010 0059 -0006 0501 0077
Germany (DE) 0307 0176 0150 0014 0069 0037 0335 0073
Greece (GR) 0127 -0044 0049 -0213 0039 -0010 0460 0111
Hungary (HU) 0135 -0040 0271 0047 0054 0002 0717 0130
Iceland (IS) 0051 -0195 0046 -0215 0051 0000 0196 -0141
Ireland (IE) 0198 0017 0383 0117 0029 -0010 0728 0168
Italy (IT) 0107 -0170 0077 -0087 0032 -0041 0178 -0029
Latvia (LV) 0102 -0015 0150 0030 0069 0027 0342 0088
48
48
Lithuania (LT) 0205 -0041 0273 0055 0054 0003 0686 0117
Netherlands (NL) 0204 0000 0303 0050 0065 -0012 0511 0079
Norway (NO) 0185 0028 0139 -0080 0068 -0047 0398 0069
Poland (PL) 0198 -1142 0258 -0662 0076 -0048 0850 -0501
Portugal (PT) 0164 -0051 0133 -0067 0028 -0024 0343 0025
Romania (RO) 0071 -0151 0158 -0113 0041 -0015 0250 -0048
Russian Federation (RU) 0088 -0262 0106 -0136 0043 -0026 0194 -0051
Serbia (RS) 0093 -0027 0129 -0019 0027 -0018 0389 0000
Slovakia (SK) 0137 -0119 0185 0001 0060 -0001 0496 0065
Slovenia (SI) 0109 -0002 0215 0043 0039 0004 0434 0108
Spain (ES) 0117 -0026 0139 -0004 0029 -0047 0336 0051
Sweden (SE) 0266 0011 0357 0011 0058 -0041 0749 0086
Ukraine (UA) 0053 -0151 0034 -0166 0003 -0028 0442 -0007
United Kingdom (GB) 0179 -0032 0294 0049 0031 -0002 0579 0107
UK Liquidation set 0179 0023 0294 0060 0031 0000 0579 0132
United States (US) 0164 -0031 0374 -0004 0003 -0245 0800 0078
Average of medianssect 0153 -0092 0213 -0050 0048 -0025 0555 0075
Legend WCTA = Working CapitalTotal Assets
RETA = Retained EarningsTotal Assets EBITTA = EBITTotal assets
BVETD = Book Value of EquityTotal Liabilities sect = Because the two datasets for non-failed UK firms are identical the non-failed medians are used only once in the calculation of the averages

44
44
Average of column items 0245 0265 0073 0481 0740
Correlation with Z-Score AUC 0611 0681 0516 0574 1000
Legend WCTA = Working CapitalTotal Assets
RETA = Retained EarningsTotal Assets EBITTA = EBITTotal Assets
BVETD = Book Value of EquityTotal Liabilities SALTA = SalesTotal Assets
AUC = Area under the ROC curve Z-Score = Altman (1983) Z-Score in the test data
45
45
Table 7 Test data AUCs for different estimated country models Comparisons are with AUC of the LR model estimated for all data (benchmark)
Test data AUC for different models
Country Benchmark Model 1 Model 2 Model 3 Model 4 Model 5 Model 6 Model 7
Austria (AT) 0800 0782 0770- 0774 0829 0787 0707- 0764
Belgium (BE) 0772 0779 0780 0826 0776 0783 0781 0834
Bosnia (BA) 0862 0850 0832 0833 0838 0838 0820 0853
Bulgaria (BG) 0684 0785 0785 0785 0796 0794 0677 0707
China (CN) ST companies 0985 0984 0982 0980 0986 0986 0986 0989
Colombia (CO) 0726 0755 0754 0818+ 0789 0749 0774 0824+
Croatia (HR) 0844 0862 0858 0865 0853 0863 0847 0863
Czech Republic (CZ) 0811 0812 0812 0823 0830 0813 0818 0842
Denmark (DK) 0803 0806 0809 0833 0818 0804 0813 0843
Estonia (EE) 0823 0824 0839 0866 0874 0839 0847 0899
Finland (FI) 0867 0867 0870 0885 0868 0873 0879 0894
France (FR) 0739 0773 0799 0805 0826 0800 0810 0845
Germany (DE) 0673 0684 0685 0734 0704 0701 0690 0762
Hungary (HU) 0742 0736 0743 0788 0767 0765 0747 0820
Iceland (IS) 0664 0670 0671 0784+ 0683 0714 0708 0824+
Ireland (IE) 0679 0663 0666 0718 0661 0665 0680 0724
Italy (IT) 0806 0802 0810 0835 0839 0809 0816 0868
Latvia (LV) 0678 0690 0707 0745 0720 0711 0730 0771
Netherlands (NL) 0752 0752 0756 0768 0784 0760 0759 0807
Norway (NO) 0716 0741 0741 0803 0749 0744 0743 0814
Poland (PL) 0903 0891 0897 0915 0899 0896 0895 0913
Portugal (PT) 0741 0753 0757 0761 0780 0758 0765 0797
Romania (RO) 0758 0718 0773 0805 0757 0755 0753 0774
Russian Federation (RU) 0811 0808 0810 0854 0811 0811 0818 0862
Slovakia (SK) 0777 0773 0775 0782 0810 0761 0773 0807
46
46
Slovenia (SI) 0737 0703 0719 0704 0711 0739 0686 0698
Spain (ES) 0734 0755 0767 0768 0849 0766 0776 0858
Sweden (SE) 0813 0826 0829 0843 0831 0831 0892 0901
Ukraine (UA) 0708 0712 0712 0720 0742 0718 0718 0758
United Kingdom (GB) 0699 0708 0713 0718 0764 0714 0731 0785
United States (US) 0710 0689 0687 0686 0816+ 0689 0714 0816+
Average of AUC 0768 0773 0778 0801 0799 0782 0779 0823
Significance AUC better than benchmark 00001 = ++++ 0001 = +++ 001 = ++ 01 = +
AUC worse than benchmark 00001 = ---- 0001 = --- 001 = -- 01 = - Models
Benchmark = The LR model estimated for all data with Zrsquorsquo-model (1983) variables Model 1 = The MDA model estimated for country data
Model 2 = The LR model estimated for country data Model 3 = The LR model estimated for country data with year dummies
Model 4 = The LR model estimated for country data with size variables Model 5 = The LR model estimated for country data with age category dummies Model 6 = The LR model estimated for country data with industry dummies
Model 7 = The LR model estimated for country data with all variables
47
47
Appendices
Appendix 1 Medians of the Altman (1983) model (Z) variables by status and country
Non-failed Failed
Non-failed Failed
Non-failed Failed Non-failed Failed
Country WCTA
RETA
EBITTA
BVETD
Austria (AT) 0170 -0278 0260 -0145 0055 -0071 0465 -0022
Belgium (BE) 0136 -0087 0157 -0107 0052 -0025 0460 0029
Bosnia (BA) 0087 -0019 0148 -0101 0032 -0056 0580 0000
Bulgaria (BG) 0216 0102 0272 -0019 0075 -0019 0504 0068
China (CN) 0105 0037 0064 0032 0064 0048 0870 0590
China delisted data 0158 0069 0286 0347 0059 0091 0923 0840
China ST data 0106 -0192 0281 -0012 0052 -0087 0776 0308
Colombia (CO) 0244 0018 0282 0047 0104 0005 0940 0235
Croatia (HR) 0093 -0182 0130 -0205 0030 -0014 0274 0000
Czech Republic (CZ) 0196 -0208 0230 -0167 0050 -0019 0591 -0076
Denmark (DK) 0128 -0139 0306 -0050 0005 -0041 0758 0025
Estonia (EE) 0222 -0109 0455 0067 0050 -0063 1169 0136
Finland (FI) 0233 -0169 0359 -0247 0082 -0125 0744 -0163
France (FR) 0146 0006 0223 0010 0059 -0006 0501 0077
Germany (DE) 0307 0176 0150 0014 0069 0037 0335 0073
Greece (GR) 0127 -0044 0049 -0213 0039 -0010 0460 0111
Hungary (HU) 0135 -0040 0271 0047 0054 0002 0717 0130
Iceland (IS) 0051 -0195 0046 -0215 0051 0000 0196 -0141
Ireland (IE) 0198 0017 0383 0117 0029 -0010 0728 0168
Italy (IT) 0107 -0170 0077 -0087 0032 -0041 0178 -0029
Latvia (LV) 0102 -0015 0150 0030 0069 0027 0342 0088
48
48
Lithuania (LT) 0205 -0041 0273 0055 0054 0003 0686 0117
Netherlands (NL) 0204 0000 0303 0050 0065 -0012 0511 0079
Norway (NO) 0185 0028 0139 -0080 0068 -0047 0398 0069
Poland (PL) 0198 -1142 0258 -0662 0076 -0048 0850 -0501
Portugal (PT) 0164 -0051 0133 -0067 0028 -0024 0343 0025
Romania (RO) 0071 -0151 0158 -0113 0041 -0015 0250 -0048
Russian Federation (RU) 0088 -0262 0106 -0136 0043 -0026 0194 -0051
Serbia (RS) 0093 -0027 0129 -0019 0027 -0018 0389 0000
Slovakia (SK) 0137 -0119 0185 0001 0060 -0001 0496 0065
Slovenia (SI) 0109 -0002 0215 0043 0039 0004 0434 0108
Spain (ES) 0117 -0026 0139 -0004 0029 -0047 0336 0051
Sweden (SE) 0266 0011 0357 0011 0058 -0041 0749 0086
Ukraine (UA) 0053 -0151 0034 -0166 0003 -0028 0442 -0007
United Kingdom (GB) 0179 -0032 0294 0049 0031 -0002 0579 0107
UK Liquidation set 0179 0023 0294 0060 0031 0000 0579 0132
United States (US) 0164 -0031 0374 -0004 0003 -0245 0800 0078
Average of medianssect 0153 -0092 0213 -0050 0048 -0025 0555 0075
Legend WCTA = Working CapitalTotal Assets
RETA = Retained EarningsTotal Assets EBITTA = EBITTotal assets
BVETD = Book Value of EquityTotal Liabilities sect = Because the two datasets for non-failed UK firms are identical the non-failed medians are used only once in the calculation of the averages
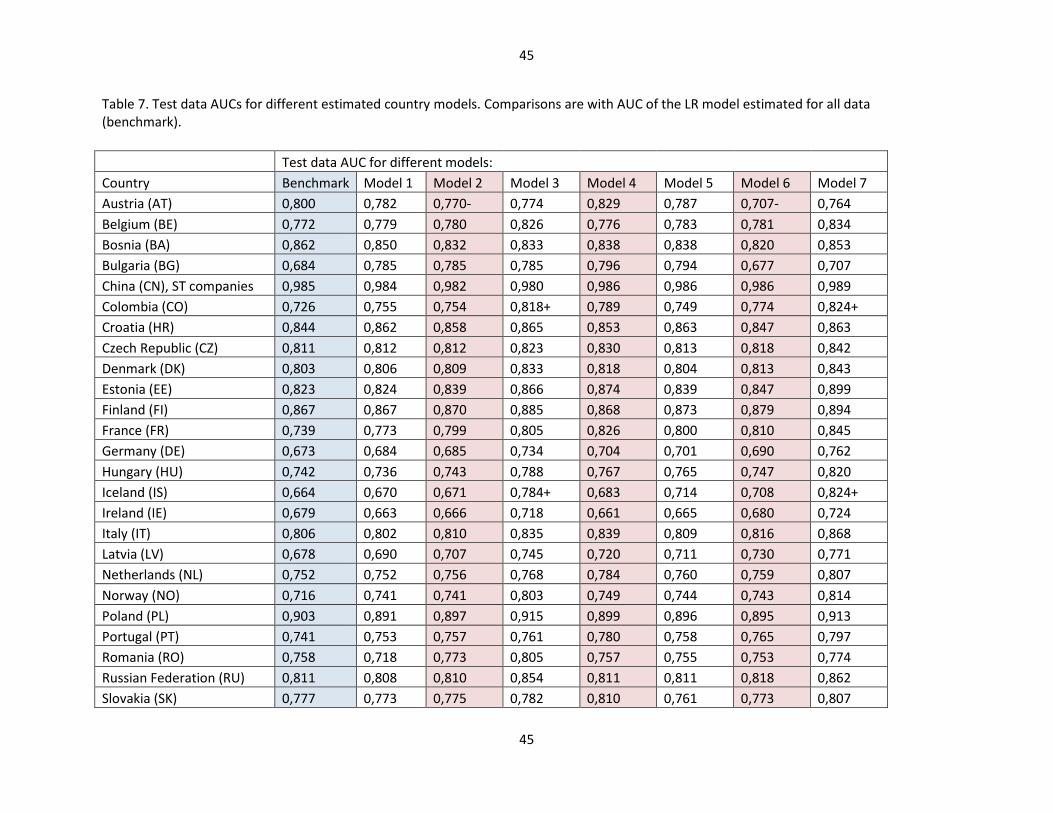
45
45
Table 7 Test data AUCs for different estimated country models Comparisons are with AUC of the LR model estimated for all data (benchmark)
Test data AUC for different models
Country Benchmark Model 1 Model 2 Model 3 Model 4 Model 5 Model 6 Model 7
Austria (AT) 0800 0782 0770- 0774 0829 0787 0707- 0764
Belgium (BE) 0772 0779 0780 0826 0776 0783 0781 0834
Bosnia (BA) 0862 0850 0832 0833 0838 0838 0820 0853
Bulgaria (BG) 0684 0785 0785 0785 0796 0794 0677 0707
China (CN) ST companies 0985 0984 0982 0980 0986 0986 0986 0989
Colombia (CO) 0726 0755 0754 0818+ 0789 0749 0774 0824+
Croatia (HR) 0844 0862 0858 0865 0853 0863 0847 0863
Czech Republic (CZ) 0811 0812 0812 0823 0830 0813 0818 0842
Denmark (DK) 0803 0806 0809 0833 0818 0804 0813 0843
Estonia (EE) 0823 0824 0839 0866 0874 0839 0847 0899
Finland (FI) 0867 0867 0870 0885 0868 0873 0879 0894
France (FR) 0739 0773 0799 0805 0826 0800 0810 0845
Germany (DE) 0673 0684 0685 0734 0704 0701 0690 0762
Hungary (HU) 0742 0736 0743 0788 0767 0765 0747 0820
Iceland (IS) 0664 0670 0671 0784+ 0683 0714 0708 0824+
Ireland (IE) 0679 0663 0666 0718 0661 0665 0680 0724
Italy (IT) 0806 0802 0810 0835 0839 0809 0816 0868
Latvia (LV) 0678 0690 0707 0745 0720 0711 0730 0771
Netherlands (NL) 0752 0752 0756 0768 0784 0760 0759 0807
Norway (NO) 0716 0741 0741 0803 0749 0744 0743 0814
Poland (PL) 0903 0891 0897 0915 0899 0896 0895 0913
Portugal (PT) 0741 0753 0757 0761 0780 0758 0765 0797
Romania (RO) 0758 0718 0773 0805 0757 0755 0753 0774
Russian Federation (RU) 0811 0808 0810 0854 0811 0811 0818 0862
Slovakia (SK) 0777 0773 0775 0782 0810 0761 0773 0807
46
46
Slovenia (SI) 0737 0703 0719 0704 0711 0739 0686 0698
Spain (ES) 0734 0755 0767 0768 0849 0766 0776 0858
Sweden (SE) 0813 0826 0829 0843 0831 0831 0892 0901
Ukraine (UA) 0708 0712 0712 0720 0742 0718 0718 0758
United Kingdom (GB) 0699 0708 0713 0718 0764 0714 0731 0785
United States (US) 0710 0689 0687 0686 0816+ 0689 0714 0816+
Average of AUC 0768 0773 0778 0801 0799 0782 0779 0823
Significance AUC better than benchmark 00001 = ++++ 0001 = +++ 001 = ++ 01 = +
AUC worse than benchmark 00001 = ---- 0001 = --- 001 = -- 01 = - Models
Benchmark = The LR model estimated for all data with Zrsquorsquo-model (1983) variables Model 1 = The MDA model estimated for country data
Model 2 = The LR model estimated for country data Model 3 = The LR model estimated for country data with year dummies
Model 4 = The LR model estimated for country data with size variables Model 5 = The LR model estimated for country data with age category dummies Model 6 = The LR model estimated for country data with industry dummies
Model 7 = The LR model estimated for country data with all variables
47
47
Appendices
Appendix 1 Medians of the Altman (1983) model (Z) variables by status and country
Non-failed Failed
Non-failed Failed
Non-failed Failed Non-failed Failed
Country WCTA
RETA
EBITTA
BVETD
Austria (AT) 0170 -0278 0260 -0145 0055 -0071 0465 -0022
Belgium (BE) 0136 -0087 0157 -0107 0052 -0025 0460 0029
Bosnia (BA) 0087 -0019 0148 -0101 0032 -0056 0580 0000
Bulgaria (BG) 0216 0102 0272 -0019 0075 -0019 0504 0068
China (CN) 0105 0037 0064 0032 0064 0048 0870 0590
China delisted data 0158 0069 0286 0347 0059 0091 0923 0840
China ST data 0106 -0192 0281 -0012 0052 -0087 0776 0308
Colombia (CO) 0244 0018 0282 0047 0104 0005 0940 0235
Croatia (HR) 0093 -0182 0130 -0205 0030 -0014 0274 0000
Czech Republic (CZ) 0196 -0208 0230 -0167 0050 -0019 0591 -0076
Denmark (DK) 0128 -0139 0306 -0050 0005 -0041 0758 0025
Estonia (EE) 0222 -0109 0455 0067 0050 -0063 1169 0136
Finland (FI) 0233 -0169 0359 -0247 0082 -0125 0744 -0163
France (FR) 0146 0006 0223 0010 0059 -0006 0501 0077
Germany (DE) 0307 0176 0150 0014 0069 0037 0335 0073
Greece (GR) 0127 -0044 0049 -0213 0039 -0010 0460 0111
Hungary (HU) 0135 -0040 0271 0047 0054 0002 0717 0130
Iceland (IS) 0051 -0195 0046 -0215 0051 0000 0196 -0141
Ireland (IE) 0198 0017 0383 0117 0029 -0010 0728 0168
Italy (IT) 0107 -0170 0077 -0087 0032 -0041 0178 -0029
Latvia (LV) 0102 -0015 0150 0030 0069 0027 0342 0088
48
48
Lithuania (LT) 0205 -0041 0273 0055 0054 0003 0686 0117
Netherlands (NL) 0204 0000 0303 0050 0065 -0012 0511 0079
Norway (NO) 0185 0028 0139 -0080 0068 -0047 0398 0069
Poland (PL) 0198 -1142 0258 -0662 0076 -0048 0850 -0501
Portugal (PT) 0164 -0051 0133 -0067 0028 -0024 0343 0025
Romania (RO) 0071 -0151 0158 -0113 0041 -0015 0250 -0048
Russian Federation (RU) 0088 -0262 0106 -0136 0043 -0026 0194 -0051
Serbia (RS) 0093 -0027 0129 -0019 0027 -0018 0389 0000
Slovakia (SK) 0137 -0119 0185 0001 0060 -0001 0496 0065
Slovenia (SI) 0109 -0002 0215 0043 0039 0004 0434 0108
Spain (ES) 0117 -0026 0139 -0004 0029 -0047 0336 0051
Sweden (SE) 0266 0011 0357 0011 0058 -0041 0749 0086
Ukraine (UA) 0053 -0151 0034 -0166 0003 -0028 0442 -0007
United Kingdom (GB) 0179 -0032 0294 0049 0031 -0002 0579 0107
UK Liquidation set 0179 0023 0294 0060 0031 0000 0579 0132
United States (US) 0164 -0031 0374 -0004 0003 -0245 0800 0078
Average of medianssect 0153 -0092 0213 -0050 0048 -0025 0555 0075
Legend WCTA = Working CapitalTotal Assets
RETA = Retained EarningsTotal Assets EBITTA = EBITTotal assets
BVETD = Book Value of EquityTotal Liabilities sect = Because the two datasets for non-failed UK firms are identical the non-failed medians are used only once in the calculation of the averages

46
46
Slovenia (SI) 0737 0703 0719 0704 0711 0739 0686 0698
Spain (ES) 0734 0755 0767 0768 0849 0766 0776 0858
Sweden (SE) 0813 0826 0829 0843 0831 0831 0892 0901
Ukraine (UA) 0708 0712 0712 0720 0742 0718 0718 0758
United Kingdom (GB) 0699 0708 0713 0718 0764 0714 0731 0785
United States (US) 0710 0689 0687 0686 0816+ 0689 0714 0816+
Average of AUC 0768 0773 0778 0801 0799 0782 0779 0823
Significance AUC better than benchmark 00001 = ++++ 0001 = +++ 001 = ++ 01 = +
AUC worse than benchmark 00001 = ---- 0001 = --- 001 = -- 01 = - Models
Benchmark = The LR model estimated for all data with Zrsquorsquo-model (1983) variables Model 1 = The MDA model estimated for country data
Model 2 = The LR model estimated for country data Model 3 = The LR model estimated for country data with year dummies
Model 4 = The LR model estimated for country data with size variables Model 5 = The LR model estimated for country data with age category dummies Model 6 = The LR model estimated for country data with industry dummies
Model 7 = The LR model estimated for country data with all variables
47
47
Appendices
Appendix 1 Medians of the Altman (1983) model (Z) variables by status and country
Non-failed Failed
Non-failed Failed
Non-failed Failed Non-failed Failed
Country WCTA
RETA
EBITTA
BVETD
Austria (AT) 0170 -0278 0260 -0145 0055 -0071 0465 -0022
Belgium (BE) 0136 -0087 0157 -0107 0052 -0025 0460 0029
Bosnia (BA) 0087 -0019 0148 -0101 0032 -0056 0580 0000
Bulgaria (BG) 0216 0102 0272 -0019 0075 -0019 0504 0068
China (CN) 0105 0037 0064 0032 0064 0048 0870 0590
China delisted data 0158 0069 0286 0347 0059 0091 0923 0840
China ST data 0106 -0192 0281 -0012 0052 -0087 0776 0308
Colombia (CO) 0244 0018 0282 0047 0104 0005 0940 0235
Croatia (HR) 0093 -0182 0130 -0205 0030 -0014 0274 0000
Czech Republic (CZ) 0196 -0208 0230 -0167 0050 -0019 0591 -0076
Denmark (DK) 0128 -0139 0306 -0050 0005 -0041 0758 0025
Estonia (EE) 0222 -0109 0455 0067 0050 -0063 1169 0136
Finland (FI) 0233 -0169 0359 -0247 0082 -0125 0744 -0163
France (FR) 0146 0006 0223 0010 0059 -0006 0501 0077
Germany (DE) 0307 0176 0150 0014 0069 0037 0335 0073
Greece (GR) 0127 -0044 0049 -0213 0039 -0010 0460 0111
Hungary (HU) 0135 -0040 0271 0047 0054 0002 0717 0130
Iceland (IS) 0051 -0195 0046 -0215 0051 0000 0196 -0141
Ireland (IE) 0198 0017 0383 0117 0029 -0010 0728 0168
Italy (IT) 0107 -0170 0077 -0087 0032 -0041 0178 -0029
Latvia (LV) 0102 -0015 0150 0030 0069 0027 0342 0088
48
48
Lithuania (LT) 0205 -0041 0273 0055 0054 0003 0686 0117
Netherlands (NL) 0204 0000 0303 0050 0065 -0012 0511 0079
Norway (NO) 0185 0028 0139 -0080 0068 -0047 0398 0069
Poland (PL) 0198 -1142 0258 -0662 0076 -0048 0850 -0501
Portugal (PT) 0164 -0051 0133 -0067 0028 -0024 0343 0025
Romania (RO) 0071 -0151 0158 -0113 0041 -0015 0250 -0048
Russian Federation (RU) 0088 -0262 0106 -0136 0043 -0026 0194 -0051
Serbia (RS) 0093 -0027 0129 -0019 0027 -0018 0389 0000
Slovakia (SK) 0137 -0119 0185 0001 0060 -0001 0496 0065
Slovenia (SI) 0109 -0002 0215 0043 0039 0004 0434 0108
Spain (ES) 0117 -0026 0139 -0004 0029 -0047 0336 0051
Sweden (SE) 0266 0011 0357 0011 0058 -0041 0749 0086
Ukraine (UA) 0053 -0151 0034 -0166 0003 -0028 0442 -0007
United Kingdom (GB) 0179 -0032 0294 0049 0031 -0002 0579 0107
UK Liquidation set 0179 0023 0294 0060 0031 0000 0579 0132
United States (US) 0164 -0031 0374 -0004 0003 -0245 0800 0078
Average of medianssect 0153 -0092 0213 -0050 0048 -0025 0555 0075
Legend WCTA = Working CapitalTotal Assets
RETA = Retained EarningsTotal Assets EBITTA = EBITTotal assets
BVETD = Book Value of EquityTotal Liabilities sect = Because the two datasets for non-failed UK firms are identical the non-failed medians are used only once in the calculation of the averages

47
47
Appendices
Appendix 1 Medians of the Altman (1983) model (Z) variables by status and country
Non-failed Failed
Non-failed Failed
Non-failed Failed Non-failed Failed
Country WCTA
RETA
EBITTA
BVETD
Austria (AT) 0170 -0278 0260 -0145 0055 -0071 0465 -0022
Belgium (BE) 0136 -0087 0157 -0107 0052 -0025 0460 0029
Bosnia (BA) 0087 -0019 0148 -0101 0032 -0056 0580 0000
Bulgaria (BG) 0216 0102 0272 -0019 0075 -0019 0504 0068
China (CN) 0105 0037 0064 0032 0064 0048 0870 0590
China delisted data 0158 0069 0286 0347 0059 0091 0923 0840
China ST data 0106 -0192 0281 -0012 0052 -0087 0776 0308
Colombia (CO) 0244 0018 0282 0047 0104 0005 0940 0235
Croatia (HR) 0093 -0182 0130 -0205 0030 -0014 0274 0000
Czech Republic (CZ) 0196 -0208 0230 -0167 0050 -0019 0591 -0076
Denmark (DK) 0128 -0139 0306 -0050 0005 -0041 0758 0025
Estonia (EE) 0222 -0109 0455 0067 0050 -0063 1169 0136
Finland (FI) 0233 -0169 0359 -0247 0082 -0125 0744 -0163
France (FR) 0146 0006 0223 0010 0059 -0006 0501 0077
Germany (DE) 0307 0176 0150 0014 0069 0037 0335 0073
Greece (GR) 0127 -0044 0049 -0213 0039 -0010 0460 0111
Hungary (HU) 0135 -0040 0271 0047 0054 0002 0717 0130
Iceland (IS) 0051 -0195 0046 -0215 0051 0000 0196 -0141
Ireland (IE) 0198 0017 0383 0117 0029 -0010 0728 0168
Italy (IT) 0107 -0170 0077 -0087 0032 -0041 0178 -0029
Latvia (LV) 0102 -0015 0150 0030 0069 0027 0342 0088
48
48
Lithuania (LT) 0205 -0041 0273 0055 0054 0003 0686 0117
Netherlands (NL) 0204 0000 0303 0050 0065 -0012 0511 0079
Norway (NO) 0185 0028 0139 -0080 0068 -0047 0398 0069
Poland (PL) 0198 -1142 0258 -0662 0076 -0048 0850 -0501
Portugal (PT) 0164 -0051 0133 -0067 0028 -0024 0343 0025
Romania (RO) 0071 -0151 0158 -0113 0041 -0015 0250 -0048
Russian Federation (RU) 0088 -0262 0106 -0136 0043 -0026 0194 -0051
Serbia (RS) 0093 -0027 0129 -0019 0027 -0018 0389 0000
Slovakia (SK) 0137 -0119 0185 0001 0060 -0001 0496 0065
Slovenia (SI) 0109 -0002 0215 0043 0039 0004 0434 0108
Spain (ES) 0117 -0026 0139 -0004 0029 -0047 0336 0051
Sweden (SE) 0266 0011 0357 0011 0058 -0041 0749 0086
Ukraine (UA) 0053 -0151 0034 -0166 0003 -0028 0442 -0007
United Kingdom (GB) 0179 -0032 0294 0049 0031 -0002 0579 0107
UK Liquidation set 0179 0023 0294 0060 0031 0000 0579 0132
United States (US) 0164 -0031 0374 -0004 0003 -0245 0800 0078
Average of medianssect 0153 -0092 0213 -0050 0048 -0025 0555 0075
Legend WCTA = Working CapitalTotal Assets
RETA = Retained EarningsTotal Assets EBITTA = EBITTotal assets
BVETD = Book Value of EquityTotal Liabilities sect = Because the two datasets for non-failed UK firms are identical the non-failed medians are used only once in the calculation of the averages
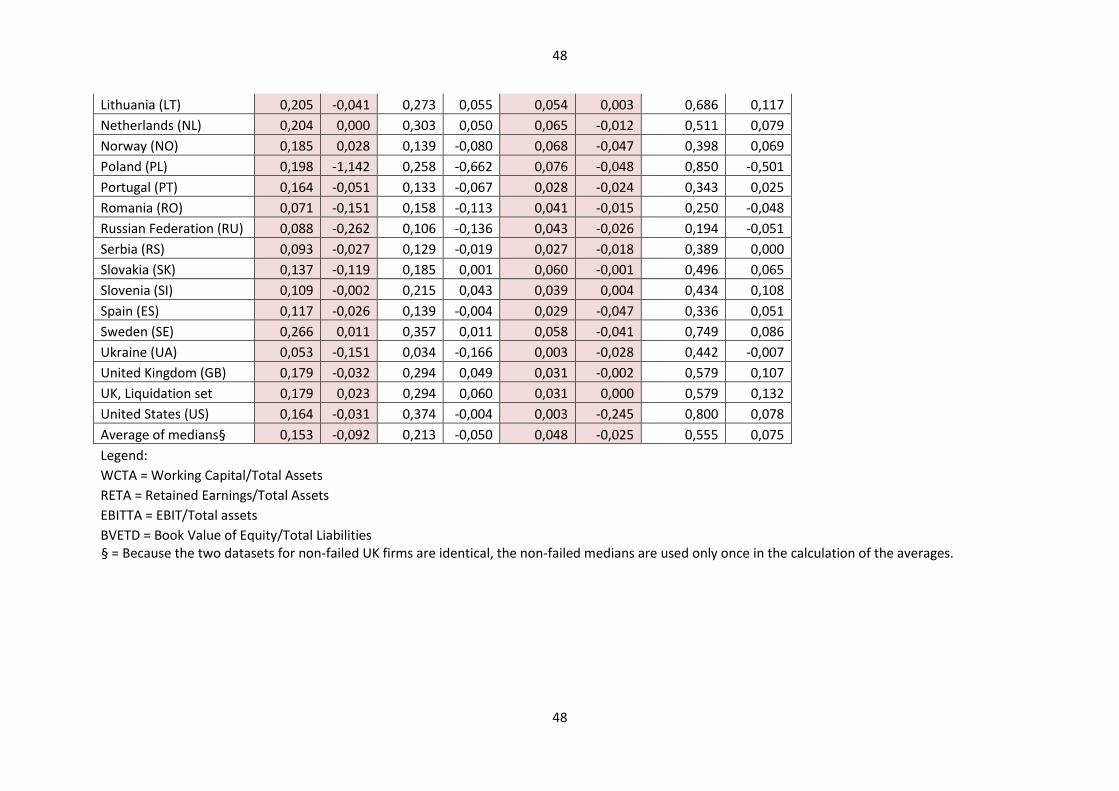
48
48
Lithuania (LT) 0205 -0041 0273 0055 0054 0003 0686 0117
Netherlands (NL) 0204 0000 0303 0050 0065 -0012 0511 0079
Norway (NO) 0185 0028 0139 -0080 0068 -0047 0398 0069
Poland (PL) 0198 -1142 0258 -0662 0076 -0048 0850 -0501
Portugal (PT) 0164 -0051 0133 -0067 0028 -0024 0343 0025
Romania (RO) 0071 -0151 0158 -0113 0041 -0015 0250 -0048
Russian Federation (RU) 0088 -0262 0106 -0136 0043 -0026 0194 -0051
Serbia (RS) 0093 -0027 0129 -0019 0027 -0018 0389 0000
Slovakia (SK) 0137 -0119 0185 0001 0060 -0001 0496 0065
Slovenia (SI) 0109 -0002 0215 0043 0039 0004 0434 0108
Spain (ES) 0117 -0026 0139 -0004 0029 -0047 0336 0051
Sweden (SE) 0266 0011 0357 0011 0058 -0041 0749 0086
Ukraine (UA) 0053 -0151 0034 -0166 0003 -0028 0442 -0007
United Kingdom (GB) 0179 -0032 0294 0049 0031 -0002 0579 0107
UK Liquidation set 0179 0023 0294 0060 0031 0000 0579 0132
United States (US) 0164 -0031 0374 -0004 0003 -0245 0800 0078
Average of medianssect 0153 -0092 0213 -0050 0048 -0025 0555 0075
Legend WCTA = Working CapitalTotal Assets
RETA = Retained EarningsTotal Assets EBITTA = EBITTotal assets
BVETD = Book Value of EquityTotal Liabilities sect = Because the two datasets for non-failed UK firms are identical the non-failed medians are used only once in the calculation of the averages