dissolved organic carbon trends resulting from changes in atmospheric deposition chemistry
TRANSCRIPT

LETTERS
Dissolved organic carbon trends resulting fromchanges in atmospheric deposition chemistryDonald T. Monteith1*, John L. Stoddard2*, Christopher D. Evans3, Heleen A. de Wit4, Martin Forsius5,Tore Høgasen4, Anders Wilander6, Brit Lisa Skjelkvale4, Dean S. Jeffries7, Jussi Vuorenmaa5, Bill Keller8,Jiri Kopacek9 & Josef Vesely10{
Several hypotheses have been proposed to explain recent, wide-spread increases in concentrations of dissolved organic carbon(DOC) in the surface waters of glaciated landscapes across easternNorth America and northern and central Europe1–3. Some invokeanthropogenic forcing through mechanisms related to climatechange3–5, nitrogen deposition6 or changes in land use7, and byimplication suggest that current concentrations and fluxes arewithout precedent. All of these hypotheses imply that DOC levelswill continue to rise, with unpredictable consequences for theglobal carbon cycle. Alternatively, it has been proposed thatDOC concentrations are returning toward pre-industrial levelsas a result of a gradual decline in the sulphate content of atmo-spheric deposition8–10. Here we show, through the assessment oftime series data from 522 remote lakes and streams in NorthAmerica and northern Europe, that rising trends in DOC between1990 and 2004 can be concisely explained by a simple model basedsolely on changes in deposition chemistry and catchment acid-sensitivity. We demonstrate that DOC concentrations haveincreased in proportion to the rates at which atmosphericallydeposited anthropogenic sulphur and sea salt have declined. Weconclude that acid deposition to these ecosystems has been par-tially buffered by changes in organic acidity and that the rise inDOC is integral to recovery from acidification. Over recent dec-ades, deposition-driven increases in organic matter solubility mayhave increased the export of DOC to the oceans, a potentiallyimportant component of regional carbon balances11. The increasein DOC concentrations in these regions appears unrelated to otherclimatic factors.
A number of national monitoring programmes, designed to assessthe effects of acid emission reductions on acid-sensitive lakes andstreams, have reported increases in DOC concentrations over the pasttwo decades2,4,9. Many monitoring networks were initiated in the late1980s, and our analysis focuses on the period 1990–2004 to maximizegeographical coverage. Over this period, sulphur deposition fellsharply in most regions2. Simultaneously, sea salt deposition to somecoastal regions of northwestern Europe declined, following pro-longed exceptionally stormy conditions in the early 1990s (ref. 12).
The geographical extent of recorded DOC increases suggests acommon dominant driver, and highlights the need for a large-scaleinter-regional analysis of time series data1. We examined the spatialdistribution of DOC trends in data collected in glaciated regions ofsix North European and North American countries, and assessed themechanisms capable of explaining observed patterns.
Our trend results are consistent with previous reports of DOCincreases in surface waters on glaciated, acid-sensitive terrain inEurope and North America (Fig. 1; also see SupplementaryInformation). Upward slopes (n 5 363) outnumbered downwardslopes (n 5 139), and 88% of significant trends (P , 0.05) were pos-itive. Upward slopes were most frequently significant in the SouthernNordic region (below 62u latitude), in the UK, and in the northeast-ern USA. Between 1990 and 2004, sulphur and/or chloride depos-ition declined in these regions as a result of reductions in sulphuremissions (all areas) and in the severity of coastal storms, respect-ively. The majority of DOC records in the northern Nordic region,and in Ontario/Quebec, also showed positive slopes, although fewerof these were significant (P , 0.05). Atlantic Canada was the onlyregion with little evidence of increasing DOC.
We found that relative change in DOC (that is, DOC change per yearas a percentage of the site median, or %DDOC) was strongly and inver-sely related to change in both sulphate concentration (DSO4
22) andchloride concentration (DCl2) (n 5 522; Fig. 2). Surface water SO4
22
and Cl2 concentrations in these northern ecosystems are generallyhighly correlated with concentrations of these ions in deposition, andcan serve as surrogates for site-specific measurements of SO4
22 and Cl2
deposition13 (see Methods Summary). While falling SO422 dominated
most records, large DOC increases occurred in some coastal locationswhere DSO4
22 was small, provided that DCl2 was strongly downward.Increased sea salt deposition appeared to be critical in explaining theunusual DOC declines in some parts of Atlantic Canada (Fig. 1).
To explore potential factors affecting the %DDOC, we performed aforward-selection stepwise regression that included variables repre-senting both trend results (annual slopes) and median values ofkey chemical and regional temperature parameters (see MethodsSummary). DSO4
22 and DCl2 were selected, along with mediannon-marine Ca21 1 Mg21 concentration (CaMg*, representingcatchment sensitivity to acidification), and an interaction term(DCl2 3 CaMg*) (Table 1). All four variables were highly significant,and explained 39.3% of the variance in %DDOC. Given the uncer-tainties surrounding trend estimation, and the influence of inevitablelocal and sub-regional factors on DOC trends at individual sites, theexplanatory power of this single multi-regional model is considerable.
Residuals from our model support the idea that recent widespreadDOC changes are related to changes in the atmospheric deposition ofSO4
22 and Cl2 across large areas (Fig. 3). The UK was the only regionwhere the median of residuals was significantly different from zero,perhaps because the true trend in SO4
22 deposition for UK sites was
*These authors contributed equally to this work.{Deceased.
1Environmental Change Research Centre, UCL, London, WC1E 6BT, UK. 2US EPA, Corvallis, Oregon 97333, USA. 3Centre for Ecology and Hydrology, Bangor, LL57 2UW, UK.4Norwegian Institute for Water Research, N-0349 Oslo, Norway. 5Finnish Environment Institute, PO Box 140, FI-00251 Helsinki, Finland. 6Department of Environment AssessmentSLU, SE-75007 Uppsala, Sweden. 7Environment Canada, Burlington, Ontario, L7R4A6, Canada. 8Ontario Ministry of the Environment, Laurentian University, Sudbury, Ontario, P3E2C6, Canada. 9Biology Centre, Institute of Hydrobiology, 37005 Ceske Budejovice, Czech Republic. 10Czech Geological Survey, 152 00 Prague, Czech Republic.
Vol 450 | 22 November 2007 | doi:10.1038/nature06316
537Nature ©2007 Publishing Group

underestimated (owing to short-term adsorption of SO422 during
heightened sea salt deposition in the early 1990s in this region, themost maritime in the data set12). The model can account entirely forthe average slight negative DOC trend in Atlantic Canada, the smallaverage increases in the northeastern USA, Ontario/Quebec andnorthern Nordic regions and the large average increase in the southernNordic region. The approximately even distribution of residualsaround the median for each region suggests that much of the residualvariance is of a local or random, rather than systematic, nature (Fig. 3).
A number of other factors are known to influence short-term vari-ation in DOC concentration in surface waters, and some of those thathave undergone recent change have been proposed to explain long-term DOC trends3–7,14,15. None of these factors, however, exhibit spa-tial patterns that are consistent with the patterns of DOC change thatwe observe (Fig. 1 and Supplementary Information). For example,recent data from rivers in the UK16, the eastern USA17, Norway18,Canada19 and Finland20 provide no evidence for trends in seasonalor annual hydrology that are spatially consistent with the distributionof DOC trends. We could not use runoff chemistry to assess theinfluence of changing nitrogen (N) deposition on DOC trends,because atmospheric N is retained strongly in most catchments andis thus non-conservative. Although N is certainly accumulating inmany ecosystems, both the amounts of N deposition, and temporaltrends in N deposition and runoff, are highly variable across oursites21. In our data set, only 28 sites showed significant (P , 0.05)increases in nitrate concentration (indicative of possible nitrogen sat-uration), 100 showed declines and 394 showed no trend. We found noindication of trends in seasonal or annual air temperatures acrossnorthern Europe during the period 1990–2004, with the exceptionof Scotland (autumn only) and northern and eastern Finland (sum-mer only). Upward temperature trends were more widespread ineastern North America, but occurred in regions where there was nodominant DOC tendency. Although CO2 concentrations are increas-ing globally, they cannot simultaneously explain both the upward anddownward trends in DOC we observe in different regions. Finally,there have been no consistent land-use changes across all regions.
Changes in the chemistry of atmospheric deposition, therefore,provided the only regionally consistent explanation for widespreadupward trends in surface water DOC concentrations. A comparison ofthe relative effects of non-marine (that is, anthropogenic) SO4
22 andthe combined effects of Cl2 and marine SO4
22, using the coefficientsfrom our model, showed that, on average, the reduction in anthro-pogenic SO4
22 was responsible for .85% of the total anion effect on%DDOC in all regions other than the UK (where anthropogenic andmarine effects were similar) and Atlantic Canada (where marineeffects dominated) (see Supplementary Information). However, theselection ofDCl2 in the model, with a coefficient of similar magnitudeto that for DSO4
22, is suggestive of common soil processes.Atmospheric deposition can affect soil organic matter (SOM) solu-
bility through at least two mechanisms—by changing either the acidityof soils or the ionic strength of soil solutions, or both. Acid depositionand sea salt can exert similar short-term effects on both processes.Krug and Frink22 originally proposed that increasing the pH of base-poor soils should increase SOM solubility. Although their premise—that surface water acidification would be minimized by the resultingsubstitution of mineral acids for organic acids—has been widely dis-proved, SOM solubility has since been linked to soil pH in labor-atory23,24 and field23,25 studies; soil equilibrium models26 now includethe pH dependence of SOM solubility. Soil pH also determines thesolubility of aluminium which, when released during the process ofsoil acidification, can bind with organic molecules, neutralising high-affinity binding-sites and thereby triggering SOM coagulation27.
Declining acid deposition and, in a minority of sites, a decline in thefrequency and intensity of sea salt episodes may affect DOC concen-trations both directly, by increasing soil pH, and indirectly, by redu-cing aluminium mobilisation. The selection of CaMg*, an indicator ofacid sensitivity in our multiple regression model (Table 1), providessome support for this soil pH/DOC solubility mechanism.
A second mechanism involves the effect of ionic strength on thecoagulation of DOC. Decreasing inputs of acidic deposition or sea saltshould lead to lower concentrations of a suite of multivalent ions foundin soil solution—including SO4
22, Ca21, Mg21 and aluminium—that
SwedenFinland
Norway
UnitedKingdom
Arctic circle
Prim
e m
erid
ian
60º N
70º N
10º E10º W 20º E 30º E
50º N
Change in DOC(mg l–1 yr–1)
Not significantSignificant
Canada
United States
NY
PANJ
VTNH
MACT RI
MN
OH
MI
OntarioQuebec
New Brunswick
Nova Scotia
Newfoundland
40º N
50º N
LakeHuron
Lake Erie
Lake Ontario
60º W70º W
<0.000.00–0.020.02–0.15>0.15
Figure 1 | Trends in dissolved organic carbon(mg l21 yr21). Data are shown for monitoringsites on acid-sensitive terrain in Europe (upperpanel) and North America (lower panel) for theperiod 1990–2004.
LETTERS NATURE | Vol 450 | 22 November 2007
538Nature ©2007 Publishing Group

exert a large influence on ionic strength. Previous studies have shownthat increasing the ionic strength of soil solutions reduces the rate ofDOC flux26,28; conversely, a reduction in ionic strength (for example,through decreasing atmospheric deposition) should lead to a DOCincrease. The selection of CaMg* in our model may also be relevanthere, because the ionic strength of the soil solution in catchmentswhere CaMg* is low should be more sensitive to change in the depos-ition of these ions.
Evidence for our conclusions thus derives from three lines of sup-port: (1) a plausible mechanism; (2) experimental studies showing
that our proposed mechanism is capable of causing the observedDOC response; and (3) temporal and spatial coherence of both the‘cause’ (changing atmospheric deposition) and the ‘effect’ (changingDOC levels). Our results provide the first clear, large-scale demon-stration that DOC concentrations are sensitive to changes in aciddeposition, and, therefore, that declining surface water acidity(mediated by decreasing acid deposition) is being partially offset byincreasing organic acidity. Furthermore, they suggest that DOCfluxes from these regions to the oceans may be returning to levelsmore typical of pre-industrial times.
In maritime northwestern Europe, both SO422 and Cl2 have fallen
over the 1990–2004 period, but for unrelated reasons. Sea salt depos-ition varies due to meteorological factors that affect Atlantic stormi-ness, such as the North Atlantic Oscillation12, producing roughlydecadal oscillations. Trends in SO4
22 deposition, on the other hand,have operated over much longer timescales and are similar to those inother regions covered by this study. Rates of sulphur depositionbegan rising in the mid- to late 1800s, peaked in the 1970s, and havesubsequently fallen. At timescales greater than decades, long-termtrends in DOC will be controlled by changes in sulphate deposition,even in regions subject to large sea salt inputs.
Although acid deposition has affected large parts of Europe andNorth America, it has not been a global phenomenon. These findingsemphasize, therefore, that evidence of rising DOC in these (well-studied) areas should not be misconstrued as evidence of rising DOC
10
5
–5
–10
10c
5
–5
–10
–20 –15 –10 –5 5 10
–20 –15 –10 –5 5 10
–20
Cha
nge
in D
OC
(% y
r–1 )
Cha
nge
in D
OC
(% y
r–1 )
Change in Cl– (µeq l–1 yr–1)
Change in SO42– (µeq l–1 yr–1)
Change in SO42– + Cl– (µeq l–1 yr–1)
Cha
nge
in D
OC
(% y
r–1 )
–15 –10 –5 5 10
10
a
b
5
–5
–10
Figure 2 | Relationship between %DDOC, DSO422 and DCl2 and the
equivalent sum of DSO422 and DCl2, used as surrogates for changes in
atmospheric deposition. a,DSO422; b,DCl2; c,DSO4
22 andDCl2. Symbolsrepresent data from Canada (dark blue circles), Finland (yellow circles),Norway (red circles), Sweden (light blue circles), the UK (grey triangles) andthe USA (black triangles).
Table 1 | Results of stepwise multiple regression for %DDOC
Variable Estimate P Cumulative R2
Intercept 0.250 0.0004 NAChange in SO
4
22 (meq l21 yr21) 20.557 ,0.0001 0.237
Median CaMg* (meq l21) 20.005 ,0.0001 0.316
Change in Cl2 (meq l21 yr21) 20.504 ,0.0001 0.360
Median CaMg* (meq l21) 3 changein Cl2 (meq l21 yr21)
0.0033 ,0.0001 0.393
See Methods Summary. Estimates for intercept and slope of individual relationships are forthe final three variable plus one interaction model. NA, not applicable. meq, microequivalents.*Sea-salt-corrected divalent cation concentration.
*****
***
***
******
**n.s.
n.s. n.s. n.s. n.s.
DOC change (% yr–1)Residual DOC change
Ontar
io/Que
bec
North
easte
rn U
SA
Atlant
ic Can
ada
United
King
dom
South
ern
Nordic
North
ern
Nordic
8
6
4
2
Ab
solu
tes
or r
esid
ual s
lop
e (%
yr–
1 )
0
–2
–4
Figure 3 | Distributions of %DDOC and residuals from multiple regression,by region. Boxplots are of regional distributions of D%DOC per year(unshaded boxes) and residuals calculated from a multiple regressionpredicting D%DOC from DSO4
22, DCl2, median CaMg* concentration andthe interaction term DCl2 3 CaMg* (grey boxes). Symbols within boxesindicate significance of the one-sample median test of Ho: median 5 0(***P , 0.001; **P , 0.01; not significant P . 0.05). Boundaries of boxesindicate interquartile range (25th to 75th percentiles) and median value(midline); whiskers indicate 10th and 90th percentiles and symbols indicate5th and 95th percentiles. Residual values centre around zero for all regions,with the possible exception of the UK, indicating that the regression modelbuilt on all data reliably explains the tendency for D%DOC concentrationsto deviate from zero in the separate regions.
NATURE | Vol 450 | 22 November 2007 LETTERS
539Nature ©2007 Publishing Group
in unmonitored waters globally. They also suggest that threats of wide-spread destabilization of terrestrial carbon reserves by gradual rises in airtemperature or CO2 concentration3–5 may have been overstated. Thereis, however, a clear need for closer integration of research into pollutantand climatic impacts on terrestrial carbon dynamics. An improvedunderstanding of the roles of both, and their interactions, is requiredto predict future surface water quality accurately, and to determinecrucially important linkages between climate and the carbon cycle.
METHODS SUMMARYWater chemistry data were collated from several regional and national monitoring
initiatives for the period 1990–2004. Records represent mostly headwater lakes
and lower-order streams that are largely free of local disturbance, other than
potential effects of forestry and rough grazing practices. Data were analysed for
trends by the Mann–Kendall test29, with slopes estimated by the Sen estimator30.
Site-specific deposition estimates were not available for most of the surface
water monitoring sites, so we used changes in measured surface water concen-
trations of SO422 (DSO4
22) and Cl2 (DCl2), as deposition surrogates. Inputs
and outputs of SO422 rarely balance precisely, but in younger (that is, glaciated)
northern ecosystems the two are generally highly correlated13.
Regional trends in seasonal (that is, mean December–February, March–May,
June–August and September–November) and annual air temperature were deter-
mined from CRUTEM2 simulated air temperature anomaly data from the
Climate Research Unit, University of East Anglia (http://www.cru.uea.ac.uk/
cru/data/tem2/). These data are compiled in a 5u3 5u global grid, so several
monitoring sites may be associated with a single, grid-based estimate of temper-
ature change over the 1990–2004 time period relative to the 1961–1990 average.
To determine factors influencing %DDOC at the regional scale, we conducteda stepwise multiple regression using, for each site, both trend results (annual
slopes) and median values of key chemical variables (SO422, non-marine SO4
22,
Cl2, NO32, H1, acid-neutralizing capacity, Gran alkalinity, base cations, CaMg*
and aluminium), together with slopes for annual and seasonal temperature
anomalies for the representative 5u grid square for each site. In an initial run,
DSO422, DCl2 and CaMg* were the only variables selected. Because sites with
declining DSO422 and DCl2 dominated the data set, the negative coefficient for
CaMg* (Table 1) suggested that the DOC response to declining anion concen-
trations was greatest in the most acid-sensitive systems. We therefore introduced
an additional interaction term (DCl2 3 CaMg*) to account for the potentially
dampening effect of larger base cation concentrations on negative DOC trends at
a minority of sites at which DCl2 had increased.
Full Methods and any associated references are available in the online version ofthe paper at www.nature.com/nature.
Received 22 December 2006; accepted 24 September 2007.
1. Roulet, N. & Moore, T. R. Browning the waters. Nature 444, 283–284 (2006).2. Skjelkvale, B. L. et al. Regional scale evidence for improvements in surface water
chemistry 1990–2001. Environ. Pollut. 137, 165–176 (2005).3. Worrall, F., Burt, T. & Shedden, R. Long term records of riverine dissolved organic
matter. Biogeochemistry 64, 165–178 (2003).4. Freeman, C., Evans, C. D., Monteith, D. T., Reynolds, B. & Fenner, N. Export of
organic carbon from peat soils. Nature 412, 785 (2001).5. Freeman, C. et al. Export of dissolved organic carbon from peatlands under
elevated carbon dioxide levels. Nature 430, 195–198 (2004).6. Findlay, S. E. G. Increased carbon transport in the Hudson River: unexpected
consequence of nitrogen deposition? Frontiers Ecol. Environ. 3, 133–137 (2005).7. Garnett, M. H., Ineson, P. & Stevenson, A. C. Effects of burning and grazing on
carbon sequestration in a Pennine blanket bog. Holocene 10, 729–736 (2000).8. Evans, C. D., Chapman, P. J., Clark, J. M., Monteith, D. T. & Cresser, M. S.
Alternative explanations for rising dissolved organic carbon export from organicsoils. Glob. Change Biol. 12, 1–10 (2006).
9. Stoddard, J. L. et al. Response of Surface Water Chemistry to the Clean Air ActAmendments of 1990. Report EPA/620/R-03/001 (US Environmental ProtectionAgency, Washington DC, 2003).
10. Vuorenmaa, J., Forsius, M. & Mannio, J. Increasing trends of total organic carbonconcentrations in small forest lakes in Finland from 1987 to 2003. Sci. TotalEnviron. 365, 47–65 (2006).
11. Siemens, J. The European carbon budget: a gap. Science 302, 1681 (2003).12. Evans, C. D. & Monteith, D. T. Chemical trends at lakes and streams in the UK Acid
Waters Monitoring Network, 1988–2000: Evidence for recent recovery at anational scale. Hydrol. Earth Syst. Sci. 5, 351–366 (2001).
13. Alewell, C., Mitchell, M. J., Likens, G. E. & Krouse, H. R. Sources of stream sulfate atthe Hubbard Brook Experimental Forest. Biogeochemistry 44, 281–299 (1999).
14. Tranvik, I. J. & Jansson, M. Terrestrial export of organic carbon. Nature 415,861–862 (2002).
15. Hejzlar, J., Dubrovsky, M., Buchtele, J. & Ruzicka, M. The apparent and potentialeffects of climate change on the inferred concentration of dissolved organicmatter in a temperate stream (the Malse River, South Bohemia). Sci. Total Environ.310, 142–152 (2003).
16. Evans, C. D., Monteith, D. T. & Cooper, D. M. Long-term increases in surface waterdissolved organic carbon: Observations, possible causes and environmentalimpacts. Environ. Pollut. 137, 55–71 (2005).
17. Zhu, Y. & Day, R. L. Analysis of streamflow trends and the effects of climate inPennsylvania, 1971 to 2001. J. Am. Water Resour. Assoc. 41, 1393–1405 (2005).
18. de Wit, H. A., Hindar, A. & Hole, L. Winter climate affects long-term trends instream water nitrate in acid-sensitive catchments in southern Norway. Hydrol.Earth Syst. Sci. 4, 3055–3085 (2007).
19. Whitfield, P. H. & Cannon, A. J. Recent variations in climate and hydrology inCanada. Can. Water Resour. J. 25, 19–65 (2000).
20. Hyvarinen, V. Trends and characteristics of hydrological time series in Finland.Nordic Hydrol. 34, 71–90 (2003).
21. Wright, R. F. et al. Trends in nitrogen deposition and leaching in acid-sensitivestreams in Europe. Hydrol. Earth Syst. Sci. 5, 299–310 (2001).
22. Krug, E. C. & Frink, C. R. Acid rain on acid soil: a new perspective. Science 221,520–525 (1983).
23. Clark, J. M., Chapman, P. J., Heathwaite, A. L. & Adamson, J. K. Suppression ofdissolved organic carbon by sulphate induced acidification during simulateddroughts. Environ. Sci. Technol. 40, 1776–1783 (2006).
24. de Wit, H. A., Groseth, T. & Mulder, J. Predicting aluminum and soil organic mattersolubility using the mechanistic equilibrium model WHAM. Soil Sci. Soc. Am. J. 65,1089–1100 (2001).
25. Vogt, R. D., Ranneklev, S. B. & Mykkelbost, T. C. The impact of acid treatment onsoilwater chemistry at the HUMEX site. Environ. Int. 3, 277–286 (1994).
26. Tipping, E. & Hurley, M. A. A model of solid-solution interactions in acid organicsoils, based on the complexation properties of humic substances. J. Soil Sci. 39,505–519 (1988).
27. Tipping, E. & Woof, C. The distribution of humic substances between the solid andaqueous phases of acid organic soils; a description based on humic heterogeneityand charge-dependent sorption equilibria. J. Soil Sci. 42, 437–448 (1991).
28. Evans, A. Jr, Zelazny, L. W. & Zipper, C. E. Solution parameters influencingdissolved organic carbon levels in three forest soils. Soil Sci. Soc. Am. J. 52,1789–1792 (1988).
29. Sokal, R. R. & Rohlf, F. J. Biometry 532–538 (W. H. Freeman, San Francisco, 1969).30. Sen, P. K. On a class of aligned rank order tests in two-way layouts. Ann. Math.
Stat. 39, 1115–1124 (1968).
Supplementary Information is linked to the online version of the paper atwww.nature.com/nature.
Acknowledgements We thank the LRTAP Working Group on Effects and the EU6th Framework Programme Euro-limpacs for support in the production andanalysis of international, quality-controlled, comparable data. We alsoacknowledge the work of the ICP Waters Programme Centre at the NorwegianInstitute of Water Research (NIVA), where the data were collated, verified andarchived. The authors are indebted to many colleagues and organisations whoprovided data for this assessment, including: T. A. Clair, S. Couture, C. Gagnon,D. K. McNicol, R. C. Weeber, A. Paterson (Canada); J. S. Kahl, J. Kellogg, K. Roy,M. R. Hale, D. R. DeWalle (USA); the Finnish Environment Institute (SYKE) andRegional Environment Centres; the Norwegian Institute of Water Research(NIVA); the Swedish Environmental Protection Agency (Naturvardsverket); andthe UK Acid Waters Monitoring Network (supported by the Department forEnvironment Food and Rural Affairs) and supporting laboratories at: FisheriesResearch Services, Pitlochry; Centre for Ecology and Hydrology, Wallingford; andthe Environment Agency Llanelli. The information in this document has beenfunded in part by the US Environmental Protection Agency. It has been subjected toreview by the National Health and Environmental Effects Research Laboratory, andapproved for publication. Approval does not signify that the contents reflect theviews of the Agency, nor does mention of trade names or commercial productsconstitute endorsement or recommendation for use.
Author Contributions D.T.M. and J.L.S. formulated the working hypothesis andanalysed and interpreted the trend data. C.D.E. and H.A.d.W. contributed to thedevelopment of the hypothesis, assisted in the interpretation of the data, providedadditional text and edited the manuscript. M.F., T.H., A.W., B.L.S., D.S.J., B.K. and J.Vuorenmaa provided data and commented on the text. J.K. provided advice andideas on processes and contributed data from the Czech Republic (not included inthe final analysis due to number and length of time series) consistent with thehypothesis. J. Vesely contributed advice, ideas and data in the early stages ofdevelopment of our work.
Author Information Reprints and permissions information is available atwww.nature.com/reprints. Correspondence and requests for materials should beaddressed to D.T.M. ([email protected]).
LETTERS NATURE | Vol 450 | 22 November 2007
540Nature ©2007 Publishing Group
METHODSData were drawn from a number of monitoring programmes with varying sam-
pling protocols. Data for streams were accepted only if these represented mul-
tiple samples per year, while single annual samples for lakes were included
provided these were collected in the same season for individual lakes. Analysis
was restricted to sites with, at a minimum, annual measurements for ten of the 15
years between 1990 and 2004. Data for sites with more frequent sampling were
reduced to one representative observation per year, by estimating annual mean
values.
Given the multiple sources, all data were subjected to rigorous quality assur-
ance. In addition to standard quality assurance procedures (for example, charge
balance, calculated versus measured conductivity), we also examined the data for
evidence of road salt inputs (by comparing Cl2 concentration to distance from
the coast), or catchment sources of SO422, either of which could produce anom-
alous trends. We eliminated a handful of sites (n 5 15) for which the SO422
trends could not be attributed to changing deposition (that is, the surface waterDSO4
22 was more than three times the estimated deposition DSO422) and data
from sites on older soils (for example, the southern Appalachian region of the
US) where high levels of SO422 adsorption lead to non-conservative behaviour.
We also restricted our analysis to sites where DOC concentrations were sufficient
to allow reliable quantification of trends; sites with median DOC concentrations
of ,1 mg l21 were excluded from our analyses. Our final data set comprised
estimates of trends and mean concentrations for chemical and air temperature
parameters for 522 sites.
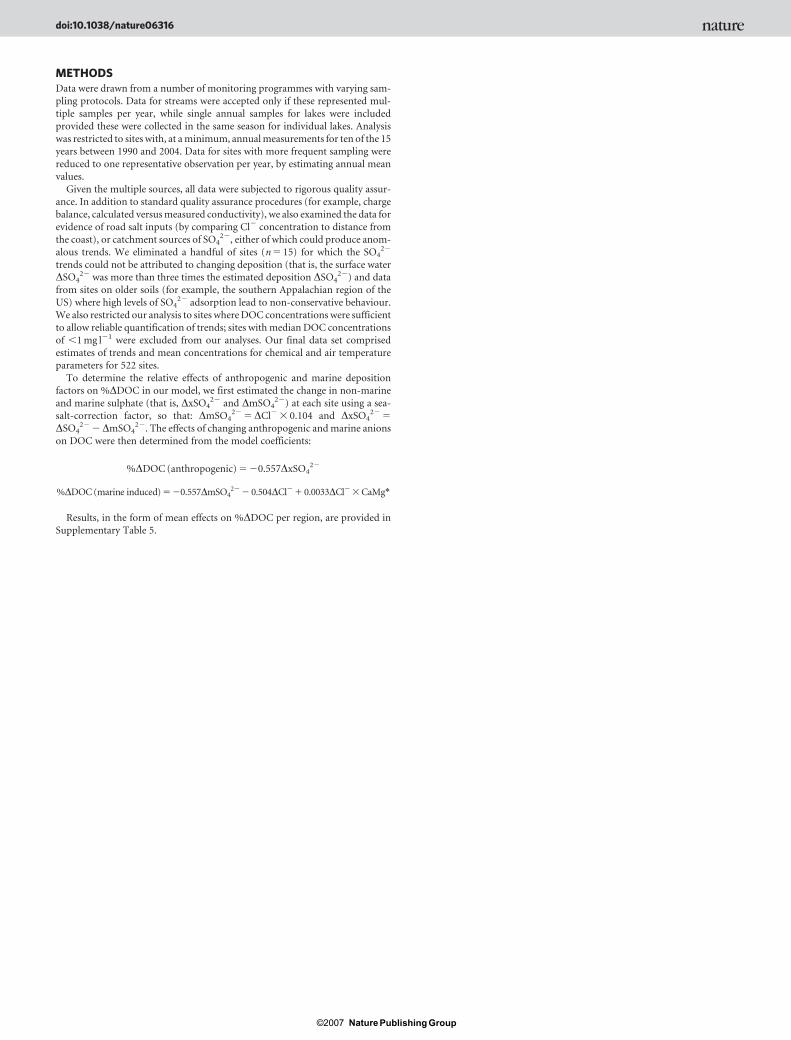
To determine the relative effects of anthropogenic and marine deposition
factors on %DDOC in our model, we first estimated the change in non-marine
and marine sulphate (that is, DxSO422 and DmSO4
22) at each site using a sea-
salt-correction factor, so that: DmSO422 5DCl2 3 0.104 and DxSO4
22 5
DSO422 2DmSO4
22. The effects of changing anthropogenic and marine anions
on DOC were then determined from the model coefficients:
%DDOC (anthropogenic) 5 20.557DxSO422
%DDOC (marine induced) 5 20.557DmSO422 2 0.504DCl2 1 0.0033DCl2 3 CaMg*
Results, in the form of mean effects on %DDOC per region, are provided in
Supplementary Table 5.
doi:10.1038/nature06316
Nature ©2007 Publishing Group