dissolved organic carbon dynamics and controls of planted slash pine forest soil in subtropical...
TRANSCRIPT
BioOne sees sustainable scholarly publishing as an inherently collaborative enterprise connecting authors, nonprofit publishers, academic institutions,research libraries, and research funders in the common goal of maximizing access to critical research.
Dissolved Organic Carbon Dynamics and Controls of Planted Slash Pine ForestSoil in Subtropical Region in Southern ChinaAuthor(s): Chu Ying, Wang Shaoqiang, Wang Jingyuan, Matthias Peichl and Samereh FalahatarSource: Journal of Resources and Ecology, 4(2):105-114. 2013.Published By: Institute of Geographic Sciences and Natural Resources Research, Chinese Academy ofSciencesDOI: http://dx.doi.org/10.5814/j.issn.1674-764x.2013.02.002URL: http://www.bioone.org/doi/full/10.5814/j.issn.1674-764x.2013.02.002
BioOne (www.bioone.org) is a nonprofit, online aggregation of core research in the biological, ecological,and environmental sciences. BioOne provides a sustainable online platform for over 170 journals and bookspublished by nonprofit societies, associations, museums, institutions, and presses.
Your use of this PDF, the BioOne Web site, and all posted and associated content indicates your acceptance ofBioOne’s Terms of Use, available at www.bioone.org/page/terms_of_use.
Usage of BioOne content is strictly limited to personal, educational, and non-commercial use. Commercialinquiries or rights and permissions requests should be directed to the individual publisher as copyright holder.
J. Resour. Ecol. 2013 4 (2) 105-114 DOI:10.5814/j.issn.1674-764x.2013.02.002www.jorae.cn
June, 2013 Journal of Resources and Ecology Vol.4 No.2
Received: 2013-01-14 Accepted: 2013-04-23Foundation: this work is supported by the Key Project of CAS Knowledge Innovation (KZCX2-YW-QN301), the National Key Basic Research and
Development Program (2010CB833503), the “Strategic Priority Research Program” of the Chinese Academy of Sciences (XDA05050602-1) and the National Natural Science Foundation of China (No.31070438).
* Corresponding author: WANG Shaoqiang. Email: [email protected].
Dissolved Organic Carbon Dynamics and Controls of Planted Slash Pine Forest Soil in Subtropical Region in Southern China
CHU Ying1,2,5, WANG Shaoqiang1*, WANG Jingyuan1, Matthias PEICHL3 and Samereh FALAHATAR4
1 Key Laboratory of Ecosystem Network Observation and Modeling, Institute of Geographic Sciences and Natural Resources Research, CAS, Beijing 100101, China;
2 Institute of Metrological Administration and Strategic Planning, National Institute of Metrology, AQSIQ, Beijing 100013, China; 3 Swedish University of Agricultural Sciences, Department of Forest Ecology and Management, SE-901 83 Umeå, Sweden;4 Natural Resources Faculty of Tarbiat Modares University, Noor, Mazandaran, Iran;5 University of Chinese Academy of Sciences, Beijing 100049, China
Abstract:
Key words:
Journal of Resources and Ecology Vol.4 No.2, 2013106
1 IntroductionDissolved organic carbon (DOC) is often defined as organic molecules that can pass through a filter of 0.45μm (Kalbitz et al. 2000). As a linkage of terrestrial ecosystems and aquatic environments, DOC plays a significant role in biogeochemical cycle of carbon (C) and nutrients including nitrogen (N) and phosphorus (P) as well as soil formation and transport of pollutants (Kalbitz et al. 2000; Michalzik et al. 2001; Neff and Asner 2001; Fröberg et al. 2006; Peichl et al. 2007). Generally observed DOC concentrations and fluxes result from release processes such as leaching and desorption, and removing processes such as biodegradation and adsorption (Kalbitz et al. 2000; Yang et al. 2003).Due to the contradictory results from lab study and field investigation, there is still much uncertainty about the controls on DOC concentrations and fluxes (Kalbitz et al. 2000). The physical and biogeochemical factors controlling DOC change with environmental conditions, resulting in difficulties in determining DOC controls and predicting DOC production and consumption (Kalbitz et al. 2000; Neff and Asner 2001). Some important factors on DOC include solar radiation and temperature, soil temperature and moisture, availability of N, iron (Fe) and aluminium (Al), soil pH, C/N ratio, amount and quality of organic matter, and land use and management effects (Kalbitz et al. 2000; Michalzik et al. 2001; Neff and Asner 2001; Harrison et al. 2008).
The forest ecosystem of red soil hilly region in Southern China suffered serious damage at the end of 1970s and at the beginning of 1980s of last century. Restoration efforts on the red soil ecosystem have started since the mid of 1980s. A series of studies on carbon cycle including carbon storage, carbon flux, soil respiration, carbon turnover, and aboveground biomass have been conducted at QFES of Chinese Ecosystem Research Network (CERN) (Wang et al. 2004; Yu et al. 2005; Wen et al. 2006; Wang et al. 2009). However, soil DOC concentration and its controlling factors are still unknown. Considering the large afforested area, about 61.68 million hectares, mostly located in southern China, it is of vital significance to monitor the DOC dynamics, and study its controls.
The objectives of this study are: (i) to determine the soil DOC concentrations and storage on the profile 0–50 cm of planted slash pine forest; (ii) to generalize the characteristics of seasonal variability and profile distribution of DOC concentration and storage; and (iii) to analyze the controlling factors for seasonal variability and vertical distribution of DOC concentration.
2 Material and methods2.1 Study site The s tudy s i te is located in QFES (26°44 ′48″N, 115°04′13″E), CERN, in Jiangxi Province of Southern China. The site is a typical red soil subtropical hilly region, with an elevation of 102 m and Central-Asia subtropical
monsoon climate. The mean annual air temperature, precipitation, solar radiation and frost-free period from 1985–2004 in the QFES are 17.9 , 1485 mm, 4349 MJ m-2 and 323 days, respectively. During the sampling period from Nov. 2007 to Oct. 2010, the monthly mean precipitation of spring, summer, autumn and winter was 83.1, 141.3, 67.3 and 53.5 mm, respectively. The planted tree species are slash pine (Pinus elliottii), masson pine (Pinus massoniana) and Chinese fir (Cunninghamia lanceolata). Before 1983, the original natural forest was destroyed, and soil erosion by water was severe. After plantation the accumulation of carbon has increased largely in this region during more than 20 years and the forest coverage reached 78.81% (Ma et al. 2007). The soil parent materials include sand stone and mud stone in this region and the soil is mainly red land with low water holding capacity. A detailed description of soil properties and stand characteristics of the study site are summarized in Table 1.
2.2 Sample collection and chemical analysis
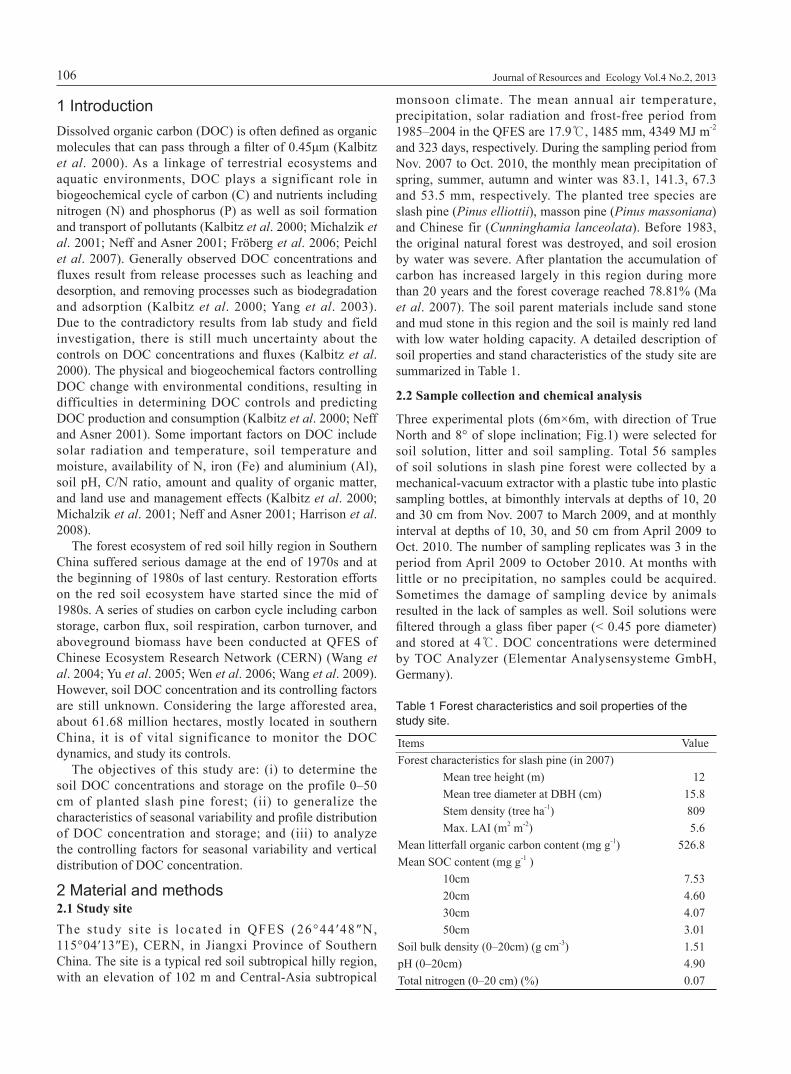
Three experimental plots (6m×6m, with direction of True North and 8° of slope inclination; Fig.1) were selected for soil solution, litter and soil sampling. Total 56 samples of soil solutions in slash pine forest were collected by a mechanical-vacuum extractor with a plastic tube into plastic sampling bottles, at bimonthly intervals at depths of 10, 20 and 30 cm from Nov. 2007 to March 2009, and at monthly interval at depths of 10, 30, and 50 cm from April 2009 to Oct. 2010. The number of sampling replicates was 3 in the period from April 2009 to October 2010. At months with little or no precipitation, no samples could be acquired. Sometimes the damage of sampling device by animals resulted in the lack of samples as well. Soil solutions were filtered through a glass fiber paper (< 0.45 pore diameter) and stored at 4 . DOC concentrations were determined by TOC Analyzer (Elementar Analysensysteme GmbH, Germany).
Table 1 Forest characteristics and soil properties of the study site.
Items ValueForest characteristics for slash pine (in 2007)
Mean tree height (m) 12Mean tree diameter at DBH (cm) 15.8Stem density (tree ha-1) 809Max. LAI (m2 m-2) 5.6
Mean litterfall organic carbon content (mg g-1) 526.8Mean SOC content (mg g-1 )
10cm 7.5320cm 4.6030cm 4.0750cm 3.01
Soil bulk density (0–20cm) (g cm-3) 1.51pH (0–20cm) 4.90Total nitrogen (0–20 cm) (%) 0.07
CHU Ying, et al.: Dissolved Organic Carbon Dynamics and Controls of Planted Slash Pine Forest Soil in Subtropical Region in Southern China 107
Soil samples were collected at bimonthly intervals by method of soil sampling probe at layers of 0–10 cm, 10–30 cm, and 30–50 cm with sampling replicates of 3 from Nov. 2007 to Oct. 2010 to determine pH and SOC content. SOC concentration was determined by method of potassium bichromate-outer heating. The SOC concentrations at 10, 30 and 50 cm were calculated via interpolation.
Samples of forest floor litter were collected by a partitioning layer method of collecting decomposed and half decomposed litter separately from Nov. 2007 to Oct. 2010, to determine their organic carbon content. The number of sampling replicates was 5. The samples of decomposed and half decomposed litter fall were mixed respectively.
Air temperature was monitored with air temperature and relative humidity sensors (Model HMP45C, Vaisala Inc.) and precipitation recorded with a rain gauge (Model 52203,
RM Young, Inc.). Soil temperatures at five depths of 2, 5, 20, 50 and 100 cm were measured with thermocouples (105 T and 107-L, Campbell Scientific Inc.) near the study plot in QFES. Volumetric soil moisture data at depths of 10, 20, 30, 50 cm were collected from QFES, measured by neutron moisture meter CNC503 (DR). Soil temperature and soil moisture at those depths with no observed values were calculated via interpolation from the original data. Soil temperature at 5 cm depth was measured near sampling plots using portable thermocouples (JM 624) and soil moisture at 5 cm depth was measured using a portable TDR (Wang et al. 2009).
The software package Origin 8 was used for all statistics and regression analysis.
3 Results and discussion3.1 Seasonal and profile variability of soil DOC
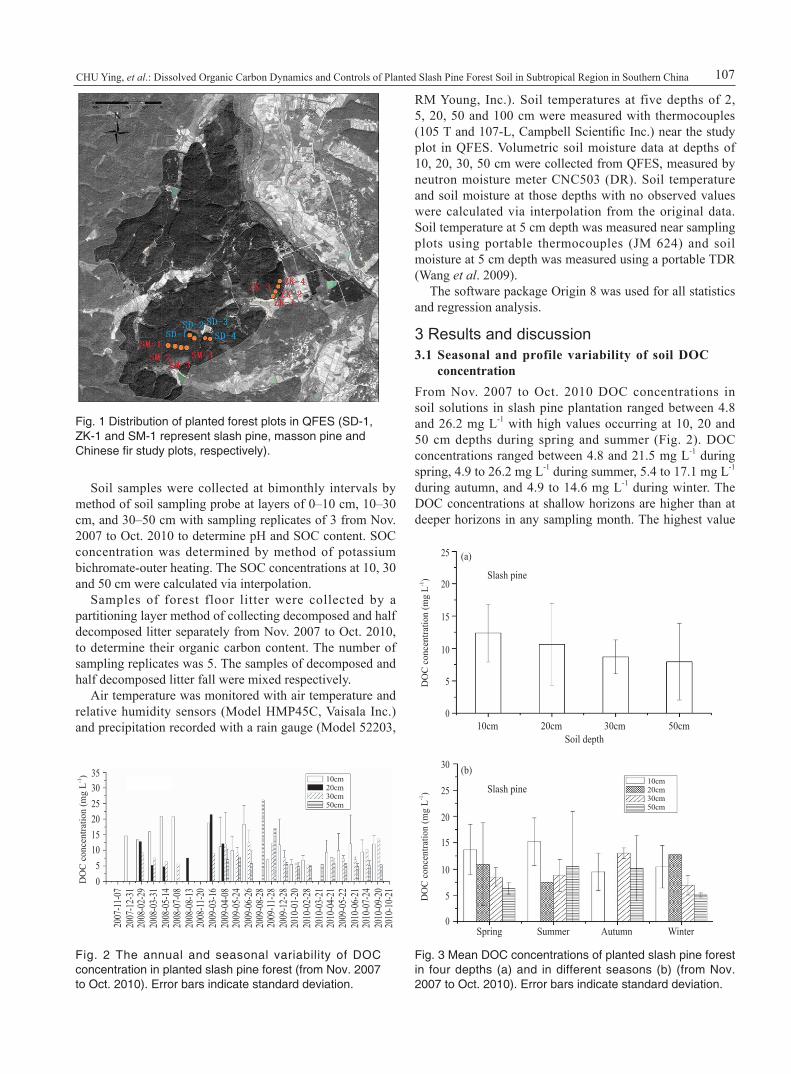
concentrationFrom Nov. 2007 to Oct. 2010 DOC concentrations in soil solutions in slash pine plantation ranged between 4.8 and 26.2 mg L-1 with high values occurring at 10, 20 and 50 cm depths during spring and summer (Fig. 2). DOC concentrations ranged between 4.8 and 21.5 mg L-1 during spring, 4.9 to 26.2 mg L-1 during summer, 5.4 to 17.1 mg L-1 during autumn, and 4.9 to 14.6 mg L-1 during winter. The DOC concentrations at shallow horizons are higher than at deeper horizons in any sampling month. The highest value
Fig. 1 Distribution of planted forest plots in QFES (SD-1, ZK-1 and SM-1 represent slash pine, masson pine and Chinese fir study plots, respectively).
N
Fig. 2 The annual and seasonal variability of DOC concentration in planted slash pine forest (from Nov. 2007 to Oct. 2010). Error bars indicate standard deviation.
Fig. 3 Mean DOC concentrations of planted slash pine forest in four depths (a) and in different seasons (b) (from Nov. 2007 to Oct. 2010). Error bars indicate standard deviation.
0
5
10
20
15
25
30
DO
C c
once
ntra
tion
(mg
L-1)
10cm20cm30cm50cm
Slash pine
(b)
Spring WinterAutumnSummer
05
10
2015
253035
2007
-12-
3120
08-0
2-29
2008
-03-
31
2007
-11-0
7
2008
-05-
1420
08-0
7-08
2008
-08-
13
2009
-03-
1620
09-0
4-08
2009
-05-
24
2008
-11-2
0
2009
-06-
2620
09-0
8-28
2009
-11-2
820
09-1
2-28
2010
-01-
2020
10-0
2-28
2010
-03-
2120
10-0
4-21
2009
-05-
2220
10-0
6-21
2010
-07-
2420
10-0
9-20
DO
C c
once
ntra
tion
(mg
L-1) 10cm
20cm30cm50cm
2010
-10-
21
0
5
10
20
15
25
DO
C c
once
ntra
tion
(mg
L-1)
10cm 50cm30cm20cm
Slash pine
(a)
Soil depth
Journal of Resources and Ecology Vol.4 No.2, 2013108
of DOC concentrations (26.2 mg L-1) occurred at 50 cm depth at the end of August 2008, however due to the limited number of high-valued samples in the same month and at this depth, the highest value occurred could not be taken as seasonal or profile trend.
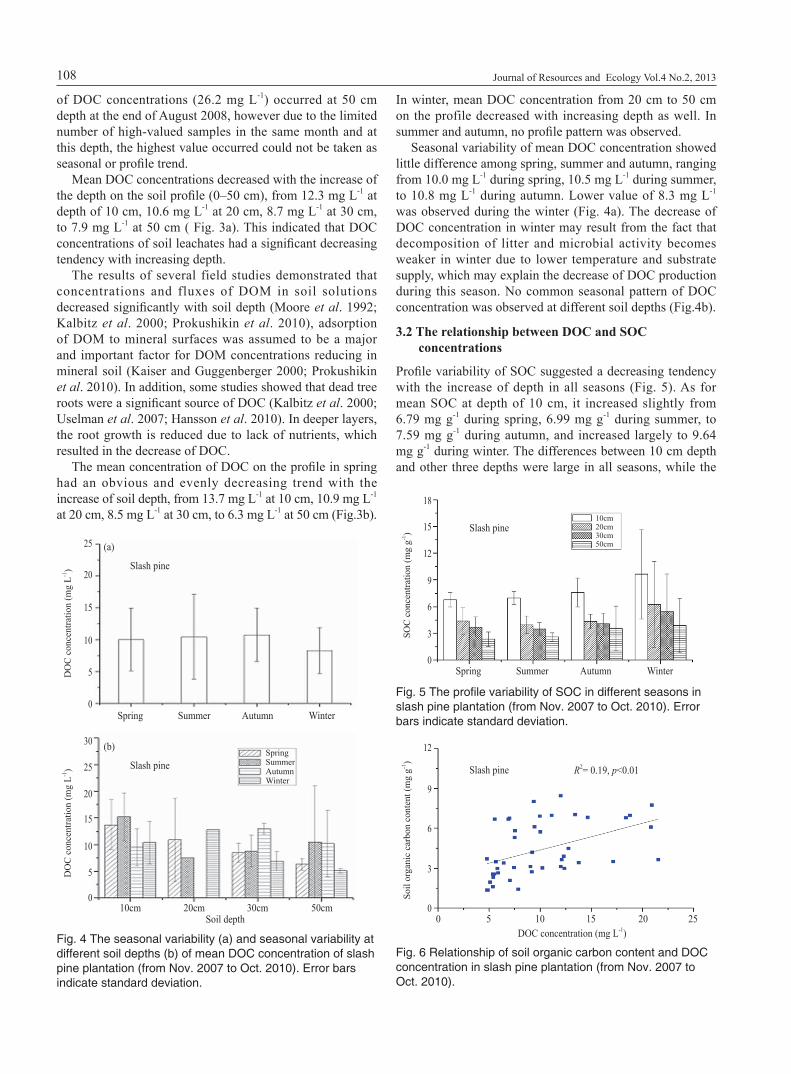
Mean DOC concentrations decreased with the increase of the depth on the soil profile (0–50 cm), from 12.3 mg L-1 at depth of 10 cm, 10.6 mg L-1 at 20 cm, 8.7 mg L-1 at 30 cm, to 7.9 mg L-1 at 50 cm ( Fig. 3a). This indicated that DOC concentrations of soil leachates had a significant decreasing tendency with increasing depth.
The results of several field studies demonstrated that concentrations and fluxes of DOM in soil solutions decreased significantly with soil depth (Moore et al. 1992; Kalbitz et al. 2000; Prokushikin et al. 2010), adsorption of DOM to mineral surfaces was assumed to be a major and important factor for DOM concentrations reducing in mineral soil (Kaiser and Guggenberger 2000; Prokushikin et al. 2010). In addition, some studies showed that dead tree roots were a significant source of DOC (Kalbitz et al. 2000; Uselman et al. 2007; Hansson et al. 2010). In deeper layers, the root growth is reduced due to lack of nutrients, which resulted in the decrease of DOC.
The mean concentration of DOC on the profile in spring had an obvious and evenly decreasing trend with the increase of soil depth, from 13.7 mg L-1 at 10 cm, 10.9 mg L-1 at 20 cm, 8.5 mg L-1 at 30 cm, to 6.3 mg L-1 at 50 cm (Fig.3b).
In winter, mean DOC concentration from 20 cm to 50 cm on the profile decreased with increasing depth as well. In summer and autumn, no profile pattern was observed.
Seasonal variability of mean DOC concentration showed little difference among spring, summer and autumn, ranging from 10.0 mg L-1 during spring, 10.5 mg L-1 during summer, to 10.8 mg L-1 during autumn. Lower value of 8.3 mg L-1 was observed during the winter (Fig. 4a). The decrease of DOC concentration in winter may result from the fact that decomposition of litter and microbial activity becomes weaker in winter due to lower temperature and substrate supply, which may explain the decrease of DOC production during this season. No common seasonal pattern of DOC concentration was observed at different soil depths (Fig.4b).
3.2 The relationship between DOC and SOC concentrations
Profile variability of SOC suggested a decreasing tendency with the increase of depth in all seasons (Fig. 5). As for mean SOC at depth of 10 cm, it increased slightly from 6.79 mg g-1 during spring, 6.99 mg g-1 during summer, to 7.59 mg g-1 during autumn, and increased largely to 9.64 mg g-1 during winter. The differences between 10 cm depth and other three depths were large in all seasons, while the
0
5
10
20
15
25
DO
C c
once
ntra
tion
(mg
L-1) Slash pine
(a)
Spring WinterAutumnSummer
Fig. 4 The seasonal variability (a) and seasonal variability at different soil depths (b) of mean DOC concentration of slash pine plantation (from Nov. 2007 to Oct. 2010). Error bars indicate standard deviation.
0
3
6
12
9
15
18
SOC
con
cent
ratio
n (m
g g-1
)
10cm20cm30cm50cm
Slash pine
Spring WinterAutumnSummer
Fig. 5 The profile variability of SOC in different seasons in slash pine plantation (from Nov. 2007 to Oct. 2010). Error bars indicate standard deviation.
Fig. 6 Relationship of soil organic carbon content and DOC concentration in slash pine plantation (from Nov. 2007 to Oct. 2010).
10cm 50cm30cm20cm0
5
10
20
15
25
30
DO
C c
once
ntra
tion
(mg
L-1)
SpringSummerAutumnWinter
Slash pine
(b)
Soil depth 5 2015100
3
6
9
12
Soil
orga
nic
carb
on c
onte
nt (m
g g-1
)
Slash pine
250
R2= 0.19, p<0.01
DOC concentration (mg L-1)
CHU Ying, et al.: Dissolved Organic Carbon Dynamics and Controls of Planted Slash Pine Forest Soil in Subtropical Region in Southern China 109
differences among 20, 30 and 50 cm in all seasons were much less.
Recent litter and relatively stable organic matter are two main sources of DOC (Kalbitz et al. 2000; Don and Kalbitz 2005; Fröberg et al. 2007). No obvious relationship between DOC concentration and organic carbon content of forest litter was found. Profile variability of DOC (Fig. 3a) and SOC (Fig. 5) concentrations had the same characteristics of decreasing with increasing depth, and there was a positive linear relationship between soil organic carbon (SOC) and DOC concentration (R2=0.19, p<0.01) (Fig. 6), which demonstrated that SOC was a major source of DOC production.
3.3 The profile distribution of DOC storage of slash pine plantation
The DOC storage of each layer of the profile was calculated by the following equation:
DOCD = 10 × DOCi × Mi × Hi
where DOCD is DOC storage (mg m-2), DOCi, Mi and Hi are DOC concentration (mg L-1), soil moisture in volumetric percentage (m3 m-3), height of soil layer i (cm), respectively.
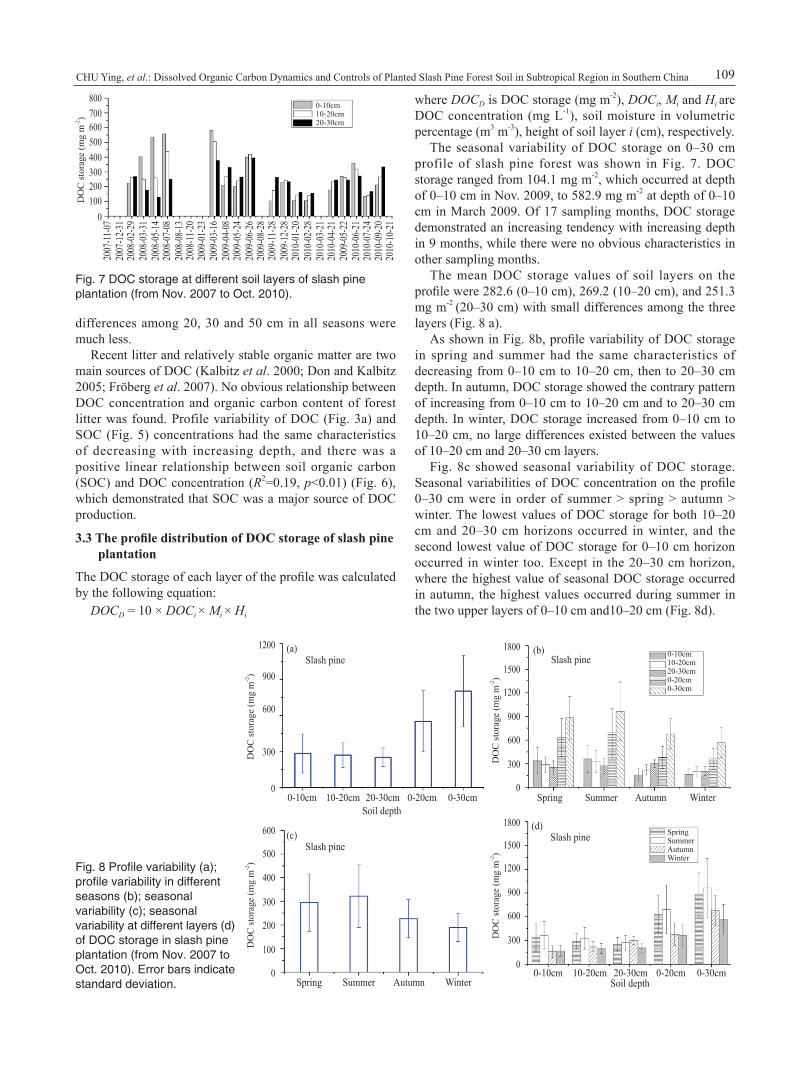
The seasonal variability of DOC storage on 0–30 cm profile of slash pine forest was shown in Fig. 7. DOC storage ranged from 104.1 mg m-2, which occurred at depth of 0–10 cm in Nov. 2009, to 582.9 mg m-2 at depth of 0–10 cm in March 2009. Of 17 sampling months, DOC storage demonstrated an increasing tendency with increasing depth in 9 months, while there were no obvious characteristics in other sampling months.
The mean DOC storage values of soil layers on the profile were 282.6 (0–10 cm), 269.2 (10–20 cm), and 251.3 mg m-2 (20–30 cm) with small differences among the three layers (Fig. 8 a).
As shown in Fig. 8b, profile variability of DOC storage in spring and summer had the same characteristics of decreasing from 0–10 cm to 10–20 cm, then to 20–30 cm depth. In autumn, DOC storage showed the contrary pattern of increasing from 0–10 cm to 10–20 cm and to 20–30 cm depth. In winter, DOC storage increased from 0–10 cm to 10–20 cm, no large differences existed between the values of 10–20 cm and 20–30 cm layers.
Fig. 8c showed seasonal variability of DOC storage. Seasonal variabilities of DOC concentration on the profile 0–30 cm were in order of summer > spring > autumn > winter. The lowest values of DOC storage for both 10–20 cm and 20–30 cm horizons occurred in winter, and the second lowest value of DOC storage for 0–10 cm horizon occurred in winter too. Except in the 20–30 cm horizon, where the highest value of seasonal DOC storage occurred in autumn, the highest values occurred during summer in the two upper layers of 0–10 cm and10–20 cm (Fig. 8d).
Fig. 7 DOC storage at different soil layers of slash pine plantation (from Nov. 2007 to Oct. 2010).
0100200
400300
500600700
2007
-12-
3120
08-0
2-29
2008
-03-
31
2007
-11-0
7
2008
-05-
1420
08-0
7-08
2008
-08-
13
2009
-03-
1620
09-0
4-08
2009
-05-
24
2008
-11-2
0
2009
-06-
2620
09-0
8-28
2009
-11-2
820
09-1
2-28
2010
-01-
2020
10-0
2-28
2010
-03-
2120
10-0
4-21
2009
-05-
2220
10-0
6-21
2010
-07-
2420
10-0
9-20
DO
C st
orag
e (m
g m
-2)
0-10cm10-20cm20-30cm
2010
-10-
21
2009
-01-
23
800
Fig. 8 Profile variability (a); profile variability in different seasons (b); seasonal variability (c); seasonal variability at different layers (d) of DOC storage in slash pine plantation (from Nov. 2007 to Oct. 2010). Error bars indicate standard deviation.
0
100
200
400
300
500
600
DO
C st
orag
e (m
g m
-2)
Slash pine(c)
Spring WinterAutumnSummer
1500Slash pine
(b)
Winter
1800
0
300
600
1200
900
DO
C st
orag
e (m
g m
-2)
Spring AutumnSummer
0-10cm10-20cm20-30cm0-20cm0-30cm
Slash pine(b)
0
300
900
600
1200
DO
C st
orag
e (m
g m
-2)
0-10cm 0-20cm20-30cm10-20cm
Slash pine(a)
0-30cmSoil depth
DO
C st
orag
e (m
g m
-2)
Slash pine(d)
0
300
600
1200
900
1500
1800
0-10cm 0-20cm20-30cm10-20cm 0-30cm
SpringSummerAutumnWinter
Soil depth
Journal of Resources and Ecology Vol.4 No.2, 2013110
3.4 Relationship between DOC concentration and soil temperature
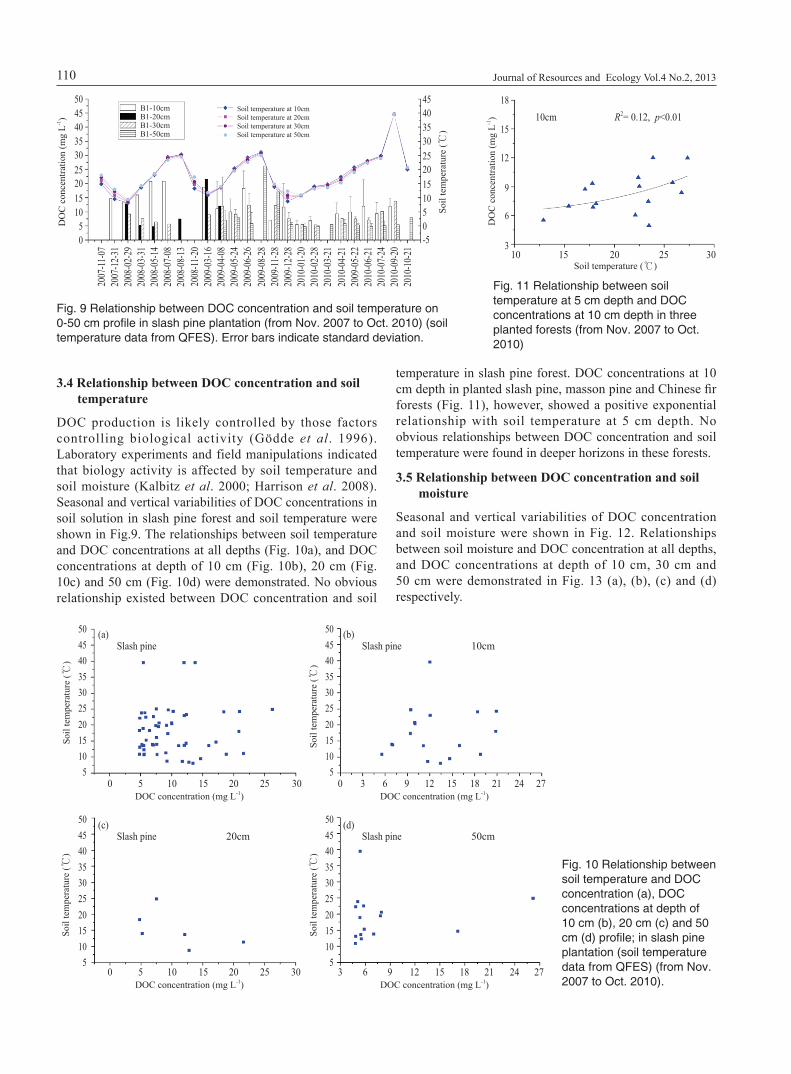
DOC production is likely controlled by those factors controlling biological activity (Gödde et al. 1996). Laboratory experiments and field manipulations indicated that biology activity is affected by soil temperature and soil moisture (Kalbitz et al. 2000; Harrison et al. 2008). Seasonal and vertical variabilities of DOC concentrations in soil solution in slash pine forest and soil temperature were shown in Fig.9. The relationships between soil temperature and DOC concentrations at all depths (Fig. 10a), and DOC concentrations at depth of 10 cm (Fig. 10b), 20 cm (Fig. 10c) and 50 cm (Fig. 10d) were demonstrated. No obvious relationship existed between DOC concentration and soil
temperature in slash pine forest. DOC concentrations at 10 cm depth in planted slash pine, masson pine and Chinese fir forests (Fig. 11), however, showed a positive exponential relationship with soil temperature at 5 cm depth. No obvious relationships between DOC concentration and soil temperature were found in deeper horizons in these forests.
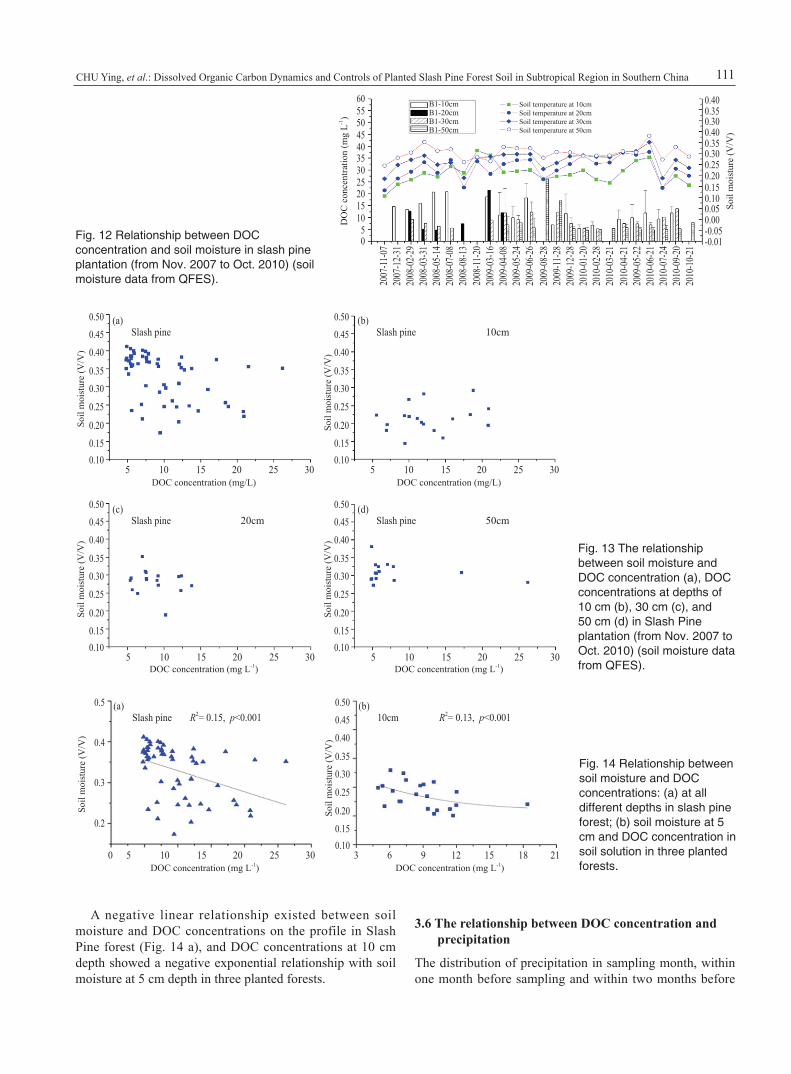
3.5 Relationship between DOC concentration and soil moisture
Seasonal and vertical variabilities of DOC concentration and soil moisture were shown in Fig. 12. Relationships between soil moisture and DOC concentration at all depths, and DOC concentrations at depth of 10 cm, 30 cm and 50 cm were demonstrated in Fig. 13 (a), (b), (c) and (d) respectively.
Fig. 9 Relationship between DOC concentration and soil temperature on 0-50 cm profile in slash pine plantation (from Nov. 2007 to Oct. 2010) (soil temperature data from QFES). Error bars indicate standard deviation.
05
10
2015
253035
2007
-12-
3120
08-0
2-29
2008
-03-
31
2007
-11-0
7
2008
-05-
1420
08-0
7-08
2008
-08-
13
2009
-03-
1620
09-0
4-08
2009
-05-
24
2008
-11-2
0
2009
-06-
2620
09-0
8-28
2009
-11-2
820
09-1
2-28
2010
-01-
2020
10-0
2-28
2010
-03-
2120
10-0
4-21
2009
-05-
2220
10-0
6-21
2010
-07-
2420
10-0
9-20
DO
C c
once
ntra
tion
(mg
L-1)
B1-10cmB1-20cmB1-30cmB1-50cm
2010
-10-
21
404550
0510
2015
2530354045
-5
Soil
tem
pera
ture
()
Soil temperature at 10cmSoil temperature at 20cmSoil temperature at 30cmSoil temperature at 50cm
Fig. 11 Relationship between soil temperature at 5 cm depth and DOC concentrations at 10 cm depth in three planted forests (from Nov. 2007 to Oct. 2010)
Fig. 10 Relationship between soil temperature and DOC concentration (a), DOC concentrations at depth of 10 cm (b), 20 cm (c) and 50 cm (d) profile; in slash pine plantation (soil temperature data from QFES) (from Nov. 2007 to Oct. 2010).
Soil
tem
pera
ture
()
Slash pine(a)
DOC concentration (mg L-1)
510
2015
253035404550
5 201510 250 30
Slash pine(b)
Soil
tem
pera
ture
()
10cm
DOC concentration (mg L-1)12 211815 249 27630
510
2015
253035404550
Soil
tem
pera
ture
()
Slash pine(c)
20cm
510
2015
253035404550
DOC concentration (mg L-1)5 201510 250 30
Soil
tem
pera
ture
()
Slash pine(d)
50cm
510
2015
253035404550
DOC concentration (mg L-1)12 211815 249 2763
3
6
12
9
15
DO
C c
once
ntra
tion
(mg
L-1)
10 252015
10cm
30
18R2= 0.12, p<0.01
Soil temperature ( )
CHU Ying, et al.: Dissolved Organic Carbon Dynamics and Controls of Planted Slash Pine Forest Soil in Subtropical Region in Southern China 111
Fig. 12 Relationship between DOC concentration and soil moisture in slash pine plantation (from Nov. 2007 to Oct. 2010) (soil moisture data from QFES).
05
10
2015
253035
2007
-12-
3120
08-0
2-29
2008
-03-
31
2007
-11-0
7
2008
-05-
1420
08-0
7-08
2008
-08-
13
2009
-03-
1620
09-0
4-08
2009
-05-
24
2008
-11-2
0
2009
-06-
2620
09-0
8-28
2009
-11-2
820
09-1
2-28
2010
-01-
2020
10-0
2-28
2010
-03-
2120
10-0
4-21
2009
-05-
2220
10-0
6-21
2010
-07-
2420
10-0
9-20
DO
C c
once
ntra
tion
(mg
L-1)
B1-10cmB1-20cmB1-30cmB1-50cm
2010
-10-
21
404550
-0.050.000.05
0.150.10
0.200.250.300.350.40
-0.01
Soil
moi
stur
e (V
/V)
Soil temperature at 10cmSoil temperature at 20cmSoil temperature at 30cmSoil temperature at 50cm
5560
0.300.350.40
Fig. 13 The relationship between soil moisture and DOC concentration (a), DOC concentrations at depths of 10 cm (b), 30 cm (c), and 50 cm (d) in Slash Pine plantation (from Nov. 2007 to Oct. 2010) (soil moisture data from QFES).
Soil
moi
stur
e (V
/V)
Slash pine(a)
DOC concentration (mg/L)
0.100.15
0.25
0.20
0.30
0.35
0.40
0.45
0.50
5 201510 25 30
Slash pine(b)
Soil
moi
stur
e (V
/V)
10cm
DOC concentration (mg/L)
0.100.15
0.25
0.20
0.30
0.35
0.40
0.45
0.50
5 201510 25 30
Soil
moi
stur
e (V
/V)
Slash pine(c)
20cm
DOC concentration (mg L-1)
0.100.15
0.25
0.20
0.30
0.35
0.40
0.45
0.50
5 201510 25 30
Soil
moi
stur
e (V
/V)
Slash pine(d)
50cm
DOC concentration (mg L-1)
0.100.15
0.25
0.20
0.30
0.35
0.40
0.45
0.50
5 201510 25 30
Fig. 14 Relationship between soil moisture and DOC concentrations: (a) at all different depths in slash pine forest; (b) soil moisture at 5 cm and DOC concentration in soil solution in three planted forests.
Soil
moi
stur
e (V
/V)
Slash pine(a)
DOC concentration (mg L-1)
0.2
0.3
0.4
0.5
5 201510 25 30
10cm(b)
Soil
moi
stur
e (V
/V)
DOC concentration (mg L-1)
0.100.15
0.25
0.20
0.30
0.35
0.40
0.45
0.50
6 15129 18 21
R2= 0.15, p<0.001 R2= 0.13, p<0.001
0 3
A negative linear relationship existed between soil moisture and DOC concentrations on the profile in Slash Pine forest (Fig. 14 a), and DOC concentrations at 10 cm depth showed a negative exponential relationship with soil moisture at 5 cm depth in three planted forests.
3.6 The relationship between DOC concentration and precipitation
The distribution of precipitation in sampling month, within one month before sampling and within two months before
Journal of Resources and Ecology Vol.4 No.2, 2013112
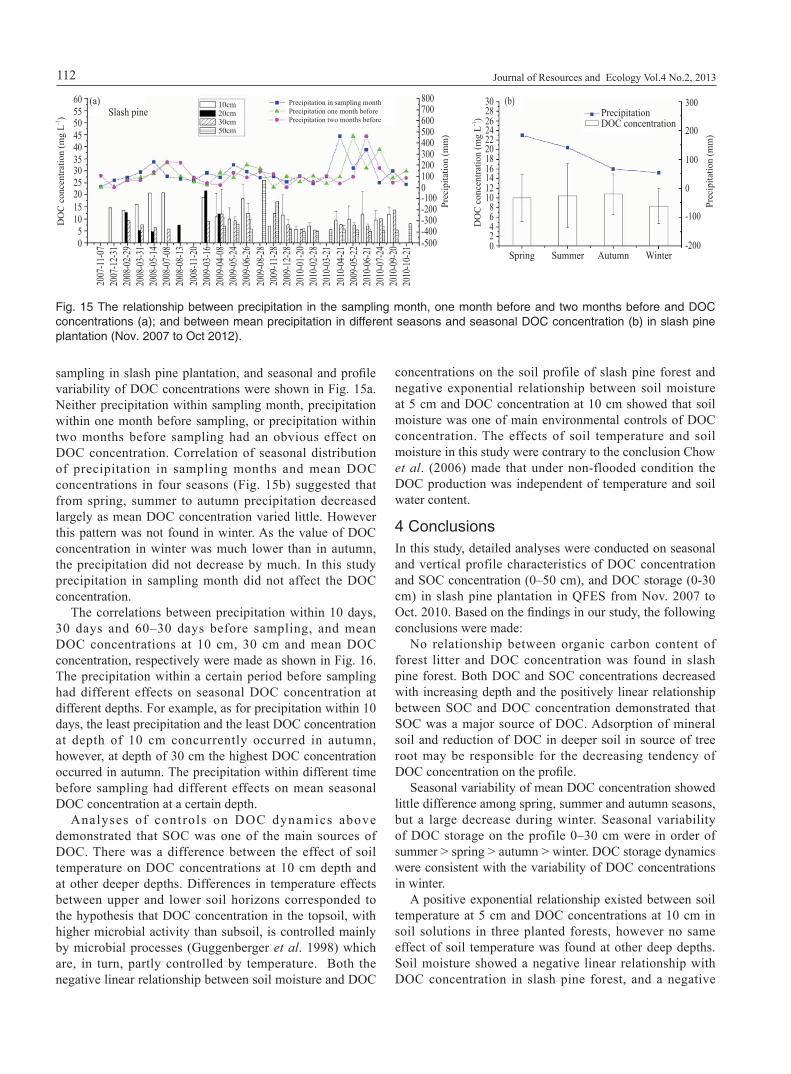
Fig. 15 The relationship between precipitation in the sampling month, one month before and two months before and DOC concentrations (a); and between mean precipitation in different seasons and seasonal DOC concentration (b) in slash pine plantation (Nov. 2007 to Oct 2012).
05
10
2015
253035
2007
-12-
3120
08-0
2-29
2008
-03-
31
2007
-11-0
7
2008
-05-
1420
08-0
7-08
2008
-08-
13
2009
-03-
1620
09-0
4-08
2009
-05-
24
2008
-11-2
0
2009
-06-
2620
09-0
8-28
2009
-11-2
820
09-1
2-28
2010
-01-
2020
10-0
2-28
2010
-03-
2120
10-0
4-21
2009
-05-
2220
10-0
6-21
2010
-07-
2420
10-0
9-20
DO
C c
once
ntra
tion
(mg
L-1)
10cm20cm30cm50cm
2010
-10-
21
404550
-400-300-200
0-100
100200300400500
-500
Prec
ipita
tion
(mm
)
Precipitation in sampling monthPrecipitation one month beforePrecipitation two months before
Slash pine(a)
5560
600700800
02
64
8
DO
C c
once
ntra
tion
(mg
L-1)
10
PrecipitationDOC concentration
-200
0
-100
100
200
300
1214
1816
202224
2826
30 (b)
Prec
ipita
tion
(mm
)
WinterSpring AutumnSummer
sampling in slash pine plantation, and seasonal and profile variability of DOC concentrations were shown in Fig. 15a. Neither precipitation within sampling month, precipitation within one month before sampling, or precipitation within two months before sampling had an obvious effect on DOC concentration. Correlation of seasonal distribution of precipitation in sampling months and mean DOC concentrations in four seasons (Fig. 15b) suggested that from spring, summer to autumn precipitation decreased largely as mean DOC concentration varied little. However this pattern was not found in winter. As the value of DOC concentration in winter was much lower than in autumn, the precipitation did not decrease by much. In this study precipitation in sampling month did not affect the DOC concentration.
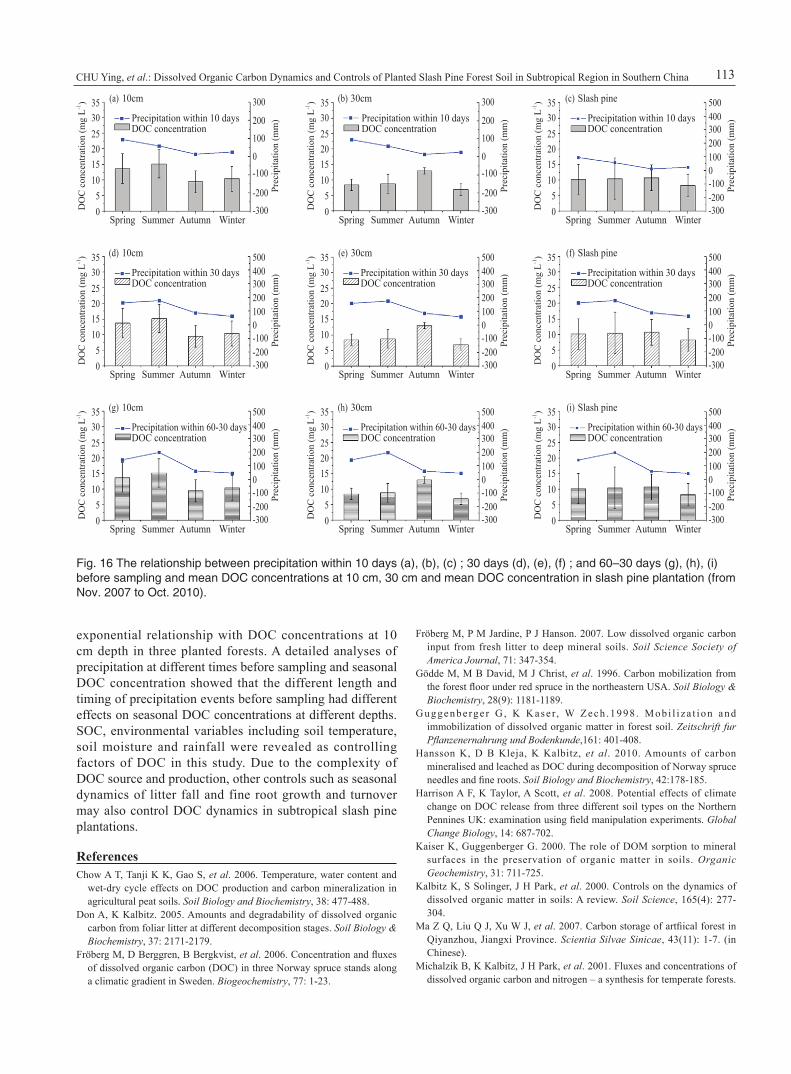
The correlations between precipitation within 10 days, 30 days and 60–30 days before sampling, and mean DOC concentrations at 10 cm, 30 cm and mean DOC concentration, respectively were made as shown in Fig. 16. The precipitation within a certain period before sampling had different effects on seasonal DOC concentration at different depths. For example, as for precipitation within 10 days, the least precipitation and the least DOC concentration at depth of 10 cm concurrently occurred in autumn, however, at depth of 30 cm the highest DOC concentration occurred in autumn. The precipitation within different time before sampling had different effects on mean seasonal DOC concentration at a certain depth.
Analyses of controls on DOC dynamics above demonstrated that SOC was one of the main sources of DOC. There was a difference between the effect of soil temperature on DOC concentrations at 10 cm depth and at other deeper depths. Differences in temperature effects between upper and lower soil horizons corresponded to the hypothesis that DOC concentration in the topsoil, with higher microbial activity than subsoil, is controlled mainly by microbial processes (Guggenberger et al. 1998) which are, in turn, partly controlled by temperature. Both the negative linear relationship between soil moisture and DOC
concentrations on the soil profile of slash pine forest and negative exponential relationship between soil moisture at 5 cm and DOC concentration at 10 cm showed that soil moisture was one of main environmental controls of DOC concentration. The effects of soil temperature and soil moisture in this study were contrary to the conclusion Chow et al. (2006) made that under non-flooded condition the DOC production was independent of temperature and soil water content.
4 ConclusionsIn this study, detailed analyses were conducted on seasonal and vertical profile characteristics of DOC concentration and SOC concentration (0–50 cm), and DOC storage (0-30 cm) in slash pine plantation in QFES from Nov. 2007 to Oct. 2010. Based on the findings in our study, the following conclusions were made:
No relationship between organic carbon content of forest litter and DOC concentration was found in slash pine forest. Both DOC and SOC concentrations decreased with increasing depth and the positively linear relationship between SOC and DOC concentration demonstrated that SOC was a major source of DOC. Adsorption of mineral soil and reduction of DOC in deeper soil in source of tree root may be responsible for the decreasing tendency of DOC concentration on the profile.
Seasonal variability of mean DOC concentration showed little difference among spring, summer and autumn seasons, but a large decrease during winter. Seasonal variability of DOC storage on the profile 0–30 cm were in order of summer > spring > autumn > winter. DOC storage dynamics were consistent with the variability of DOC concentrations in winter.
A positive exponential relationship existed between soil temperature at 5 cm and DOC concentrations at 10 cm in soil solutions in three planted forests, however no same effect of soil temperature was found at other deep depths. Soil moisture showed a negative linear relationship with DOC concentration in slash pine forest, and a negative
CHU Ying, et al.: Dissolved Organic Carbon Dynamics and Controls of Planted Slash Pine Forest Soil in Subtropical Region in Southern China 113
exponential relationship with DOC concentrations at 10 cm depth in three planted forests. A detailed analyses of precipitation at different times before sampling and seasonal DOC concentration showed that the different length and timing of precipitation events before sampling had different effects on seasonal DOC concentrations at different depths. SOC, environmental variables including soil temperature, soil moisture and rainfall were revealed as controlling factors of DOC in this study. Due to the complexity of DOC source and production, other controls such as seasonal dynamics of litter fall and fine root growth and turnover may also control DOC dynamics in subtropical slash pine plantations.
References Chow A T, Tanji K K, Gao S, et al. 2006. Temperature, water content and
wet-dry cycle effects on DOC production and carbon mineralization in agricultural peat soils. Soil Biology and Biochemistry, 38: 477-488.
Don A, K Kalbitz. 2005. Amounts and degradability of dissolved organic carbon from foliar litter at different decomposition stages. Soil Biology & Biochemistry, 37: 2171-2179.
Fröberg M, D Berggren, B Bergkvist, et al. 2006. Concentration and fluxes of dissolved organic carbon (DOC) in three Norway spruce stands along a climatic gradient in Sweden. Biogeochemistry, 77: 1-23.
Fröberg M, P M Jardine, P J Hanson. 2007. Low dissolved organic carbon input from fresh litter to deep mineral soils. Soil Science Society of America Journal, 71: 347-354.
Gödde M, M B David, M J Christ, et al. 1996. Carbon mobilization from the forest floor under red spruce in the northeastern USA. Soil Biology & Biochemistry, 28(9): 1181-1189.
Guggenberge r G , K Kase r, W Zech .1998 . Mobi l i za t ion and immobilization of dissolved organic matter in forest soil. Zeitschrift fur Pflanzenernahrung und Bodenkunde,161: 401-408.
Hansson K, D B Kleja, K Kalbitz, et al. 2010. Amounts of carbon mineralised and leached as DOC during decomposition of Norway spruce needles and fine roots. Soil Biology and Biochemistry, 42:178-185.
Harrison A F, K Taylor, A Scott, et al. 2008. Potential effects of climate change on DOC release from three different soil types on the Northern Pennines UK: examination using field manipulation experiments. Global Change Biology, 14: 687-702.
Kaiser K, Guggenberger G. 2000. The role of DOM sorption to mineral surfaces in the preservation of organic matter in soils. Organic Geochemistry, 31: 711-725.
Kalbitz K, S Solinger, J H Park, et al. 2000. Controls on the dynamics of dissolved organic matter in soils: A review. Soil Science, 165(4): 277-304.
Ma Z Q, Liu Q J, Xu W J, et al. 2007. Carbon storage of artfiical forest in Qiyanzhou, Jiangxi Province. Scientia Silvae Sinicae, 43(11): 1-7. (in Chinese).
Michalzik B, K Kalbitz, J H Park, et al. 2001. Fluxes and concentrations of dissolved organic carbon and nitrogen – a synthesis for temperate forests.
Fig. 16 The relationship between precipitation within 10 days (a), (b), (c) ; 30 days (d), (e), (f) ; and 60–30 days (g), (h), (i) before sampling and mean DOC concentrations at 10 cm, 30 cm and mean DOC concentration in slash pine plantation (from Nov. 2007 to Oct. 2010).
05
1510
20
DO
C c
once
ntra
tion
(mg
L-1)
25Precipitation within 10 daysDOC concentration
-200
0-100
100
200
3003035 (a)
Prec
ipita
tion
(mm
)
WinterSpring AutumnSummer-300
10cm
05
1510
20
DO
C c
once
ntra
tion
(mg
L-1)
25Precipitation within 10 daysDOC concentration
-200
0-100
100
200
3003035 (b)
Prec
ipita
tion
(mm
)
WinterSpring AutumnSummer-300
30cm
05
1510
20
DO
C c
once
ntra
tion
(mg
L-1)
25Precipitation within 10 daysDOC concentration
-200
0-100
100200300
3035 (c)
Prec
ipita
tion
(mm
)
WinterSpring AutumnSummer-300
Slash pine
400500
05
1510
20
DO
C c
once
ntra
tion
(mg
L-1)
25Precipitation within 30 daysDOC concentration
-200
0-100
100200300
3035 (d)
Prec
ipita
tion
(mm
)
WinterSpring AutumnSummer-300
10cm
400500
05
1510
20D
OC
con
cent
ratio
n (m
g L-1
)
25Precipitation within 30 daysDOC concentration
-200
0-100
100200300
3035 (e)
Prec
ipita
tion
(mm
)
WinterSpring AutumnSummer-300
30cm
400500
05
1510
20
DO
C c
once
ntra
tion
(mg
L-1)
25Precipitation within 30 daysDOC concentration
-200
0-100
100200300
3035 (f)
Prec
ipita
tion
(mm
)
WinterSpring AutumnSummer-300
Slash pine
400500
05
1510
20
DO
C c
once
ntra
tion
(mg
L-1)
25Precipitation within 60-30 daysDOC concentration
-200
0-100
100200300
3035 (g)
Prec
ipita
tion
(mm
)
WinterSpring AutumnSummer-300
10cm
400500
05
1510
20
DO
C c
once
ntra
tion
(mg
L-1)
25Precipitation within 60-30 daysDOC concentration
-200
0-100
100200300
3035 (h)
Prec
ipita
tion
(mm
)
WinterSpring AutumnSummer-300
30cm
400500
05
1510
20
DO
C c
once
ntra
tion
(mg
L-1)
25Precipitation within 60-30 daysDOC concentration
-200
0-100
100200300
3035 (i)
Prec
ipita
tion
(mm
)
WinterSpring AutumnSummer-300
Slash pine
400500
Journal of Resources and Ecology Vol.4 No.2, 2013114
Biogeochemistry, 52: 173-205. Moore T R, W de Souza, J F Koprivnjak. 1992. Controls on the sorption of
dissolved organic-carbon by soils. Soil Science, 154: 120-129. Neff J C, G P Asner. 2001. Dissolved organic carbon in terrestrial
ecosystems: Synthesis and a model. Ecosystems, 4: 29-48. Peichl M, T R Moore, M A Arain, et al. 2007. Concentrations and fluxes
of dissolved organic carbon in an age-sequence of white pine forests in Southern Ontario, Canada. Biogeochemistry, 86: 1-17.
Prokushkin A S, S Hobara, S G Prokushkin. 2010. Chapter 11, Behavior of dissolved organic carbon in larch ecosystem. Osawa A et al. (eds.). Permafrost Ecosystems: Siberian Larch Forests, Ecological Studies, Vol. 209, Springer Science+Business Media B.V.
Uselman S M, R G Qualls, J Lilienfein. 2007. Contribution of roots vs. leaf litter to dissolved organic carbon leaching through soil. Soil Science Society of America Journal, 71: 1555-1563.
Wang S Q, Liu J Y, Yu G R, et al. 2004. Effects of land use change on the
storage of soil organic carbon: A case study of the Qianyanzhou forest experimental stations in China. Climatic Change, 67: 247-255.
Wang Y D, Wang H M, Ma Z Q, et al. 2009. Contribution of aboveground litter decomposition to soil respiration in a subtropical coniferous plantation in southern China. Asia-Pacific Journal of Atmospheric Sciences, 45: 137-147.
Wen X F, Yu G R, Sun X M, et al. 2006. Soil moisture effect on the temperature dependence of ecosystem respiration in a subtropical Pinus plantation of southeastern China. Agricultural and Forest Meteorology, 137: 166-175.
Yang Y S, Guo J F, Chen G S, et al. 2003. Origin, property and flux of dissolved organic matter in forest ecosystems. Acta Ecologica Sinica, 23(3): 547-558. (in Chinese)
Yu G R, Wen X F, Li Q K, et al. 2005. Seasonal patterns and environmental control of ecosystem respiration in subtropical and temperate forests in China. Science in China (Ser. D: Earth Sciences), 48 (Supp. I): 93-105.