dissertation poster.pdf
TRANSCRIPT
post
erse
ssio
n.co
m
A Molecular Dynamics Study on the liquid-‐liquid extraction of
Uranyl ions with Tri-‐Butyl-‐Phosphate
Mark Thomas
7. Umbrella Sampling 8. Conclusion
10. Bibliography
Nuclear reprocessing is becoming an increasingly important process in a time where there is a large focus on the sustainability of power generation. Not only can it reduce the high-‐level waste volume, but can improve the efficiency of the cycle, by recycling unreacted fuel. The PUREX process is the most widely used method. 1) The fuel rods are dissolved in nitric acid; 2) This is then contacted with an organic phase containing 30% v/v
tri-‐butyl-‐phosphate (TBP) (as seen in figure 1) in dodecane;
3) The TBP selectively binds to uranyl nitrate; 4) These neutral complexes readily migrate into the organic phase.
1. Introduction
Although widely used since the 1950’s , there are many aspects of the process that are not understood on a molecular level. The TBP tends to form structures called reverse micelles around polar molecules such as water and acids due to its hydrophilic and hydrophobic properties, aggregating at the interface [1]. The particular mechanism of the extraction around the interface is unknown. Moreover, there have been continuous improvements in the force field models used for Molecular Dynamics (MD) simulations, meaning that the validity of earlier results are now bought into question. The drivers for third phase formation are still unknown, an occurrence that can seriously impair the liquid-‐liquid extraction.
(UO22+)aq+2(NO3
-‐)aq+2(TBP)org → ??? → (UO2(NO3)2 � 2TBP)org
2. Motivations & Objectives Motivations • Increase efficiency of process by gaining further understanding on rate of
mass transfer and partitioning coefficients • To further understand the driving forces of third phase so it can be avoided Objectives • Systematically and rigorously test the force field models for TBP, water and
dodecane • Gain further insight into the kinetics, complexation and extraction
mechanisms
3. Methodology • GROMACS 4.6.7 • NPT – 1 atm Berendsen barostat. 298.15 K
v-‐rescale thermostat [2] • Time step of 1 ps • Energy minimisation followed by MD
Units rdf. Read up on particular thermostats
Force Field System OPLS-‐2005 [3]
TBP MNDO & ‘DL’ Water TIP3P & SPC/E Dodecane OPLS-‐AA HNO3 ESP [4]
UO2+ QM [5]
4. Binary System
-4
-3
-2
-1
0
1
2
0.6 0.7 0.8 0.9 1
Exc
ess
enth
aly
of m
ixin
g (k
J/m
ol)
Scaling factor for MNDO charge
Simulation
Experimental
New TBP partial charges optimised for the description of a TBP/dodecane system, were found to lead to TBP/water immiscibility, counter to experimental observation. It is known that saturation point TBP:H2O is 1:1 [6]. • Changing Lennard-‐Jones (LJ) potentials had little effect on structure • Scaling partial charges on TBP resulted in homogenous mixture and better
thermodynamic properties of system (reasonable description of TBP/dodecane also) • 0.9 best match with free energy of solvation, 0.8 best match with excess enthalpy of
mixing. 0.84 OPLS-‐MNDO compromise was taken
5. Ternary System A new charged dodecane model was developed to prevent liquid-‐gel phase transition. Dodecane was added into the system for 3 different TBP:H2O ratios. Hydrophobic dodecane avoids contact with water. Resulted in single phase with possible reverse micelles formed.
Nitric acid was added into the system. Emulsion like structure observed. No H2O-‐dcc interactions, but HNO3 slightly more dispersed. Down to more negatively charged H atom. Reverse micelles formed protecting polar molecules from ddc.
O Aq
nH2O 4 1247
nHNO3 35 -
nTBP 38 -
nDDC 108 -
nH3O+ - 210
nNO3- - 210
• The TBP scaling factor 0.6 underestimated intermolecular forces. A factor of 0.84 or 0.9 OPLS-‐MNDO is recommended
• The unchanged OPLS-‐AA dodecane prevents liquid-‐gel phase transition • Current force field models do not favour uranyl extraction, despite formation
of reverse micelles Recommendations • Add polarizabilities to force field models, in particular phosphate head • Increase LJ potential between uranyl and TBP • Carry out/compare results to additional experimental data (neutron scattering
& x-‐ray diffraction)
The author would like to thank Junju Mu, Karl Fairhurst and Gareth Myers for their results and continuing cooperation, and Andrew Masters for his l imit less help and knowledge throughout.
Systems Free energy of solvation of H2O in TBP (kJ mol-1)
Experimental -19.58112 0.60 MNDO -6.12 ± 0.29 0.70 MNDO -10.14 ± 0.79 0.80 MNDO -15.47 ± 0.57 0.81 MNDO -15.18 ± 0.25 0.82 MNDO -16.66 ± 0.39 0.83 MNDO -14.38 ± 0.52 0.84 MNDO -17.05 ± 0.96 0.85 MNDO -14.54 ± 0.15 0.86 MNDO -17.71 ± 0.81 0.87 MNDO -18.99 ± 0.61 0.88 MNDO -20.93 ± 1.04 0.89 MNDO -19.29 ± 1.50 0.90 MNDO -19.75 ± 0.41 1.00 MNDO -22.84 ± 0.92
0.60 MNDO 0.84 MNDO 0.9 MNDO LJ – 1.25 LJ – 1.75
LJ – 2 LJ -‐ 5
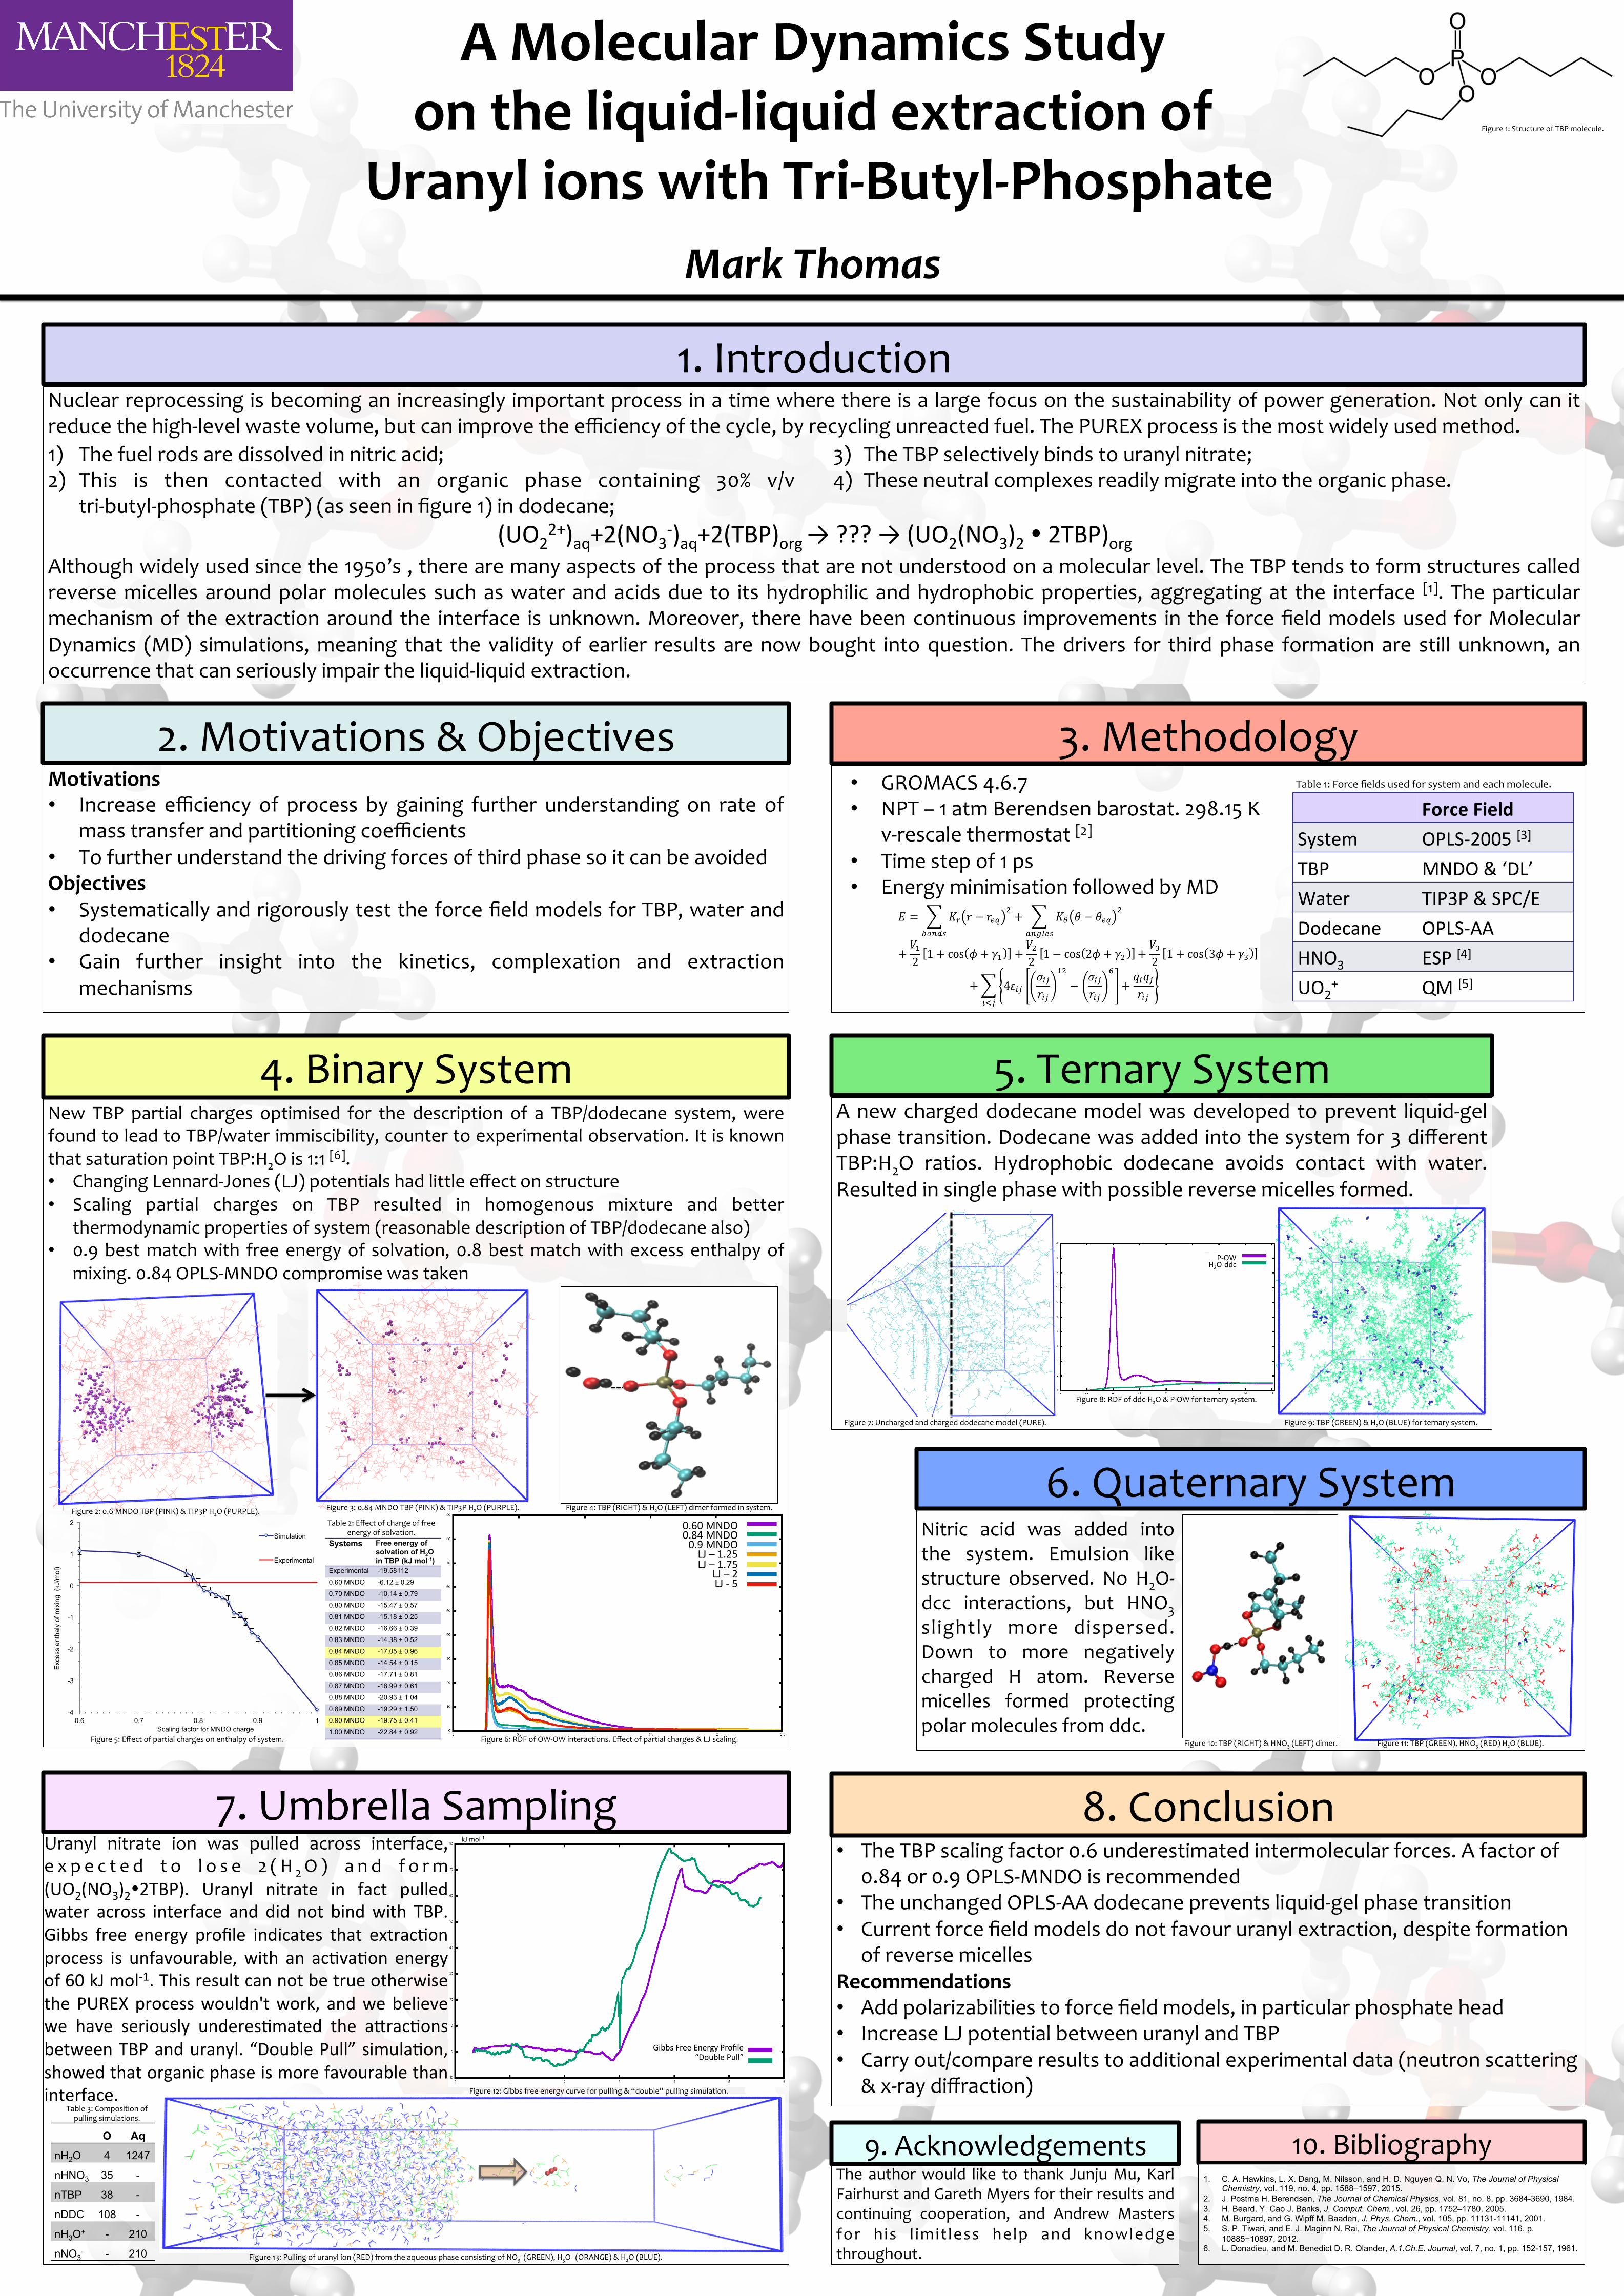
Gibbs Free Energy Profile “Double Pull”
1. C. A. Hawkins, L. X. Dang, M. Nilsson, and H. D. Nguyen Q. N. Vo, The Journal of Physical Chemistry, vol. 119, no. 4, pp. 1588–1597, 2015.
2. J. Postma H. Berendsen, The Journal of Chemical Physics, vol. 81, no. 8, pp. 3684-3690, 1984. 3. H. Beard, Y. Cao J. Banks, J. Comput. Chem., vol. 26, pp. 1752–1780, 2005. 4. M. Burgard, and G. Wipff M. Baaden, J. Phys. Chem., vol. 105, pp. 11131-11141, 2001. 5. S. P. Tiwari, and E. J. Maginn N. Rai, The Journal of Physical Chemistry, vol. 116, p.
10885−10897, 2012. 6. L. Donadieu, and M. Benedict D. R. Olander, A.1.Ch.E. Journal, vol. 7, no. 1, pp. 152-157, 1961.
Table 1: Force fields used for system and each molecule.
Figure 2: 0.6 MNDO TBP (PINK) & TIP3P H2O (PURPLE). Figure 3: 0.84 MNDO TBP (PINK) & TIP3P H2O (PURPLE). Figure 4: TBP (RIGHT) & H2O (LEFT) dimer formed in system.
Figure 5: Effect of partial charges on enthalpy of system.
Table 2: Effect of charge of free energy of solvation.
Figure 6: RDF of OW-‐OW interactions. Effect of partial charges & LJ scaling.
Figure 7: Uncharged and charged dodecane model (PURE).
Figure 8: RDF of ddc-‐H2O & P-‐OW for ternary system.
Figure 9: TBP (GREEN) & H2O (BLUE) for ternary system.
Figure 10: TBP (RIGHT) & HNO3 (LEFT) dimer. Figure 11: TBP (GREEN), HNO3 (RED) H2O (BLUE).
Figure 12: Gibbs free energy curve for pulling & “double” pulling simulation.
kJ mol-‐1
Figure 13: Pulling of uranyl ion (RED) from the aqueous phase consisting of NO3-‐ (GREEN), H3O+ (ORANGE) & H2O (BLUE).
Table 3: Composition of pulling simulations.
Figure 1: Structure of TBP molecule.
Uranyl nitrate ion was pulled across interface, e x p e c t e d t o l o s e 2 ( H 2O ) a n d f o rm (UO2(NO3)2�2TBP). Uranyl nitrate in fact pulled water across interface and did not bind with TBP. Gibbs free energy profile indicates that extrachon process is unfavourable, with an achvahon energy of 60 kJ mol-‐1. This result can not be true otherwise the PUREX process wouldn't work, and we believe we have seriously undereshmated the anrachons between TBP and uranyl. “Double Pull” simulahon, showed that organic phase is more favourable than interface.
P-‐OW H2O-‐ddc
9. Acknowledgements
6. Quaternary System