disruptive measurement technologies!€¦ · graham gardner . disruptive measurement technologies!...
TRANSCRIPT

Graham Gardner
Disruptive measurement technologies!
Outline • Carcase measurement – the status quo
• Project to accelerate development
– Beef and lamb industries
• Detail progress for some technologies
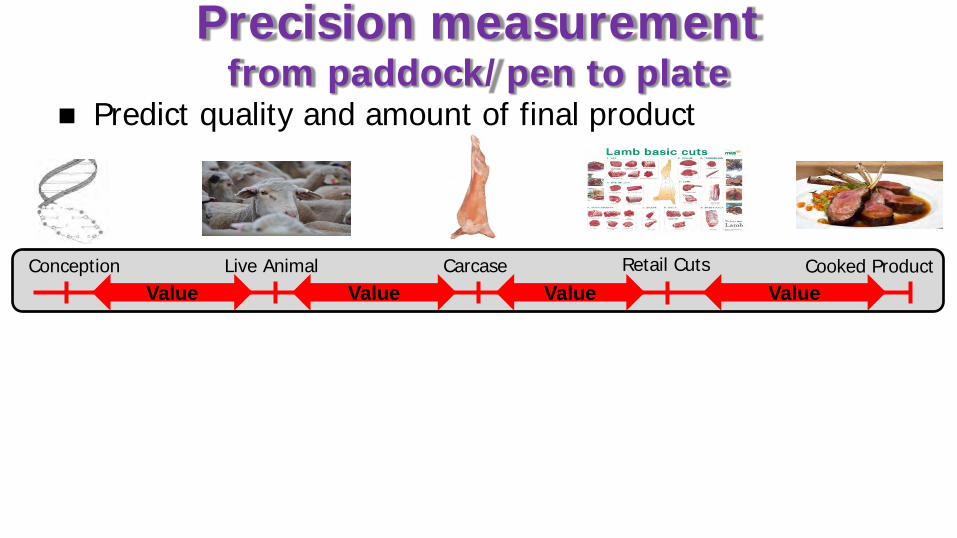
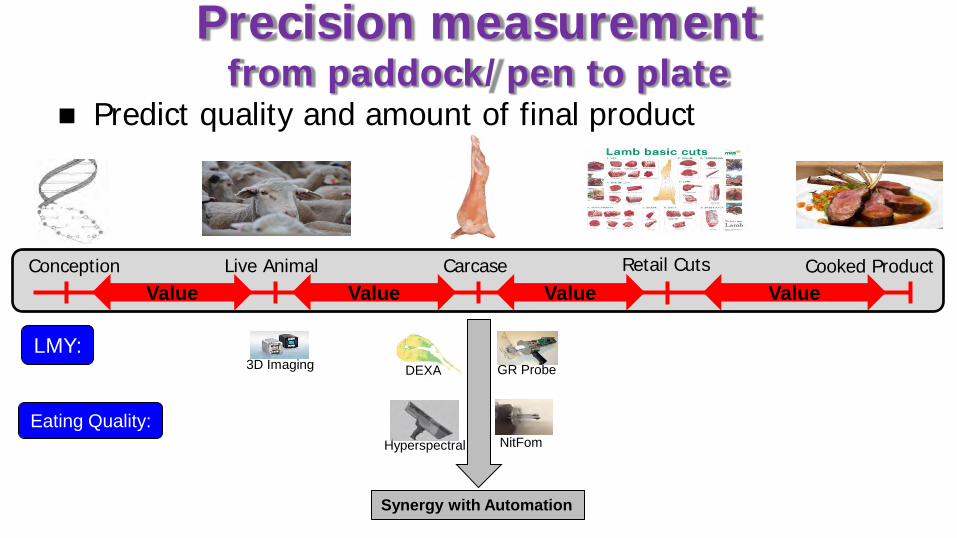
Precision measurement from paddock/pen to plate
Predict quality and amount of final product
Conception Live Animal Carcase Retail Cuts Cooked Product Value Value Value Value
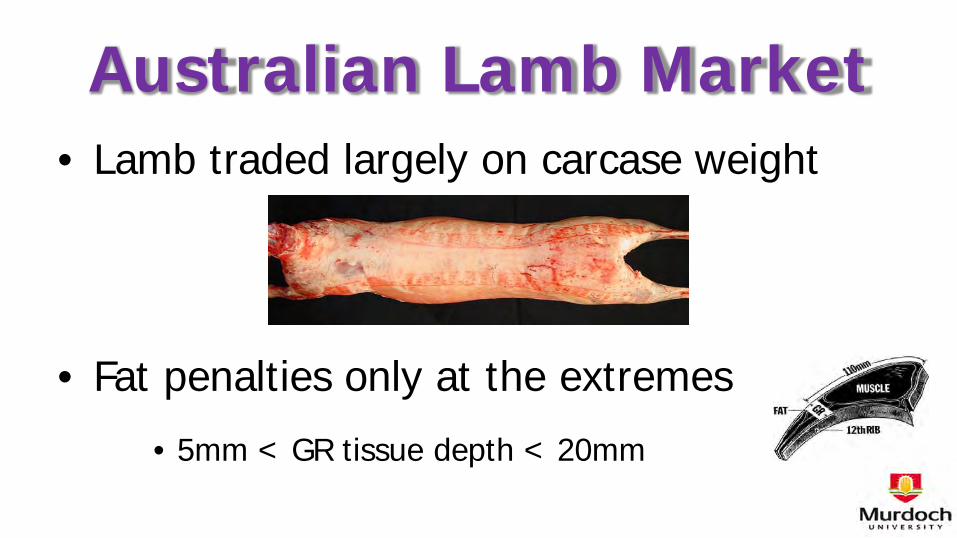
Australian Lamb Market • Lamb traded largely on carcase weight
• Fat penalties only at the extremes
• 5mm < GR tissue depth < 20mm
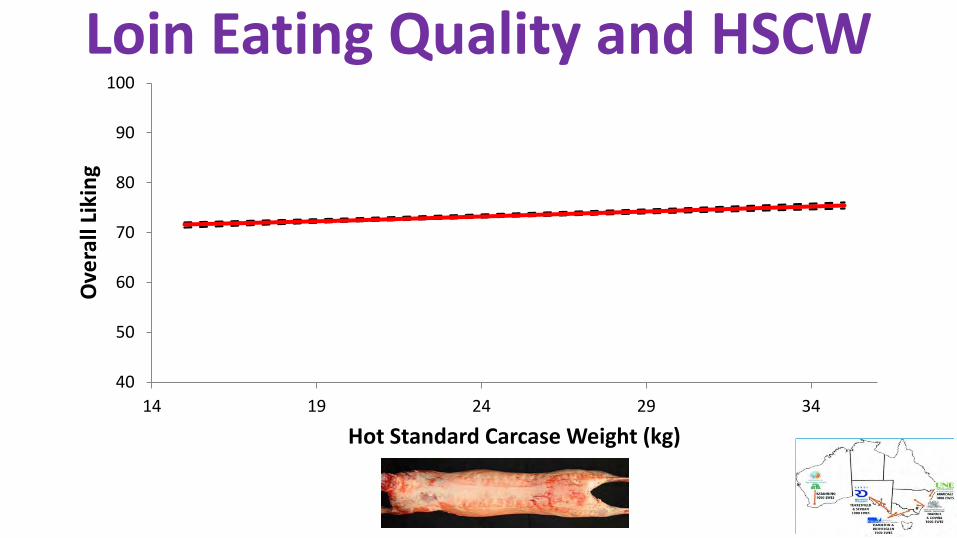
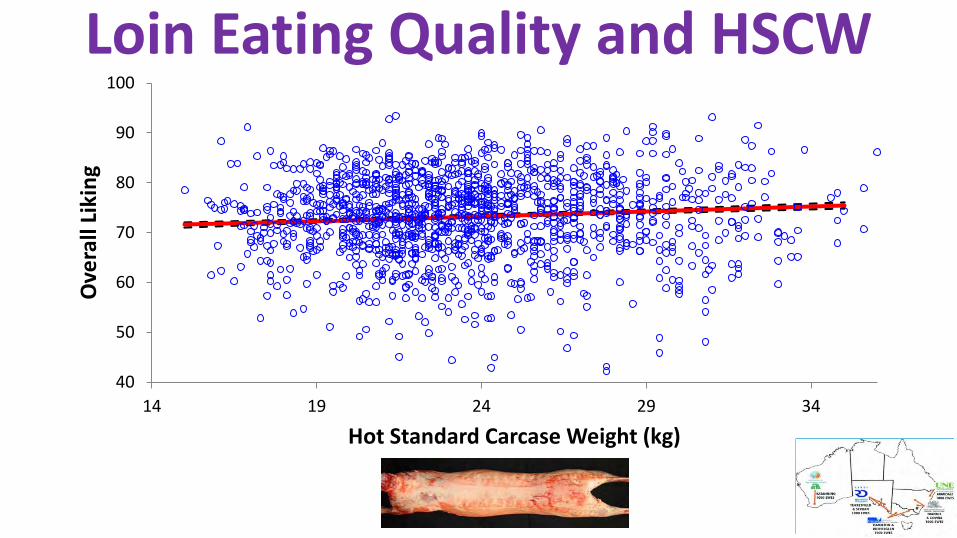
Loin Eating Quality and HSCW
40
50
60
70
80
90
100
14 19 24 29 34
Ove
rall
Liki
ng
Hot Standard Carcase Weight (kg)
Loin Eating Quality and HSCW
40
50
60
70
80
90
100
14 19 24 29 34
Ove
rall
Liki
ng
Hot Standard Carcase Weight (kg)
50
52
54
56
58
60
62
64
66
55 56 57 58 59 60 61 62 63
Actu
al CT
Lean
%
Predicted CT Lean% (predicted from HSCW and GR Estimate)
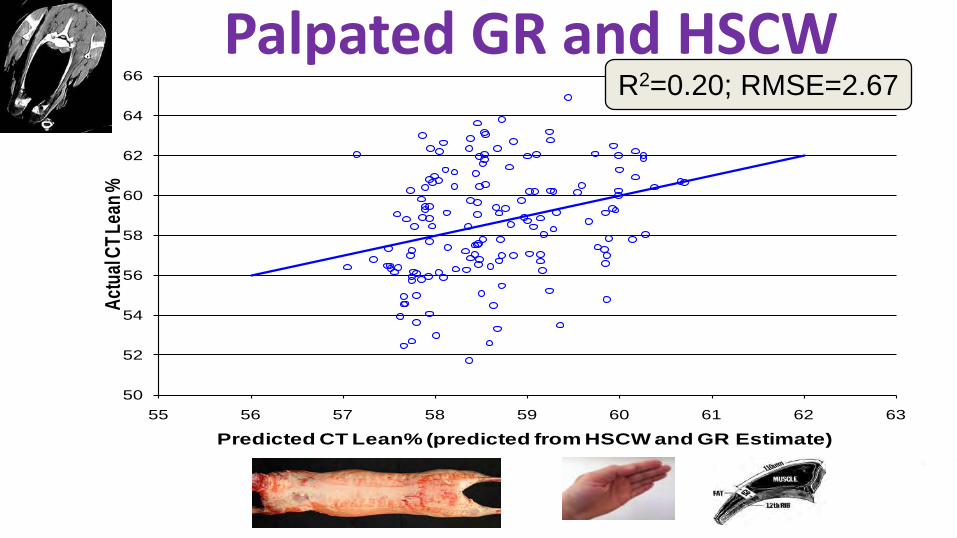
R2=0.20; RMSE=2.67 Palpated GR and HSCW
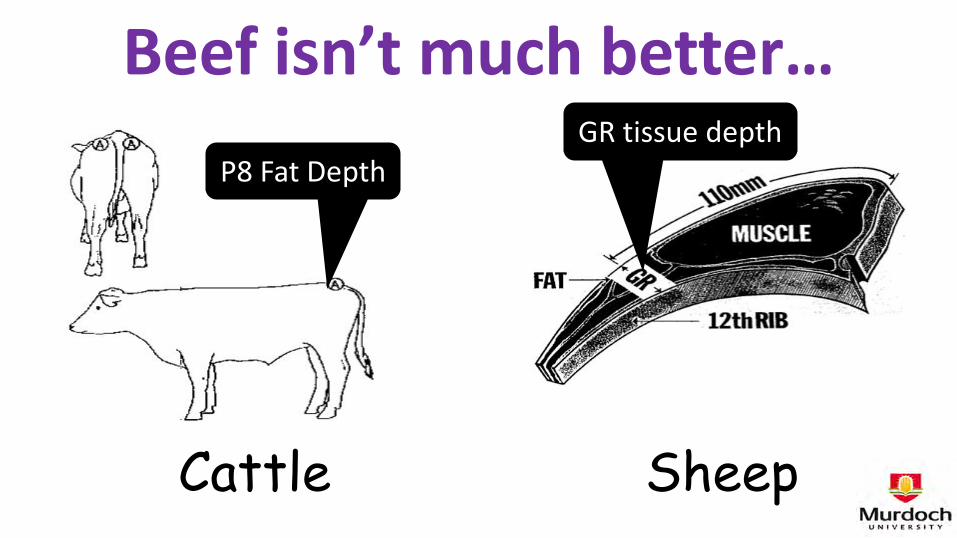
Beef isn’t much better…
Sheep Cattle
P8 Fat Depth GR tissue depth
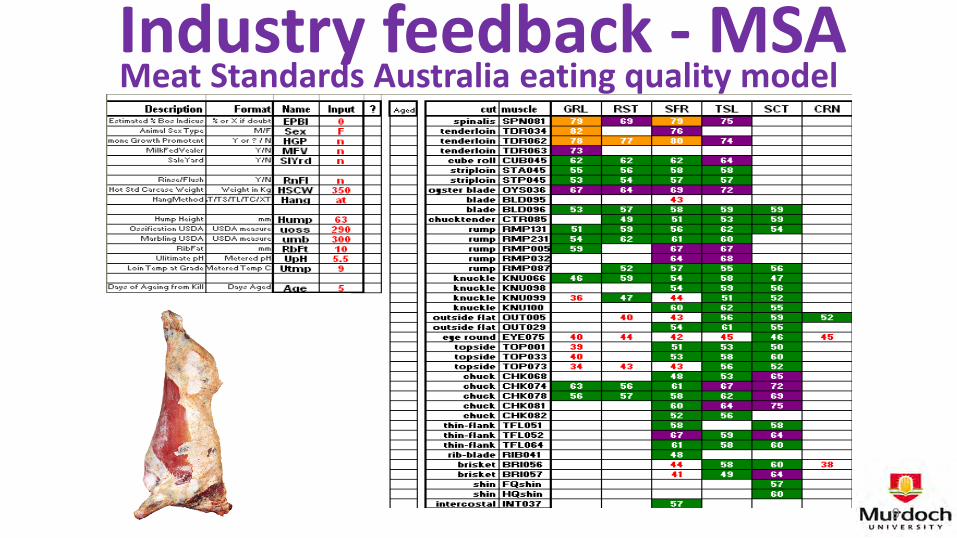
9
Meat Standards Australia eating quality model Industry feedback - MSA
• Lean meat yield – More fat trimmed (labour/waste) – Inconsistent retail cut size
• Eating quality – Consumer confidence
Variability in these traits has a cost!
• Variability can be managed with… –carcase sorting (prior to fabrication) –cut sorting for cut size and EQ
Variability in these traits has a cost!
• Variability can be managed with… –carcase sorting (prior to fabrication) –cut sorting for cut size and EQ
Variability in these traits has a cost!
If we can measure it!

We need measurement technologies!
This project is supported by funding from the Australian Government Department of Agriculture and Water Resources as part of its Rural R&D for Profit programme in partnership with Research & Development Corporations, commercial companies, state departments and universities
Advanced Livestock Measurement Technologies
Precision measurement from paddock/pen to plate
Predict quality and amount of final product
Conception Live Animal Carcase Retail Cuts Cooked Product
Hyperspectral NitFom
DEXA GR Probe
Synergy with Automation
3D Imaging
Value Value Value Value
LMY:
Eating Quality:
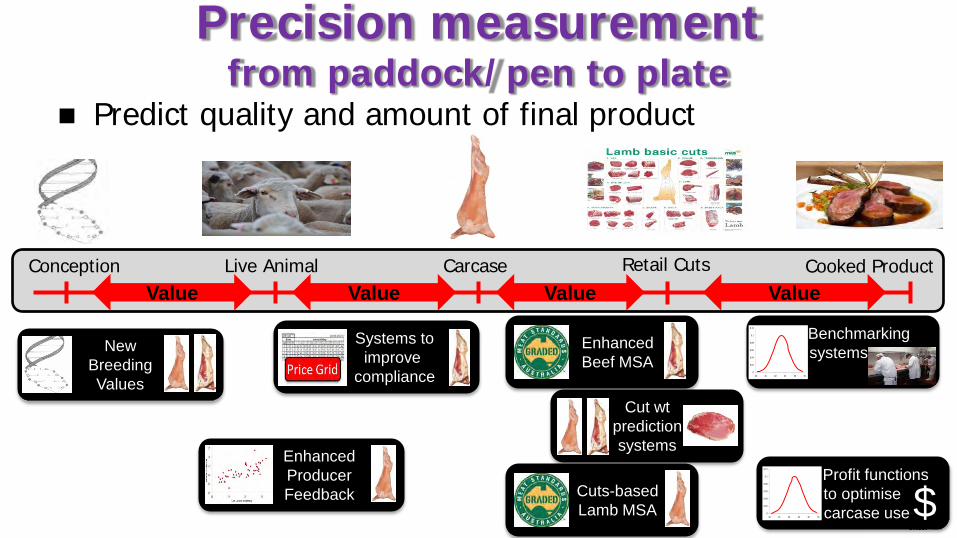
Precision measurement from paddock/pen to plate
Predict quality and amount of final product
Conception Live Animal Carcase Retail Cuts Cooked Product Value Value Value Value
Enhanced Beef MSA
Cuts-based Lamb MSA
New Breeding Values
Enhanced Producer Feedback
Systems to improve
compliance
Cut wt prediction systems
Profit functions to optimise
carcase use 0
0.02
0.04
0.06
0.08
0.1
0.12
10 15 20 25 30 35 $
Benchmarking systems
0
0.02
0.04
0.06
0.08
0.1
0.12
10 15 20 25 30 35
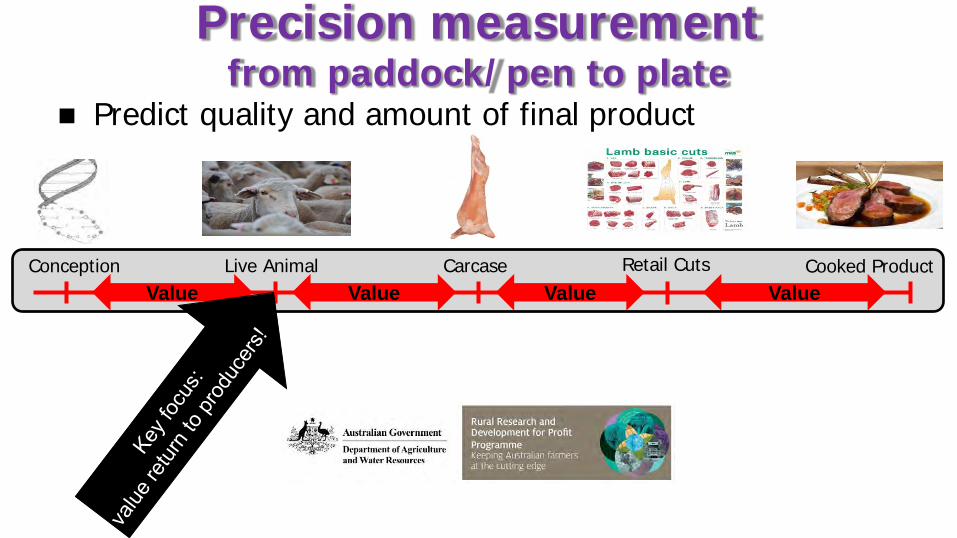
Precision measurement from paddock/pen to plate
Predict quality and amount of final product
Conception Live Animal Carcase Retail Cuts Cooked Product Value Value Value Value

Prioritising Techs for investment
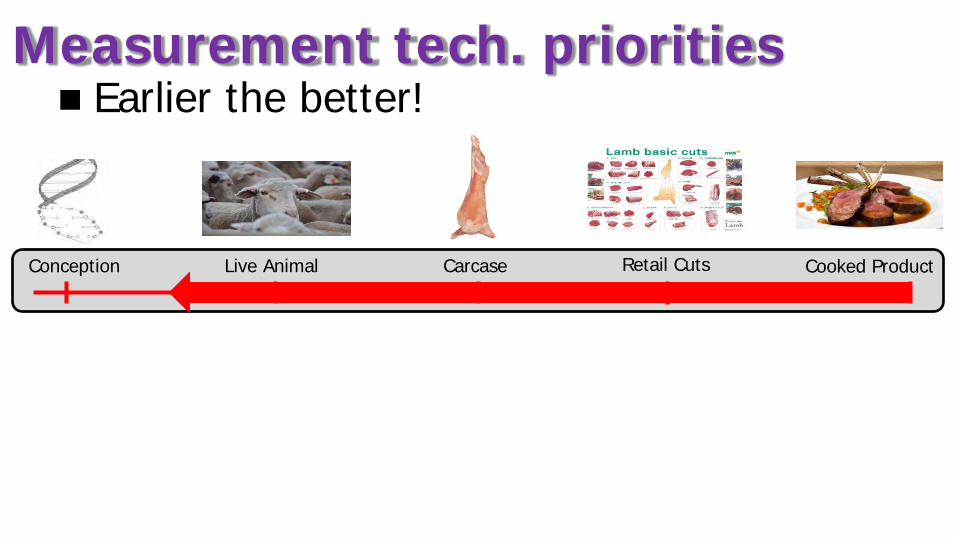
Conception Live Animal Carcase Retail Cuts Cooked Product
Measurement tech. priorities Earlier the better!
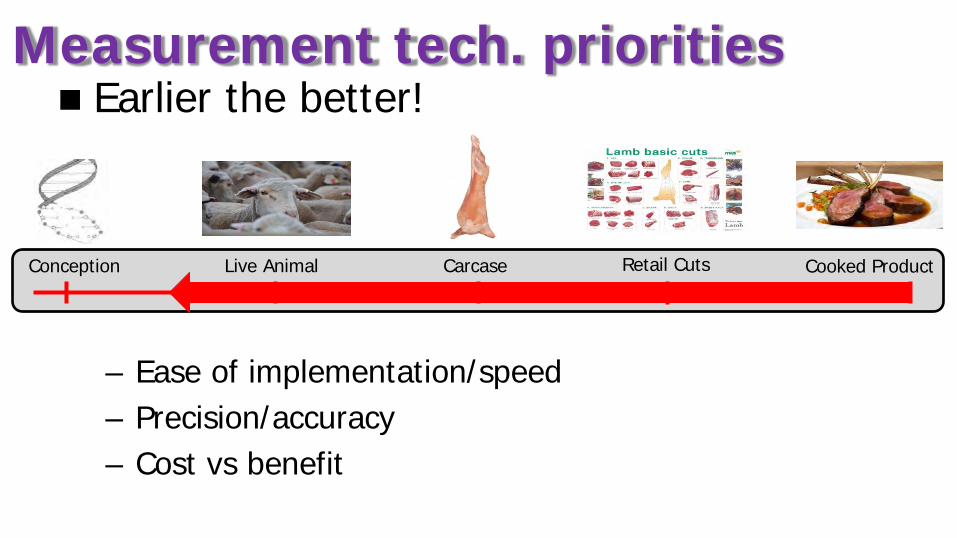
Conception Live Animal Carcase Retail Cuts Cooked Product
Measurement tech. priorities Earlier the better!
– Ease of implementation/speed – Precision/accuracy – Cost vs benefit
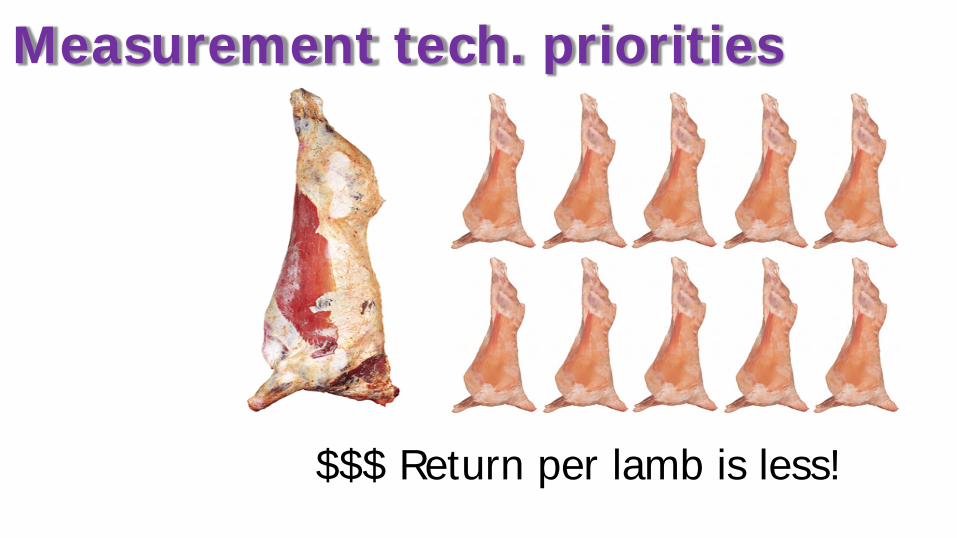
Measurement tech. priorities
$$$ Return per lamb is less!
Lean Meat Yield
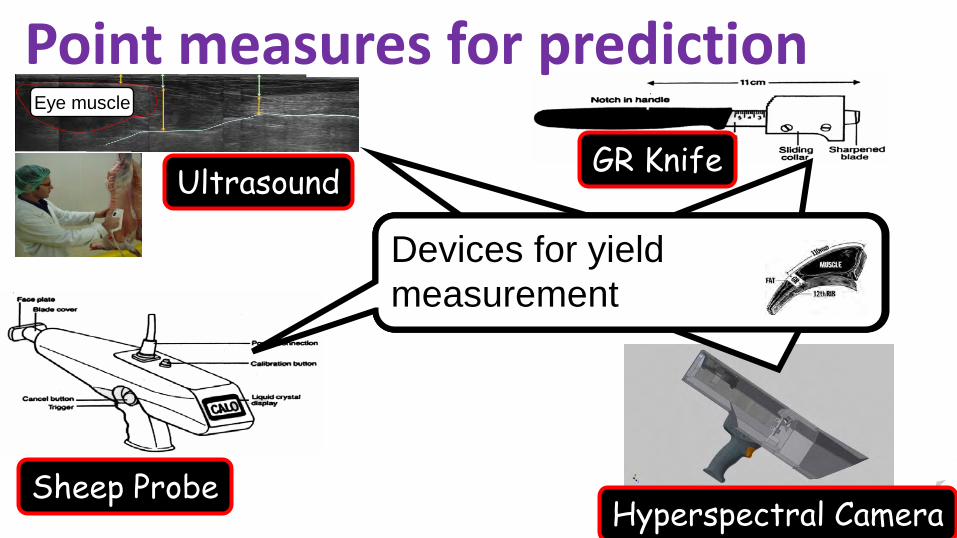
Devices for yield measurement
Eye muscle
Ultrasound
Sheep Probe
Devices for yield measurement
Hyperspectral Camera
Point measures for prediction
Devices for yield measurement Devices for yield measurement
GR Knife
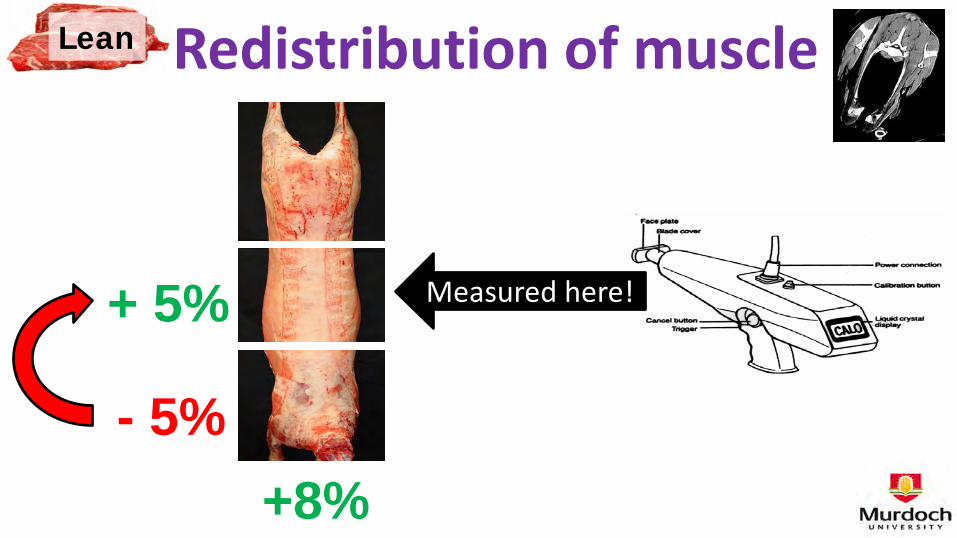
Lean Redistribution of muscle
+8%
+ 5%
- 5%
Measured here!
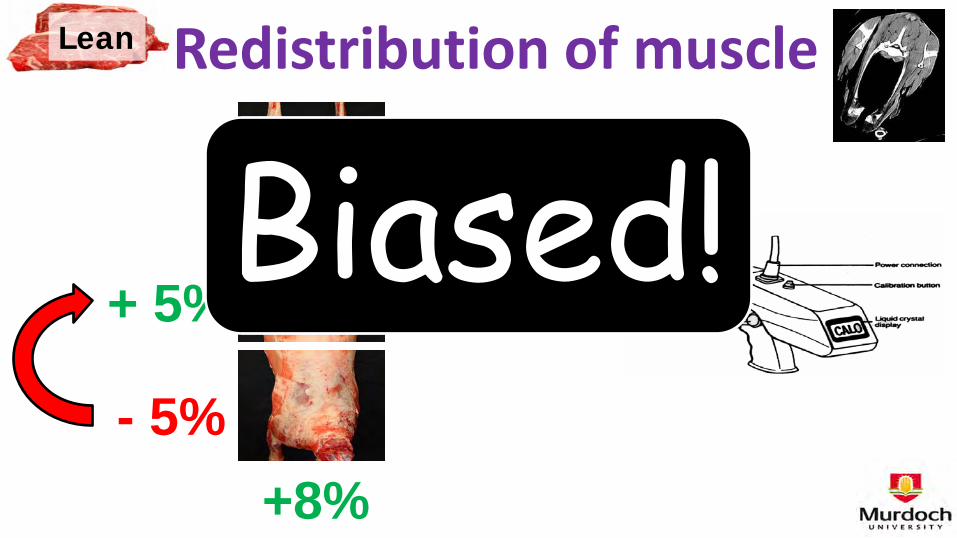
Lean Redistribution of muscle
+8%
+ 5%
- 5%
Measured here! Biased!
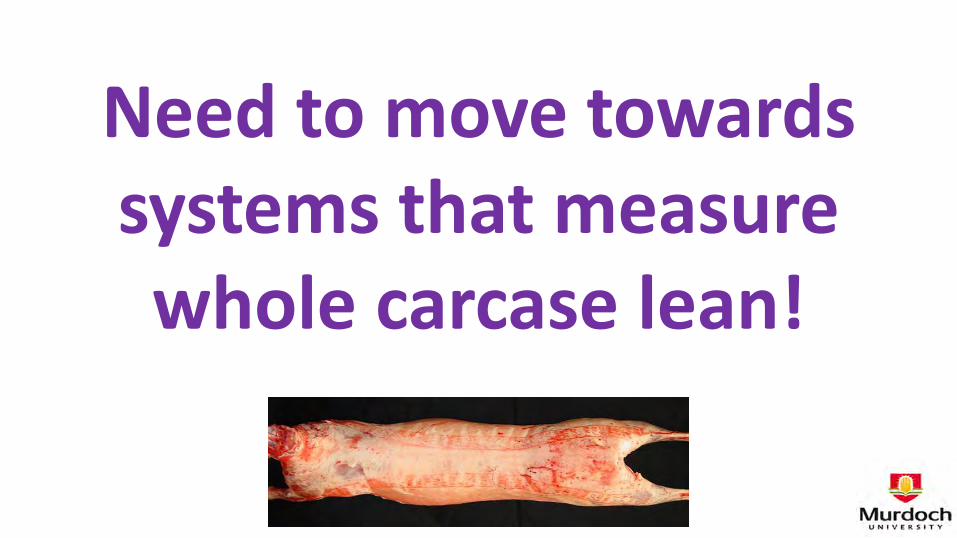
Need to move towards systems that measure whole carcase lean!
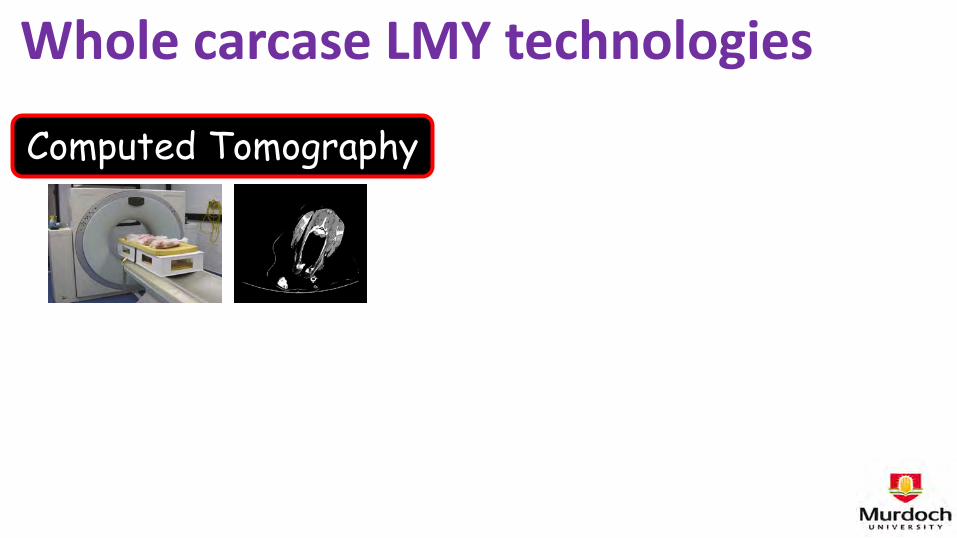
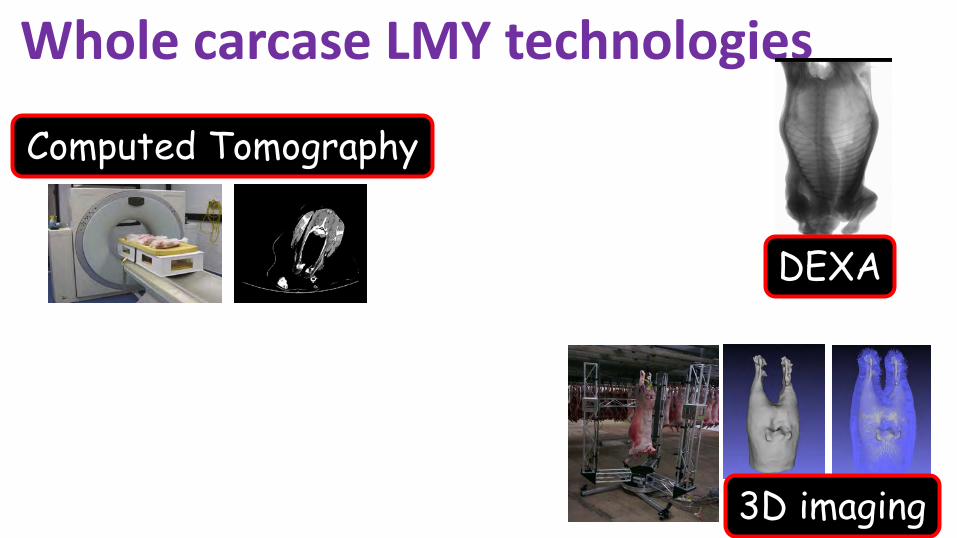
Whole carcase LMY technologies
Computed Tomography
Whole carcase LMY technologies
3D imaging
Computed Tomography
DEXA
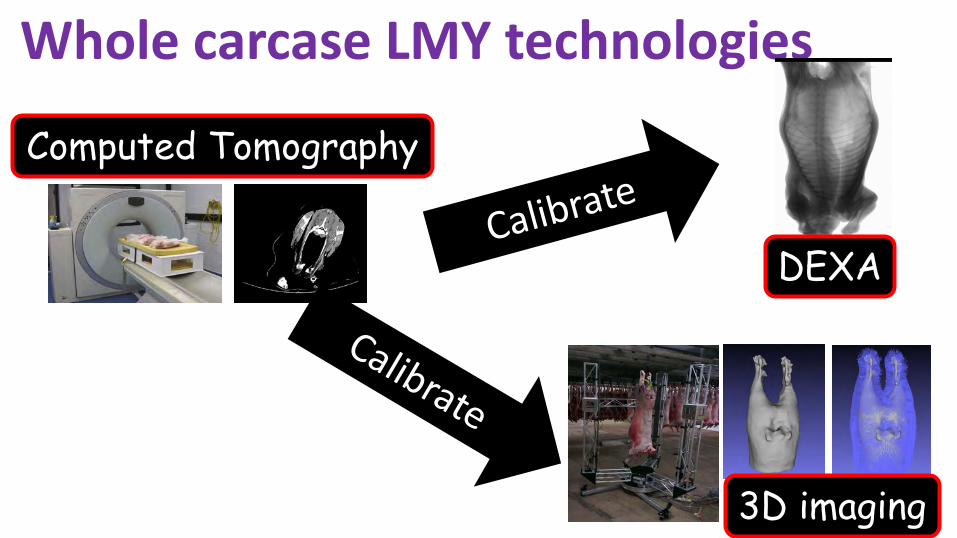
Whole carcase LMY technologies
3D imaging
Computed Tomography
DEXA

DEXA
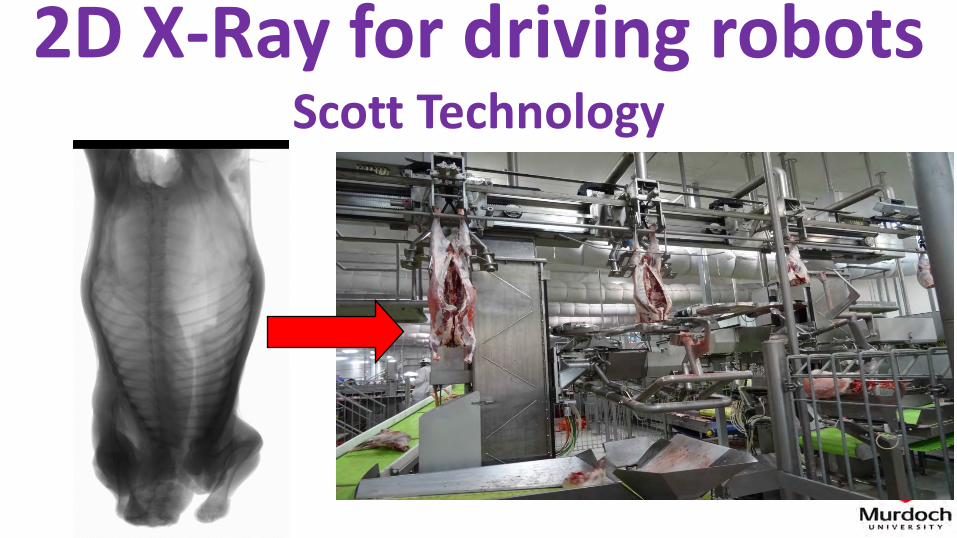
2D X-Ray for driving robots Scott Technology
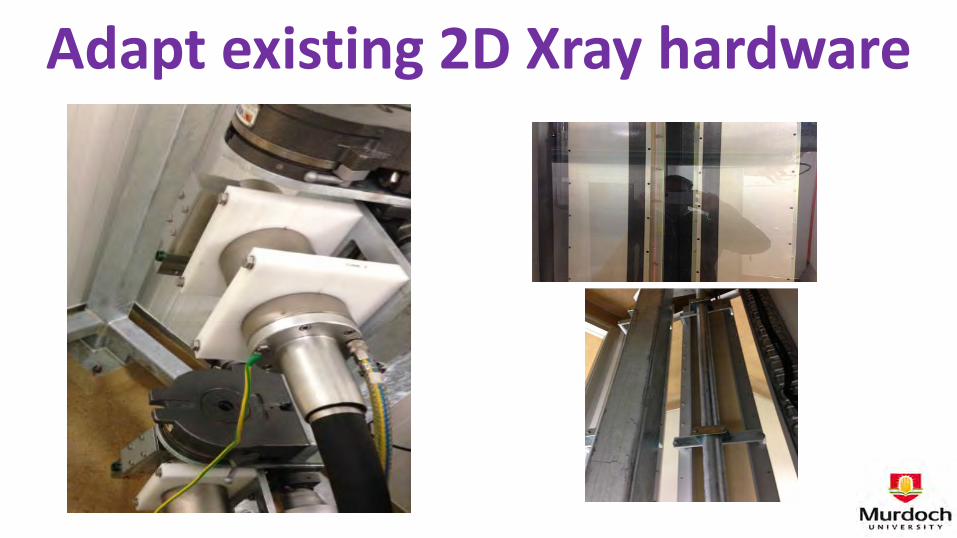
Adapt existing 2D Xray hardware
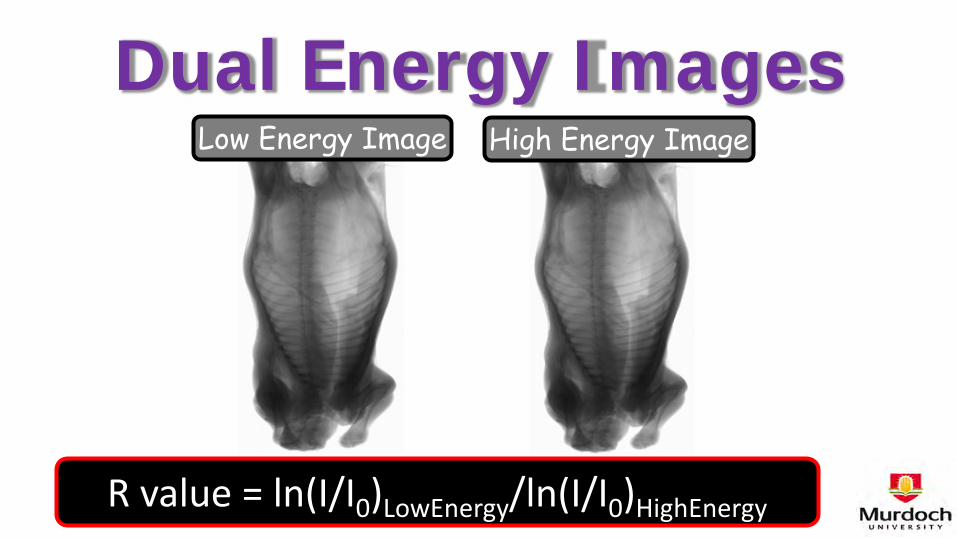
Dual Energy Images Low Energy Image High Energy Image
R value = ln(I/I0)LowEnergy/ln(I/I0)HighEnergy
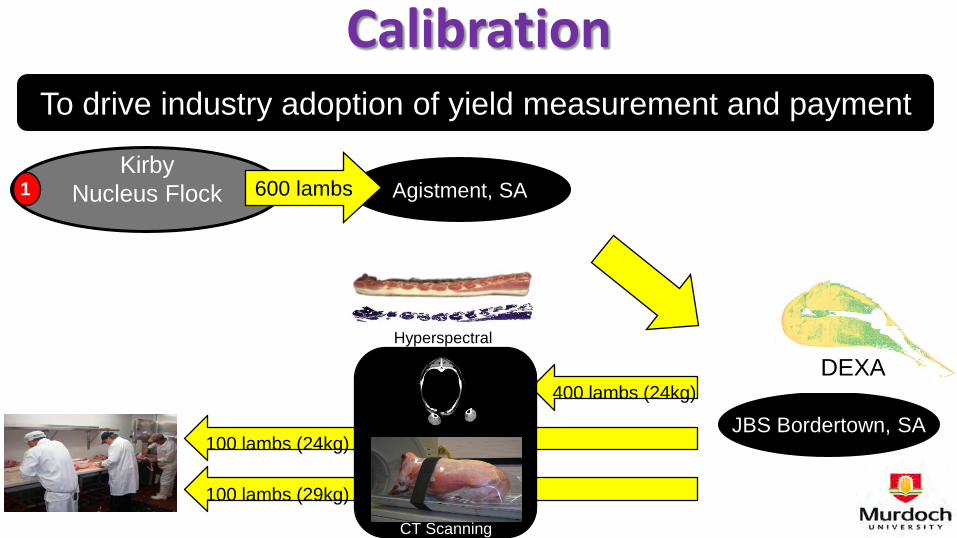
To drive industry adoption of yield measurement and payment
JBS Bordertown, SA
1 Agistment, SA
100 lambs (29kg)
100 lambs (24kg)
400 lambs (24kg) DEXA
Kirby Nucleus Flock
1 600 lambs
Hyperspectral
CT Scanning
Calibration
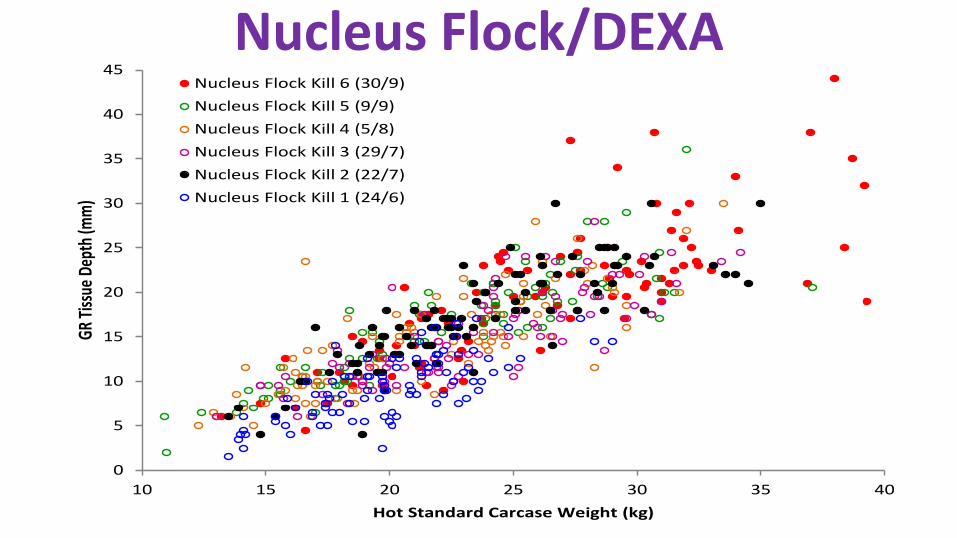
Nucleus Flock/DEXA
0
5
10
15
20
25
30
35
40
45
10 15 20 25 30 35 40
GR Ti
ssue D
epth
(mm)
Hot Standard Carcase Weight (kg)
Nucleus Flock Kill 6 (30/9)Nucleus Flock Kill 5 (9/9)Nucleus Flock Kill 4 (5/8)Nucleus Flock Kill 3 (29/7)Nucleus Flock Kill 2 (22/7)Nucleus Flock Kill 1 (24/6)
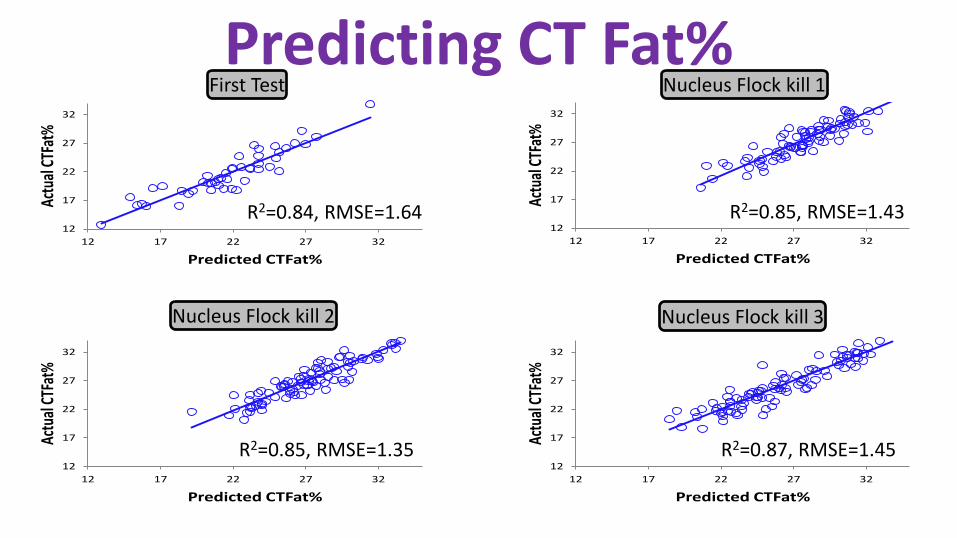
Predicting CT Fat%
12
17
22
27
32
12 17 22 27 32
Actu
al CT
Fat%
Predicted CTFat%
12
17
22
27
32
12 17 22 27 32
Actu
al CT
Fat%
Predicted CTFat%
12
17
22
27
32
12 17 22 27 32
Actu
al CT
Fat%
Predicted CTFat%
12
17
22
27
32
12 17 22 27 32
Actu
al CT
Fat%
Predicted CTFat%
R2=0.84, RMSE=1.64 R2=0.85, RMSE=1.43
R2=0.85, RMSE=1.35 R2=0.87, RMSE=1.45
First Test Nucleus Flock kill 1
Nucleus Flock kill 2 Nucleus Flock kill 3
15
20
25
30
35
40
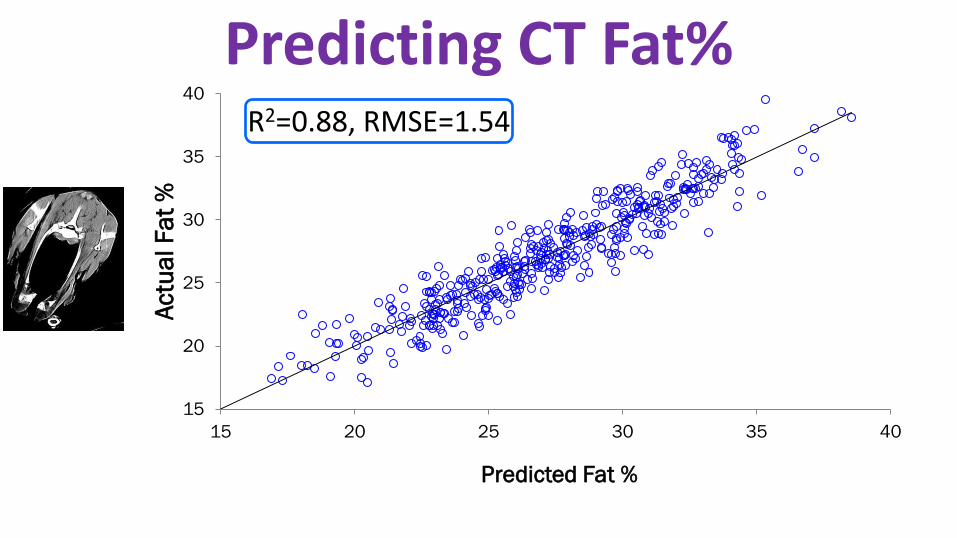
15 20 25 30 35 40
Actu
al F
at %
Predicted Fat %
R2=0.88, RMSE=1.54
Predicting CT Fat%
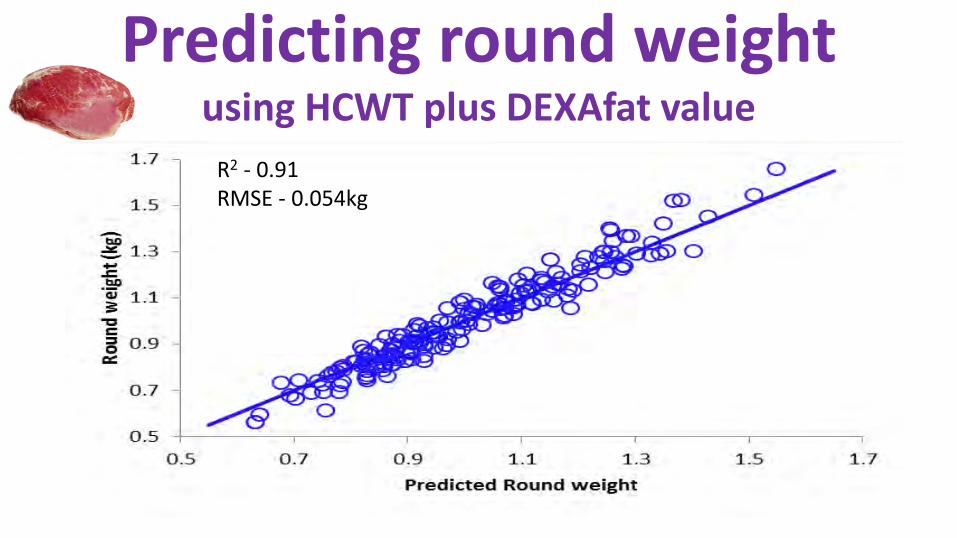
R2 - 0.91 RMSE - 0.054kg
Predicting round weight using HCWT plus DEXAfat value
So where to next…? • Predict cut weights
• Further hard-ware development
• Improved image analysis techniques
• Calibration systems
• Industry confidence
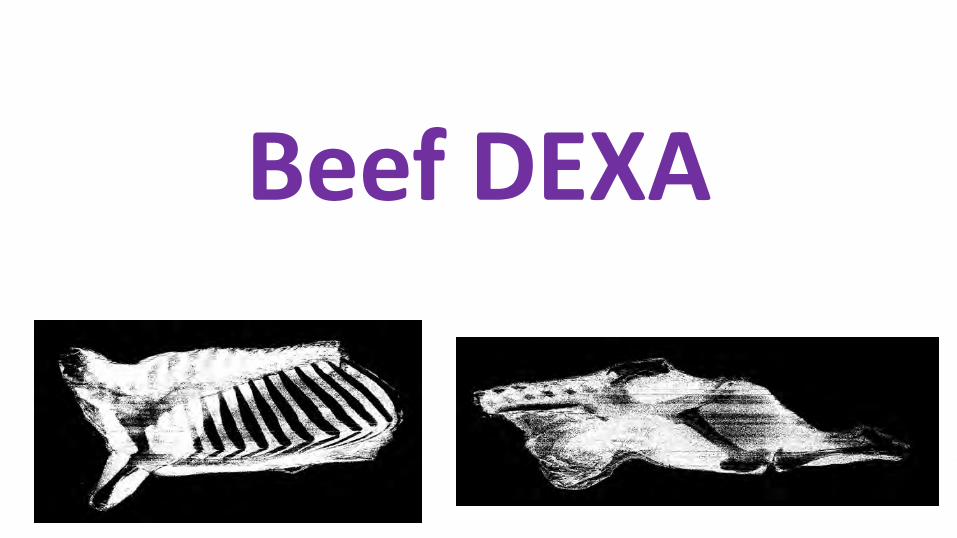
Beef DEXA
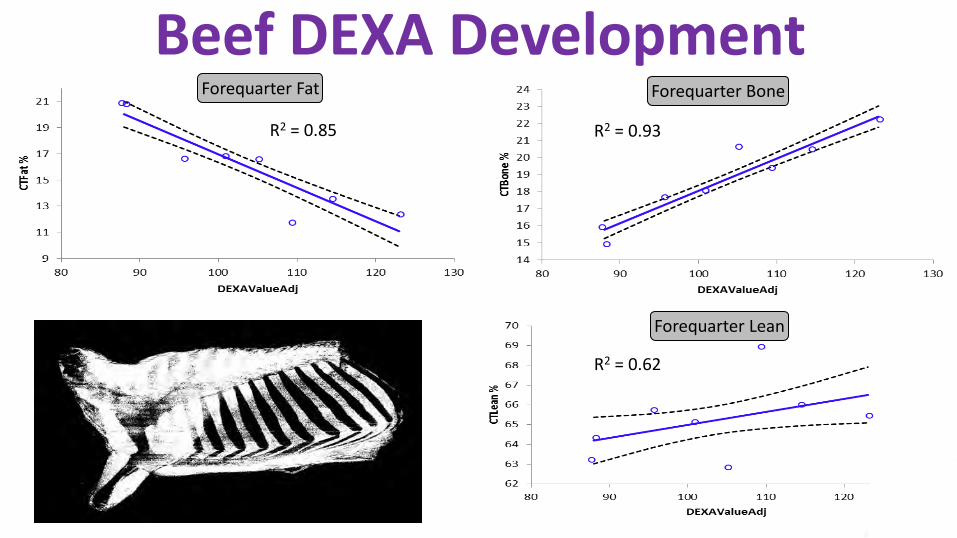
Beef DEXA Development R2 = 0.85 R2 = 0.93
Forequarter Fat Forequarter Bone
Forequarter Lean
R2 = 0.62
Weak association for hindquarter bone (R2 = 0.54)
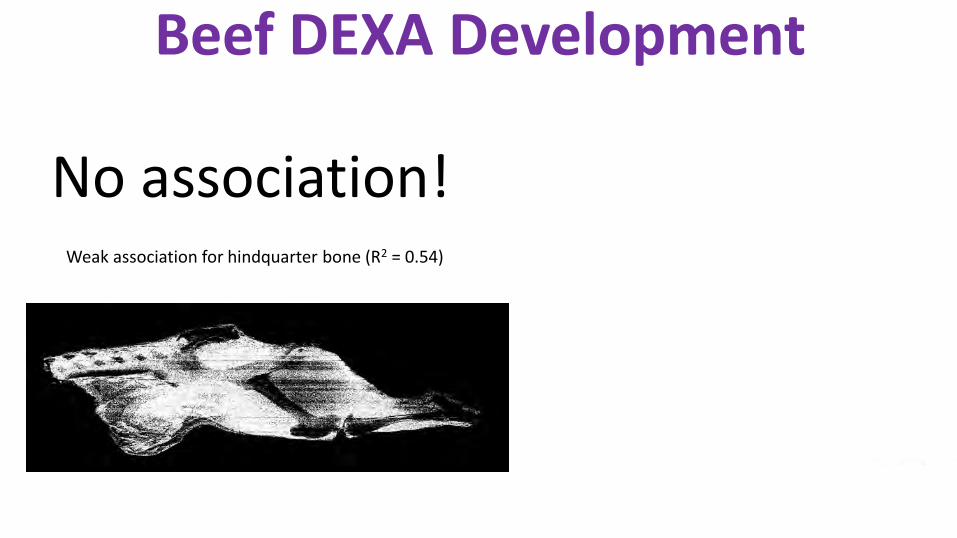
No association!
Beef DEXA Development

Eating Quality “Let’s start with IMF”
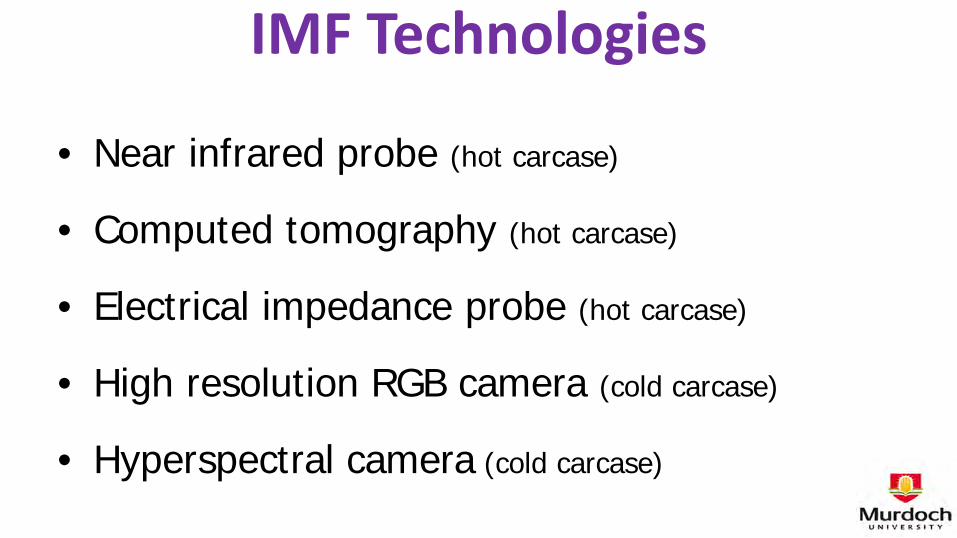
• Near infrared probe (hot carcase)
• Computed tomography (hot carcase)
• Electrical impedance probe (hot carcase)
• High resolution RGB camera (cold carcase)
• Hyperspectral camera (cold carcase)
IMF Technologies

Hyperspectral Imaging
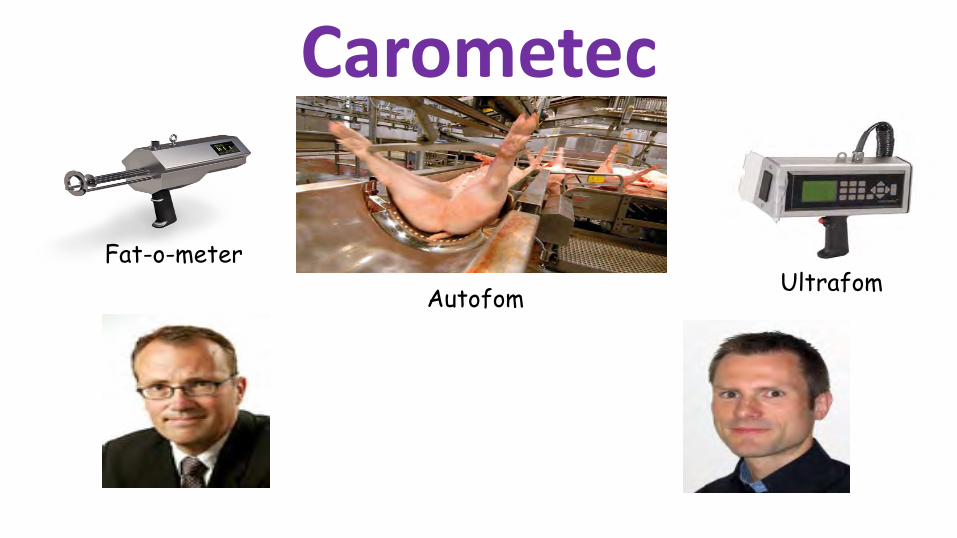
Carometec
Autofom
Fat-o-meter Ultrafom
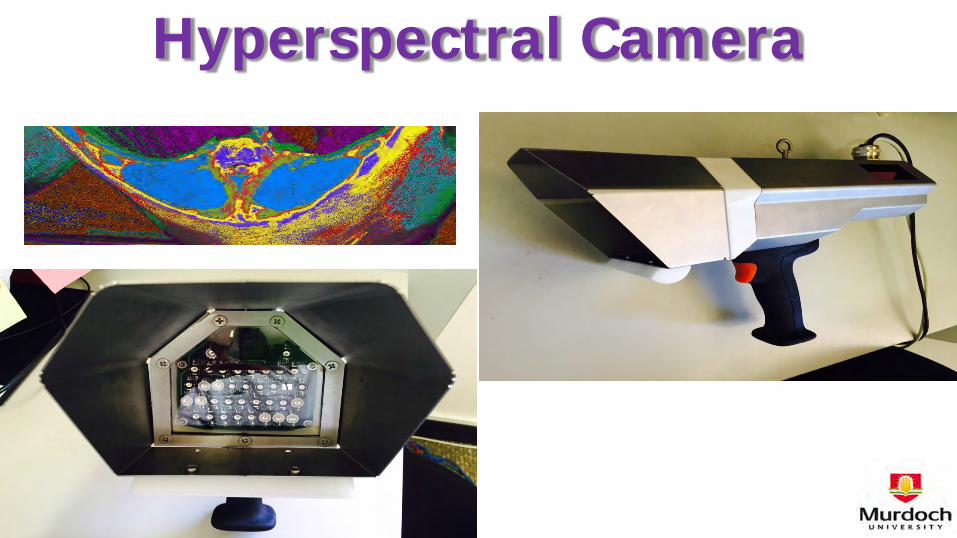
Hyperspectral Camera
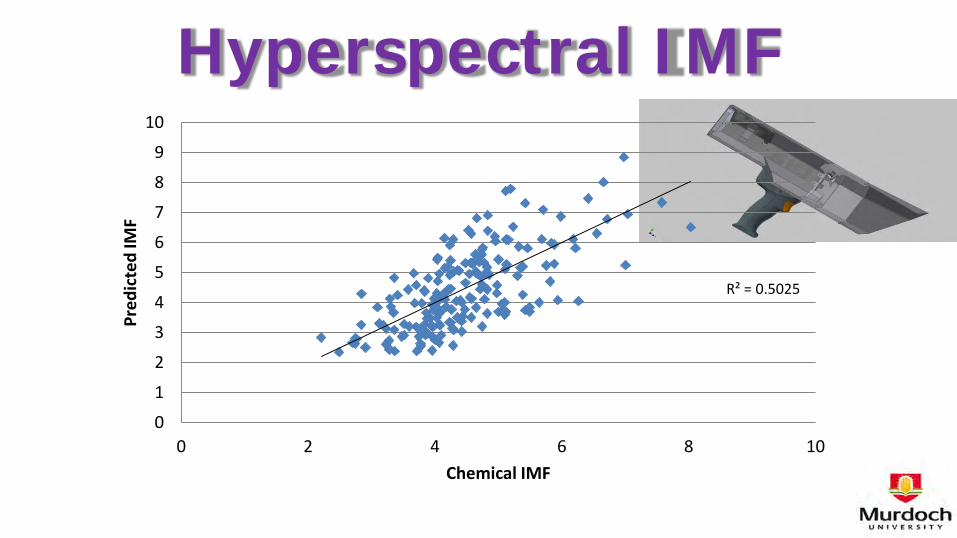
Hyperspectral IMF
R² = 0.5025
0
1
2
3
4
5
6
7
8
9
10
0 2 4 6 8 10
Pred
icte
d IM
F
Chemical IMF
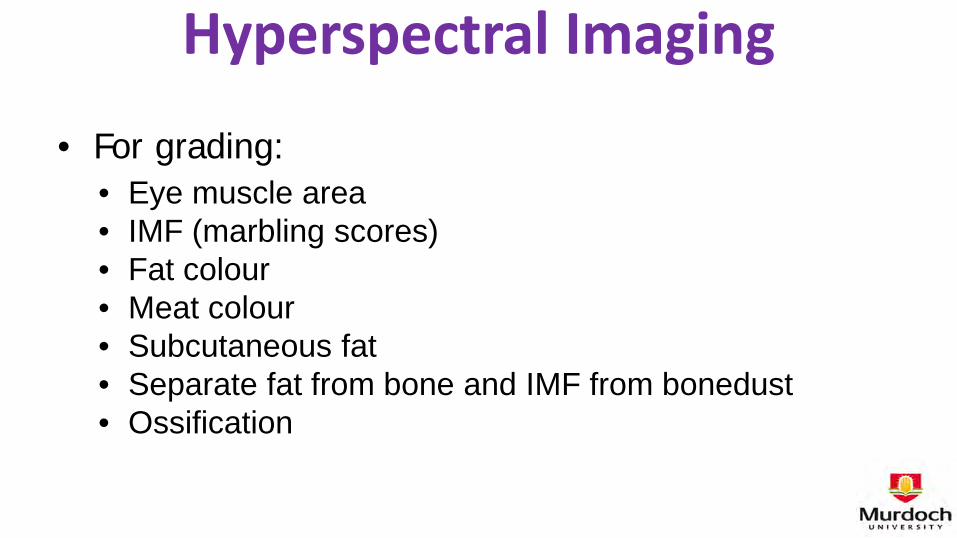
• For grading: • Eye muscle area • IMF (marbling scores) • Fat colour • Meat colour • Subcutaneous fat • Separate fat from bone and IMF from bonedust • Ossification
Hyperspectral Imaging
A key component of MLA’s R&D strategy
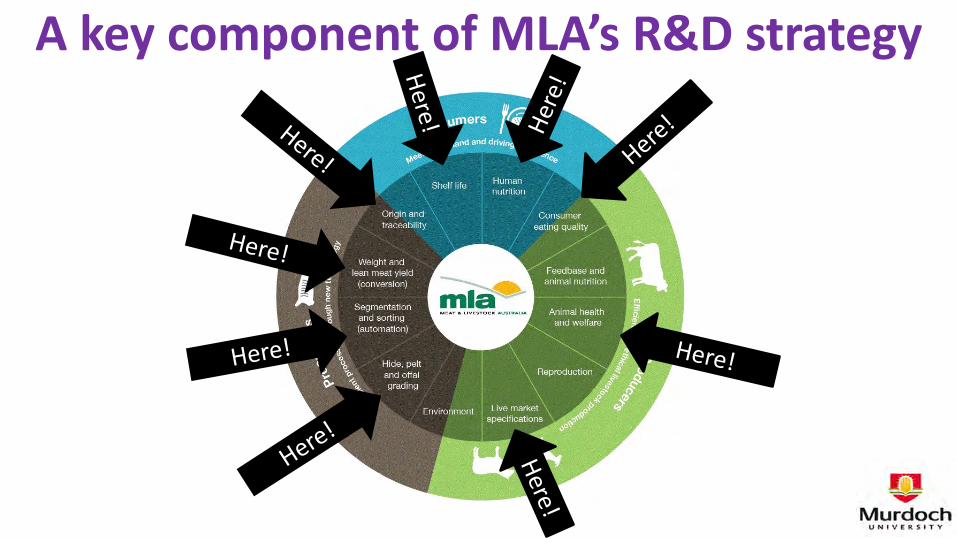
A key component of MLA’s R&D strategy
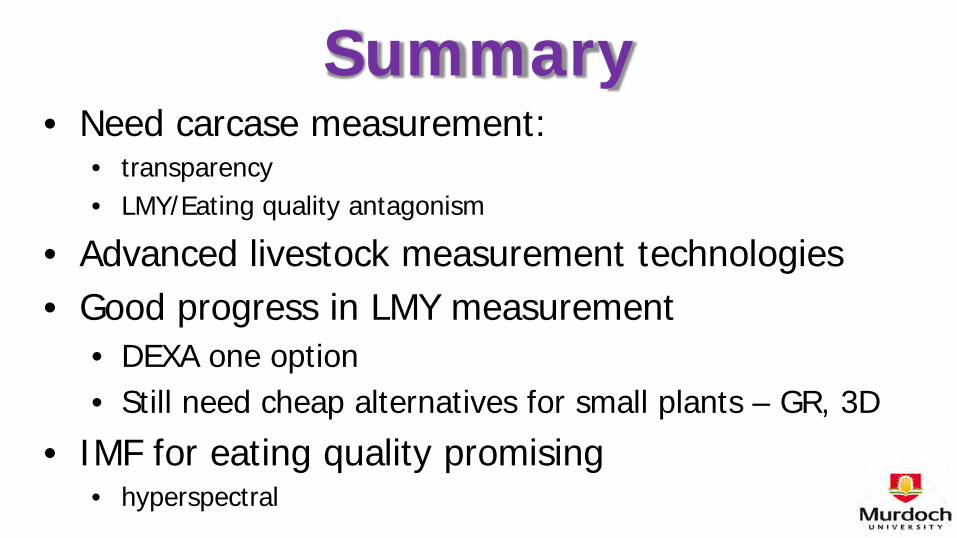
Summary • Need carcase measurement:
• transparency • LMY/Eating quality antagonism
• Advanced livestock measurement technologies • Good progress in LMY measurement
• DEXA one option • Still need cheap alternatives for small plants – GR, 3D
• IMF for eating quality promising • hyperspectral
Summary • Need carcase measurement:
• transparency • LMY/Eating quality antagonism
• Advanced livestock measurement technologies • Good progress in LMY measurement
• DEXA one option • Still need cheap alternatives for small plants – GR, 3D
• IMF for eating quality promising • hyperspectral
Paid for what you produce!

Questions?


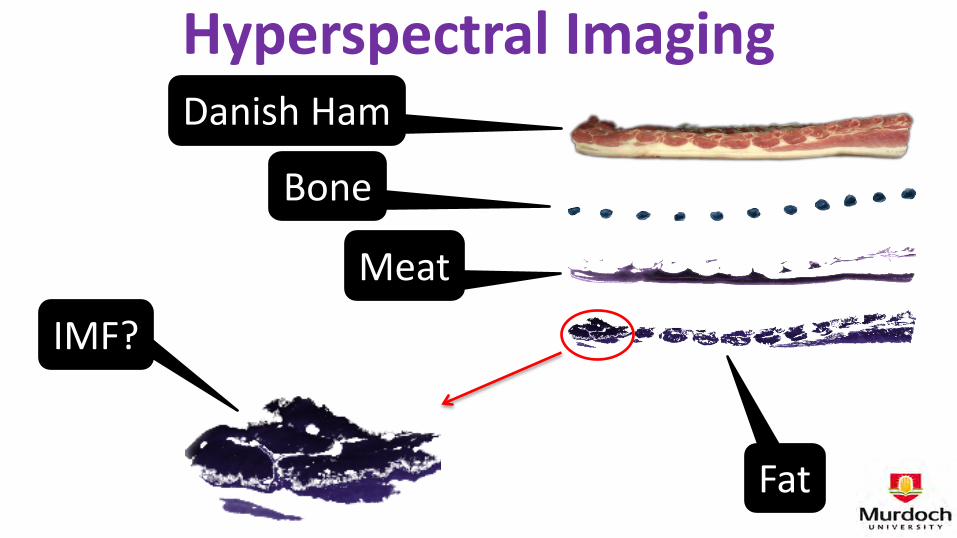
Hyperspectral Imaging Danish Ham
Bone
Meat
Fat
IMF?
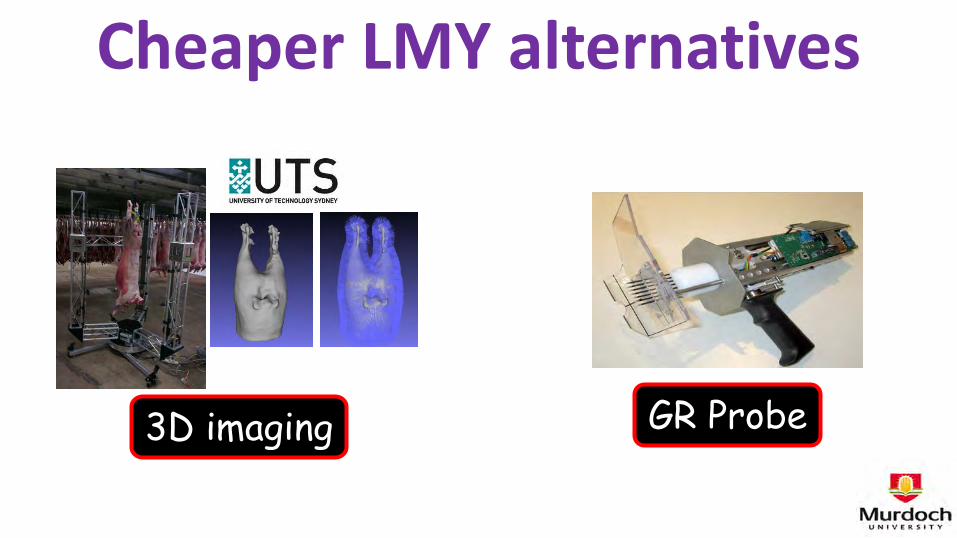
Cheaper LMY alternatives
3D imaging GR Probe
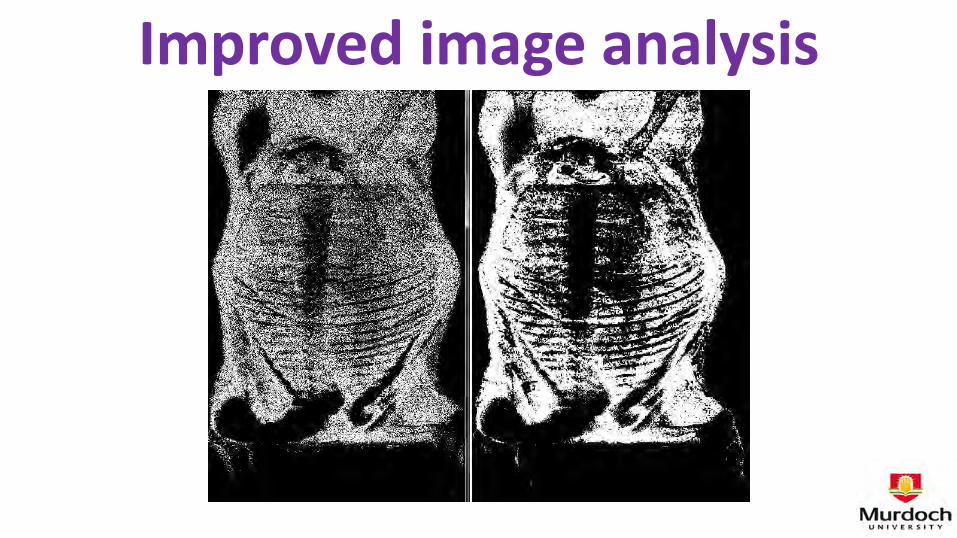
Improved image analysis
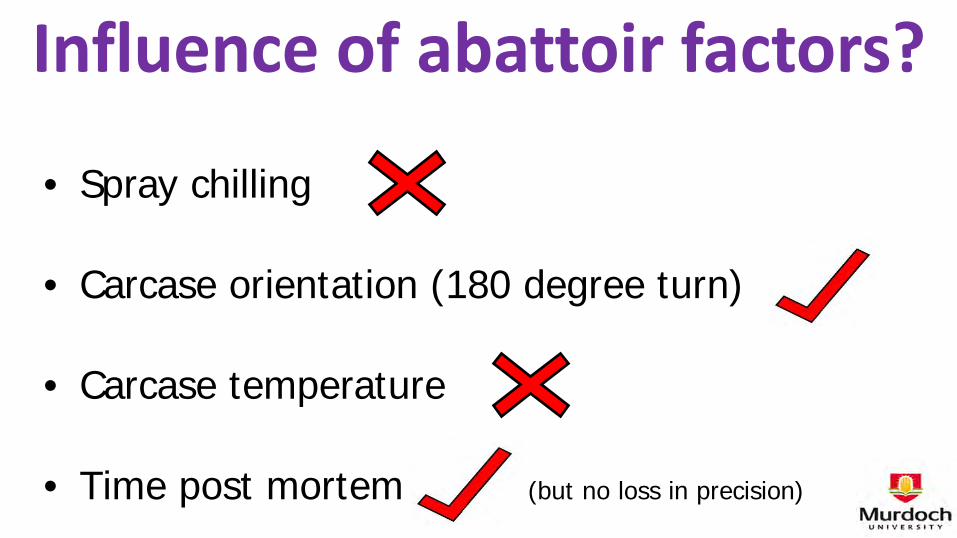
Influence of abattoir factors?
• Spray chilling
• Carcase orientation (180 degree turn)
• Carcase temperature
• Time post mortem (but no loss in precision)
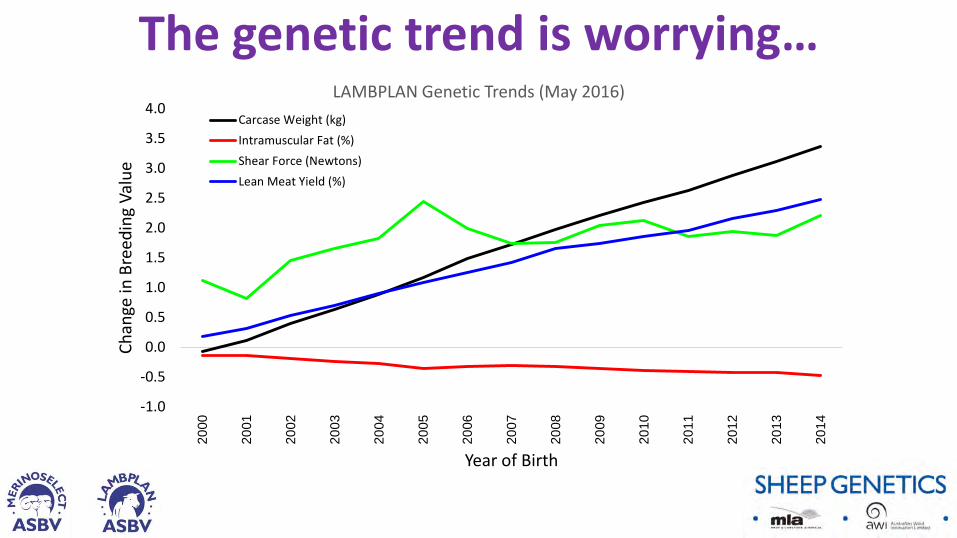
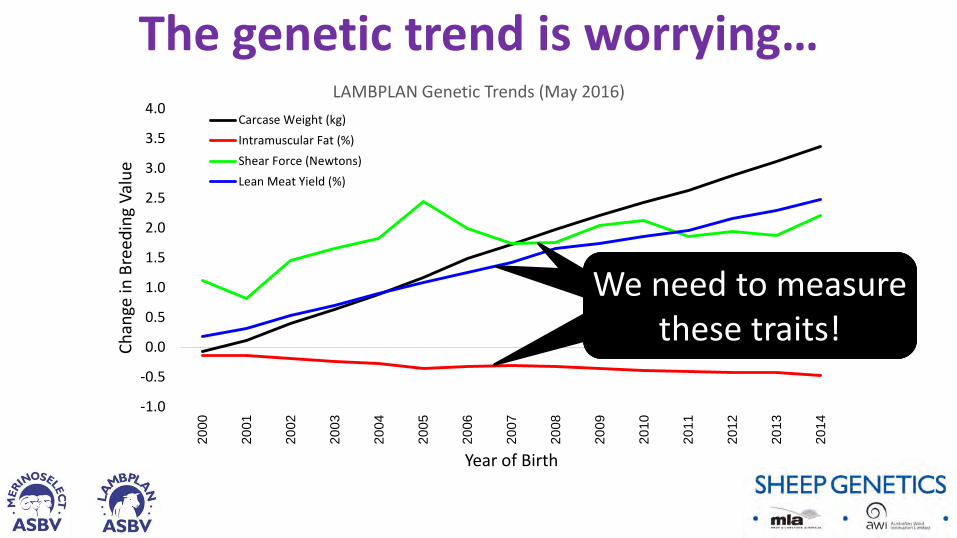
The genetic trend is worrying…
-1.0
-0.5
0.0
0.5
1.0
1.5
2.0
2.5
3.0
3.5
4.0
2000
2001
2002
2003
2004
2005
2006
2007
2008
2009
2010
2011
2012
2013
2014
Chan
ge in
Bre
edin
g Va
lue
Year of Birth
LAMBPLAN Genetic Trends (May 2016) Carcase Weight (kg)Intramuscular Fat (%)Shear Force (Newtons)Lean Meat Yield (%)
We need to measure these traits!
We need to measure these traits!
We need to measure these traits!

DEXA
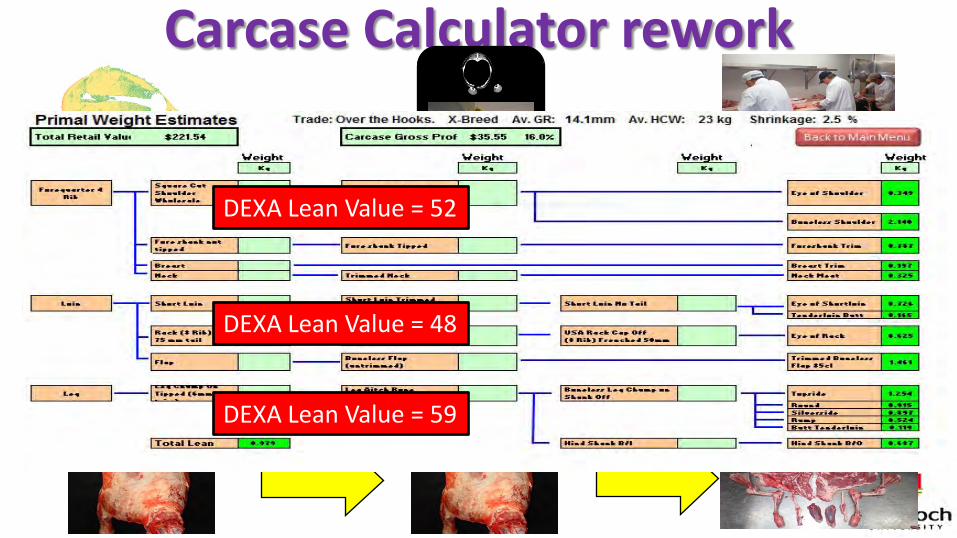
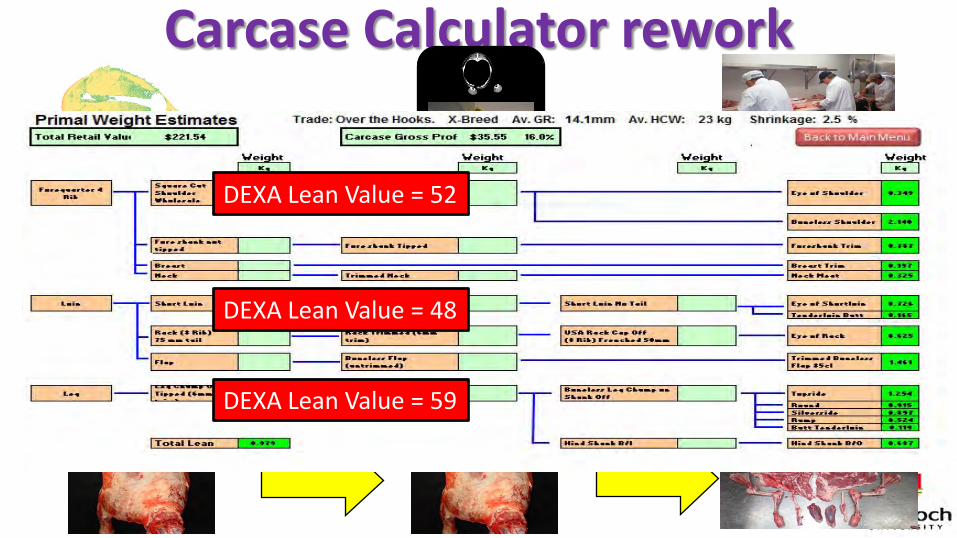
Carcase Calculator rework
CT Scanning
DEXA Lean Value = 52
DEXA Lean Value = 48
DEXA Lean Value = 59
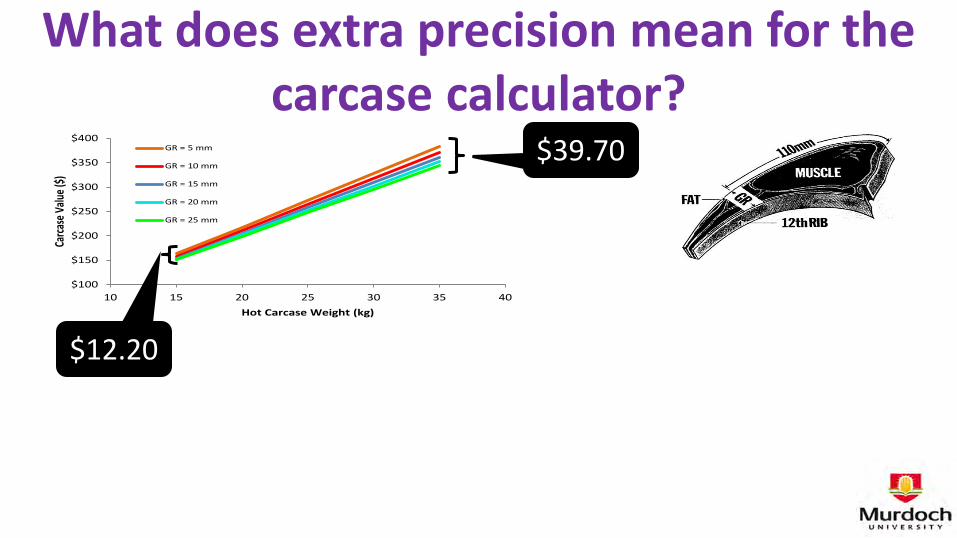
What does extra precision mean for the carcase calculator?
$100
$150
$200
$250
$300
$350
$400
10 15 20 25 30 35 40
Carca
se Va
lue ($
)
Hot Carcase Weight (kg)
GR = 5 mm
GR = 10 mm
GR = 15 mm
GR = 20 mm
GR = 25 mm
$39.70
$12.20
What does extra precision mean for the carcase calculator?
$100
$150
$200
$250
$300
$350
$400
10 15 20 25 30 35 40
Carca
se Va
lue ($
)
Hot Carcase Weight (kg)
GR = 5 mm
GR = 10 mm
GR = 15 mm
GR = 20 mm
GR = 25 mm
$100
$150
$200
$250
$300
$350
$400
10 15 20 25 30 35 40
Carca
se Va
lue ($
)
Hot Carcase Weight (kg)
CT Lean % = 64.7
CT Lean % = 59.3
CT Lean % = 54
CT Lean % = 48.6
CT Lean % = 43.2
$39.70
$76.15 $12.20
$31.91
DEXA
Carcase Calculator rework
CT Scanning
DEXA Lean Value = 52
DEXA Lean Value = 48
DEXA Lean Value = 59
50
52
54
56
58
60
62
64
66
52 54 56 58 60 62 64
Actu
al CT
Lean
%
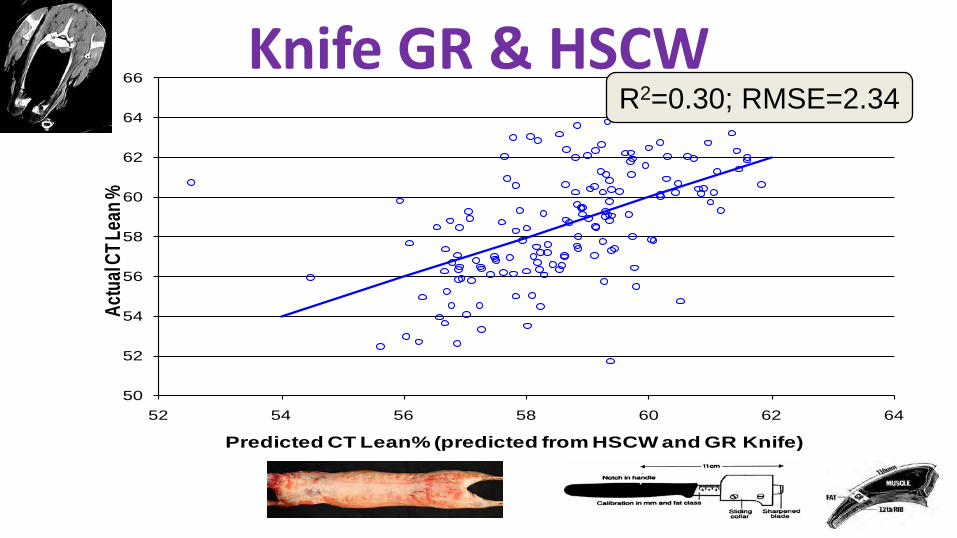
Predicted CT Lean% (predicted from HSCW and GR Knife)
Knife GR & HSCW R2=0.30; RMSE=2.34
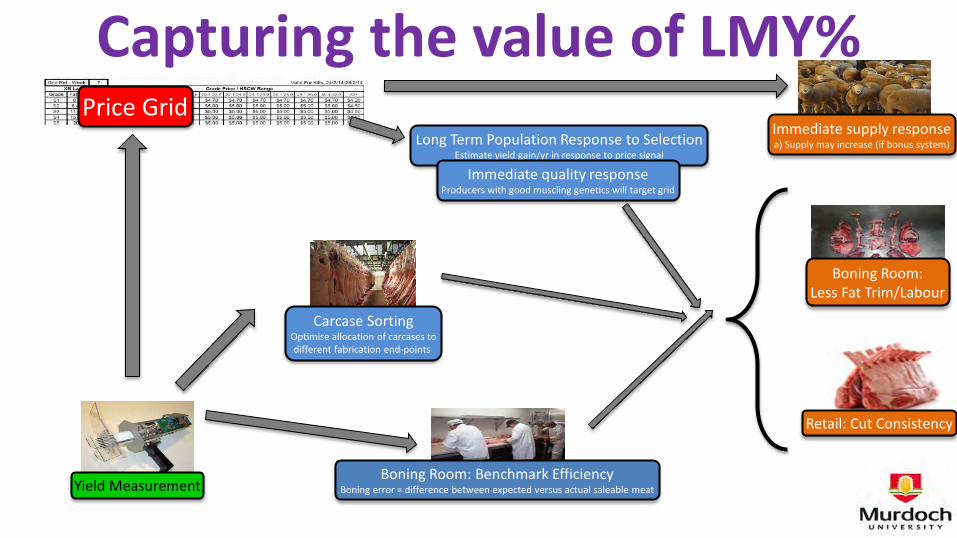
Price Grid
Yield Measurement Boning Room: Benchmark Efficiency
Boning error = difference between expected versus actual saleable meat
Boning Room: Less Fat Trim/Labour
Retail: Cut Consistency
Capturing the value of LMY% Long Term Population Response to Selection
Estimate yield gain/yr in response to price signal
Immediate quality response Producers with good muscling genetics will target grid
Immediate supply response a) Supply may increase (if bonus system)
Carcase Sorting Optimise allocation of carcases to different fabrication end-points
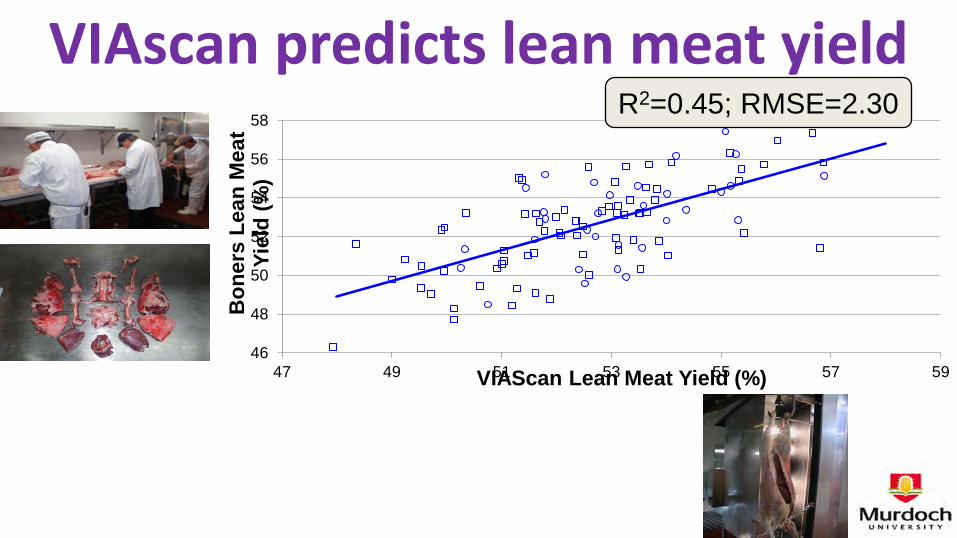
VIAscan predicts lean meat yield
46
48
50
52
54
56
58
47 49 51 53 55 57 59
Bon
ers
Lean
Mea
t Yi
eld
(%)
VIAScan Lean Meat Yield (%)
R2=0.45; RMSE=2.30
50
52
54
56
58
60
62
64
66
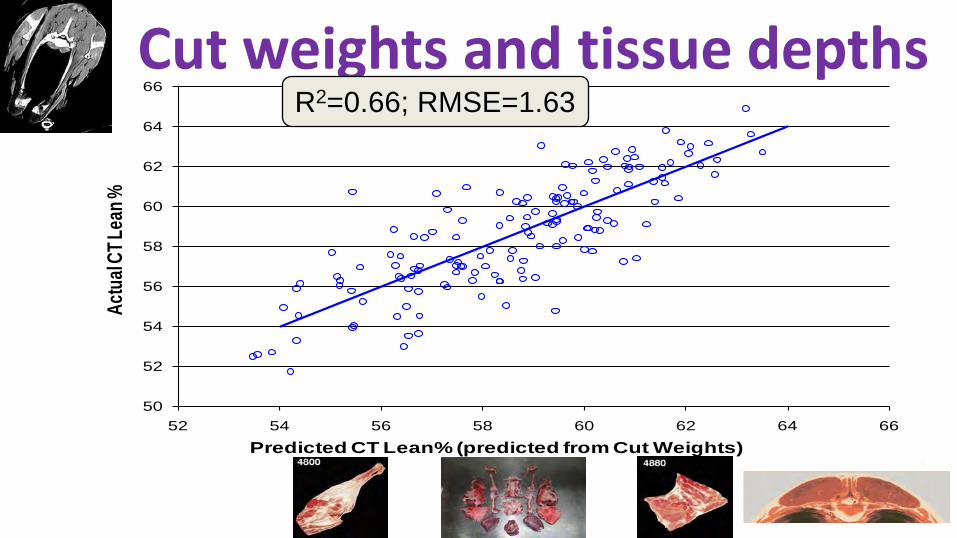
52 54 56 58 60 62 64 66
Actu
al CT
Lean
%
Predicted CT Lean% (predicted from Cut Weights)
Cut weights and tissue depths R2=0.66; RMSE=1.63

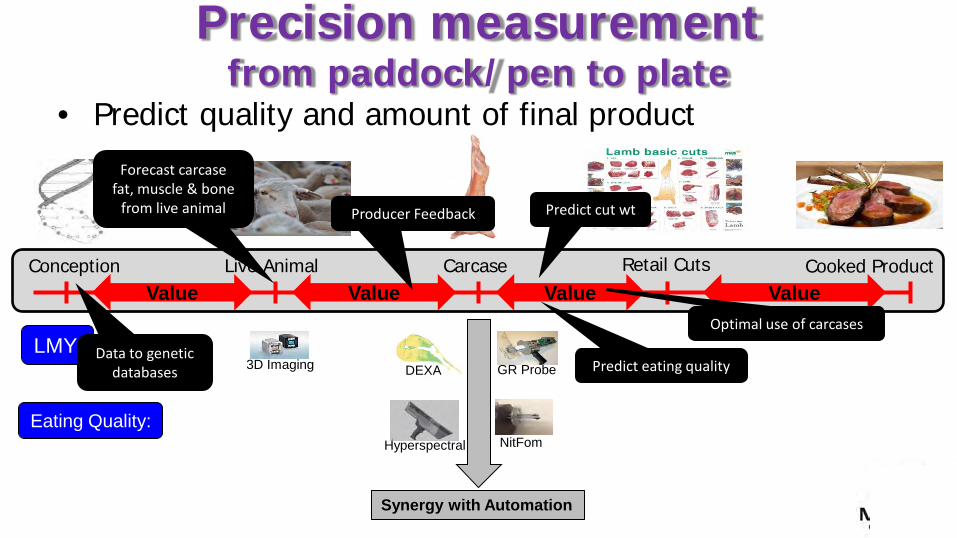
Precision measurement from paddock/pen to plate
• Predict quality and amount of final product
Conception Live Animal Carcase Retail Cuts Cooked Product
Hyperspectral NitFom
DEXA GR Probe
Synergy with Automation
3D Imaging
Value Value Value Value
LMY:
Eating Quality:
Producer Feedback
Data to genetic databases Predict eating quality
Predict cut wt
Optimal use of carcases
Forecast carcase fat, muscle & bone
from live animal
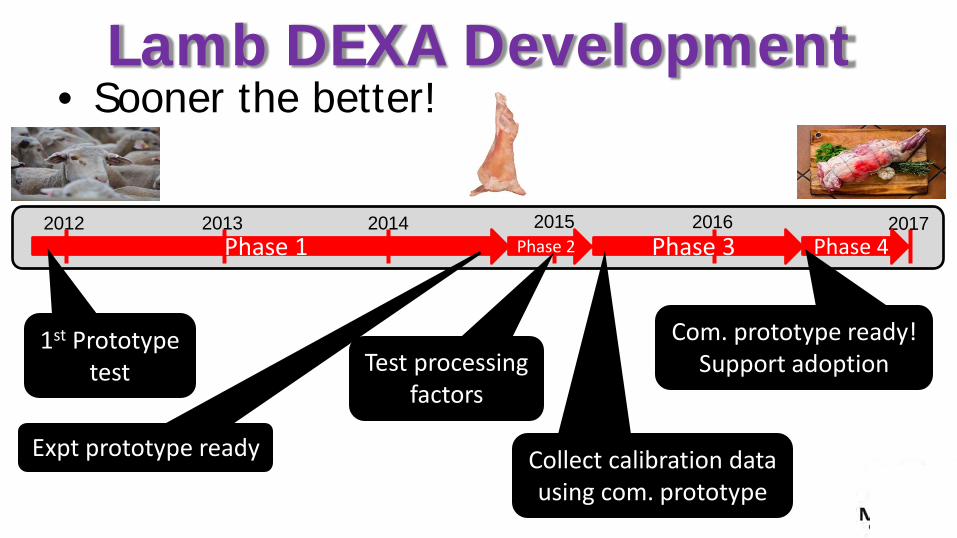
Lamb DEXA Development • Sooner the better!
2012 2013 2014 2015 2016 2017 Phase 1
1st Prototype test
Phase 2 Phase 3 Phase 4
Com. prototype ready! Support adoption
Collect calibration data using com. prototype
Test processing factors
Expt prototype ready
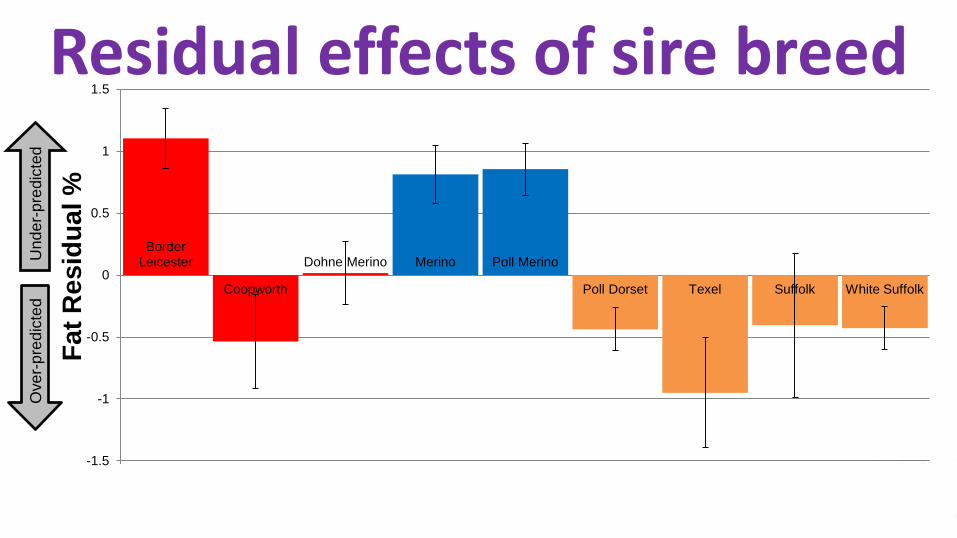
Border Leicester
Coopworth
Dohne Merino Merino Poll Merino
Poll Dorset Texel Suffolk White Suffolk
-2
-1.5
-1
-0.5
0
0.5
1
1.5Fa
t Res
idua
l %
Und
er-p
redi
cted
O
ver-p
redi
cted
Residual effects of sire breed