dispersion experiments with sulphur hexafluoride from...
TRANSCRIPT
DISPERSION EXPERIMENTS WITH SULPHUR HEXAFLUORIDE
FROM THE 213 m HIGH METEOROLOGICAL MAST
AT CABAUW IN THE NETHERLANDS
R. AGTERBERG, FT.M. NIEUWSTADT
Royal Netherlands Meteorological Institute, De Bilt
(The Netherlands)
H. VAN DUUREN, A.J. HASSELTON, G.D. KRIJT
KEMA Laboratories, Arnhem
(The Netherlands)
January 1983

Table of contents
1 Introduction
2 Description of the Cabauw mast and its location
3 General design of the experiment
4 Profile data
5 Turbulence data
6 Radiosonde data
7 Acoustic sounder observations
8 Radiation data
9 Synoptical observations
10 Geostrophic wind data
11 Emmission procedure
12 Concentration distributions and related parameters
13 References
page
2
3
7
12
28
58
72
77
83
99
102
104
128

1 Introduction
In a combined effort of the Royal Netherlands Meteorological
Institute and the KEMA Laboratories dispersion experiments
were performed with sulphur hexafluoride (SF 6 ) from the
200 m meteorological mast at Cabauw in The Netherlands. The
object of these experiments was to obtain data on the dispersion
from high sources. Such data are important for the calculation
of tall stacks, which are presently constructed in large
numbers to reduce the local concentration levels.
In each experiment the tracer SF 6 was released from the mast
at a height of 80 m or 200 m. The ground level
concentration distribution was sampled along one measuring
arc situated at about 4 km down wind from the mast. During
the experiment an extensive meteorological measuring program
was executed. It consisted of the profiles of wind speed,
wind direction, temperature and turbulence measured along
the mast. Radiosonde soundings, acoustic radar observations,
radiation measurements and synoptical observations were also
taken.
This report contains the complete data set of the tracer
measurements and the meteorological observations obtained
during fifteen runs, which were performed from 28 April 1977
until 31 October 1978. All runs consist of two consecutive
dispersion experiments of 30 minutes each.
It is not the intention of this report to present analysis
of the data or to compare the results with other experimental
or theoretical investigations. This may be found in the
studies of Nieuwstadt and Van Duuren (1979) and Van Duuren
and Nieuwstadt (1980).
2 Description of the Cabauw mast and its location
The meteorological mast at Cabauw is located at 51 0 58' Nand
40 56' E in the centre of The Netherlands. The
surroundings are topographically flat within a radius of 20
km or more and consist of meadows, with occasionally lines
of trees, river dikes, and small villages. The surface
roughness, which is determined by a method proposed by
Wieringa (1976), is shown as a function of wind direction
and season in Table 1.
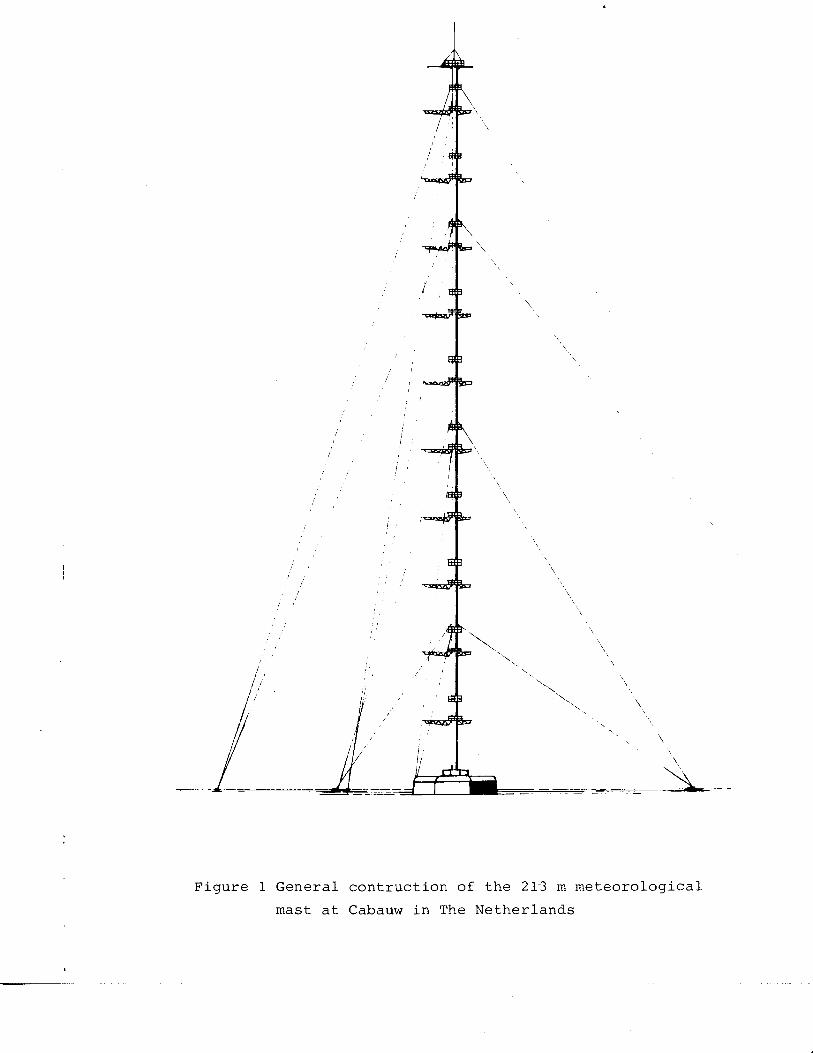
The general construction of the mast, which has a height of
213 m, is shown in Figure 1. Along the mast measurement
platforms are installed with height intervals of 20 m
starting at 20 m from ground level. A measuring platform,
which is shown in Figure 2, consists of three booms, which
extend 9.4 m beyond the mast. The instruments are mounted on
the end of the upwind boom. Additional measurements are
performed on an auxiliary 20 m mast in order to obtain
surface layer characteristics.
A more extensive description of the mast and its instruments
is given by Driedonks et al. (1978).
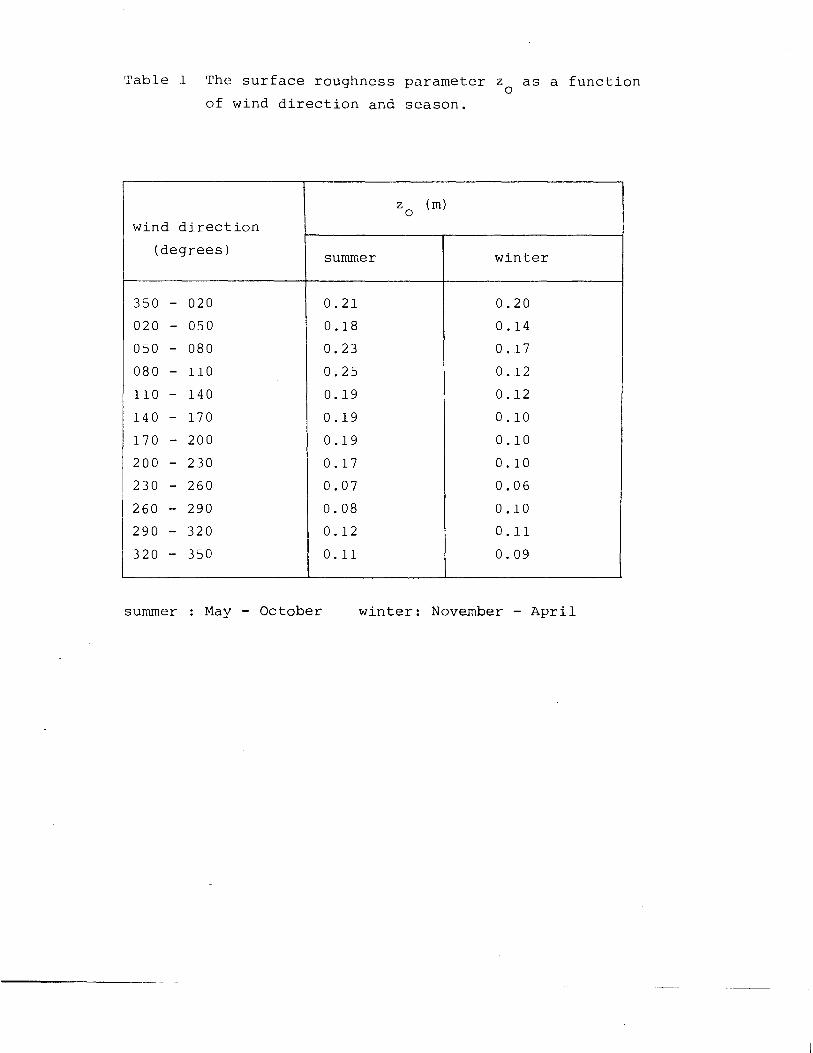
Table 1 The surface roughness parameter z as a function o
of wind direction and season.
z (m) 0
wind direction
(degrees) summer winter
350 - 020 0.21 0.20
020 - 050 0.18 0.14
050 - 080 0.23 0.17
080 - 110 0.25 0.12
110 - 140 0.19 0.12
140 - 170 0.19 0.10
170 - 200 0.19 0.10
200 - 230 0.17 0.10
230 - 260 0.07 0.06
260 - 290 0.08 0.10
290 - 320 0.12 0.11
320 - 350 O.ll 0.09
summer May - October winter: November - April
I I
/
\
\
\
\ \
\
===L.-1---====-~---:-=,,=.-_ ~_ -_-=-=======-l
Figure 1 General contruction of the 2~~ m meteorological
mast at Cabauw in The Netherlands

-6~
Figure 2 A platform with measuring booms

3 General design of the experiment
The tracer is released from the mast at a height of 80 m or
200 m depending on the meteorological circumstances. The
continuous emission is stabilized at least 45 minutes before
sampling. The air is sampled down wind from the mast at
measuring stations which are installed at preselected
locations along a public road. The angular separation
between the measuring points is about 1.50• Figure 3 shows
the sampling grid. The distances between these sampling
points, which are nesessary to calculate the plume charac
teristics, are given in Table 2.
Usually 24 manually operated sampling stations (described in
chapter 12) are used to measure the ground level concentration
distribution. One sampling station was located near the mast
to measure the background concentration. Each measuring
station takes two consecutive 3D-minutes samples of air. So
each experiment consists of two consecutive plume measurements.
The day in which a dispersion experiment takes place is
called run in this report. Fifteen runs are described. For
one run concentration measurements are missing due to
malfunction of the gaschromatograph.
All times in this report are given in GMT (Greenwich Mean
Time). The local time is GMT + 2 hours on 3 April -25 September
1977 and 2 April - 1 October 1978 and GMT + 1 hour otherwise.
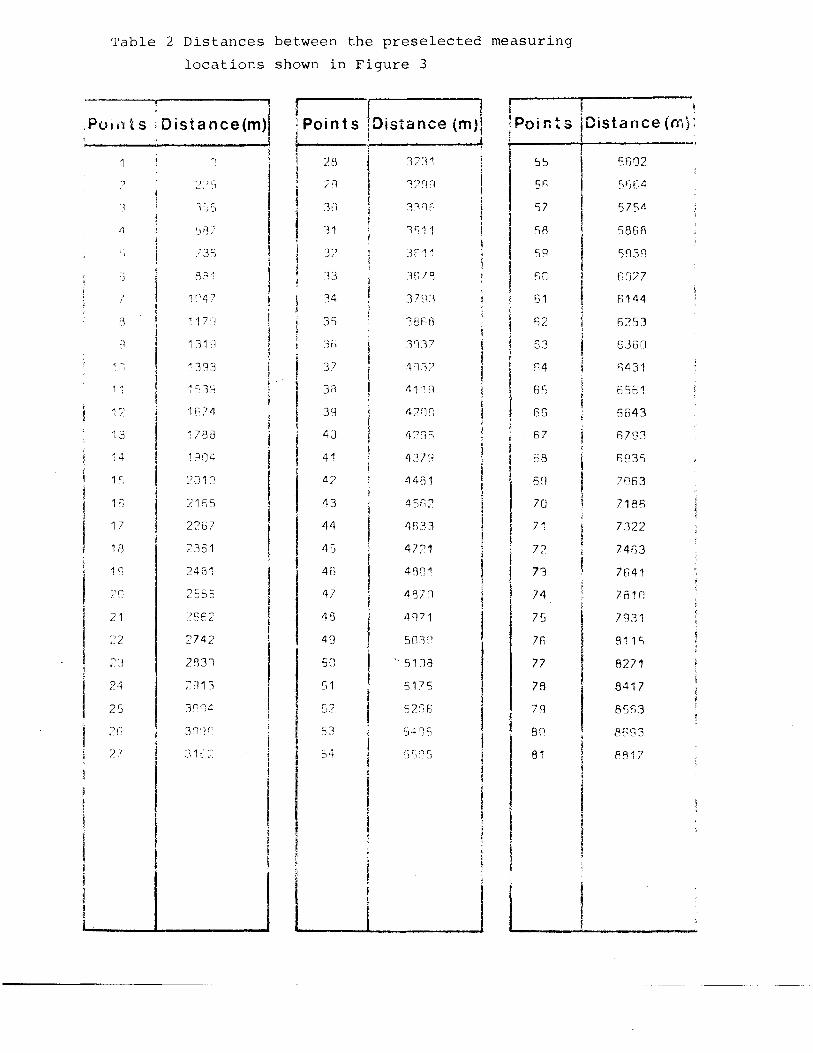
Table 2 Distances
locations
• t
.Ptlu1tS :OistanCe(m)! !
'J I)") e-l., 1
:' ]",,",
II 'JR,'
, , 7]'1
') 0]":
7 1 :4 7
[3 1 1 7 ~~
:1 1 31 'J
1 , 1 3CJJ
1 . c, )'1 i
A ~)
\ ./. 1 t, 7 4
'1 3 700
14 1 ~CJ4
1 c 2Q1 n
1 f) 71S5
1 7 27EiI
1 a 2361
1 <] 2451
2CJ 7<;-<; " J::>_'
21 /f~S2
',., 2742 l.~. L:
;'J 2fl3n
24 2CJ1 ::1
25 30lJ4
~F) Jflql-~
7. 7 31 t .,,,,
,',
i
I
between the preselected measuring
shown in Figure 3
I !Oistance
I Ip . ~ I :Points (m)j I 011"1 ~S jDistance (mj: j
l 1 i I , 1 28 I ]2~i 1 55 SRI]2
?iJ I 1?q0 5F; c)·jf,4
I 3D 3~~qf; 57 57511 j
31 I l'i 11 58 586fl l 3Z 'J:,-- 1'"
~) '. I I ~i9 5~13q
~)3 I>:! 'l 6n [027
34 37q3 61 f,144
35 38Ul Fi2 fi2'j3
3h 3'137 63 63ri'l
37 'l'n? £;4 r,431
3;1 41:'1 fi"O t) SS 1
3:1 47(')["', 66 G643
4J 4~:q ; 67 fi7S]
41 4JJ:l [;8 fC~)35
42 44il1 6:) 7063
43 4SFi7 70 718fi
44 4f;:lJ 71 7322
45 4771 n 7453
4G 4Br]1 71 7641
'ti 4Bln 74 7flHl
46 ,l'1 7 1 75 7931
49 SWl ,) 7fi 811'i
5" (, '. 51:lB 77 8271
51 517"0 7fl 8417
S2 52'':;8 79 85'13
53 :J~IJS 80 8f93
')4 ~) ~J0 5 81 [<817
"-'------L-.-----iil '--------'-----..JI U,,,,,,--, --:._

Table 2 (continued)
Poin t s Distance(m) Points Distance (m) Poi n t s !
Distance (m)1 t ~------~----------j
82 8942 " ! 83 9067
84 9192
85 9319
86 9424
87 9526
88 9626 I 89 9725
90 9825
91 9930
92 10026
93 10126
94 10226
95 10327
96 10428
97 10528
98 10616
99 10719
100 1[)809
101 10887
102 10954
103 11048
104 11187
105 11373
106 11527
107 11691
108 11806

Table 2 (continued)
. ~ IPoi n t s ~ Dista nce(m)
11 n ,1 111 249
112 476
113 609
114 8[;4
115 10S Cj
116 1273
117 1411
1-15 15A5
110 1758
128 1 'l[jS
1?1 20fl1
172 22\5
123 23E,S
124 2573
1'25 ') --") -. I- / ,,_0
126 2923
127 3061
128 23[)~-)
129 3421
13;' 3590
131 3761
132 3928
133 4J7FJ
134 425:-,
135 440fl
136 4609
,Points Distance (m)
I 137
136
13'1
1'10
141
142
i43
"144
1.1 .-,
HS
147
148
H0
1 L:"l
1";1
152
153
1')4
1')5
156
157
158
159
161)
1f:i1
162
1[3
I -I
I I
4744
4889
49;5
5132
S23G
')336
5412
~:l7~
:)r,4 ::J
5758
SBril
S'l7il
r;r;7r1
~; 1 7 ~~
62711
S3tj~!
ti47E
f, Sf) 3
~jfi 1 S
fi78fl
G:JQ::J
7 '')8.1
? ::;70
7502
BrJCA
8319
852[)
Point s Distance (m)\
164 871'1
165 89S5
166 !J190
167 q453
168 9695

SCALE
o 2k ..
Figure 3 Map of the area in the neighbourhood of Cabauw
with the preselected locations of the sampling
stations

4 Profile data
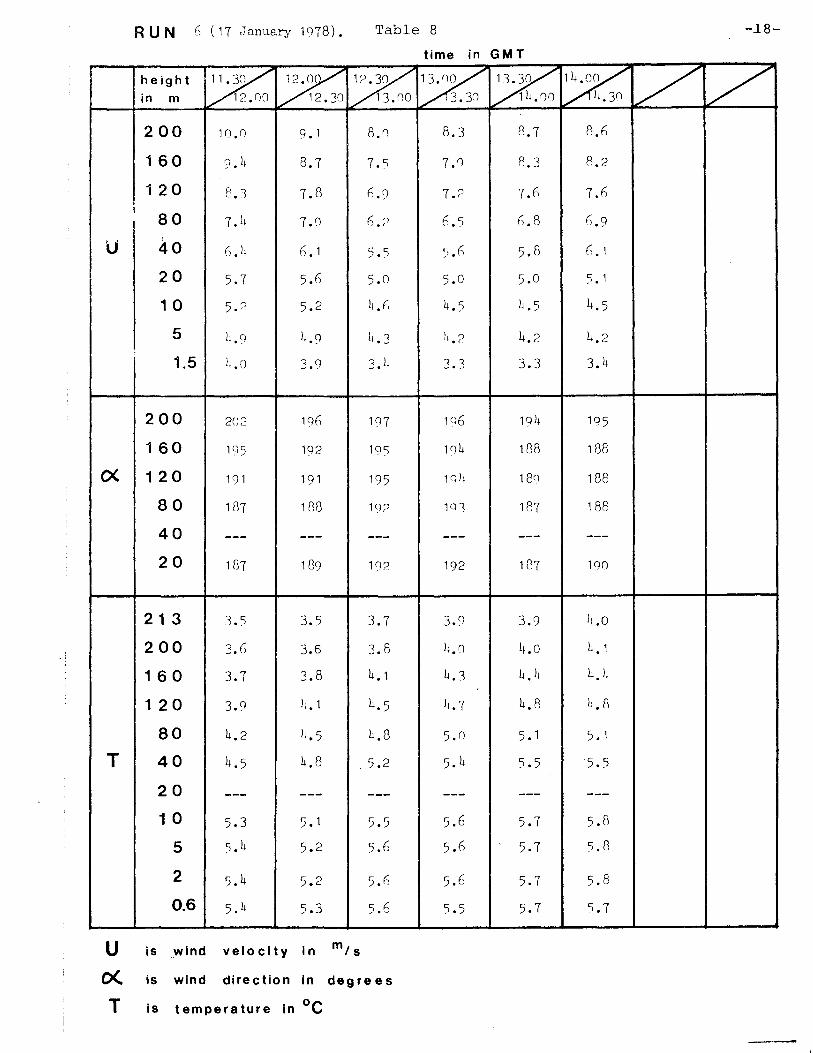
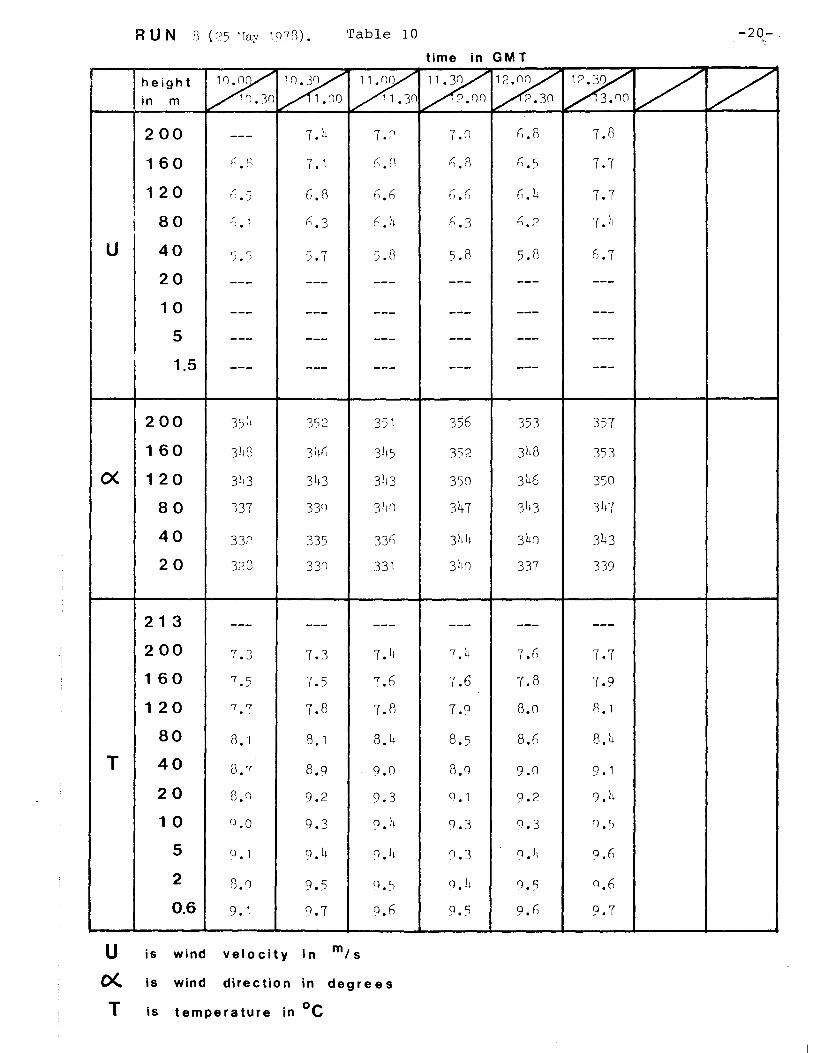
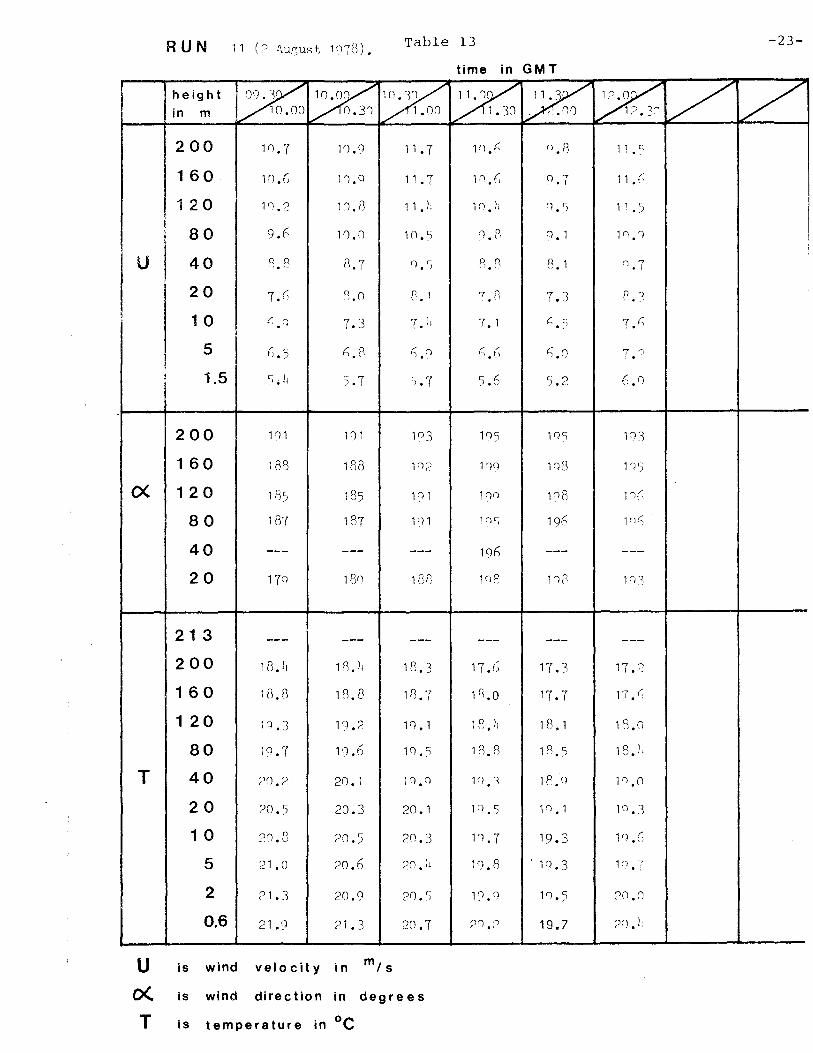
The 30-minutes average wind speed U (m/s) , wind direction a
(degrees) and temperature T (oe) are presented as a function
of height for each run in the Tables 3 to 17.
The wind speed is measured with a cup anemometer with a
starting speed of less than 0.6 mls and a response length of
2.9 m (Monna and Driedonks, 1979). Wind direction is measured
by a wind vane. Its damping ratio is 0.4 and the damped wave
length is 3.8 m (Monna and Driedonks, 1979). On the levels
where trivanes are installed, wind direction is no longer
measured by the vanes but by the trivanes. Temperature is
measured with ventilated, shielded thermocouples (Slob,
1978). The inaccuracy is about 0.05 K in dry weather conditions.
The signals of these instruments are recorded as two minutes
aveiages and stor~d on, paper tape. This p~per taperegi~tration
is processed and checked bya c6mputer, which calculates the
30-minutes averages.

U
ICX
, ,I
~
l I
T
U
0<. T
RUN
II ~eight In m
i i200
I ::~ 80
40
20
10
5
1.5
200
160
120
2
2
1
1
is
is
80
40
20
1 3
00
6 0
2 0
80
40
2 0
1 0
5
2
0.6
wind
wind
(28 Anril lin). Table 3 -13-
time in GM T
~o ~jr., ,~11 (1(', ~'1 "<", , %" :,n %,.,?n ,~,') (\': " ~'-: ""n :/ • 'J ". , 'eJ" '." .(. ,,_, __ I. ' ~J.
11.nn 11.3n 1".00 1~.3~ 13.10 '3.3n 14.10
'( • 5
'( . ') 7.3
6.8
h.O
5.6
5.3
1+. 1
1S7
,,-;6
9.(!
VI.')
1 :) • i)
11.1
11 • IS
11 " 7
11 .0
1:: 0 -" .'
1;:>.2
1:-'.5
velocity
direction
,0" ~, 7. r
A.3 (~ , r;
r. 1 (,
" .~
'T.e " r · 7 5 7 ., I · I .'
r; · '( ~ · j f~ ., L; .n .'
S r c, · ), 7 :; ') , . · .J
1 C;0
1 {,' ,!
In.3 1().(
F).it 1 n.:?
Fl.? 11. ?
11 .3 11 . 7
11 • '( 1 " " I, .'/
1:'.1 1 i) • )i
1" ') (. - . -) 1 ~) ,,0
1 ?), 1~" p)
1 ;-:"" ( 1 ;: " r:l
12.7 13. 1
13.1 13.1;
in m l s
in degrees
'7 ) ~ I . 7. IC
". \ :
r .r) ')
h .5
s .7
':; .,
.' , c: Ii ." 3 () .
1" '~ ! .• '
1 . 1
11. II
1 1 .n
1 ~) , ~~
1 c'. ,0,
13.'1
1--' 1 I ,) •.
1'") " , .) . -)
n.r;
l::.r
7. q n '. 1 • 1 ,', r;
7 r, '7 'J .J I · · 7 :- '7 ( ," · · '7
• rj 'T i', e, ~
· (, ~! (". 1 " .2 · r; .5 r; '-'1 r' .')
r; .n I. r, (~ ! -~
1: r~ ,
,") ,
" · " ~ . 3. c; ~.
~
, .~ . G
. ('
I"
1 c;( 11 :-:
)7
1 1 1 , .c 1 , (". .' · · 1 • 11
/
1 1 , , 1 '( I · , ·
11 7 11 1':" 1 . · 12.? 1 r, ic 1 ~ · "; 1?~ 1'; I' 1 " · ! " · 1 ., n 1 -:: , ~ 3,,~' . · 15.1 1 ~
I' / 1-'. _~
n.? 1:- • .. "1 ...... 1 ~ j ~'" I l
13.: 1;. .. 1 ')" ,II
13" 1! 13. :~ 13.3
1 ') r; , " 1-) Cl --" " ) " ~) '.
is temperature in °c

RUN ') (L' October l<)n). Table 4 time in GMT
I I ~eight ~ % % % ~ ~ V -;7 I '. 1h.()() ; In m 11.30 12.()() 2.3CJ 13.CJ0 13.30
1200 G r") I • Ii. ), 9.1 qJ 9.0 13.h
160 7.r) p ~ 0.0 0.3 R.8 8.2 I ' .. .., ! '120 '7 '7 9.3 Q .0 9.1 8.8 8. 1 : • I
I )
I 80 7.3 o.n P.5 p,.~ [l.h 7.7
I
i U 40 h.O 7. )t 7.0 1.7 7.'l 7.0
20 6,8 7.1 7. 1 7.2 7.3 h.7
! 1 0 .s • 11 6.6 h.h h.7 6.h 6.0 ,
5 5.'l (j. 1 (j.0 0.? (;. 1 ') .11
I 1.5 )< • () 5.1 5.0 'i. 1 ') • 1 hJ;
200 2(),') 200 105 105 205 21 1,
160 11'1,'< 108 1 (l3 1'11 203 212
ex 120 l(ll, 1'11; 10 5 1'1? 197 2()h
80 1 '13 10)+ 1011 1'13 107 20h
40 --- --- --- --- F1c) 203
20 10] 1C)3 187 105 1(n 202
21 3 1?1 12.6 1 3. 1 13.Q 1h.3 ---
200 1?3 12.8 13.3 111.0 1h.h ---
160 1;).7 13.2 13.7 l1t.h 1h.8 15. 1
1 20 13. ? 13.7 1 )t .2 1 ), • () 15.3 15.5
80 13.") 14. 1 1 h. 6 1").3 15.7 15.0
T 40 th.r) 11;. ') 15.n 15.7 16. 1 16.3
20 1 ); • ;" 11~ • 7 1c).;? 1C;.Q 1(.2 1h.h
1 0 1[,. :3 14.'1 1').3 1(,.0 16.h 1(,.5
5 lit.) 15.0 15.5 1(; • 1 16.5 1h J
2 11,.6 15 • 1 15.6 16.2 1f).h Hi.h
0.6 lh.9 15. 1\ 15.0 1(,.5 16.7 10.6
U is wind velocity in m, s
0( is wind direction in degrees
T is temperature in °c

U
0(
T
RUN 3 (1 fJ October l~)TT).
I height I in m
200
160
120
80
40
20
1 0
5
1.5
2 0 0
1 6 0
1 2 0
8 0
4 0
2 0
21 3
200
160
120
80
40
20
1 0
5
2
0.6
" ~) · ·
/ r
( · () c ') / · 1: (,
L · ;, ~) · -, 'J
'j · .)
1 1J L!')
1 ' , "l'f
1 I ,-· ~ ~-)
1 ~"J
1 ),-, , ,
11.8
11.1
P.1
12.(';
1?0
13.~
13.r:;
13.8
13. 0
" ~ t" · 'I
c 8 · r:
5 · t~ r. , ·
L :3
1 ') · 3 ~
3 · 1
1 c:l+
1 5 1
1 ~) 1
1 !~?
1 l+{~
1 r') .., I ( • I
L'.2
13. !)
13. L
1 L. 1
11;. ?
1'1.8
U is wind velocity in m/s
Table 5
time in GM T
"
, ~
, , · " 1
it , ·
I ; ~ . · ,.
...J
j · 1
1 r: ~.(
,'J
1 I- I
1 ~.; ; l
1 (~7
1 :'l[)
1 'J '"? ..J. i
1 L. i
1 I: •
1 ) i • '1
1 r; (' ." VI
')
- , ·
1\ I ') · . " 1 , .
i 'I ..
~)
~J c
e , ':) , " ~/
" 'I ~) ,ll · ('
1 ,--/
1 C;,"/ ' ,.
1 '13
1 [-; -S
1 ~,: S ~ c; ~ .•
, I, ~ 1 ! " ~
1 :<. '( 1 ~ j • 1
1 Ie. 1
, \ '-. '''. ,
. , , .
0<. is wind direction in degrees
T . °c IS temperature in
-15-

RUN Ii (:>7 October lCJ77). Table 6 -16-
time in GM T
height ~ % ~ % ~ % ~ / in m 1;'. 30 3.10 3.30 l;.(1) .• 30 5.0,1 5.3n
200 ". :3 1f.11 h.'! I, P- 11.? h.3 4 1, ", . , 160 h.l 4.2 4.1 )~ • 5 3.9 3.8 3.7
120 3. () 1 •• 2 h.o h.? 3.8 3.5 3.5
, 80 3.(, 3.G 3.5 3.(; 3.4 3.1 2.7
U I 40 I 3.2 3.5 3.3 3. 1 3.0 2.6 2.3
20 2.q 3.2 3.0 2.9 2.6 ?2 2.0 j 10 ? ?\ n ? .11 I " f) 0 ?7 2,0 1 ,0 , .. c. \,
5 ?h r, '7 " . , ? (, ?ll r) ')
c •. '. 1 • il 1.7 , I
I 1.5 -) co 2.3 2.1 ?n 1./) 1.6 1.11 , :. __ c
200 1 nr; 182 17'1 181 175 184 181,
160 1 ()l; 1'(7 175 1711 l(;u 170 171,
(X 120 185 178 173 172 1(;3 159 ,r,5
80 1% 17C) 1/2 171 162 157 1 (,8
40 --- --- --- --- --- --- ---
20 1(,<] 163 15h 1 ') 1 147 141 156
213 o " . .- 0.4 9,5 0.7 0.7 9.7 0.8
200 (J.lt 9.5 9.6 9.7 C).8 °.7 Q.8
160 0.6 9.7 0.8 Fl.O 10.0 10.0 1(). 1
1 20 '1.0 9.9 F).O In.2 10.3 10.3 10. J,
80 1 n • J+ 10.3 10.1, In.5 10.5 10.6 In. 7
T 40 10,5 10. 1\ 10.5 10.7 10.8 F).8 11 • n
20 Hl.9 10 .9 11 .0 11 • 1 11 .3 11 .11 11 .5
1 0 10.7 In.7 10.9 11.2 11 .4 11 .5 11 .6
5 11 • 1 1 1 • 1 11. 1 11 .3 11 .5 11 .6 11 • (,
2 10.8 10.8 10.'1 1 1 • 1 11 .3 11 .6 11 .6
0,6 10.9 10.9 11.2 11 • it 11 .5 11 .?; 11 .7
U is wind velocity in m, s
ex is wind direction in degrees
T is temperature in °c

1 i
"
I ,
t U
i
ex
T
U 0(
T
RUN ) (22 Decenher 1077). Table 7 -17-
height in m
200
160
120
80
40
20
10
5
1.5
200
1 60
1 20
8 0
40
2 0
21 3
200
1 60
1 20
80
40
20
1 0
5
2
0.6
is wind
is wind
time in GM T
i 11. y, 1?OV 12 • 3V 13.o/ 13.3Y /' / /
V>?Oo/1?30 ,/13.00 /13.:30 ~i.i1() ~ __ / /
1 1 • 'I 11.3
1 1 • n 10.?
1 (). 1
[. 'J
5.7
c:: n /' . -' 5.1
5 .~ • J
3.9
?;}() 2~1
~? 11 217
209 ?O0
~) 1 1 ?OSJ
F)G 1CJh
11>< 10h
0.0 s.n
8.0 f.?
R.n G.O
8.0 R.1
8.3 8.4
8.5 R.7
8.7 B.n p, n 8.9 " • 'v
n.n CI.n
8.0 9.0
8.8 R."
velocity in
direction in
m, s
9.5
'7 ') I.::.
5.3
210
215
207
?OR
---
10e;
~:. n
G.?
8. 1
e.3
tLr;
[). PI
8.1l
O.G
9.0
9.n
q.o
degrees
1 (] • ;)
3.0
:?1~
21 )i
?Wl
211
?01
1 [).n
r.n II.?
0.3
n.h
n.1\ 1/.1
() ~ . ~) 1/.3
9. L
°.3
9.3
9.3
p , • J
7.(,
3.2
?2L
0'")~) , , :J
;' 1 or
?1'l
?nL
'1(' ""'I r ~ I.,'
" , (~ • L~
[2,. C;
o ~ (). r
n.'l
Il • ~)
'I .5
(l.r;
:) • r;
() ,r,
(),(
0.~
is temperature in °c
RUN I) (17 January 1978). Table 8
time in GMT
height '% % ~ % % ~ /' L in m 12.nO 12.30 13.00 3.30 111. on 1,.30
200 10.0 9. 1 8.1) 8.3 8.7 R.h
160 9. 1, 8.7 7.S 7.'1 8.3 8.2
120 8.3 7.8 h.9 7.2 7.(; 7.h I I 80 7.1t 7.0 h.2 h.5 h.8 1).9
U 40 (; • li h.l 5.5 5.(; 5.8 h. 1
20 5.7 5.h 5.0 5.0 5.0 5. 1
10 5.2 5.2 II • (, 11.5 4.5 4.5
5 4.9 4.9 11.3 It.2 4.2 1,.2 • 1.5 ll.O 3.9 3. 11 3.3 3.3 3. I,
200 202 19h 197 106 19 11 195
160 105 192 195 10 It 188 188
ex 120 1 CJ 1 191 195 1 C) 11 180 188
80 lil7 1 il8 19? F)3 187 188
40 --- --- --- --- --- ---
20 187 189 192 192 187 lQO
21 3 3.5 3.5 3.7 3.0 3.9 h.o
200 3.G 3.6 3.8 !t.o 11.0 4. 1
160 3.7 3.8 4.1 4.3 4.4 4.4
120 3.9 It. 1 4.5 4.7 4.8 II. R
80 4.2 It.5 4.8 5.0 5. 1 5. 1
T 40 4.5 It.8 5.2 5.4 5.5 5.5
20 --- --- --- --- --- ---
1 0 5.3 5. 1 5.5 5.6 5.7 5.8
5 5.11 5.2 5.6 5.h 5.7 5.8
2 5.4 5.2 5.h 5.6 5.7 5.8
0.6 5. 11 5.3 5.6 5.5 5.7 5.7
U is wind velocity in m,s
0( is wind direction in degrees
T is temperature in °c

RUN 7 (Hl April 1i/7il). Table 9 -19-
time in GM T
I I height % ~ % % % % V V I in m 1'1.00 '1.30 1.'10 1 .3" ~.'I0 ,".3'1
200 P.5 9.3 7.5 7.8 r, • ~) ---
1 60 fI.ti ~.2 'I. It 7. C e. 1 ---'1 20 B.G '1.1 '7 • ), 7. " '7 : . P. ---
\
80 B.o 8.6 f.r; ry 1 7.3 ---i ! • i
U 40 7. 1• 8. '.j ;:;.7 7. " G .9 ---
20 h .11 '( .3 'i • C) (,. I (, . r; ---
1 0 h.O G .. E~· 5 • ~; r;.7 r; (, ----' .. , 5 'i.7 (jJ [c, '? '). )t 'i.3 ---( .' • .J
~
! 1.5 ' •• 7 5.2 ' ' l~ • 1: L.h )j • r, ---
200 1 )1:"; 1 ) I 'i llJr; 14 ') 13::- ---1 60 11r7 11!7 1 it7 1 ) I', 1 -,'7
-) ! ---<X 1 20 1"iO lr,n 1Ln 1 )'7 n'1 ---
80 11;, 149 14-; 11.,"; uS ---40 --- --- --- --- --- ---20 11:" 11". L+ -; lLJ ( ), ") 13', ---
21 3 --- --- --- --- --- ---2 00 "7 '1 7.7 p.'" r..3 P. C; ---J • ,<
1 60 '7 '7 I • I B.n r\.J, p '7
,). I P '. Ci ---
1 20 f) ') P ( () ., (j • ;) 'l.~ ---• c. ' ' . I,! •. i
80 2..5 ,3. '1 r. ") "
r:: ') . " ---, . ,:-T 40 '1.0 '1.3 '1 '7 10.'1 10.3 ---. ,
20 '1 ,.., 0.h () ~: l'i.2 1'1.5 ---.'- / . 1 0 Q.h Q.G 1().1 1:).11 In.7 ---
5 Q.h 10.n ~().3 1().(j In.0 ---2 9. Q 10.3 10J 1 1 • n 11 .2 ---
0.6 10. 1+ 11.n 11 .3 11. '7 12.n ---:
U is wind velocity in m, s
0<. is wind direction in degrees
T is temperature in °c
RUN 3 (25 'lay 1 C) 7 [) ). Table 10 -20- .
time in GMT
height l% ~ % % ~ % / / in m 1'!.3n 1 .00 11.30 ?nn 2.30 3.00
200 --- 7. 11 7 ') ., 7.() 6.8 7.8
160 h.S 7.1 h.G (,.8 h.5 7.7
120 /'
~! • ) 6.8 h.1l f,.6 (,.4 7.7
I 80 :: • 1 6.3 h.h (,.3 h.2 7. lf
U 40 5.5 5.7 5.8 5.8 5.t) 6.7
20 --- --- --- --- --- ---
10 --- --- --- --- --- ---
5 --- --- --- --- --- ---
1.5 --- --- --- --- --- ---
200 35 1, 352 351 356 353 357
160 3hG 31(1"; 3115 352 3h8 353
0<: 120 3h3 3h3 3113 350 34G 350
80 337 330 31, '! 347 3h3 347
40 33:' 335 336 31111 31,() 343
20 328 331') 331 311() 337 339
213 --- --- --- --- --- ---
200 '7 J I • ...J 7.3 7.4 7.4 7.1l 7.7
160 7.5 7.5 7.1l 7.6 7.8 7.9
120 7.7 7.8 7.8 7.C) 8.0 8.1
80 8.1 8. 1 8.11 8.5 8.6 8.4
T 40 0.7 8.9 9.0 8.9 9.0 9.1
20 S.C) 9.2 9.3 CJ. 1 9.2 9.11
1 0 q.o 9.3 ("J.lI Q.3 CJ.3 1').5
5 Q. 1 9. 11 C) .11 1').3 Cl.h 0.6
2 8.0 9.5 9.5 9.h 0.5 Cl.6
0.6 9. 1 9.7 0.6 9.5 9.6 9.7
U is wind velocity in m/s
0( is wind direction in degrees
T is temperature in °c

J
I j
I u I I
0<:
T
U
ex T
RUN r) (13 June 1( 78). Table 11 -21-
height in m
200
160
120
2
1
1
80
40
20
1 0
5
1.5
00
60
2 0
8 0
40
2 0
21 3
200
1 60
1 20
80
40
20
1 0
5
2
0.6
is wind
is wind
time in GMT
l'J.nV 1().3Yl1.nV 11.3Yl? nrV l~.y / / ~.3() ~1.0() ~.3() ~.nn ~.3n ~3.nn / /
(, . );
31(;
315
31?
313
312
31 )j
---
1!) • 1
1(). h
10.r)
11 .3
11 • R
12.1
12.5
12.8
13. 1
13.h
velocity
direction
321
31 q
32()
32()
32)1
324
---
9.9
10.2
10.h
11 .0
11.6
11. (')
12.1
12.5
13. ()
13.7
in ml s
(" ~ '.:
, ') 0.-,
6.2
3?()
31<1
31;\
31(-
31El
31'1
---
9. 0
In.?
10.7
1 1 • 1
11,h
11.n
1? .2
PJ~
13.Cl
13.7
in degrees
h.O
c; r ~J • ,)
3?q
"-"'1 C -), )
?0'J -;,~ (-
'31 ()
3111,
:~ 1')
---
10.2
1 rJ • ~)
11 • n
1 1 • ) 1
1;' ,1"1
1:-'.3
1?h
1" "', ...). '
13. )1
1 If. 1
6.2
6.1
32P
32)1
3~?
3?~1
3~c' (" )
C),,), _J'.
---
1 () • 3
1().7
1 1 • 1
1 i . ')
1:-' J)
12.3
12,{;
13.0
1 3. t,
lh.n
.- .r;
r' \ r-, .1
r' , •• I
';'")1 _J_! ,
?nn /( :
""" .~" -'F'
;,0L
:.;')h
'")':''::: ), J
---
1".3
1n.1
11.1
11.r;
1 ;> • 1
1° -:; ( .~,
1~.(
1") . () 1-:; ') ,_I. '
13. G
is temperature in °c

RUN 10 ,(?G July 1 (78) • Table 12 -22-
time in GMT
height ~ ~ ~ ~ %' / ~ / in m 1.30 l?on 2.30 13.00 3.30
200 8.5 8.4 rJ.h 9.? 10.9
160 8. 1 8.1 9.2 9.0 10.7
120 7.4 7.5 8.8 8.5 10.3 ! i 80 6.3 6.7 8.0 7.5 9.7
U 40 5.0 6.0 7.3 (i.7 8.q
20 4.3 5. 1 h.7 5.8 8.0
I 10 3.8 4.6 6. 1 5.3 7.3
5 3.5 4.3 5.7 4.q h.(i
1.5 ?9 3.5 4.h 3.rJ 5.5
200 196 197 1 C) 5 FIG ?OO
160 --- --- --- --- ---
0< 120 194 190 lrJh lq? 201
80 108 191 195 193 19h
40 --- --- --- --- ---
20 192 184 1 rJ 1 ~ 187 198
213 --- --- --- --- ---
200 19.7 19.7 20.2 20.h 20.8
160 20.0 20.0 20.h 20.9 21.2
120 20.3 20.4 21.0 21.3 21.6
80 20.h 20.8 21.4 21.6 22.0
T 40 20.9 21.1 21 .8 ?2.0 22.4
20 21.1 21 .3 ?1 .9 22.1 22.6
1 0 21.1 21.5 22. 1 22.2 22.8
5 21 • 1 21.h 22.2 22.3 22.9
2 21. 1 21.6 22.2 22.3 23.0
0.6 21. 1 21.8 22.3 22.3 23.1
U is wind velocity in m, s
0<. is wind direction in degrees
T is temperature in °c
i
ex
T
U
0<. T
RUN 11 (? ~ucust 1(78). Table 13
he ig h t
in m
200
160
I 120
80
40
20
1 0
5
1.5
200
1 60
120
80
40
20
21 3
200
1 60
1 20
80
40
20
1 0
5
2
0.6
is wind
is wind
Fl.7
Fl.ro
10.2
8.13
h.5
1")1
188
185
1[17
---
170
---1 R.lj
w. [)
10.3
10.7
20.?
20.5
?().8
21.0
21.3
21.9
velocity
direction
is temperature in
time in GM T
11 .7
l().Q 11.7
1().i)
10.0 ° [) ~' • l J
8.7
f.1 7.3
7.3 7. 1 { r, . , h.r
5.7 5 ? . ,
1')1 103 105 1'"")5
188 102 100 10[)
185 101 100 108
lB7 1'11 loe:; 19~
--- --- 19h ---1 W) len lOP, 1'1 r
--- --- --- ---10. II lR.3 17.0 17.3
1Il.8 lR.7 18.0 17.7
10.? 1 0 • 1 18. 11 1 8. 1
Fl.h 10.5 18.8 18.5
20.1 10.0 Fl.~ le.'1
20.3 20.1 Fl.5 \ () • 1
20.5 20.3 Fl.7 19.3
?O.h ::'O.L 10.8 10.3
20.9 20. rj 1°.1 10 .5
21.3 20.7 2().? 19.7
in m, s
in degrees
°c
-23-
1 1 r: , .
11. ')
,'I '7 • I
7.r;
103
1 ') I,:;
1"'-;
lrl(
---1n3
---1'7 " I I .,'
1 To r;
15.0
18.L
FIJI
10.3
Ifl.(;
1'1 7 .. ,
20.:1
2" ) . '

RUN 12 (10 August lC)1'8). Table 14 -24-
time in GM T
height ~ % ~ % ~ ~ / / in m OC).OO <).30 1() .00 10.3fl 1.00 11 .30
200 0.? 0.8 10. 1 8.1' 10.3 lfl.5
160 <). 1 C).I' lfl.O B.fl C).O 10. 1~
120 c).o 9.6 0.8 8.4 9.5 10.2 ! 80 8.3 0.6 ! 8.1' 0.2 0.3 1'.1'
U 40 8 .l~ 8.6 C).1 fl.B 1'.5 9.2
20 8.6 --- --- 6.2 6.8 9.2
I 10 I'.C) 5. 4 fl. 1 8.11 --- ---
5 1'.2 --- --- 11. C) 5.5 1'.') ,
1.5 6. 1 ') .11 4.3 5.3 3.7 S.I'
200 220 223 23fl 2')1' 250 ;:>115
160 225 21C) ?33 255 2h5 2111
0<: 120 2?1' 21C) 23(, 2hO 241' 21j3
80 2?<) 222 2)10 265 251 21lfl
40 21c) 213 232 250 2113 236
20 22] 21[ 23fl 2flfl 211(, 240
213 --- --- --- --- --- ---
200 1 4. r; 111.9 111.5 12.1' 12.1' 15.fl
160 15.0 15.3 1!t.8 12.9 13.5 1(;.3
120 1:; .1[ 15.8 15.2 13.0 13.2 1fl.O
80 15.8 16.2 15.5 13.2 13.5 16.0
T 40 10.] 16.8 15.9 13.5 13.8 16.2
20 16.5 1[ .0 1fl.9 14.5 14.0 10. 1
1 0 16.1' 1[.3 1[.0 14.5 14.1' 16.h
5 1[ .0 1[ .6 1[ .1 11[.8 1)1.5 15. h
2 1[.2 18.0 1fl.8 1)1.0 14.1' 14.8
0.6 1[.5 18.5 1[ .2 lh.2 1 ') • 1 1)1.3
U is wind velocity In m/s
0( is wind direction in degrees
T is temperature in °C

RUN 13 ( H) 0ctober 19(8) • Table 15 -25-
time in GMT
height % % A< ~ ~ ~ % % in m 1?00 1?3() 13 .'"'!() 3. "Yl 111 • "0 11;.]'1 l'i.n'l 1"'.3°
2 00 1 () • 'i 0.7 0.0 P, .? P..n ]('.'i ~ f"\ r) j 0 .' · 1 60 p p 8.0 I. Ci 7." p (, r; c 'l " °,0 ~ } . ',) .{
1 20 7. 1 (J r; ., (, • :-3 0 ('I (' ') 8.1 c . : ' ' . · , .
80 5. n '5.7 n r: --; I.r, n n :- '7 r: I, '). ',I , . ( · ,
U 40 lJ • :-3 h.~ )1. J ") '7 (, .:) ::, '1 \ " \ ). ! " .
20 3.? 3.0 1 " 0 I \ J, C> ~ . '7 '~ . ,} . 1. " · 1 0 ? r; r) (, n , " " l. ,t; ., (, -, 1 " '7 . c • . , .( · ,
5 " • 'J
1.5 'I I'") 2.1 ?G 1.7 ?0 ,.., '7 " .S ?0 L • {, { .
2 00 137 13(, 133 12(, po 13? 125 1 C'(. .
1 60 131 132 l?CI 1 ;:' 1 10 <; { . UO P1 1"C; ( j
oc: 1 20 1?0 PO i ~ '() lP 117 1:'1 '11 r'; I, 1 'l'-"
8 0 1 1 " 111 1 1 " ~ n 3 1 n') 1 ~ / 1 '1~ 1 i r;
40
2 0 1'"-") 113 1" 7 1 ., 1 , , 1 1 r; 113 ~ ; j
2 1 3
2 00 2(1. () n.'! i r), ~ In ,L, liL (' 1 r '7 1 0 i' 1" (, · .. 1 6 0 1 C). 1 Fi.? 1 ') • (
lG.~ In.n 1 ") ! 0 ,. f .. ·
1 20 1.3.8 1°.2 1,'') • Ii 11.1. 1n r- 1''-''1 . 1 1 r. n ." 80 l:l.n Fl.3 1().~ li. "( 1°.5 1'1.3 1~) • ,
T 40 1°.0 10.5 1') • i) l'i.P 10 .( 1'1.3
2 0 1 C). 1 10 .h 1 ~ .. p, ;J(~ • fJ In. 7 1r- L 1'; • :; 1'j " t'l, ' .'
1 0 10.? Fl. '7 1Q,Cl ~i).:j 10. '7 1 n.:. 1") '" " " I I · f •
5 Fl ,.., 1 n Q 1 () • ,") :,r) .0 Fl • I 1 ,'~; • : I 1 'j • :3 1'i.? • L
2 lQ.3 lCl.2 In., ?'I.n In.7 lC) .11 1 </.3 1',. 1
0.6 1°.3 10.S 1'1 • '1 ::,n.0 ln r; 11"1 ,.., 11 • 1 ,):: 'I ',' . ' f .•
U is wind velocity in m/ s
0< is wind direction in degrees
T is temperature in °c

RUN lit (12 0ctober 1(78). Table 16 -26-
time in GM T
height ~ ~ % ~ % [% 1% ~% in m :->.on 12.3n J.no 13.3'1 111. n() III • 3() lS.()O c; • 3()
200 h. 1 lJ.3 (,.2 h.C! h.p 7.1 h.7 h .7
160 3.8 lJ.e; h.O (.ti h.s h.ti h.2 h.o
120 3.(, 11.3 5.9 ~.II (,.? 6.2 5Ji 5. )1
I ! 80 3.5 11.2 5. <1 (-;.2 5.<1 5.B h.8 I •• h
U 40 3.2 3.<1 5.2 5. 11 lJ.<1 11.7 3.0 3. 1
20 2.9 3.3 lJ.2 lJ.3 3.<1 3.6 3.0 2.0
1 0 ;? •. :) 3.0 3.13 3.7 3.lJ 3.1 ?r; 1 • 5
5 2.7 2.Q 3.6 3.5 3.3 2.0 2.h lolJ
1.5 2 ') .'- 2.5 3.0 3.0 2.(1, 2.1! 2.0 1 • 1
200 13n 115 l?O 117 125 133 137 1 hn
160 1?(i 113 119 1 H; 1 ?Il 132 13(, 1 hI)
ex 120 1 ;~O l1n 11 h 113 11 <1 127 132 137
80 1? 1 115 110 11 r; 1 ?n 128 135 14()
40 --- --- --- --- --- --- --- ---
20 1? 1 11 h 1 11 1 10 11 Ii 1?? 13n 13n
21 3 --- --- --- --- --- --- --- ---
200 15.0 15.7 lti.2 1(';.9 17 .5 1'7.<) 18.n 18. 1
160 15.3 16.0 lh.6 17 .2 17 .9 18.3 18.3 18.lJ
'1 20 15.6 16.lJ 17.0 17.7 18.3 18.7 18.7 18.7
80 16. 1 16.7 17.3 18.0 18.6 1<).0 19.0 18.9
T 40 16.5 17 .2 17.7 lB.lJ 19.0 1<).3 1°.3 19.n
20 l(i.7 17 .lJ 18.0 18.h 19.2 lC!.5 19. 11 1<).0
1 0 16.8 17 .6 Hl.l 18.7 . 19.3 1<1.5 1<1.5 1°.0
5 17.0 17.7 18.3 18.8 1<).3 19.6 1<).5 10.0 -~
2 17.2 17 .9 18.h 1<1.9 lQ.lJ 19.6 10.1! 18.8
0.6 17 .6 18.2 18.h 1<1.2 1<1.5 1°.6 10.3 18.0
U is wind velocity in m/s
0( is wind direction in degrees
T is temperature in °c
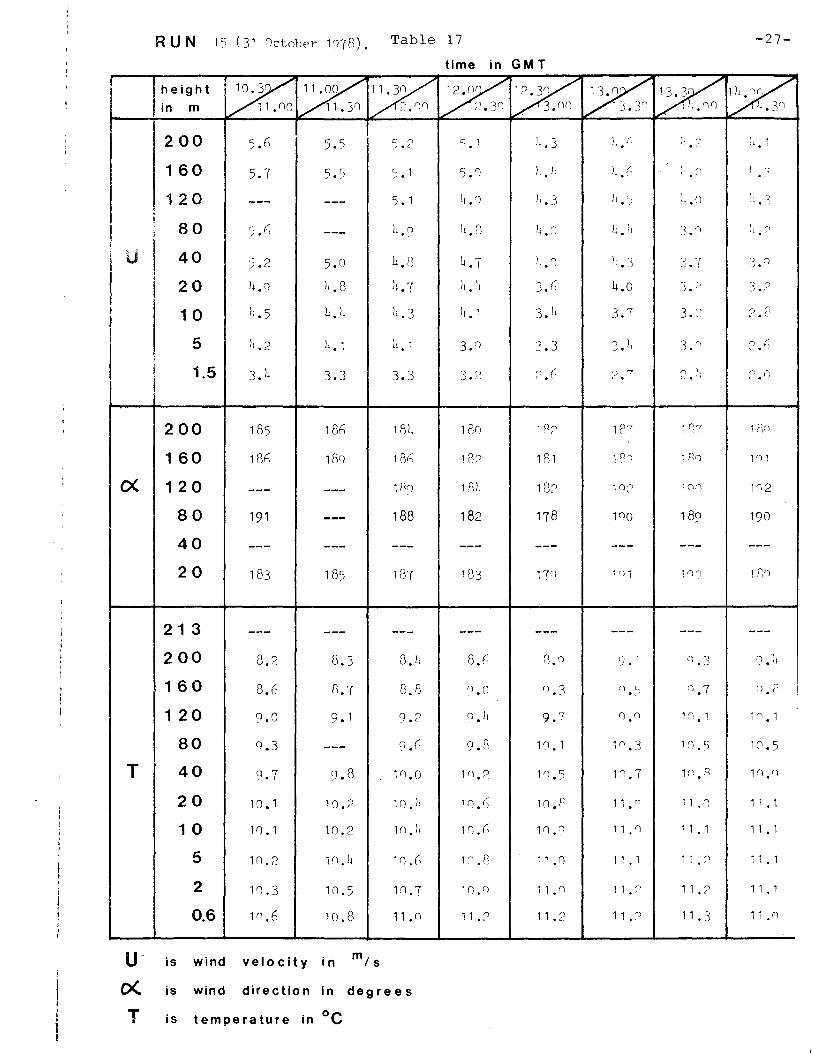
RUN 15 (31 rJctoher 1078). Table 17 -27-
time in GM T
I I height % % ~ ~ % ~ ~ ~ ! 'in m 11 • no 11 .3'1 .:, • nn , j'l 3. n n 1 -, ~) r')
t ~; • ·'lrJ ~ • 3·'1 I ( .• ,j --)
200 5.h 5.5 c " '). 1 4.3 " i- I, ,~ ii.l ) . , ' .. ' . '
1 60 5.7 5.5 5.1 '1.') 11 .It }t. h ) " L c; . . , 1 20 5.1 il. 1 li.3 it c L • 'l
, -, --- --- . } • .J , , \
80 5.(, h.o !t.n 1-1.') L. it 3. ') ! ;, , --- ". j
u I
, 40 5.2 5.n 4.G l\. / h.r) L.j -,) 7 ~ Q
~. : .J.
20 h.C) II • 13 1;.7 h • ,'I J.r; 4.0 3. 1 .!- .). "
I 1 0 li.5 h.l\ 4.3 11.1 3. II 3.7 3.:' ~ .c
5 il.2 h. 1 11.1 3. n 3.3 3.1. 3." 2. i-
;
1.5 ! 3.4 3.3 3.3 3. ;) ~.(, " '7 ;' ,
~.r; L .• I • L~
200 1 G5 18h 1811 1 Rn 18;, 1 11',7 1 H,'l
1 60 lGh lSC) 1S?: 122 1 Rl 1 S, l P'() 1 'J 1
0{ 1 20 --- --- 1 B'l 181, 1 13:, 1 ()~) 1 n'l 1"·2
80 191 --- 188 182 178 lC)O 189 190
40 --- --- --- --- --- --- --- ---20 183 185 18,( 183 1[1 1 ') 1 1 ()" 1Wl
21 3 --- --- --- --- --- --- --- ---200 8.2 8.3 (3. )i 8.h fl.? (' ,
..I. I ~l • 3 " .4
1 60 8.h 8.7 8.8 n.n 0.3 () " (') .7 n.P . 1 20 9.0 9. 1 9.? 0.11 9./ 'I.n V'.l 1 ,,-.,: • 1
80 G.3 --- G.r; o r., " ." 1". 1 'n < I .• _~, 1 fj • 5 1'1.5
T 40 9.7 9.8 1'1.0 In.? In.) Fl. '7 1:-'.8 1".(')
20 1 n. 1 10.2 lo.h 10.h 1(). P 11 • r 11 J) 11.1
1 0 1 () • 1 10.2 1n. il 10.h In.'l 11. n 11.1 1 1 . 1
5 1() .? 1 'I • 11 1n.0 11.8 11 . n 11.1 11 . " 11 • 1
2 1'1.3 H1.5 In.7 1 n. () 11 • n 1 1 • :' 11. ? 11.1
0.6 I n .h 10 .8 l1.n 11.:' 11.2 11 .? 11.3 11 . n
U is wind velocity in m/ s
0<. is wind dire ctio n in degrees
T is temperature in °c •
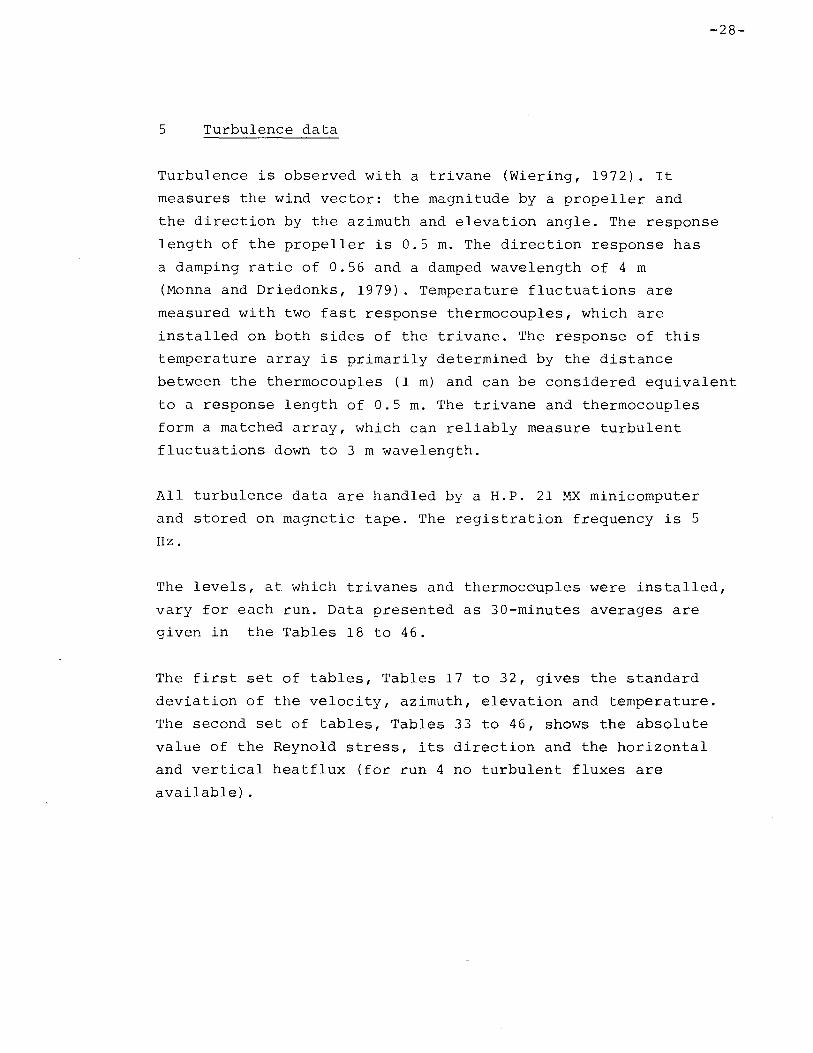
5 Turbulence data
Turbulence is observed with a trivane (Wiering, 1972). It
measures the wind vector: the magnitude by a propeller and
-28-
the direction by the azimuth and elevation angle. The response
length of the propeller is 0.5 m. The direction response has
a damping ratio of 0.56 and a damped wavelength of 4 m
(Monna and Driedonks, 1979). Temperature fluctuations are
measured with two fast response thermocouples, which are
installed on both sides of the trivane. The response of this
temperature array is primarily determined by the distance
between the thermocouples (1 m) and can be considered equivalent
to a response length of 0.5 m. The trivane and thermocouples
form a matched array, which can reliably measure turbulent
fluctuations down to 3 m wavelength.
All turbulence data are handled by a H.P. 21 MX minicomputer
and stored on magnetic tape. The registration frequency is 5
Hz.
The levels, at which trivanes and thermocouples were installed,
vary for each run. Data presented as 3D-minutes averages are
given in the Tables 18 to 46.
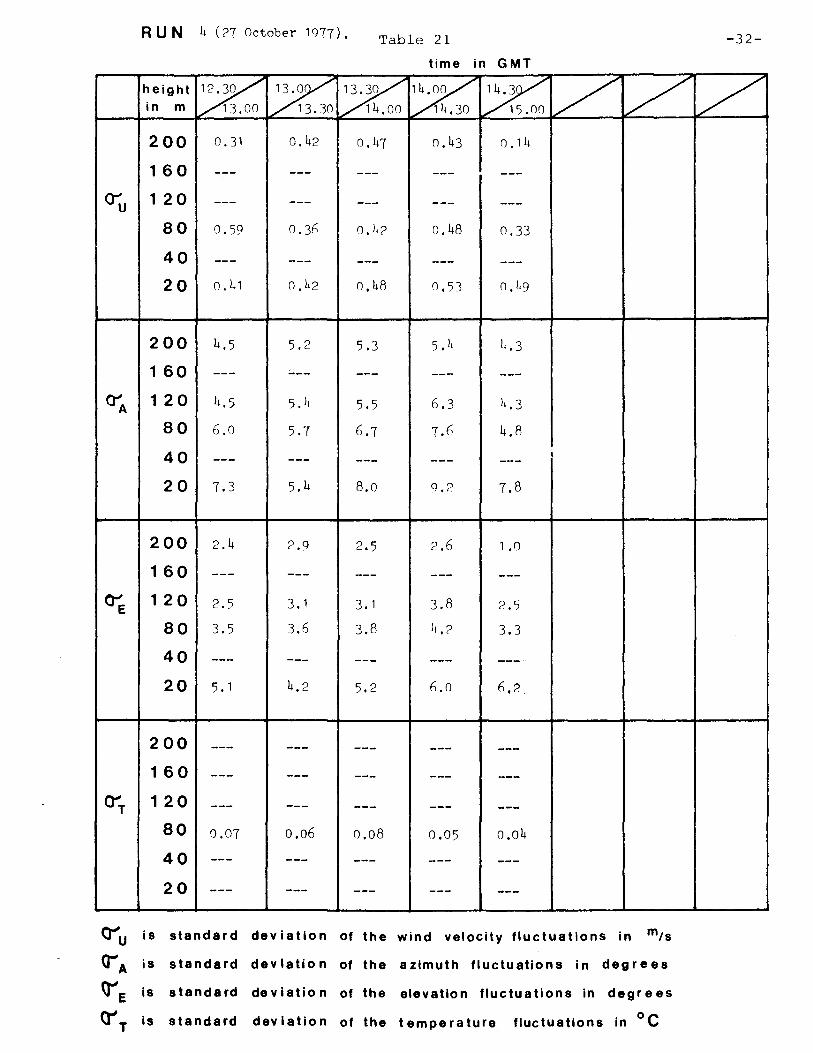
The first set of tables, Tables 17 to 32, gives the standard
deviation of the velocity, azimuth, elevation and temperature.
The second set of tables, Tables 33 to 46, shows the absolute
value of the Reynold stress, its direction and the horizontal
and vertical heatflux (for run 4 no turbulent fluxes are
available) .

RUN 1 (28 Anril 1077). Table 18 -29-
time in GMT I
height % ~ ~ t% V ~ V :V in m 1.30 12.00 12.31) 3,00
200 0.77 0.93 0.82 1,05
160 --- --- --- ---
O"u 1 20 --- --- --- ---80 0.70 1.00 1,07 1,26
40 --- --- --- ---20 1.0? 1.1h 1. 35 1.2h
200 --- --- --- ---
160 --- --- --- ---
O"'A 120 --- --- --- ---80 7.6 6.2 7.0 6.8
40 --- --- --- ---20 9.2 8.0 0.5 8.8
200 4.7 5.9 6. 1, 4.1,
160 --- --- --- ---~ 120 --- --- --- ---
80 1'.8 4.5 6.0 5.2
40 --- --- --- ---20 4.6 4.4 5,9 5.4
200 --- --- --- ---160 --- --- --- ---
Ct'T 120 --- --- --- ---80 --- --- --- ---40 --- --- --- ---20 --- --- --- ---
O""u Is standard deviation of the wind velocity fluctuations in m/s
o-'A is standard dev latio n of the azimuth fluctuations in degrees
tr'E is standard deviation of the elevation fluctuations in degrees
<r'T is standard deviation of the temperature fluctuations in °C

RUN 2 (12 Octoher 1Q77). Table 19 -30-
time in GMT
height~~ in m 2.00 12.30 % 13.00 % 3.30 V V V V 200 0.f)4 0.82 0.87 0.63
160 --- --- --- ---
~U 1 20 --- --- --- ---
80 0.84 ().82 1 .15 0.88
40 --- --- --- ---20 1. n 1 1. nQ 1.2h 1.2n
200 11.7 5.7 "'.9 h.2
160 --- ._-- --- ---
O"'A 120 4.7 5.0 7.0 4.1
80 5.8 5.8 7.6 5.3
40 --- --- --- ---20 7.0 7.f) o.f) 7.8
200 3.8 3.2 3,4 2.7
160 --- --- --- ---
~ 120 4.2 3.4 3.Q ?o
80 4.1 4. 1 4,2 3.2
40 --- --- --- ---20 4.8 5.6 5.6 5. 1
200 0.18 0.21 n.16 0.12
160 --- --- --- ---
O"'T 120 0.111 0.2f) 0.11 0,11
80 0.15 0.20 0.14 0,11
40 --- --- --- ---20 0.24 0.26 0.18 o. 13
O"u is standard dev latlon of the wind velocity fluctuations in ml s
O"'A is standard deviation of the azimuth fluctuations in degrees
(J'e is stand a rd deviation of the elevatio n fluctuations In degrees
<r'T is standard deviation of the temperature fluctuatio ns in °c

RUN 3 (18 Octoher 10n). Table 20 -31-
time in GMT
height t% % % 7 V ~ V V in m 13.00 13.30 14.00
200 0. 1.8 0.52 0.47
160 --- --- ---
O"'u 120 --- --- ---80 0.5h 0.73 0.h1
40 --- --- ---20 0.86 0.7Q 0.81
200 5.4 h.5 5. 1
160 --- --- ---
O"'A 120 5. 1 h.O 5.8
80 h.2 6.2 7.1
40 --- --- ---20 Q.4 10.4 8.0
200 4.0 4.5 3.7
160 --- --- ---
~ 120 4.4 5.1 5.3
80 4.8 5.2 5.7
40 --- --- ---20 6.8 6.7 h.h
200 0.20 0.18 0.07
160 --- --- ---O"'T 120 0.20 0.17 0.10
80 0.21 0.17 0.13
40 --- --- ---20 0.26 0.19 0.11
O"u is standard dev iation of the wind velocity fluctuations in m,s
CiA is sta nda rd deviation of the azimuth fluctuatio n s in -degrees
Q'"'e is standard deviation of the elevation fluctuations in degrees
(t'T is standard dev iation of the tempe ra tu re fluctuations in °C
RUN 4 (27 October 1977). Table 21 -32-
time in GMT
height % % % ~ ~ ~ / / in m 13.00 13.30 14.00 14.30 15.00
200 0.31 0.42 0.47 0.43 0.14
160 --- --- --- --- ---
O"u 120 --- --- --- --- ---80 0.59 0.31') 0.h2 0.48 n.33
40 --- --- --- --- ---20 0. 1.1 0.42 0.48 0.53 o. h9
200 4.5 5.2 5.3 5. 1( 1(.3
1 60 --- --- --- --- ---O"'A 120 4.5 5.4 5.5 6.3 4.3
80 6.0 5.7 6.7 7.6 4.8
40 , --- --- --- --- ---20 7.3 5.4 8.0 9.2 7.8
200 2.4 2.9 2.5 2.6 1 .n
160 --- --- --- --- ---~ 120 2.5 3. 1 3.1 3.8 2.5
80 3.5 3.6 3.8 1(.2 3.3
40 --- --- --- --- ---20 5. 1 4.2 5.2 h.O h.2
200 --- --- --- --- ---160 --- --- --- --- ---
O"'T 120 --- --- --- --- ---80 0.07 0.06 0.08 0.05 0.04
40 --- --- --- --- ---20 --- --- --- --- ---
O""u is standard deviation of the wind velocity fluctuations in m,s
(iA is standard dev latio n of the azimuth fluctuations in degrees
Q"'E is standard de v iatio n of the elevation fluctuations in degrees
<YT is standard dev iatio n of the temperature fluctuations in °c

RUN 5 (22 December 1Q77). Table 22 -33-
time in GMT
height ~ X % /' /' :L /' /' in m 12.30 13.00 13.30
200 0.40 0.52 0.36
160 --- --- ---
()""U 1 20 --- --- ---80 0.59 0.6h 0.69
40 --- --- ---20 0.75 0.73 0.h2
200 2.9 4.5 2.7
160 --- --- ---
~A 120 3.5 4.3 3.2
80 4.0 h.5 4.3
40 --- --- ---
20 5.7 5.7 h.2
200 1 . 1 1.8 1. h
160 --- --- ---
~ 120 2.0 2.11 2.4
80 2.7 2.8 3.1
40 --- --- ---20 4.8 4.h 5.0
200 --- --- ---160 --- --- ---
Ct"T 120 --- --- ---80 --- --- ---40 --- --- ---20 0,06 0,06 0,05
O"u is standard deviation of the wind velocity fluctuations in m,s
O"'A is standard dev latio n of the a zlmut h fluctuations in degrees
tr'E is stand a rd deviation of the elevation fluctuations in degrees
<r'T is standard dev iatio n of the temperature fluctuations in °C

RUN ti (1'7 January 1 q { 8) . Table 23 -34-
time in GMT
~eightl% In m 12.30 ~ 13.oa % 13.30 ~ 1h.oo ~ V V V 200 0.5{ 0.58 0.48 0.51
160 --- --- --- ---Q-'u 120 0.{1 0.ti3 0.55 0.{1
80 O.{O aJiq 0.ti5 o . {1
40 --- --- --- ---20 a.88 0.8h a.{f, 0.82
200 4.2 4.h 3.5 4.0
160 --- --- --- ---
~A 120 4.4 5.1 4.ti )1 • {
80 5.1 5. )1 5.0 5.3
40 --- --- --- ---20 6.{ ti.3 h.3 h.9
200 1.9 2.{ 2.0 1.8
160 --- --- --- ---~ 120 3.2 3.{ 2.8 2.8
80 3.8 4.3 3.6 3.h
40 --- --- --- ---20 5.3 5.2 5.1 5.6
200 --- --- --- ---160 --- --- --- ---
0; 120 --- --- --- ---80 a.28 0.12 O. 11 0.13
40 --- --- --- ---20 --- --- --- ---
O"u is standard dev iation of the wind velocity fluctuations in mls
CiA is standard dev latio n of the azimuth fluctuations in degrees
~E Is standard deviation of the elevation fluctuations In degrees
<r'T is standard deviation of the temperature fluctuations in °c
RUN 7 (18 April 1(78). Table 24 -35-
time in GMT
height ~ X ~ % ~ ~ / t/ in m 1 r) . 30 11 .00 11 . 30 12.00 12.30
200 0.72 1.24 1.26 1 .07 1. 21
160 0.82 1.17 1.2h 1 .Oh 1.31
O"'u 1 20 r).94 1.05 1 .1+0 1 .08 1.h7
80 0.Q5 1 .20 1 .5 1+ 1.14 1 .57
40 --- --- --- --- ---
20 1 .21 1.38 1.52 1.31 1 .51
200 h.7 12.8 11 .5 Q.5 G.?
160 6.7 12.5 11 .7 10.2 Q. 1
CYA 120 7.4 13.5 12.9 11 .0 1().0
80 8.6 14. 1 13.5 12.0 11 .5
40 --- --- --- --- ---20 10.4 14.5 12.9 11,.5 13.h
I
200 5.? 9.h 9.3 9.0 7.8
160 5.3 8.7 8. 1, 8.5 7.5
~ 120 5.6 8.5 7.8 8.7 8.0
80 5.5 8.0 7.8 7.Q 8.1
40 --- --- --- --- ---
20 5.9 7.4 7.5 7.8 8.7
200 0.20 0.20 0.26 0.1Q 0.18
160 --- --- --- --- ---
O"'T 120 0.19 0.22 0.2h 0.20 0.22
80 0.1Q 0.25 --- 0.21j 0.26
40 --- --- --- --- ---
20 --- --- --- --- ---
O"u is standard dev iation of the wind velocity fluctuations in m/s
(jA is sta nda rd dev latio n of the azimuth fluctuations in degrees
~E is stand a rd deviation of the elevation flu c tu a tio n s in degrees
~T is standard deviation of the temperature fluctu atio ns in °c

RUN 8 (25 'lay 1Q78). Table 25 -36-
time in GMT
~eightl% In m 11.00 ~ 1 .30 ~ 12.00 ~ 1:?30 ~ 13 .no / V 7 200 0.74 0.58 0.71 --- ---160 0.70 0.61 O.7Q 0.78 0.74
O"'u 1 20 --- --- --- --- ---80 0.7Q o.h8 0.7(' o.Sn 0.80
40 --- --- --- --- ---20 --- --- --- --- ---
200 5.6 5.2 6.7 6.9 ').6
160 5.6 5.3 6.7 7.4 5.7
~ 1 20 --- --- --- --- ---80 7.4 5.7 7.5 7.3 h.1
40 --- --- --- --- ---20 --- --- --- --- ---
200 4.4 3.h 3.') 4.4 3.3
160 4.5 4.0 3.7 4.h 3.1
~ 1 20 --- --- --- --- ---80 5.0 4.0 4.2 I,. 1 3.8
40 --- --- --- --- ---20 --- --- --- --- ---
200 0.14 O. 11 O.1h 0.12 0.13
160 --- --- --- --- ---
O"'T 120 --- --- --- --- ---80 --- --- --- --- ---40 --- --- --- --- ---20 --- --- --- --- ---
O"'u is standard deviation of the wind velocity fluctuations in m/s
(;A is standard dev latio n of th-e azimuth fluctuations in degrees
<t'e is standard deviation of the elevation fluctuations In degrees
~T is standard deviation of the temperature fluctuations in °c

RUN q (13 cTune 1(78). Table 26 -37-
time in GMT
height ~ ~ ~ ~ ~ ~ V / in m o . 30 11.00 11 ,30 ?OO . 1? .30 13.00
200 0.80 O.hl 0.63 0.h8 0.711 I 0.'5'5
160 0.81 0.62 0.60 o.h3 0.77 0.5 1
O"'u 1 20 0.75 0.h2 0.63 O.h<) o .118 :1 • 51)
80 0.77 O.hF) 0.h5 0.7'1 0.71 0.h3
40 --- --- --- --- --- ---20 --- --- --- --- --- ---
200 7.4 h.O 7.2 11,7 10.0 7.7
160 7.7 h.7 8.2 12.8 11,3 R.h
O"'A 120 8.4 7.4 8.8 14.0 11.0 a.o
80 10.3 8.5 CJ.9 15.7 12.3 10 , 1,
40 --- --- --- --- --- ---20 --- --- --- --- --- ---
200 9.1 8.7 8.2 11.8 11 ,7 8.3
160 8.3 0,0 8.1 11 ,3 11 ,? 8.0
~ 120 7.8 0.0 8.2 10.3 10.2 8.0
80 7.6 7.9 7.0 9.8 8,0 7. 1,
40 --- --- --- --- --- ---20 --- --- ---
I
--- --- ---
200 --- --- --- --- --- ---160 --- --- --- --- --- ---
OT 120 0,19 0.18 0.17 O.?7 0.23 o. H;
80 --- --- --- --- --- ---40 --- --- --- --- --- ---20 --- --- --- --- --- ---
O""u is standard deviation of the wind velocity fluctuations in m/s
tiA is standard dev latio n of the azimuth fluctuations in degrees
<r'E is standa rd deviation of the elevation fluctuations in degrees
O"'T is standard deviation of the tempe ra ture fluctuations in °c

RUN 10 (2r; July 1978). Table 27 -38-
time in GMT
~elght % In m 12.00 Z 12.30 % 13.00 7 V V V '/ 200 o.q(; 1.oh 0.98
160 --- --- ---O"'u 1 20 O.Q3 1. 1 Q 1 • 15
80 0.q6 1 .31 1 • 12
40 --- --- ---20 1.06 1.53 1.3?
200 4.7 6. 1 4.5
160 --- --- ---O"A 120 5.6 6.7 4.Q
80 6.8 7.2 5.7
40 --- --- ---20 t!.5 9.8 6.4
200 4.2 6.6 4.5
160 --- --- ---~ 120 4.6 5.2 3.5
80 5.3 5.8 h.l\
40 --- --- ---20 7.2 6.5 6,6
200 0.13 0.12 0,23
160 --- --- ---O"'T 120 O. 11 o. 13 0.1 h
80 0.1 1\ 0.10 0,14
40 --- --- ---20 0.20 0.11 0.09
O"u Is standard dev latlon of the wind velocity fluctuations In mls
(tA Is standard dev latlo n of the azimuth fluctuations In degrees
<t'E Is standard deviation of the elevation fluctuations In degrees
Q"T Is standard deviation of the temperature fluctuations In °c

RUN 11 (2 August 1078). Table 28 -39-
time in GMT
height ~ % ~ % ~ ~ V / in m H).OO 10.30 1.00 11 ,30 . 1? .00 1?30
200 1 .Oh 1.1h 1.2h 1.37 1 • ')11 1.11
160 1.20 1.14 1.20 --- --- ----
O"'u 120 1.30 1.20 1.34 1 • ho 1.fl4 1.112
80 1.38 1.21 1 .811 1.80 --- ---
40 --- --- --- --- --- ---
20 1.59 1.40 1.80 1.17 2.01 ?,11
200 7. 1 7. 1 8.3 4.7 7.h S.5
160 7.h 7.7 8.1 4.0 7.5 5.h
O"A 120 8.4 8.5 9.0 S.2 8.3 h.9
80 0.5 8.8 10.2 6.2 8.8 8.2
40 --- --- --- --- --- ---20 11.9 11 .5 11 .3 8.3 10.5 o.R
200 8.5 h.7 5.0 5.h h. 1 7.3
160 6.2 4.h 3.8 h.3 4.0 h.o
~ 120 5.6 4.6 4.3 4.5 5.? fl,2
80 5.9 5.4 5,0 5,0 5.0 h.3
40 --- --- --- --- --- ---
20 7.4 7.2 7.2 7.3 h.9 7.5
200 0.24 0.18 0.14 0.23 0.19 0,25
160 0.21 0.15 0.11 0.23 0.16 0.2fl
o-'T 120 0.24 0.15 0.12 0.21) 0.11 0.28
80 0.28 0.20 O. 1 h 0,25 0.10 0.31
40 --- --- --- --- --- ---
20 0.4h 0.32 0.1fl 0.24 0.18 o ,lIS
O"u Is standard deviation of the wind velocity fluctuations in m/ s
erA is standard dev latio n of the azimuth fl uctu atio n s in degrees
<rE is standard de v iatio n of the elevatio n fluctuations in degrees
<r'T is standard deviation of the tempe ra ture fluctuations in °c
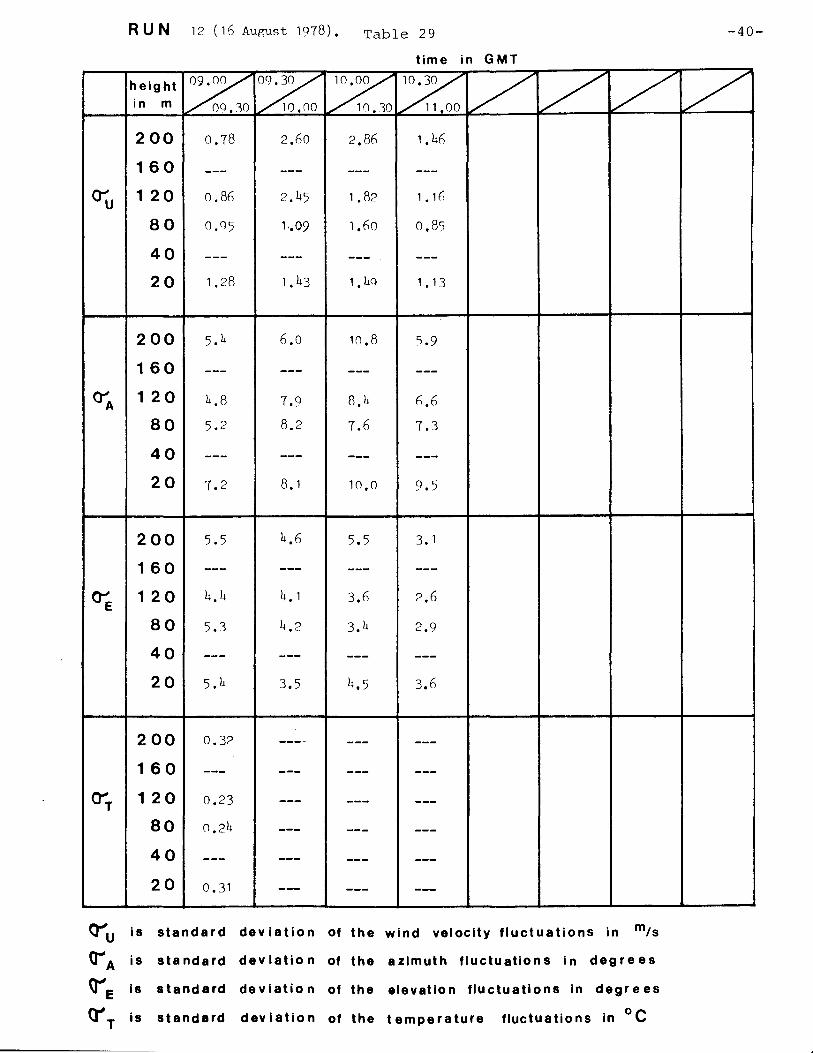
RUN 12 (16 AUgUflt 1978). Table 29 -40-
time in GMT
~elght % In m Oq.30 % 10.00 %~ 1 () • 30 11 00 V / 7 V 200 0.78 2.60 2.86 1.4h
160 --- --- --- ---
O"'u 120 0.86 2.45 1.82 1 • 16
80 0.Q5 1·.09 1.60 0.85
40 --- --- --- ---20 1.28 1.43 1.4Q 1 • 13
200 5.4 h.o 10.8 5.9
160 --- --- --- ---
O"A 120 4.8 7.9 8.4 h.6
80 5.2 8.2 7.6 7.3
40 --- --- --- ---
20 7.2 8. 1 10.0 9.5
200 5.5 4.6 5.5 3. 1
160 --- --- --- ---
~ 120 4.4 4. 1 3.6 ?6
80 5.3 4.2 3.4 2.9
40 --- --- --- ---
20 5.4 3.5 4.5 3.6
200 0.3? ----. --- ---
160 --- --- --- ---
O"'r 120 0.23 --- --- ---80 0.24 --- --- ---
40 --- --- --- ---
20 0.31 --- --- ---
O"'u Is standard deviation of the wind velocity fluctuations in m,s
CiA is sta nda rd dev latio n of the azimuth fluctuatio n s in degrees
~E is standard de v latio n of the elevatlo n fluctuations in degrees
<r'r is standard deviation of the temperature fluctuations in °C

RU N 13 (10 Octoher 1978). Table 30 -41-
time in GMT
height fo % % ~ ~ X ~ 7 in m 11 .30 12.0n 2.30 13.00 1 3.31) 14.on 14.31)
200 0.44 0.22 0.37 1).56 0.20 O,h3 0,31
160 0.40 0."9 0.47 0.52 n.32 0.7'5 0.32
O""'u 120 0.47 0.51 1 • IS 3 n.44 0.41 0.78 0.1'5
80 0."7 0.57 1).54 1).43 O.hO 1,02 0.h7
40 --- 0.71 1).81) 0.75 l).h7 1 • 18 n.78
20 0.h1 0.h6 1).73 0.81) 0.56 1 .05 0.83
200 3." 2.5 1.8 2.3 3.C} 3.5 1 • (1
160 3.2 2.9 2.0 3.'5 3.5 h.3 2.1
O"A 120 ".4 3.5 1'.3 h,6 4. 1 h.o 2,8
80 5.4 5.2 5.6 5.6 5.8 '5,3 3. 4
40 --- 7.7 7.8 8.h 8.7 7,8 h. 1
20 9.0 9.0 9.8 10.4 10.(- 9.5 8. 1
200 1 • 1 0.7 1 .3 1 • n 1 • n 0.8 1.0
160 1 .5 1 .0 2.0 1 • h 1 .7 1 .3 1 .2
~ 120 2.2 1.6 2.5 2.3 2.h 1.7 1 • q ,
80 3.0 2.9 3.4 3.3 h.3 2.0 2.1,
40 --- 5.8 7.1 5.9 h.7 5. 0 5.3
20 8.0 7.0 8.5 7.7 8.0 7.5 7,2
200 o. h7 0.37 0.29 0.38 1).32 1).23 I). 15
160 0.36 0.17 n. 17 I). 1 h o. 1() 0.00 0.07
0; 120 I). 18 0.10 I). 18 I). 12 0,13 n,ns 0,07
80 0.21 0.15 0.25 O. 11, I). 1 4 0.17 I), 15
40 --- 0.h1 0.31 0.2h 0.20 o ~ 18 n.17
20 0.22 0.14 0.18 0.08 0.13 0.2n 0,08
O"u Is standard dev iation of the wind velocity fluctuations in mls
erA is standard dev latio n of the azimuth fluctuations in degrees
~E is standard deviation of the elevation fluctuations in degrees
crT is standard dey lation of the temperature fluctuations in °C

RUN lIt (12 October 1978). Table 31 -42-
time in GMT
~elght ~ In m 12.00 % 12.30 ~ 13.00 % 13.30 % 14.00 ~ 14.30 ~ 15.00 ~ 15 30
200 0.5fl 0.54 0.91 o.fl6 0.82 0.68 0.41 0.40
160 O.fll 0.64 0.89 0.73 0.87 0.73 0.54 0.40
O""u 120 0.57 0.63 0.8h 0.78 0.82 0.70 0.64 0.38
80 0.63 0.6u 0.96 0.99 0.89 0.73 0.78 0.L7
40 0.54 0.73 1 .05 1 .ofl 1.07 0,89 0.73 0.52
20 0.63 0.68 1.03 1 • (13 1.00 0.80 0.68 0.50
200 7.2 I). 1 4.3 4.8 5.8 5.13 4.4 2.6
160 8.h 5.8 4.lt 4.h 5.5 6.h 5.0 2.9
O"'A 120 7.7 5.7 4.7 It.7 5.2 6.7 6.3 3.4
80 8.5 5.7 5.8 6.6 5.8 8.2 7.7 3.9
40 11 .8 8.1 8.8 8.8 10 .0 10.9 9.5 6.6
20 15.3 9.8 10.4 11 • 1 11. h 12.4 10.5 8.8
200 4.9 3.3 3.7 3.8 4.3 5.4 2.5 1. q
1 60 5.5 3.9 3.fl 3.5 4.1 5.3 3.0 2.2
~ 120 7.1\ 5.0 3.5 4.1 4.0 5.0 4.3 2.4
80 9.3 'i.8 4.4 5.0 Il.8 h.3 'i.5 3. 1
40 11 • 1 8.2 7.0 6.6 7. 1\ 7.9 8.0 4.7
20 10.5 8.8 8. 1 8.3 9.2 8.4 8.5 6.2
200 0.19 0.21 O. 1 Q 0.27 0.18 o. 15 O. 11 0.13
160 0.17 0.21 o. 15 0.21 0.15 0.07 0.08 0.07
~T 120 0.16 0.23 0,18 0.23 0.17 0.08 0.07 0.06
80 0.22 0.25 0.22 0.21\ o. 19 o. 13 O. 1 1 O. 11
40 0.26 0.32 0.23 0.26 0,20 0.15 O. H; 0.14
20 0.25 0.28 0.18 0.22 0.14 0.08 () • 10 0.08
~u Is standard dev lation Of the wind velocity fluctuations in mls
<iA is standard dev latio n of the azimuth -fluctuations in degrees
<JE is standard deviation of the elevation fluctuations in degrees
O"T is standard dev latio n of the temperature fluctuations In °c

RU N 15 (31 Octoher 1918). Table 32 -43-
time in GMT
height ~ ~ .~ % ~ ~ V / in m 11 .30 1?O() 12.30 13'(")0 . 13.30 1 h.oo
200 --- --- --- --- --- ---
160 --- --- --- --- --- ---
O"'u 1 20 --- --- --- --- --- ---80 --- o.Sri O.rio o.Gri 0.50 0.s8
40 --- --- --- --- --- ---
20 0.61 0.90 o.hl n.ln o.ho o.ho
200 h.C) 5.2 l1.8 8.? ').9 "( • h i
i 160 --- --- --- --- --- ---
O"'A 1 20 --- h.1 5.1 8.h S.5 8.5
80 --- h.1 !l.8 C).I !l. 1 Q.h
40 --- --- --- --- --- ---20 1.8 9.2 I.C) 10.3 8.3 1(1. q
200 5 • )~ 1.1 5.0 1.3 5. 1 h.5
160 --- --- --- --- --- ---
~ 1 20 --- h .l~ h.5 1.1 ').2 h.5
80 --- h. 1 h.5 8.2 5.h !l.8
40 --- --- --- --- --- ---
20 5.1 h.3 h. 1 I. 1 h.s h.')
200 0.1 h (). 1 h O.lh 0.1/ o. 15 0.15
160 --- --- --- --- --- ---
0;. 120 --- --- O. 11 n,13 0.08 n.oh
80 --- 0.16 o. 18 n.18 IJ. 1 IS O.ll+
40 --- --- --- --- --- ---
20 0.16 0.16 o. 15 o. 16 o. 1 h n,09
O'""u Is standard deviation of the wind velocity fluctuations in m/s
(;A is standard dev latio n of the azimuth fluctuations in degrees
~E is standard deviation of the elevation fluctuations in degrees
O"T is standard dev lation of the temperature fluctuations in °c

- . . UW
\
j i
otT
- . . WT
-U'T
,
U'W ,
0(1 W'T' U'T'
RUN 1 (28 April 1977) Table 33
height in m
200
160
1 20
80
40
20
200
160
1 20
80
40
20
200
160
120
80
40
20
200
160
120
80
40
20
is
is
is
is
time in GMT
%~~~V 1.30 2.00 2.30 3.00 V 7 0.14 0.13 0.10 0.03
--- --- --- ---
--- --- --- ---
0.17 0.15 0.23 0.19
-- --- --- ---
0.21 0.18 0.24 0.18
139 135 120 328
--- --- --- ---
--- --- --- ---121 162 166 134
--- --- --- ---
156 172 147 172
--- --- --- ---
--- --- --- ---
--- --- --- ---
--- --- --- ------ --- --- ---
--- --- --- ---
--- --- --- ------ --- --- ------ --- --- ---
--- --- --- ------ --- --- ---
--- --- --- ---
absolute value of the horizontal turbulent stress in m2, s2
direction of the horizontal turbulent stress in degrees
vertical tUrbulent temperature flux in °e m,s
horizontal turbulent temperature flux in oem,s
-44-
7

- , ,
UW {
• I
otT
- , ,
WT
j .j
- , ,
UT
U·W ,
oC I W'T
,
U'T'
RUN 2 (12 October 1977) Table 34 -45-
height in m
200
160
120
80
40
20
200
160
120
80
40
20
200
160
120
80
40
20
200
160
120
80
40
20
is
is
is
is
time in GMT
~ 12.00 ~ 12.30 h%
13.00 ~ 13.30 ~ :/ 7 0.13 0.13 0.19 0.08
--- --- --- ---
--- --- --- ---
0.19 0.17 0.25 0.14
--- --- --- ---("
." ".
0.21 ('~:-;, I 0.:14 0.28
~
215 210 217 239
--- --- --- ---
--- --- --- ---
215 204 186 225
--- --- --- ---202 192 188 206
0.02 0.01 0.01 0.00
--- --- --- ---0.02 0.01 0.01 0.00
0.03 0.02 0.03 0.01
--- --- --- ---((;,04\
/~~-" .--~----,
o. [J3 0.04 ( 0.04 ) ~ \~/
0.04 0.03 O.OR 0.01
--- --- --- ---0.03 0.05 0.04 0.01
0.05 0.03 0.09 0.02
--- --- --- ---
0.09 0.09 0.12 0.06
absolute value of the horizontal turbulent stress in m2/ s2
direction of the horizontal turbu.lent stress in deg rees
vertical tUrbulent temperature flux in °c m/s
horizontal turbulent temperature flux in °c m/s
:/
I

-. . UW
i I
otT
- , . WT
-. ,
UT
U'w ,
0(1 W'T
,
U'T'
RU N 3 (1B October 1977) Table 35
time In GMT
~elght%% In m 13.00 13.30 xVV 14.00 V V 200
160
120
80
40
20
200
160
120
80
40
20
200
160
120
80
40
20
200
160
120
80
40
20
is
is
is
is
0.05 0.09 0.05
--- --- ---
0.02 0.03 o.oB
0.07 0.09 0.12
--- --- ---
0.15 0.14 0.16 1 -
146 190 155
--- --- ---
173 135 147
17B 170 15B
--- --- ---
137 146 141
0.01 0.01 0.01
--- --- ---
0.00 0.01 0.01
0.02 0.02 0.02
--- --- ---
0.03 0.02 0.02 \ \
0.02 0.02 0.01
--- --- ---0.02 0.03 0.01
0.03 0.05 0.06
--- --- ---O.oB 0.05 0.05
absolute value of the horizontal turbulent stress in m2/s2
direction of the horizontal turbulent stress in degrees
vertical turbulent temperature flux in °e m/s
horizontal turbulent temperature flux in °e m/ s
-46-
7

-. . UW
, ,
otT
- . . WT
- . . UT
U·W .
0(1 W'T .
U'T'
RUN 5 (22 December 1977) Table 36
height in m
200
160
120
80
40
20
200
160
120
80
40
20
200
160
120
80
40
20
200
160
120
80
40
20
Is
is
is
is
time in GMT
~ 12.30 % 13.0[ ~ 3.30 / ~ / -;/ 0.02 0.06 0.04
--- --- ---
0.05 0.05 0.07
0.06 0.06 0.09
--- --- ---0.13 0.12 0.10
298 253 277
--- --- ---252 266 238
240 220 225
--- --- ---198 199 196
--- --- ---
--- --- ---
--- ---.". ------ --- ------ --- ---
~
0.00 0.00 0.00
--- --- ---
--- --- ---
--- --- ---
--- --- ------ --- ---
0.00 0.02 0.00
absolute value of the hor Izontal turbulent stress In m2, s2
direction of the horizontal turbulent stress in degrees
vertical turbulent temperature flux in °e m,s
horizontal turbulent temperature flux in oem,s
-47-
/

-. . UW
I
i
otT
- . . WT
- . . UT
U·W .
o(I W'T .
U'T'
RU N 6 (17 January 1978) Table 37
time In GMT
~elghtt%% %%L In m 12.30 13.00 13.30 14.00 L / 200
160
120
80
40
20
200
160
120
80
40
20
200
160
120
80
40
20
200
160
120
80
40
20
is
is
is
is
0.02 0.04 0.03 0.03
--- --- --- ---
0.'6 0.06 0.06 0.06
0.10 0.09 0.08 0.05
--- --- --- ---
0.15 0.15 0.10 Cl.12
211 213 237 216
--- --- --- ---
191 196 209 187
205 211 196 199
--- --- - -- -- -
180 191 179 190
--- --- --- - --
--- -- - --- -- -
--- --- --- ---
0.00 0.00 0.00 0.00
--- --- --- -- -
--- -~- --- -- -
- -- --- --- ---
--- --- - -- ---
-- - --- -- - ---
0.02 0.01 0.02 0.01
- -- --- --- ---
--- --- --- ---
absolute value of the horizontal turbulent stress in m2/s2
direction of the horizontal turbulent stress in degrees
vertical turbulent temperature flux in °e mls
horizontal turbulent temperature flux in °emls
-48-
/

- " " UW
otT
- " " WT
-" " UT
U"W "
eXr W"T .
U"T"
RUN 7 (18 April 1978)
height in m
200
160
1 20
80
40
20
200
160
120
80
40
20
200
160
120
80
40
20
200
160
120
80
40
20
is
is
is
is
Table 38 time in GMT
~ 10.30 % 11.00 ~ 1.30 ~ 12.00 ~ .12.3[ / 7 0.12 0.14 0.17 0.17 0.44
0.11 0.08 0.15 0.72 0.35
0.09 0.09 0.20 0.28 0.37
0.13 l1. 17 0.35 0.32 Cl.46
--- - -- - -- -- - ---
0.23 0.23 0.32 0.29 0.38
228 068 172 127 157
209 071 191 115 143
175 089 160 117 145
142 134 164 121 147
- -- -- - --- - -- -- -
142 148 160 124 139
0.06 0.06 0.11 0.12 0.09
- -- --- - -- - -- - --
0.04 0.08 0.08 0.10 0.08
0.04 0.11 0.17 0.09 0.09
- -- --- --- -- - -- -
--- -- - --- - -- -- -
0.03 0.00 0.08 0.05 0.07
--- --- - -- -- - ---
0.02 0.07 0.10 0.08 0.11
0.04 0.09 1..37 0.13 0.19
--- --- -- - -- - ---
-- - --- --- --- -- -
absolute value of the horizontal turbulent stress in m2/ s2
direction of the horizontal turbulent stress in deg rees
vertical turbulent temperature flux in °e m/s
horizontal turbulent temperature flux in °e m/s
-49-
/

-. . UW
i
otT
- . . WT
- . . UT
U·W .
0(1 W'T .
U'T'
RUN 8 (25 May 1978) Table 39
height in m
200
160
1 20
80
40
20
200
160
1 20
80
40
20
200
160
1 20
80
40
20
200
1 60
120
80
40
20
is
is
is
is
time In GMT
% 11.00 % 11.30 t:Z%~ 12.00 12.30 13.00 ~ / 0.11 0.09 0.15 -- - ---
0.13 0.12 0.16 0.21 0.11
-- - -- - -- - --- ---
0.14 0.10 0.14 0.11 0.12
--- - -- -- - -- - -- -
- -- -- - --- -- - ---
038 024 027 - -- ---
025 015 017 028 066
--- - -- --- -- - ---
345 014 005 356 030
--- --- --- --- ---
-- - --- --- --- - --
0.02 0.01 0.01 --- ------ -- - --- - -- ---
--- --- --- - -- ---
-- - --- --- --- ---
--- --- --- --- ---
--- --- --- --- ---
0.04 0.02 0.05 --- ------ --- --- --- ---
--- --- --- --- ---
--- --- --- --- ---
--- --- --- --- ---
--- --- --- --- ---
absolute value of the horizontal turbulent stress in m2, s2
direction of the horizontal turbulent stress in degrees
vertical turbulent temperature flux In °e m,s
horizontal turbulent temperature flux in oem,s
-50-
7
RUN
height in m
200
160 -, ,
UW 1 20 ~
! 80
40
20
200
160
otT 120
80
40
20
200
160 - , ,
WT 120
80
40
20
200
160 - , ,
UT 120
80
40
20
U'W ,
is
eX! is
W'T ,
is
U'T' is
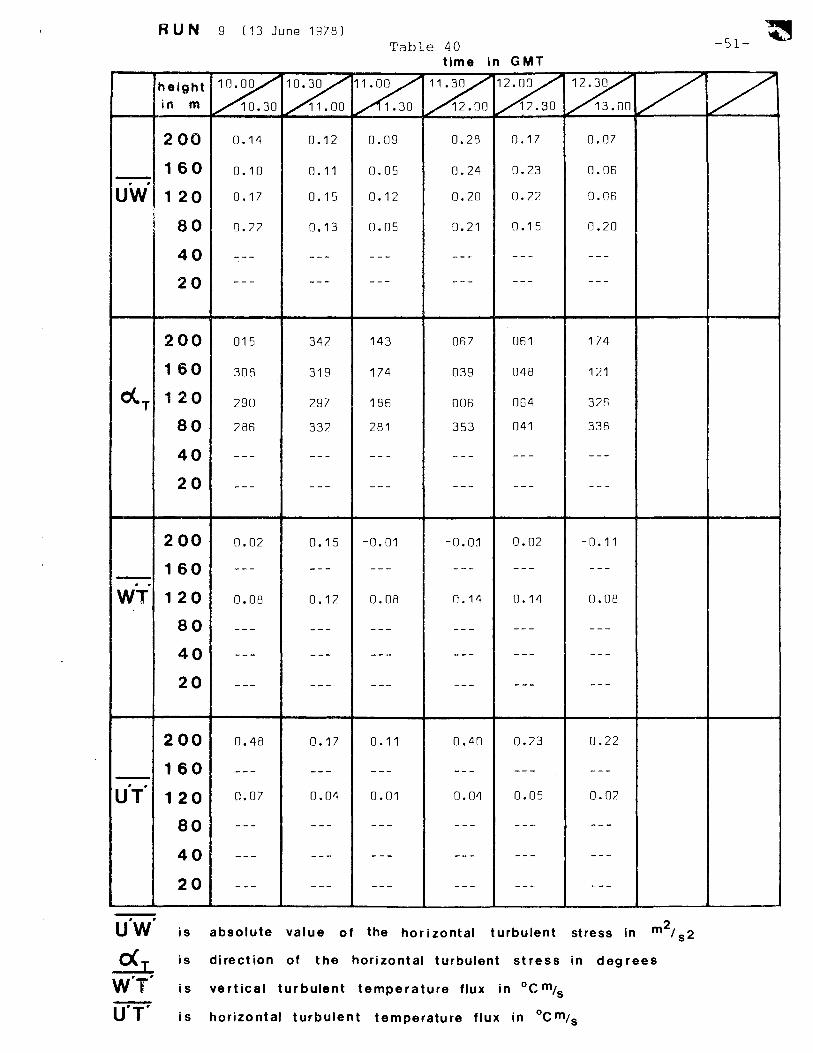
9 (13 June 1978) Table 40
time in GMT
% 10.30 ~ 11.00 /.: 1.30 % 12.00 ~ 12.30 % 13.00 / 0.14 0.12 0.09 0.28 0.17 0.07
0.10 0.11 0.05 0.24 0.23 0.06
0.17 0.15 0.12 0.20 0.22 0.06
0.22 0.13 0.05 0.21 0.15 0.20
--- --- - -- -- - - -- - --
- -- -- - --- --- -- - - --
015 342 143 067 061 174
308 319 174 039 048 121
290 297 186 006 064 320
286 332 281 353 041 338
-- - -- - -- - - -- -- - - --
--- - -- --- --- -- - -- -
0.02 0.15 -0.01 -0.0:1 0.02 -0.11
--- -- - -- - -- - --- - --
0.08 0.12 0.08 n .14 0.14 0.08
-- - -- - --- --- -- - - --
--- --- - -- --- --- -- -
--- --- --- --- --- ---
0.48 0.17 0.11 0.40 0.23 0.22
--- --- - -- -- - --- - --
0.07 0.04 0.01 0.04 0.05 0.02
--- -- - --- - -- --- -- -
--- --- - -- --- -- - -- -
--- --- --- -- - --- -- -
absolute value of the hor Izontal turbulent stress in m2
/ s2
direction of the horizontal turbulent stress in degr-ees
vertical turbulent temperature flux in °c m/s
horizontal turbulent temperature flux in °C m/ s
-51--~
/

-. . UW
I
otT
- . . WT
- . . UT
u'W .
eX! W'T' U'T'
RUN 10 (26 July 1978) Table 41
time In GMT
~elght % In m 12~00 % 12.30 %/L 3.00 ~ V 200
160
120
80
40
20
200
160
120
80
40
20
200
160
120
80
40
20
200
160
120
80
40
20
is
is
is
is
0.12 0.36 0.24
--- --- ---
0.15 0.26 0.21
0.18 0.33 0.22
--- -- - ---
0.24 0.44 0.32
214 214 214
--- --- ---
201 191 202
198 206 200
- -- --- ---
188 199 197
0.00 0.00 -0.01
--- --- ---
0.00 0.01 -0.01
0.01 0.01 -0.01
- -- --- ---
0.02 0.02 0.00
0.04 0.05 0.03
--- --- ---
0.02 0.02 0.04
0.02 0.02 0.03
~-- --- ---
0.04 0.06 0.01
absolute value of the hor Izontal turbulent stress in m2, s2
direction of the horizontal tUrbulent stress in degrees
vertical turbulent temperature flux in °e m,s
horizontal turbulent temperature flux in oem,s
-52-
7

-. . UW
I
otT
- . . WT
- . . UT
U'w .
0(1 W'T' U'T"
RUN 11 (2 August 1978) Table 42
height in m
200
160
120
80
40
20
200
160
120
80
40
20
200
160
120
80
40
20
200
160
120
80
40
20
is
is
is
is
time in GMT
% 10.00 % 10.30 % 11.00 % 11.30 ~ 12.00 ~ 12.30 V 0.98 0.65 0.38 0.36 0.43 0.78
0.63 0.29 0.24 -- - --- - -
0.60 0.38 0.32 0.31 0.49 0.74
0.58 0.44 0.45 --- --- - --
--- -- - - -- - -- --- - --
0.65 0.47 0.55 0.70 0.51 0.91
180 167 175 212 218 203
180 164 178 --- --- -- -
179 161 178 184 214 189
177 167 181 --- --- - --
- -- --- --- -- - -- - - --
175 176 195 199 207 196
0.21 0.09 0.00 0.02 0.03 0.11
0.12 0.04 0.01 -- - -- - -- -
0.11 0.04 0.01 0.02 0.04 0.10
0.11 0.07 0.02 --- -- - -- -
--- --- --- --- --- -- -
0.17 0.11 0.04 0.06 0.05 0.14
..
0.19 0.11 0.03 0.07 0.09 0.15
0.18 0.08 0.01 --- --- ---
0.22 0.09 0.02 0.08 0.17 0.21
0.28 0.14 0.01 -- - --- - --
--- - -- - -- - -- --- - --
0.44 0.22 0.12 0.15 0.17 0.42
absolute value of the horizontal turbulent stress in m21 s2
direction of the horizontal turbulent stress in degrees
vertical turbulent temperature flux in °c mls
horizontal turbulent temperature flux in °Cm/s
-53-
7

RUN
height in m
200
160 - " " UW 120 i
80
40
20
200
160
otT 1 20
80
40
20
200
160 - " " WT 120
80
40
20
200
160 - " " UT 120
80
40
20
U"w " is
oC I is
W"T " is
U"T" is
12 (16 August 1978). Table 43
time In GMT
% 09.30 % 10.00 / / L / V 0.11 0.33
--- ---
0.04 0.52
0.22 0.14
--- ---
0.36 0.14
244 043
-- - ---
174 230
204 231
--- ---
210 232
0.07 ---
-- - ---
0.06 ---0.09 ---
--- ---
0.09 ---
0.04 ---
--- ---
0.09 ---
0.10 ------ ---
0.21 ---
absolute value of the hor Izontal turbulent stress in m2, s2
direction of the horizontal turbulent stress in deg rees
vertical turbulent temperature flux in °e m,s
horizontal turbulent temperature flux i'n oem,s
-54-
/

-. . UW
, , ~
otT
- . . WT
-. . UT
U·W .
o(I W'T .
U'T'
RUN 13 ( 10 October 1 g7 8 ) Table 44
height in m
200
160
120
80
40
20
200
160
120
80
40
20
200
160
120
80
40
20
200
160
120
80
40
20
is
is
is
is
time in GMT
,% 11.30 % 12.00 % 12.30 % 13.00 % 13.30 k 14.00 % 14.30
0.01 0.00 0.01 0.01 0.00 0.01 0.01
0.16 0.01 0.04 0.02 0.01 0.01 0.01
0.03 0.02 0.09 0.02 0.04 0.02 0.03
0.04 0.05 0.05 0.04 0.09 ll.06 0.04
--- 0.08 0.13 0.09 0.1(] 0.12 0.15
0.08 0.09 0.11 0.12 0.08 n. 19 0.17
171 304 167 2gg 146 180 173
145 264 162 140 1 Sf) 163 172
135 137 127 141 127 140 139
131 114 11g 114 112 115 116
- -- 111 121 123 116 124 120
114 104 107 113 114 117 11 (]
0.00 0.00 0.00 0.00 [J.OO 0.00 Cl. 00
-0.01 [J.OO -0.01 o.no 0.00 0.00 0.00
0.00 0.00 O.O[J 0.00 0.00 0.00 0.00
O.O[J 0.00 -0.01 o. [J[1 0.00 0.00 0.00
--- -0.01 -0.[J1 -0.01 -0.01 0.01 -n.02
-0.01 0.00 0.00 -0.01 0.00 [J.01 -0.02
0.10 0.04 [J.03 0.18 0.03 0.n1 0.[J1
0.05 0.04 0.04 0.06 0.02 0.01 Cl.01
0.02 0.01 0.04 0.01 0.0[J [J.02 O.ClO
0.01 0.02 0.03 0.01 0.01 0.00 n.01
--- 0.02 0.02 0.03 0.04 0.05 Cl.D5
0.01 0.01 0.00 0.03 0.01 0.02 0.04
absolute value of the hor Izontal turbulent stress in m2, s2
direction of the horizontal turbulent stress in degrees
vertical turbulent temperature flux in °e m,s
horizontal turbulent temperature flux in oem,s
-55-
/

-. . UW
I
~
otT
- . . WT
-. . UT
U·W .
eX1 W'T' U'T'
RUN 14 (12 October 1978)
height in m
200
160
1 20
80
40
20
200
160
120
80
40
20
200
160
120
80
40
20
200
160
120
80
40
20
is
is
is
is
Table 45 time In GMT
% 12.00 % 12.30 ~ 3.00 % 13.30 % 14.00 % 14.30 L 0.03 0.02 0.02 0.05 0.08 0.19
0.07 0.06 0.04 0.07 0.11 0.16
0.08 0.09 0.02 0.11 0.08 0.09
0.11 0.08 0.09 0.20 0.13 0.12
0.11 0.15 0.18 0.1 ~ 0.17 0.18
0.15 0.12 0.22 0.25 0.21 0.14
074 143 080 119 137 130
083 136 051 103 140 116
087 128 059 112 135 109
107 115 109 120 124 114
101 111 117 113 119 119
109 100 107 017 113 120
0.00 0.00 0.01 0.00 0.00 0.02
0.01 0.01 0.00 0.00 0.00 0.01
0.01 0.01 0.00 0.01 0.00 0.01
0.03 0.02 0.02 0.02 0.00 0.01
0.05 0.03 0.03 0.02 0.01 0.01
0.05 0.03 0.03 0.02 0.01 0.00
0.01 0.03 0.03 0.02 0.02 0.04
0.03 0.02 0.01 0.01 0.02 0.02
0.02 0.01 0.00 0.00 0.00 0.01
0.06 0.02 0.03 0.04 0.02 0.01
0.05 0.05 0.06 0.05 0.04 0.01
0.08 0.05 0.06 0.05 0.03 0.00
absolute value of the hor Izontal turbulent stress in m2, s2
direction of the horizontal turbulent stress in degrees
vertical turbulent temperature flux in °e m,s
horizontal turbulent temperature flux in oem,s
-56-
:/
- , ,
UW ; ,
olT
- . . WT
- . . UT
U·W
oCr W'T' U'T'
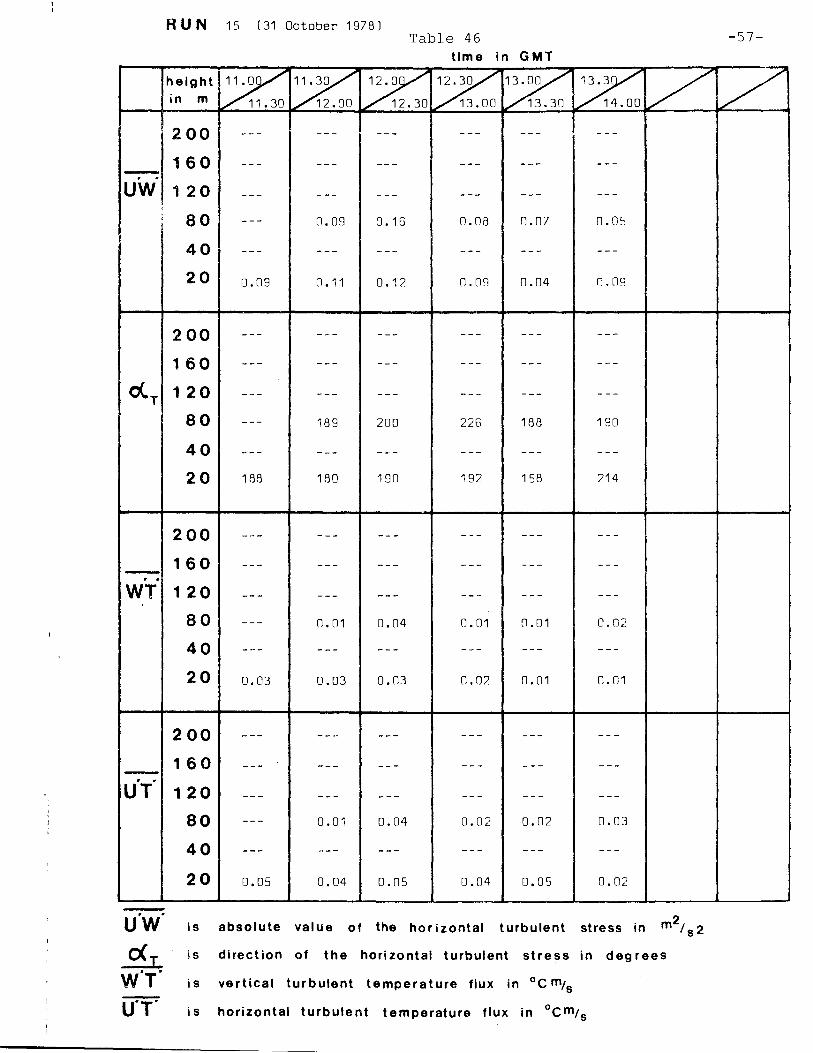
RUN 15 (31 October 1978)
height in m
200
1 60
1 20
80
40
20
200
1 60
1 20
80
40
20
200
160
1 20
80
40
20
200
1 60
1 20
80
40
20
is
is
is
is
Table 46 -57-time in GMT
% 11.30 % 12.00 ~ 12.30 ~ 13.00 ~ 13.3[J ~ 14.00 / - -- --- -- - - -- -- - - --
--- --- -- - - -- --- - --
--- -- - - -- - -- -- - -- -
--- O.[Jg 0.16 0.08 (1.07 0.(15
--- --- - -- - -- -- - - --
0.09 0.11 0.12 0.09 0.04 0.[J9
--- --- --- --- -- - -- -
--- --- -- - - -- -- - - --
--- - -- --- -- - --- - --
--- 189 200 226 188 190
--- --- --- --- --- - --
188 180 190 192 158 214
--- -- - -- - - -- -- - - --
-- - -- - -- - --- --- - --
--- --- --- --- - -- - --
- -- 0.01 [J.04 [J.01 (1.01 0.(12
--- --- --- --- --- - --
0.03 0.03 0.03 0.02 0.01 0.(11
- -- --- --- - -- --- ---
--- --- -- - -- - - -- -- -
--- --- --- -- - --- ---
--- 0.01 0.04 0.02 0.02 0.[J3
--- --- - -- -- - --- - --
0.05 0.04 0.05 0.[J4 0.05 0.02
absolute value of the horizontal turbulent stress in m2/s2
direction of the horizontal turbulent stress in deg rees
vertical turbulent temperature flux in °e m/s
horizontal turbulent temperature flux in °e m/ s
/

6 Radiosonde data
When visibility conditions were good, radiosondes were used
to obtain meteorological data above the mast. During a run
two radiosondes were launched prefarably before and after
the dispersion experiment. The results are given in Tables
47 to 59.
Radiosondes of type VIZ 1207 were modified in such a way
that the length of the temperature record is favoured at the
cost of the humidity signal, and that the signal transmitter
switches off at a height of about 3000 m. The receiver was
also modified so as to give better resolution. Temperature
is measured with a resistance element with an overall error
of 0.2 K and a lag time of 5 s. Height is given by a pressure
box.
-58-
The radiosonde ascent was observed with a theodolite with
which every 30 s the azimuth and elevation angle were measured.
From these observations together with height as function of
time the wind speed and wind direction profiles are calculated.

Table 47 -59-RUN (28 April 1977).
I Time 10.47 GMT Time 12.52 GMT
Pressure at grou ndlevel 1010.8 mb Pressure at groundlevel 1009.0 mb
Humidity at grou ndlevel 53 % Humidity at grou ndlevel 53 %
height 9 r U 0( height 9 r U ex in m In m
0 12.3 53 --- --- 0 13.7 53 --- ---
65 12.0 47 --- --- 42 13.4 45 --- ---
165 11 .9 41 --- --- 73 13.3 44 --- ---
240 12.1 44 B.O 160 209 13.3 42 7.9 151
532 12.0 49 8.4 165 401 13.3 45 8.9 157
789 12.1 58 10.0 172 721 13.4 51 9.5 162
1113 12.6 50 11 .8 184 905 13.3 57 9.5 1Fi6
1466 12.9 77 12.0 193 1123 13.5 66 9.1 171
1698 13.2 100 12.0 196 1413 13.5 85 8.5 17fi
1785 13.6 82 12.0 197 1674 13.7 100 10.4 182
1897 13.8 71 12.0 198 1822 14.0 100 11 .6 186
2019 14.5 100 --- ---
.'
Q potential temperature In °c
r relative humidity In %
U wind velocity In m, s
0( wind direction in degree s

Table 48 -60-
RUN 2 (12 October 1977).
Time 10.35 GMT Time GMT
Pressure at groundlevel 1018.1 mb Pressure at groundlevel mb
Humidity at groundlevel 75 % Humidity at grou ndlevel %
height 9 r U 0( height ~ r U ex: in m in m
5 13.8 --- --- --- 2533 29.3 --- --- ---
39 13.8 --- --- --- 2620 30.0 --- --- ---
139 13.4 --- --- --- 2719 30.3 --- --- ---
290 13.4 --- 9.6 218 2775 31.1 --- --- ---
367 14.0 --- 9.8 224 3197 33.9 --- --- ---
436 15.6 --- 9.2 228
505 16.3 --- 9.9 229
646 17.0 --- 11.5 229
690 17.4 --- 10.9 229
996 18.1 --- 10.3 230
, 1237 19.1 --- 10.6 234
1407 19.3 --- 11.5 235
1570 20.3 --- 11.5 236
1667 21.3 --- 11.5 237
1726 21.4 --- 11.7 234
1896 23.5 --- 14.6 230
2058 24.2 --- 15.0 230
2140 25.5 --- --- ---
2255 26.9 --- --- ---
2446 28.0 --- --- ---
9 potential temperature In °c r relative humidity In %
U wind velocity In m, s 0( wind direction In degrees

j I Table 49 -61-
RUN 2 (12 October 1977)
Time 13.05 GMT Time GMT
Pres su re at groundlevel 1017.4 mb Pressure at groundlevel mb
Humidity at groundlevel 65 % Humidity at groundlevel %
heig ht 9 r U 0( height g r U ex: in m in m
5 16.2 --- --- ---
305 15.9 --- 7.8 206
590 16.0 --- B.3 21B
679 16.4 --- --- ---
B12 17.8 --- --- ---
1114 1B.7 --- 10.7 227
1291 20.5 --- 7.0 242
1434 20.7 --- 7.B 246
1531 21.5 --- 9.4 248
1B65 22.3 --- 10.5 258
2139 /'3.7 --- 10.5 261
2264 25.9 --- --- ---
2296 26.9 --- --- ---
2349 2B.O --- --- ---
2607 2B.7 --- --- ---
2816 2B.9 --- --- ---
2B72 29.2 --- --- ---
2917 30.3 --- --- ---
3134 32.1 --- --- ---
35B3 33.7 --- --- ---
Q potential temperature In °c
r relative humidity In %
U wind velocity In m, s 0( wind dlrectlo n in degrees

Table 50 -62-
RUN 3 (10 October 1977)
Time 10.43 GMT Time GMT
Pressure at groundlevel 1018.3 mb Pressure at groundlevel mb
Humidity at grou ndlevel 82 % Humidity at groundlevel %
height 9 r U 0( height G r U ex in m In m
5 11.2 82 --- --- 2876 35.2 20 --- ---
65 10.9 82 --- --- 2990 36.0 20 --- ---
148 10.6 81 --- --- 3317 36.4 20 --- ---
214 10.9 79 6.7 163 3568 37.7 20 --- ---
231 12.2 79 7.1 162 3827 39.4 20 --- ---
248 14.6 74 7.4 161 4029 39.7 20 --- ---
265 16.0 73 7.8 160 4471 39.6 20 --- ---
351 18.2 59 9;5 159
421 19.6 54 10.0 159
535 20.2 52 9.3 160
768 20.9 51 12.0 170
969 22.4 40 14.8 181
1166 25.6 30 9.8 196
1653 28.2 20 7.3 207
1835 28.6 20 8.4 202
1896 29.4 20 8.5 201
2113 30.1 20 9.0 199
2207 31.2 20 --- ---
2443 32.6 20 --- ---
2552 33.6 20 --- ---
Q potential temperature in °c
r relative humidity In %
U wind velocity In m, s
0( wind direction In degrees
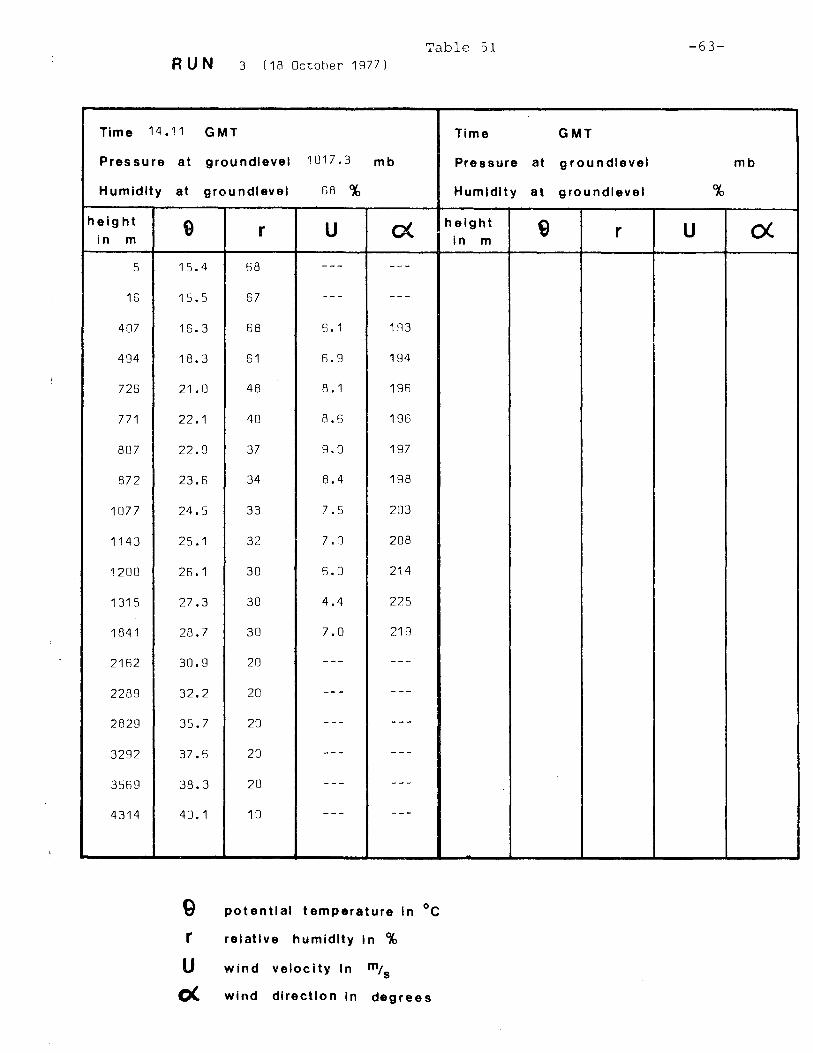
Table 51 -63-RUN 3 (18 October 1977)
Time 14.11 GMT Time GMT
Pressure at grou ndlevel 1017.3 mb Pressure at groundlevel mb
Humidity at grou ndlevel 68 % Humidity at groundlevel %
h eig ht 9 r U 0( height g r U ex: in m in m
5 15.4 6B - -- -- -
16 15.5 67 - -- ---
407 16.3 68 6.1 1~3
494 18.3 61 6.9 194
726 21.0 48 8.1 1~6
771 22.1 40 8.6 196
807 22.9 37 9.0 197
872 23.6 34 8.4 198
1077 24.5 33 7.5 203
1143 25.1 32 7.0 208
1200 26.1 30 6.0 214
1315 27.3 30 4.4 225
1841 28.7 30 7.0 219
2162 30.9 20 --- ---
2289 32.2 20 -- - - --
2829 35.7 20 - -- -- -
3292 37.6 20 --- ---
3569 38.3 20 - -- -- -
4314 40.1 10 --- - --
Q potential temperature In °c
r relative humidity In %
U wind veloc ity In m, s 0( wind dlrectlo n In degrees

Table 52 -64-
RUN 6 (17 January 1978)
Time 10.53 GMT Time 12.SQ GMT
Pressure at groundlevel 1003.6 mb Pressure at groundlevel 1IJn:i,n mb
Humidity at groundlevel - - % Humidity at grou ndlevel SF %
height 9 r U 0( height ~ r U ex: in m In m
5 - -- - -- --- -- - 5 5.7 86 --- ---
220 -- - -- - . 9.5 207 477 6.6 92 9.5 215
360 --- --- 13.0 221 904 7.2 100 --- -- -
510 -- - --- 10.5 222 1229 9.0 87 --- ---
650 -- - -- - 11.5 222 1303 9.8 89 -- - ---
800 -- - --- 10.0 222 1538 10.8 79 -- - ---
930 -- - --- 11.0 222 1576 11 .6 78 --- -- -
1090 - -- - -- 9.5 217 1692 12.2 76 --- - --
1240 --- - -- 9.0 210 1741 13.3 55 --- ---
1390 -- - --- 10.0 206 1809 14.0 52 - -- - --
1540 --- - -- 10.5 206 1869 14.3 50 --- -- -
1690 --- - -- 13.0 206 1918 14.8 47 --- ---
1840 --- -- - 13.0 206 2079 15.1 44 -- - -- -
2525 16.4 41 - -- -- -
9 potential temperature In °c r relative humidity In %
U wind velocity In m, s
eX wind direction In degrees

Table 53 -65-RUN 7 (18 April 1978)
Time 09.52 GMT Time 12.:34 GMT
Pressure at grou ndlevel 1015.2 mb Pressure at groundlevel -1 :-~ -1 'I " I,'; J. 'I mb
Humidity at grou ndlevel 54 % Humidity at grou ndlevel ·'1.6 %
height 9 r U 0( height G u ex in r m In m
5 10.5 54 --- -- - 5 11 .6 46 -- - - --
39 9.8 50 --- -- - 226 10.3 45 9.3 132
163 9.5 47 --- - -- 471 10.4 48 7.8 139
680 9.G 5G 10.8 153 801 10.7 52 5.5 140
1077 9.5 50 8.9 168 1766 10.G 81 8.7 1G6
1498 10.7 46 11.4 156 1911 12.1 52 10.9 161
1545 11 . 1 44 12.2 155 2049 15.3 35 11 .0 154
1582 11.2 41 12.4 156 2079 15.6 33 10.6 153
1639 12.2 35 12.0 1GO 2120 15.4 33 9.9 151
1678 12.6 30 11 .8 163 2313 15.9 33 !J.4 140
2221 16.7 15 9.7 1fJ1 2468 17.2 33 12.0 149
2877 21.5 35 --- 2542 18.5 33 12.0 156
2584 18.9 38 - -- - --
2975 20.9 44 - -- -- -
.1
Q potential temperature In °c
r relative humidity in % < t
U , wind velocity in m, I
<, , S
0( wind direction In degrees

Table 54 -66-RUN 9 (13 June 1978)
Time 09.57 GMT Time 12.4~ GMT
Pressure at 9 rou ndlevel 1019.0 mb Pressure at groundlevel 1fl1B,B mb
Humidity at groundlevel 71 % Humidity at groundlevel 72 %
heig ht 9 r U 0( height 9 r U ex: in m in m
5 13.0 71 --- --- 5 13.9 71 -- - - --
340 11 .5 73 5.0 320 71 12.7 65 --- -- -
500 11 .4 77 4.5 336 138 12.0 60 -- - -- -
640 11 .8 77 5.5 352 561 12.0 77 6.0 330
800 11 .9 83 5.5 35B 761 12.1 94 4.6 337
940 12.0 89 6.0 002 866 12.1 95 4.1 343
1090 12.1 94 4.5 351 10GR 12.9 87 2.1 004
1240 12.4 95 2.0 354 1371 13.3 100 2.5 ---
1400 12.5 91 2.0 310 1568 14.0 87 --- - --
1540 12.5 88 1.0 234 1737 16.6 34 --- ---
1780 17.1 33 -- - ---
1859 19.2 29 --- - --
1892 19.7 29 -- - ---
1988 20.3 29 --- ---
2199 20.8 27 --- -- -
2304 21.5 25 --- ---
2727 23.5 25 --- ---
2843 24.0 25 --- - --
3049 24.1 25 --- -- -
g potential temperature In °c
r relative humidity In %
U wind velocity In m, s 0( wind direction in degrees

Table 55 -67-RUN 10 (26 July 1978)
Time 10.03 GMT Time 17.59 GMT
Pressure at grou ndlevel 1007.6 mb Pressure at groundlevel 1~r7 '1 mb
Humidity at grou ndlevel 70 % Humidity at groundlevel h7 %
height 9 r U 0( height ~ r U ex in m in m
5 21.2 70 - -- -- - 5 22.6 fl7 - -- -- -
502 21.0 79 7.9 203 189 22.2 62 - -- - --
620 21.7 7~ 6.8 212 307 22.4 60 11 . B 199
679 23.6 73 7.5 214 426 22.5 61 12.4 201
733 24.1 73 8.2 215 fl57 22.6 67 12.:3 20S
1558 26.8 77 11.3 1:30 1005 22.7 78 14.fi 20F
2036 27.5 81 --- - -- 1283 22.8 78 15.3 711
2242 28.1 40 --- --- 1424 23.8 70 16.4 217
2456 29.4 30 --- - -- 1473 24.5 63 16.3 21B
2722 2:3.7 43 --- -- - 15~2 25.4 63 16.0 22n
3242 31.4 62 --- -- - 2306 27.6 70 18.6 ;702
3490 31.9 77 - -- - -- 2428 27.9 73 18. CJ 1%
3775 33.5 100 -- - - -- 2875 28.5 93 19.0 194
3037 2~.7 94 19.0 197
3400 31.3 94 - -- - --
3520 32.1 96 - -- - --
3731 33.7 9Fi - -- - --
3897 35.7 ~5 - -- - --
4024 36.7 91 -- - - --
4148 37.2 CJ1 - -- -- -
9 potential temperature in °c
r relative humidity In %
U wind velocity In m, s 0( wind direction in degrees
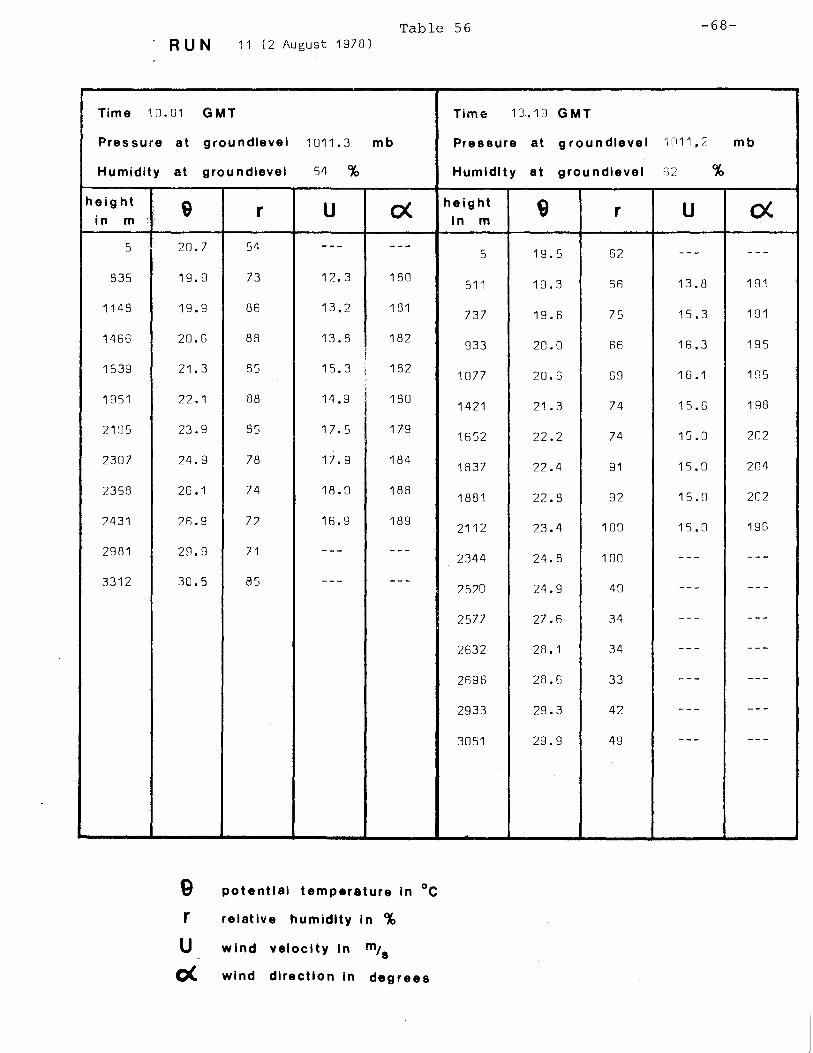
Table 56 -68-. RUN 11 (2 August 1978)
Time 10.01 GMT Time 13. FJ GMT
Pres sure at grou ndlevel 1011.3 mb Pressure at groundlevel 1n11,7 mb
Humidity at grou ndlevel 54 % Humidity at groundlevel fi2 %
"
heig ht height 9 r U ex: 9 r U ex in m in m
5 20.7 54 --- ---5 19.5 62 --- - --
835 19.9 73 12.3 180 511 19.3 6n 13.8 191
1148 19.9 86 13.2 181 737 19.6 75 15.3 191
1466 20.6 88 13.8 182 933 20.0 66 16.3 195
I
15.3 ,!
182 1539 21.3 85 ;! 1077 20.6 69 16.1 H15 ,
1951 22.1 88 14.9 I 180 1421 21.3 74 15.6 198
21:15 23.9 85 17.5 179 1652 22.2 74 15.0 202
2307 24.9 78 17.9 184 1837 22.4 91 15.0 204
2358 26.1 74 18.0 188 1881 22.8 92 15.0 202
2431 26.9 72 16.9 189 2112 23.4 100 15.0 196
2981 29.9 71 --- - --2344 24.8 100 --- -- -
3312 30.5 85 --- ---2520 24.9 40 -- - -- -
2577 27.6 34 -- - ---
2632 28.1 34 -- - ---
2696 28.6 33 --- ---
2933 29.3 42 --- ---
3051 29.9 49 --- ---
9 potential temperature in °c
r relative humidity in %
U wind velocity In m, s 0( wind direction in degrees

Table 57 -69-RUN 13 (10 nctohr~r 1"78)
Time 13,1() GMT Tirne 13, r:;n GMT
Pressure at groundlevel 1CJ17, (J mb Pressure at groundlevel :0'17.1 mb
Humidity at groundlevel 7Cl % Humidity at grou ndlevel 77 %
height 9 r U 0( height 9 r U ex in m in m
5 19,9 79 - -- --- 5 19,1 77 - -- - --
201 21,0 65 --- -- - 203 20,0 73 - -- - --
247 22 ,1 57 --- - -- 246 20.6 55 -- - - --
275 23,2 52 --- - -- 322 23.6 43 9.2 135
309 23.9 46 - -- -- - 395 25.1 35 9.7 140
415 24.7 45 --- --- fi55 27.7 30 1f1. fi 149
741 29.2 30 - -- --- 73~ 28.~ 30 ~.4 152
1961 33.3 30 6.8 171 1139 30.3 34 8.1 158
2299 33.6 30 --- - -- 1420 30.7 40 1 n. 5 154
1823 32,6 4CJ ~.5 Hi7
3228 34.1 53 - -- - --
3707 34.8 55 - -- - --
9 potential temperature In °c
r relative humidity In %
U wind velocity In m, s
eX wind dlrectlo n in degrees

Table 58 -70-RUN 14 (17 October 1976)
Time 12.57 GMT Time 13: 53 GMT
Pressure at groundlevel 1025.3 mb Pressure at groundlevel 1n::'4.r. mb
Humidity at grou ndlevel 66 % Humidity at groundlevel 66 %
height 9 r U 0( height ~ r U ex. in m in m
5 16.6 66 --- --- 5 19.5 66 --- -- -
326 16.3 72 - -- --- 431 19.6 66 --- - --
354 16.6 72 --- --- 521 20.7 54 10.4 126
467 22.5 44 --- --- 569 23.4 41 10.0 135
514 23.0 44 7.5 133 720 25.6 34 9.6 144
561 23.2 42 6.0 136 776 27.3 32 9.7 132
711 26.2 37 9.0 147 625 27.6 30 9.6 124
765 26.7 37 9.3 151 977 31.1 30 14.9 166
656 26.6 35 9.6 154 1097 32.3 30 17.0 160
666 29.1 35 10.0 15R 1366 33.0 30 13.6 166
942 30.6 30 10.7 159 1564 33.0 30 14.3 163
1035 31.6 30 11 .9 165 2030 34.7 30 10.2 157
1146 32.2 30 13.1 167 2475 34.6 30 9.6 154
1926 34.5 30 13.6 155 3041 36.6 30 --- -- -
3535 37.4 30 --- --- 3365 36.7 30 --- -- -
Q potential temperature In °c r relative humidity In %
U wind velocity In m, s 0( wind direction In degrees
r,
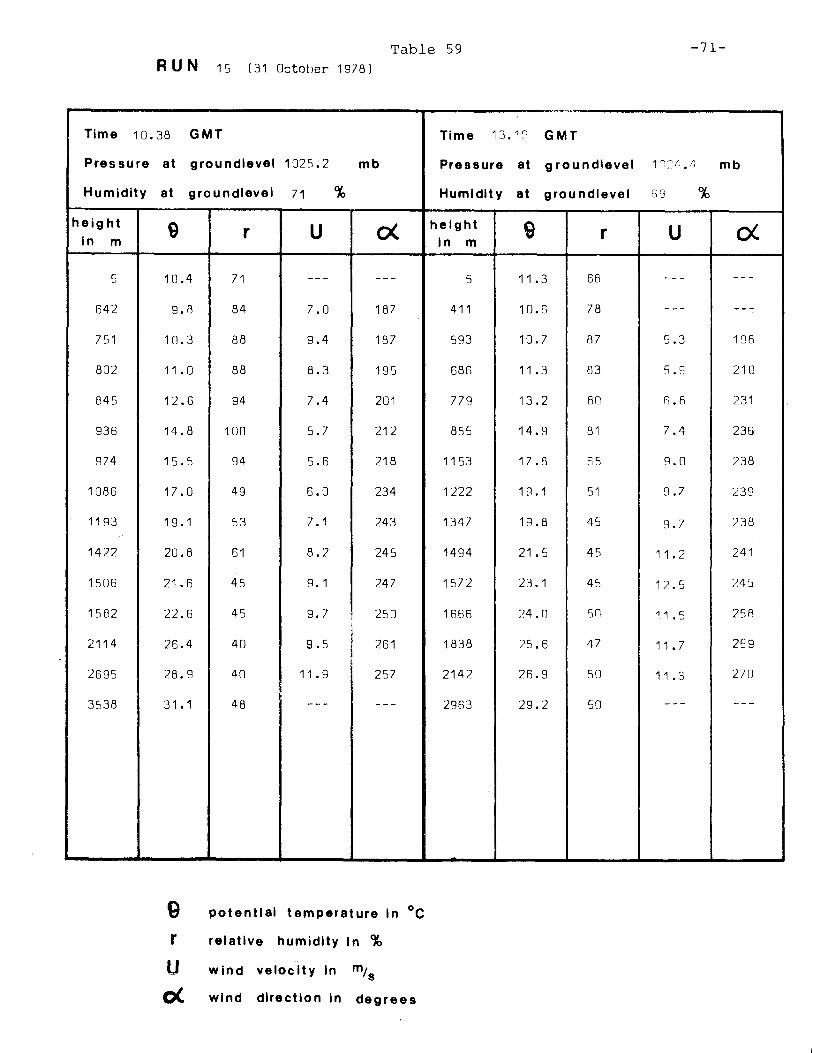
Table 59 -71-
RUN 15 (31 Octo her 1978)
:">.""." ...... -
Time 10.38 GMT Time 13.1C1 GMT
Pressure at grou ndlevel 1025.2 mb Pressure at groundlevel 1 'l7tl • Ii mb
Humidity at groundlevel 71 % Humidity at grou ndlevel S5 %
height 9 r U ex height G r U 0( in m In m
5 10.4 71 -- - -- - 5 11 .3 68 - -- - --
642 9.8 84 7.0 187 411 10.6 78 - -- ---
751 10.3 88 9.4 187 593 10.7 87 5.3 '198
802 11.0 88 8.3 195 686 11 .3 83 S.9 210
845 12.6 94 7.4 201 779 13.2 80 R.8 231
936 14.8 100 5.7 212 855 14.9 81 7.4 236
974 15.5 94 5.6 218 1153 17.8 65 9.0 238
1086 17.0 49 6.0 234 1222 19.1 51 9.7 239
1193 19.1 53 7.1 243 1347 19.8 45 9.7 238
1422 20.8 61 8.2 245 1494 21.5 45 11 .2 241
1506 21.6 45 9.1 247 1572 23.1 45 12.5 245
1582 22.6 45 9.7 250 1666 24.0 50 11 .5 258
2114 26.4 40 9.5 261 1838 25.6 47 11 .7 259
2695 28.9 40 11 .9 257 2142 26.9 SO 11 .3 270
3538 31.1 48 --- - -- 2983 29.2 50 - -- -- -
Q potential temperature In °c
r relative humidity In %
U wind veloc Ity In m, s 0( wind direction in degrees

7 Acoustic sounder observations
A monostatic acoustic sounder from Aerovironment Inc.
(option 300) is used to monitor the development of the
atmospheric boundary layer. It primarily shows the boundary
layer height, when it is less than 500 m. The analog
pictures of this instrument are given for each run (except
runs 13, 14 and 15) in the Figures 4 to 7.
-72-

RUN 1
1000-
1 500-
Height in m
0
RUN 2
1000
1 Height
in m
o
RUN 3
1000
!,
l : I ! r r , ' ,
r 500-'\
Height in m
o 3
Time in GMT
, " L
7 10
Time in GMT
Time in GMT
9 12
Figure 4 Acoustic sounder registrations for runs 1,2 and 3
-73-
13
15

RUN 4
1000
Height in m
o
RUN 5
[500
Height in m
0
RUN 6
1000 -
Height in m
o
-74-Time in GMT
3 6 9 12
Time in GMT
3
Time in GMT
Figure 5 Acoustic sounder registrations for runs 4,5 and 6
#. »
15

RUN 7
1000 -
500 -
Height in m
o
RUN 8
1000
[500 Height
in m
0
RUN 9
1000
Height in m
o
1
Time in GMT
Time in GMT
Time in GMT
Figure 6 Acoustic sounder registrations for runs 7,8 and 9
-75-
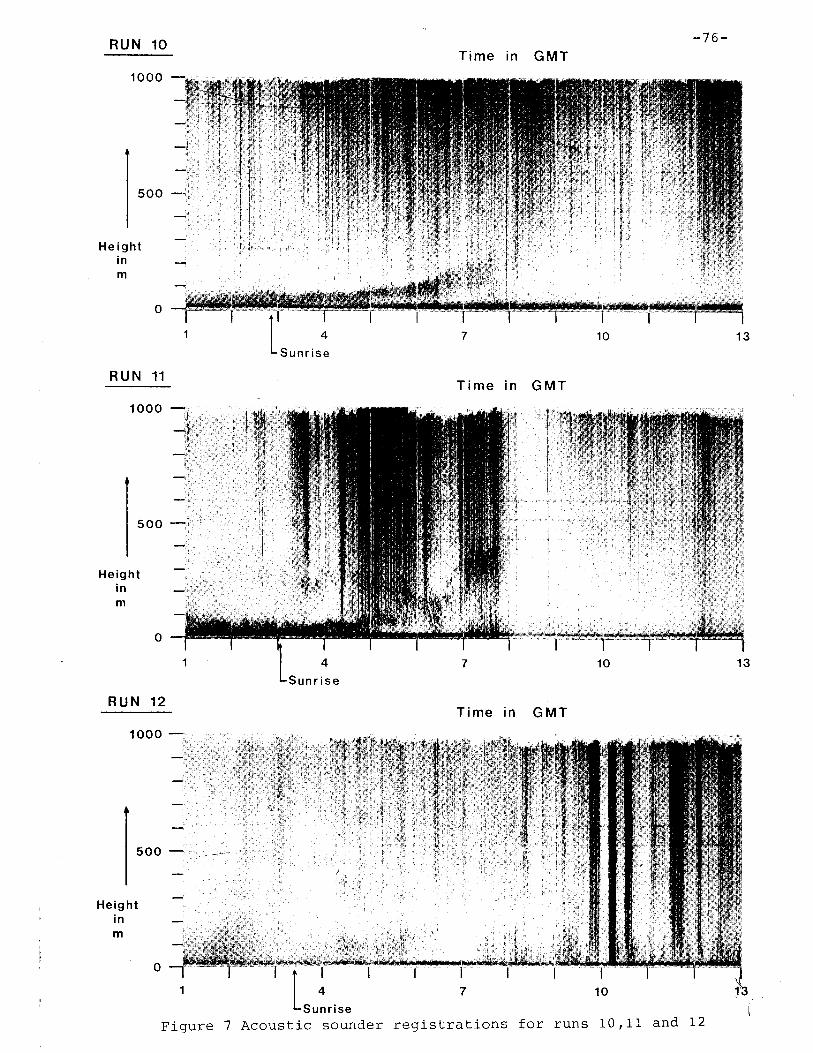
RUN 10 -76-
1000
500
Height in m
o
RUN 11
1000
500
Height in m
o
RUN 12
1
1000 -
Height in m
o
4
Sunrise
Time in GMT
Time in GMT
7
Time in GMT
7
10
10
Figure 7 Acoustic sounder registrations for runs 10,11 and 12
13

-77-
8 Radiation data
Near the mast radiation is observed at a height of 2 m.
The global radiation is measured with a Kipp (Moll-Gorzynski)
and the net-radiation is measured with a Suomi. The data
for each run are shown in the Tables 60 to 64.

R
G
R G
R
G
RUN
32:]
440
(7A April 1977)
37A
49'1
3A5
504
RUN 2 (12 Dctoher 1977)
7:'33
433
77G
431
2A1
43~
RUN 3 (18 October 1977)
263
420
267
425
252
411
Table 60
344
4flll
2Bn
435
224
382
time in GMT
235
326
155
223
time in GMT
261
413
226
372
time in GMT
190
346
152
302
R is net-radiation in W/m2 at a height of 2 m.
G is global radiation in W/m 2 at a height of 2m.
1S0
225
14R
275
106
244
2m
21'\2
13fJ
234
59
184
-78-
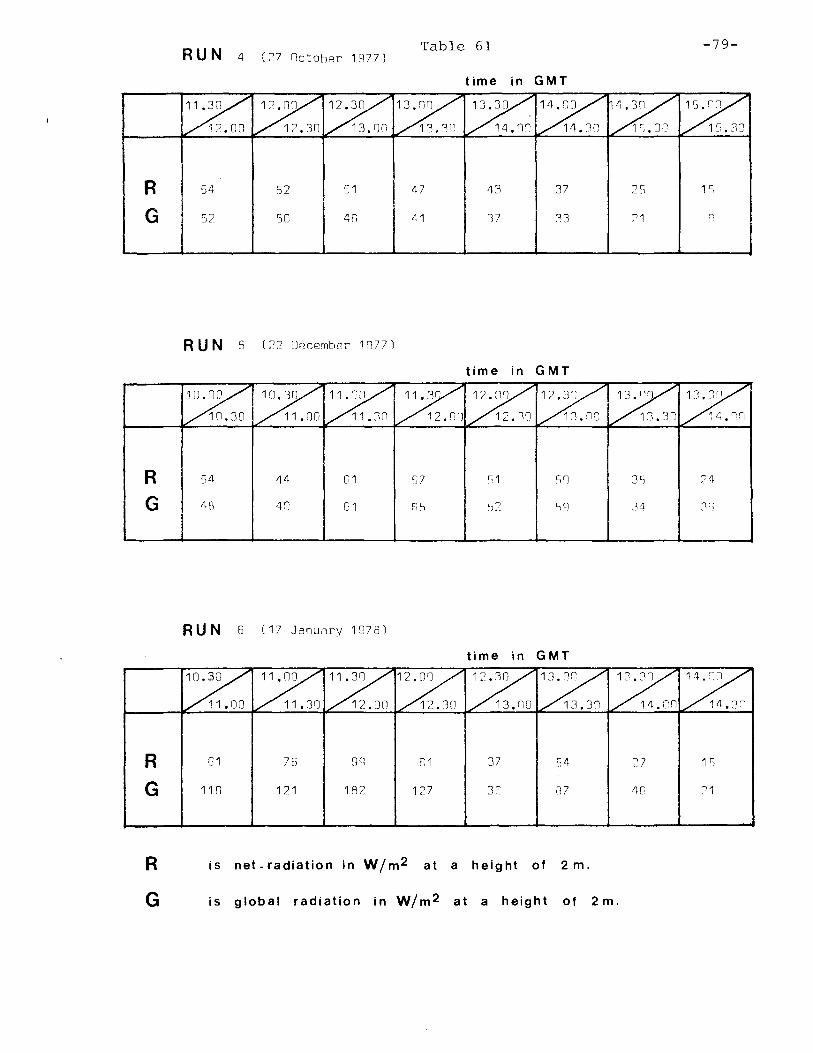
R
G
R G
R
G
RUN 4 (27 Octoher 1977)
54
52
52
5[]
51
4G
RUNs (22 December 1~77)
'i4 44 f,1
4A 41 G1
RUN 6 (17 January 1S78)
[1 76 ~l'l
11 n 121 182
Table 61
47
41
57
P'i
r:1
127
time in GMT
43
37
37
13
time in GMT
')1 sn
~~ S~
time in GMT
37 'i4
3') 87
R is net-radiation in W/m 2 at a height of 2 m.
G is global radiation in W/m 2 at a height of 2 m.
-79-
2'1 1 c,
3'l 74
]4 ~.r;
7.7 1 S
Iff] ?1

R
G
R G
R
G
RUN 7 (1 B April 1 ~7f3)
3c](]
G08
487
738
447
68ll
RUN A (25 May 1978)
ll5
76
Bc]
107
124
152
RUN 9 (13 June FJ78)
400
F:21
414
627
448
677
Table 62
4!l3
743
El7
7Fi
513
791
time in GMT
4CJ4
744
464
70ll
time in GMT
72
81
time in GMT
517 331
776 597
R is net-radiation in W/m 2 at a height of 2m.
G is global radiation in W/m 2 at a height of 2 m.
366
57CJ
90
106
31ll
4fl7
3!l0
597
92
108
307
474
-80-

RUN 1n (26 July 1~7B) Table 63 -81-
time in GMT
R 155 117 1Cl? 728 733 151 147 271
G 245 1~2 177 342 ::l5 4 3~G II fJll 3el7
RUN 11 (2 August 1:l71J1
time in GMT
R '''53 4013 31G ~27 :'37 1~n 344 ;oS'l
G 6131 5C1~ ~! 4£;4 13n 34tj 2F)~ IIA6 tjnR
RUN 1~) (1fl Aup;u,;t Fl7Gl
time in GMT
R 281 767 436 2Cl - 112 ~ ,r~ 3 3["',0 2')
G 42Cl 415 fi3'l ~f1F' 14 5 4'iS 4IJA 31R
R is net-radiation in W/m 2 at a height of 2 m.
G is global radiation in W/m 2 at a height of 2 m.
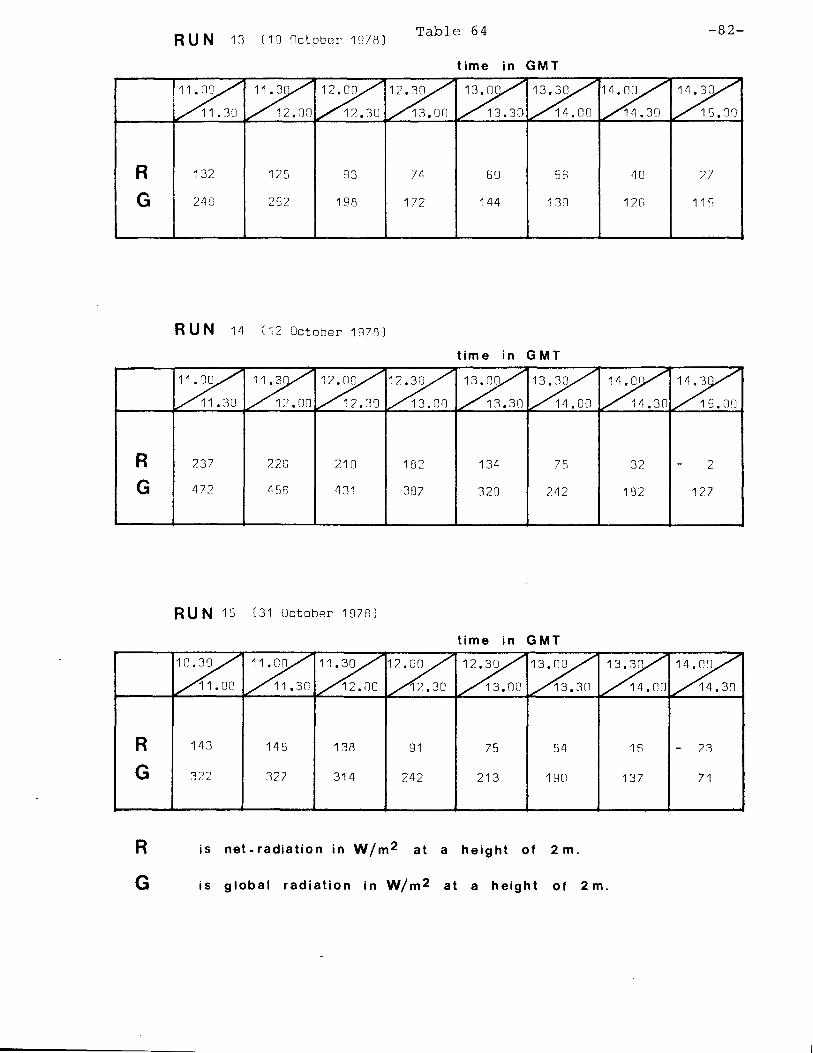
R G
R G
R
G
RUN 1] (1~ nctoner 1978)
132 125
24B 252
~3
198
RUN 14 (12 Octoner 1~7n)
237
417
226
456
21n
4]1
RUN 15 (31 Uctober 1978)
143 148
327
138
314
Table 64
74
172
182
387
91
242
time in GMT
60
144
time in GMT
134
320
75
242
time in GMT
75
213
54
190
R is net-radiation in W/m2 at a height of 2 m.
G is global radiation in W/m 2 at a height of 2 m.
40
128
32
182
16
137
-82-
27
115
2
127
23
71

9 Synoptical observations
During each run synoptical observations were made primaraly
concerning the cloud cover. These observations together
with a surface weather map are shown in the Figures 8 to 22.
-83-

Figure 8
RUN (28 April 1977)
Synoptic surface chart at 12 GMT
Observations during experiment
Time (G.M.I.)
09.35 7/8 cover of cirrus and alto cumulus
12.05 5/8 cover of alto cumulus and cumulus
-84-

Figure 9 -85-
RUN 2 (12 October 1977 1
Synoptic surface chart at 12 GMT
Observations during experiment
Time (G.M.T.l
Cloudiness virtually zero during the whole experiment
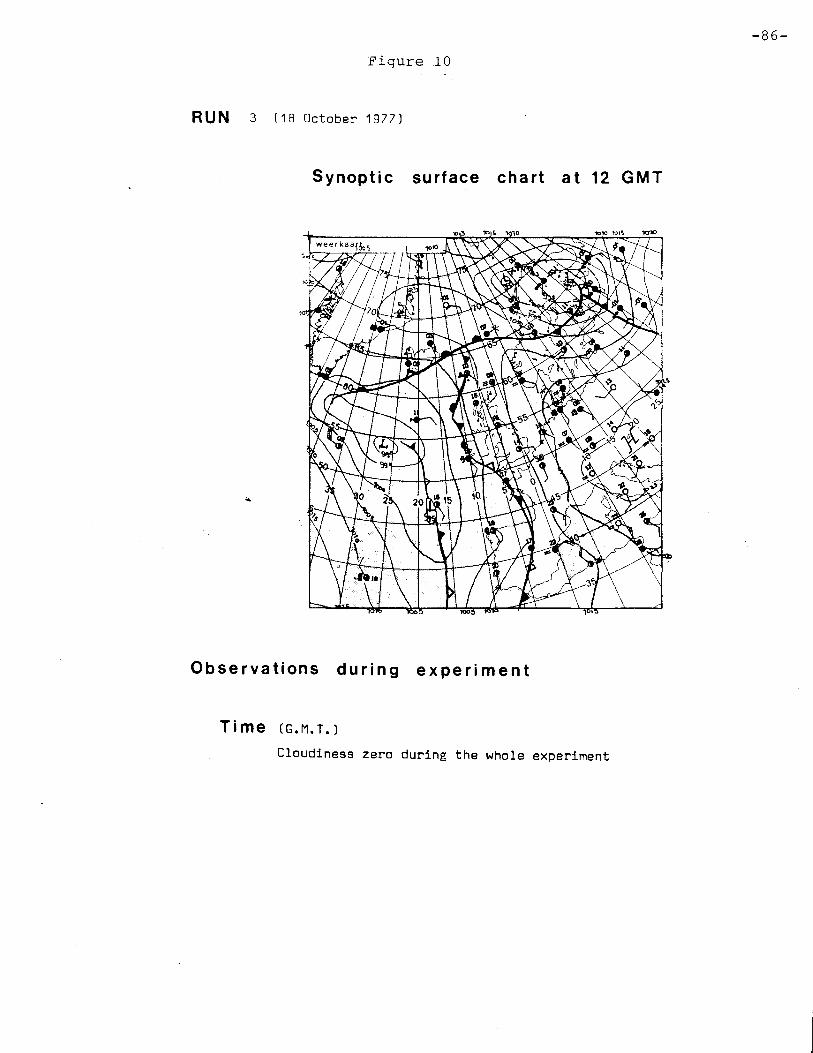
-86-
Figure 10
RUN 3 (18 October 1977)
Synoptic surface chart at 12 GMT
Observations during experiment
Time (G.M.T.)
Cloudiness zero during the whole experiment
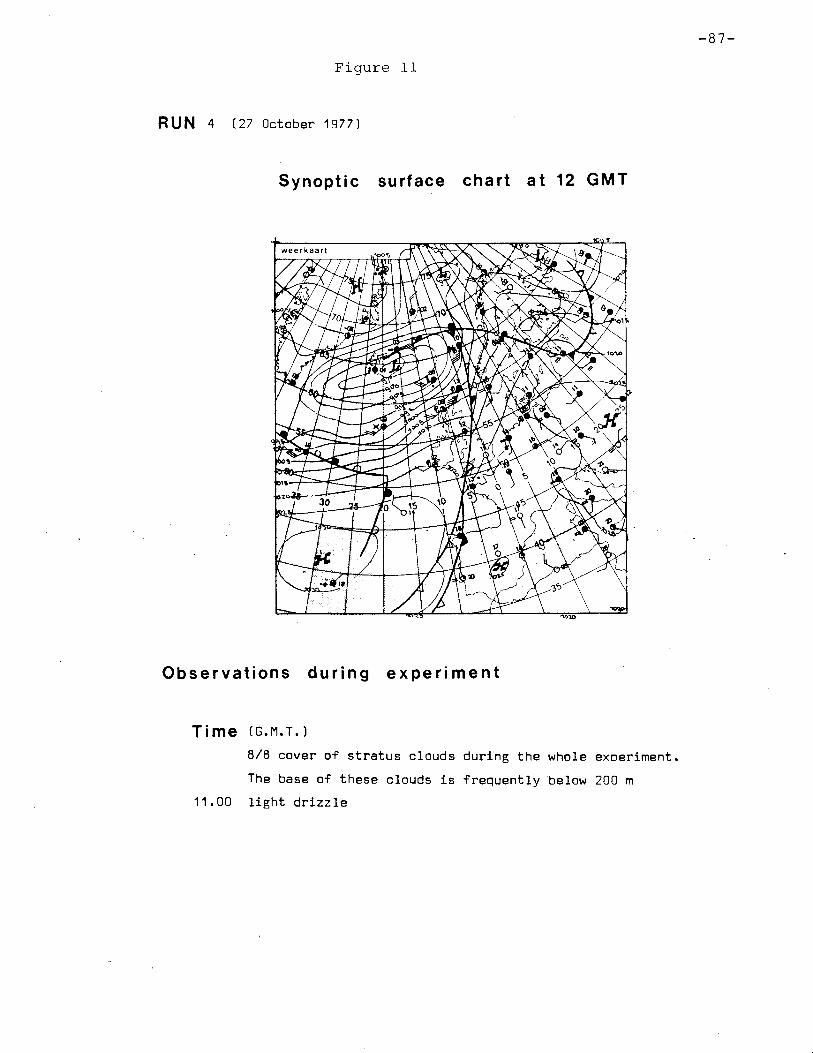
Figure 11
RUN 4 (27 October 1977)
Synoptic surface chart at 12 GMT
Observations during experiment
Time (G.M.T.l
8/8 cover of stratus clouds during the whole exoeriment.
The base of these clouds is frequently below 200 m
11.00 light drizzle
-87-

-88-
Figure 12
RUN 5 (22 December 1977)
Synoptic surface chart at 12 GMT
Observations during experiment
Time (G.M.T.)
Continuous fog during the experiment
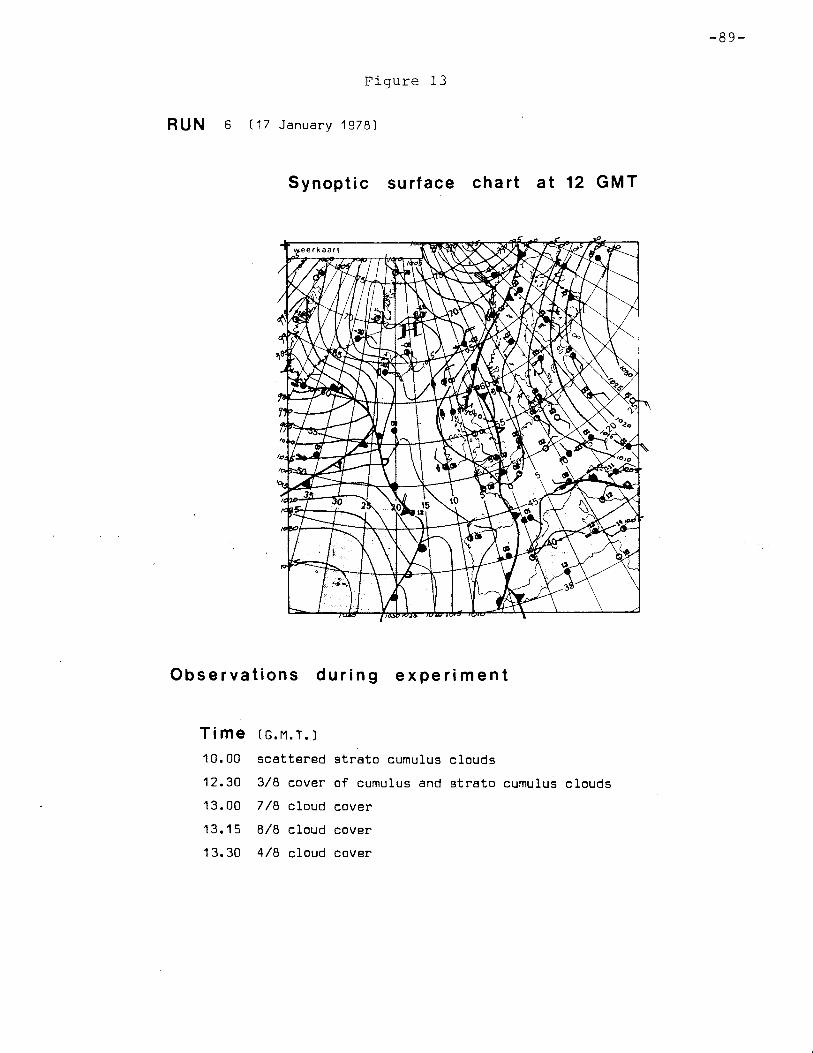
-89-
Figure 13
RUN 6 (17 January 197B)
Synoptic surface chart at 12 GMT
Observations during experiment
Time (G.M.T.l
10.00 scattered strata cumulus clouds
12.30 3/B cover of cumulus and strata cumulus clouds
13.00 7/B cloud cover
13.15 BIB cloud cover
13.30 4/B cloud cover

-90-
Figure 14
RUN 7 (18 April 1978)
Synoptic surface chart at 12 GMT
Observations during experiment
Time (G.M.T.l
10.50 1/8 cover of cumulus clouds
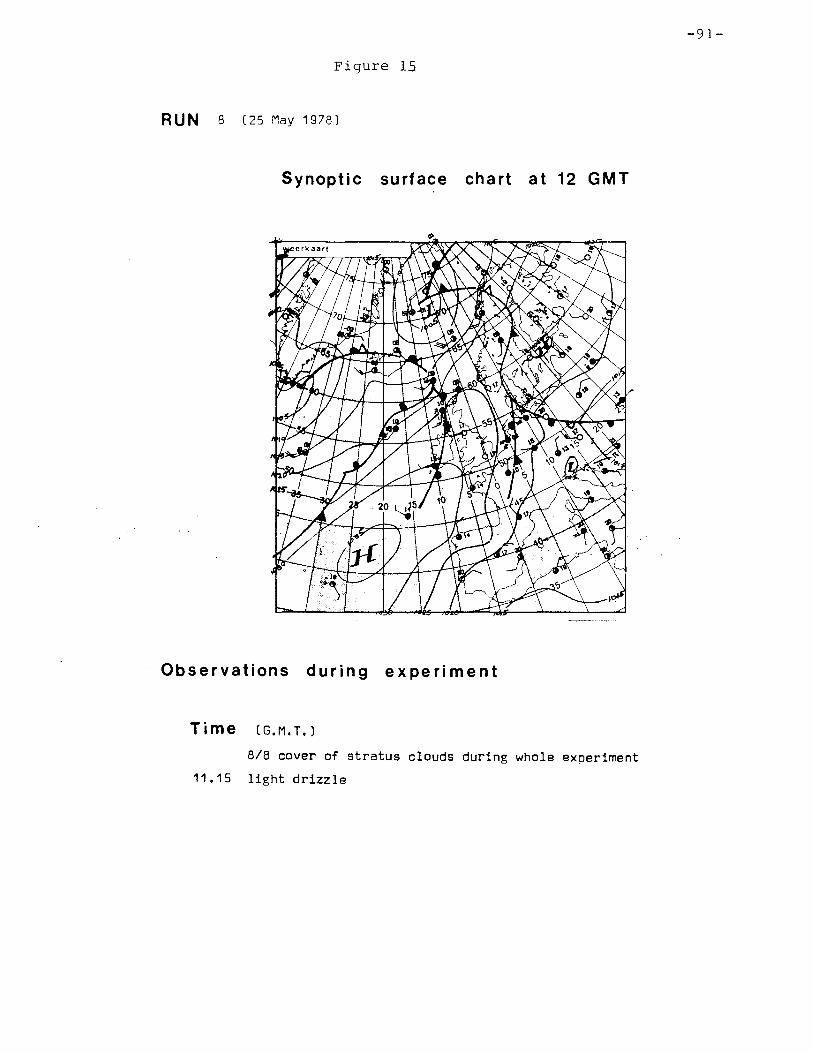
Figure 15
RUN 8 (25 May 1978)
Synoptic surface chart at 12 GMT
Observations during experiment
Time (G.M.T.)
8/8 cover of stratus clouds during whole experiment
11.15 light drizzle
-91-

Figure 16
RUN 9 (13 June 1978)
Synoptic surface chart at 12 GMT
Observations during experiment
Time (G.~.T.)
10.45 6/8 cover of heavy cumulus clouds
11.15 6/8 cover of heavy cumulus clouds
-92-

-93-
Figure 17
RUN 10 (26 July 1978)
Synoptic surface chart at 12 GMT
Observations during experiment
Time (G.M.T.)
11.15 8/8 cover of alto cumulus clouds
12.15 8/8 cover of alto cumulus clouds
12.26- light rain 12.42

Figure 18
RUN 11 (2 August 1978)
Synoptic surface chart at 12 GMT
Observations during experiment
Time (G.M.T.l
8/8 cover of clouds during the whole experiment.
Large wind direction variations.
-94-
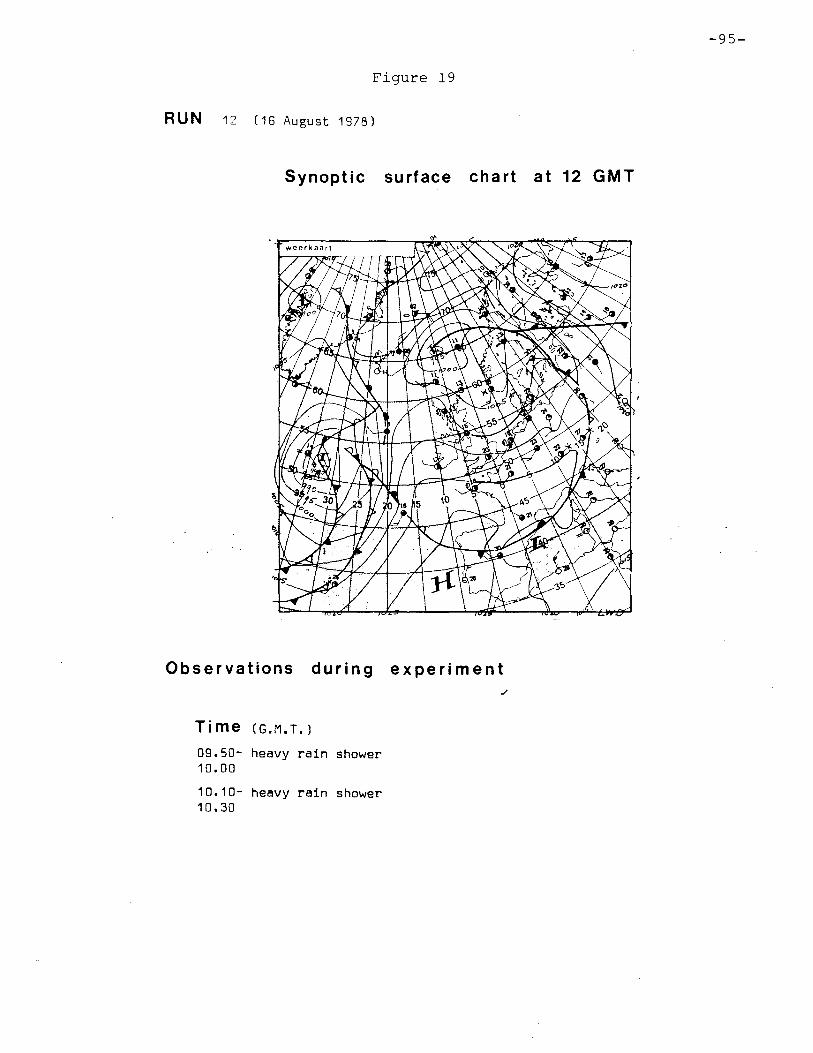
-95-
Figure 19
RUN 12 (16 August 1978)
Synoptic surface chart at 12 GMT
Observations during experiment
Time (G.M.T.)
09.50- heavy rain shower 10.00
10.10- heavy rain shower 10.30

-96-
Figure 20
RUN 13 (10 October 1978)
Synoptic surface chart at 12 GMT
Observations during experiment
Time (G.M.T.)
12.50 8/8 cloud cover of alto stratus.
The sun is visible through cloud cover.

-97-
Figure 21
RUN 14 (12 October 1978)
Synoptic surface chart at 12 GMT
Observations during experiment
Time (G.M.T.)
Cloudiness virtually zero during the whole experiment

-98-
Figure 22
RUN 15 (31 October 1978)
Synoptic surface chart at 12 GMT
Observations during experiment
Time (G.M.T.J
Cloudiness virtually zero during the whole experiment

10 Geostrophic wind data
The geostrophic wind was calculated each hour from synoptic
pressure observations at 19 stations by a method based on
principal component analysis (Cats, 1977).
The data for each run are shown in Table 65.
-99-

-100-
Table 65
time In GMT RUN
09.00 10.00 11.00 12.00 13.00 14.00 15.00
1 U 10.0 10.3 11 .3 10.0 8.4
a 1 e.6 15~ 164 165 158
2 U 10.8 11.9 10.3 8.2 5.0
a 230 234 233 245 260
3 U 7.3 5.3 5.5 4.8 4.1
a 181 175 176 175 16a- .
4 U 2.9 4.1 3.6 3.2
a 168 148 171 186
5 U 12.2 10.3 8.8 9.3 8.4
a 231 234 240 239 233
6 U 8.3 7.4 6.7 6.3 5.0
a 211 213 217 214 222
7 U 2.5 3.9 5.2 7.6 8.1
a 141 110 117 124 117
8 U 11.8 11.8 11.4 10.3 11 .3
a 358 2 0 252 10
U is geostrophic wind velocity In m/s
a is geostrophlc wind direction In degrees

-101-
Table 6S (continued)
time in GMT RUN
09.00 10.00 11.00 12.00 13.00 14.00 15.00
9 U 5.3 5.2 5.4 5.2 5.7
0( 334 344 359 357 357
10 U 8.4 6.7 6.8 6.S 9.5 7.3 3.7
0( 184 191 207 215 225 242 275
11 U 8.3 7.2 5.n 5.2 5.1 5.3 5.n
0( 167 170 171l 182 171 176 184
12 U 9.8 S.2 7.3 fl.2 4.:1 5.R 7.1l
0( 250 260 270 281 267 265 2GB
13 U 7.S 8.6 8.4 7 • ~l B.O 7.1l
0( 151 141 131 140 148 144
14 U 7.2 7.6 8.0 9.2 8.2 7.5 7.8
0( 155 150 145 153 132 127 116
15 U 3.0 3.0 4.0 3.6 3.5
0( 210 202 203 199 207
U is geostrophic wind velocity in m/s
0( is geostrophiC wind direction in degrees

11 Emission procedure
In the cellar of the instrumentation room of the mast ten
gas cylinders are installed, each cylinder containing 40 kg
of liquid SF6 . The cylinders are connected via copper tubing
to a reducing valve. After reducing the pressure to 0.8 MPa,
the gas flows through a copper tube to points of release
situated at heights of 80 and 200 m.
At the point of release, which was 80 m or 200 m depending
on the meteorological conditions, the pressure is reduced
(twice) to about 0.15 MPa. Then the gas is emitted into the
atmosphere via a fine metering valve and a dry gas meter.
The gas meter reading is made every 10 minutes. The source
strength is calculated taking into account temperature and
pressure of the gas.
The emission values and the height of release are given in
Table 66.
Taking into account the errors in the purity of the SF 6 used, in the gas meter readings and in the temperature and
pressure the error in the emission value is estimated at 4%.
During a run the variability in the source strength was very
small. The coefficient of varation, the ratio of the standard
deviation and the lO-minutes mean value Was 0.5%.
-102-
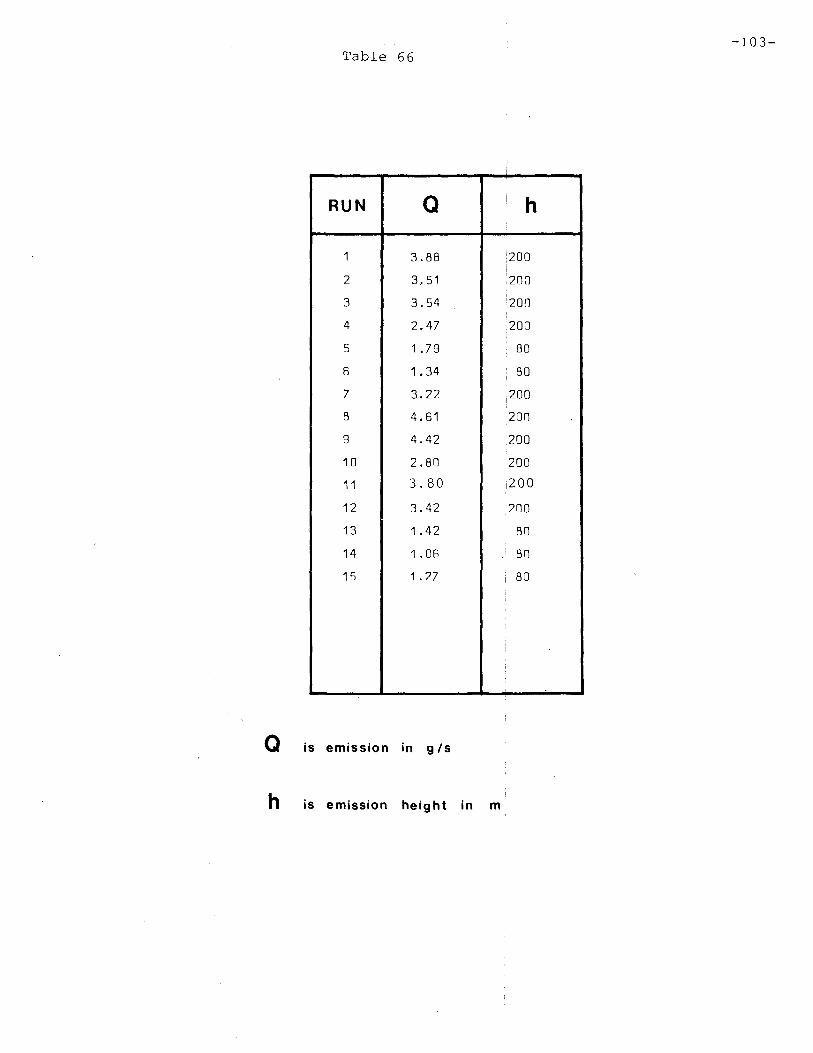
-103-Table 66
,
RUN a h
1 3.BB :200 !
2 3,51 200
3 3.54 200 I
4 2.47 200
5 1.79 80
6 1.34 BO
7 3.22 ,200
B 4.61 200
9 4.42 200
10 2.BO i 200
11 3.80 1200
12 3.42 200
13 1.42 BO
14 1 . Of) BO
15 1.27 BO
a is emission in g /s
h is emission height in m

12 Concentration distributions and related parameters
At the measuring points the air was sampled by means of a
measuring station consisting of two specially constructed
glass vessels. These vessels have two compartments separated
by a partition in which a capillary is mounted, see Figure
23. The upper compartment is completely filled with distilled
water. Air is sampled by opening stopcock A by which water
flows through the capillary into the lower compartment and
air is sucked into the upper one. The flow rate of water and
therefore the flow rate of air is constant due to a constant
pressure drop (~p) over the capillary. The sampling time is
30 minutes during which about 60% of the upper compartment
is filled with air.
After sampling the lower compartment is completely filled
with distilled water through the stopcocks D. This is done
-104-
to avoid suction of air from the lower into the upper compartment,
due to possible temperature differences during the transport
of the vessel to the laboratory.
The day after the field experiment, the air samples are
analyzed by means of a gaschromatograph with an electron
capture detector. The sampled air is led into the chromatograph
through stopcock B by filling the vessel with water through
stopcock A. Details of the gas chromatograph are described in
Table 67.
The area of the SF6 peak is measured with an integrator
(Hewlett Packard, type 3370B). From the area the concentration
of SF6 in the air sample is determined with the aid of a
calibration curve.

Calibration gases are made by first diluting a known quantity
of SF 6 in an evacuated gas cylinder which is then compressed
with nitrogen. From this so-called parent calibration gas
other calibration gases are made in the same way. The range 3 -9 of SF 6-concentrations is 30 to 8000 ng/m (1 ng = 10 g).
The calculated error in the calibration gas concentrations
is 3%. This figure has been checked by preparing calibration
gases with an independed method using a permeation device
filled with liquid SF 6 (Metronics Dynical wafer type).
To minimize errors a calibration curve is determined before
and after the analysis of the air samples and the samples
are analyzed in twofold. Variations in the calibration curve
can occur by changes in the sensitivity of the electron
capture detector due to small changes in temperature, flow
rate and composition of the carrier gas. The variations in
the calibration curve are usually less than 5% over a 12
hour period, but can sometimes be 10~20%.
The results of the concentration measurements are given in
the Tables 68 to 81. In these tables for each run the SF 6 concentrations are given as measured on the sampling points,
which are numvered according to the system of preselected
locations discussed in chapter 3. Data for two calibration
curves are shown. No data are availiable of Run 11 due to
malfunction of the gaschromatograph.
In Table 82 for each run some quantities derived from the
concentration distribution are given: C the cross-wind y integrated concentration ; a the wind direction of the
plume axis and 0 the lateral dispersion coefficient. The y plume axis is defined as the line connecting the mast and
the centre of gravity of the concentration distribution. The
centre of gravity or first moment of the concentration
distribution is defined as:
-105-

00 00
y Jc. s.ds J c.ds
-00 -00
where c is the concentration and s the co-ordinate along the
road.
The concentration distribution is projected on a line y
which passes through y and which is perpendicular to Xi see
Figure 24. The standard deviation or second moment of the
projected concentration distribution is defined as:
The cross-wind integrated concentration distribution is
given by:
00
C :;: / c.dy. y -00
In Table 83 for each run the distance between the mast and
the concentration distribution is given measured along the
plume axis.
An estimation is made of the inaccuracy in the values of the
cross-wind integrated concentration C and of the lateral y
dispersion coefficient 0 • This inaccuracy is mainly determined y
by errors in the measured SF 6 concentrations and in the
distance between the sampling points.

The error in the SF 6 concentration depends cn the inaccuracy
in the concentration of the calibration gases and in the
difference between the calibration curves made before and
after the analysis of the air samples. The error in the
('~libration gases was calculated to be 3%. The error in the
SF 6 concentration is estimated to be 10% for a concentration
of 100 ng/m3 and 5% for concentrations higher than 500
ng/m3 . The inaccuracy in the distance between the measuring
points is 10 m maximum.
-107-
Using the values above the error in the cross-wind integrated
concentration is calculated and amounts 10-15%. The inaccuracy
in the lateral dispersion coefficient is estimated to be 5-
10%.

Table 67
Details of the gaschromatograph (Hewlett Packard, type 5753) used for the SF6
-analyses
separating column:
material length diameter carrier
carrier gas temperature
electron capture detector:
source purge gas pulse interval temperature
runs 1 - 10
copper 2 m 6.35 rom mol. sieve 5A, 45-60 mesh 3 nitrogen, 55 cm /min 80°C
2 mCi Ni 63 none 150 ):Is 230°C
runs 12 - 15
copper 2 m 6.35 rom mol. sieve 5A, 60-80 mesh 3 nitrogen, 20 cm /min 100°C
2 mCi Ni 63 nitrogen, 18 cm
3/min
150 \ls 170°C
-108-

Table 68
RUN (iEl flpril 1~l77]'
meas. period 1 11.4[;-12.15 p'eriod 2 12.1'1-1:'.45
poin t C-:j C2 C1 C2
I --r
/~B 7 l, '; I
:?]~J 3S n ]~;l
! l
29 C" r~ r _, I., J ')7 'l 42'i 4311
30 1:345 11GlJ 3fir l7n
31 BS'j 1:i:1r ) SEW F;~ '1
32 111 :; 173'; 177'1 187 i] i
I 33 4315 43(W 12~S 132n I
34 615 025 1 '1q[j 1'i~S
I 35 1370 14'JS 1085 1745
3li - - -- - - -- Cl7[1 ~-l ~~ 5
I I :17 2(;45 ') 7 If 3("<:; 3 0 [1 -:- I L _) ,1._1
I 38 11.lq[] 19?r~ 41'i 475 I I
39 fJ 1 '] 81 (1 17 n I 195 I 40 Elf) 0; RSI-) r:n
'.J ~) ~j
41 Fi3i) S~) L.! 1 r; L)
I prj I
I
I 42 5i') 53') :: [J ?f' , I
43 3'15 4Cl!1 E ;
- - -- I
44 45 Gi: '1 h I I
45 18[1 1'1'J II - - --
I 46 f) :1 r; Ii i I
47 CI f1 ;l c: I I
48 5 ::"; 5 I i
I ! I
I \
~-~ C1 is concentration in ng/m3 determined with first calibration curve.
C2 is concentration in ng/m 3 determined with second calibration curve.
(concentration values have been corrected by subtracting a
background concentration of 1 C; n9/m3).
-109-

Table 69
RUN 2 (12 October 1977)
Time in GMT
meas. period 1 12.00-12.3rJ period 2 12.3rJ-13.00
point C1 C2 C1 C2
52 0 0 0 0
53 0 0 15 10
54 0 rJ 110 90
55 65 50 22rJ 190
56 140 120 240 210
57 410 370 580 535
58 380 340 900 860
59 580 530 960 920
60 1000 970 820 770
61 1800 1750 640 600
62 2000 2000 640 590
63 820 780 480 440
64 910 860 120 100
65 100 85 110 95
66 200 180 100 85
67 35 25 45 35
68 5 0 10 0
69 0 0 0 0
70 5 0 0 0
71 0 0 0 0
72 0 0 0 0
73 0 0 0 0
74 5 0 -' -
75 0 0 0 0
C1 is concentration in ng/m3 determined with first calibration curve.
C2 is concentration in ng/m3 determined with second calibration curve.
(concentration values have been corrected by subtracting a
background concentration of 10 ng/m 3).
-110-

Table 70 RUN 3 (18 October 1977)
Time in GMT
meas. period 1 12.45-13.15 period 2 13.15-13.45
point C1 C2 C1 C2
21 0 0 5 5
23 0 0 0 0
25 0 0 0 0
26 0 0 10 10
27 5 5 60 65
28 120 140 70 75
29 760 820 260 270
30 1550 1700 460 500
31 2850 3100 1250 1350
32 3050 3300 2400 2600
33 2750 3000 2550 2750
34 2900 3150 2300 2500
35 1900 2050 2600 2800
36 1250 1350 2200 2350
37 1600 1750 1550 1700
38 430 460 190 200
39 180 180 0 0
40 0 0 0 0
41 0 0 0 0
42 0 0 0 0
43 0 0 0 0
44 0 0 0 0
46 0 0 0 0
t'lA 0 0 0 0
C1 is concentration in ng/m3 determined with first calibration curv~.
C2 is concentration in ng/m 3 determined with second calibration curve.
(concentration values have been corrected by subtracting a
background concentration of 5 ng/m 3).
-111-

RUN 4 (27 October 1977) Table 71
Time in GMT
meas. period 1 13.45-14.15 period 2 14.15-14.45
point C1 C 2 C 1 C 2
31 a a
33 a a
35 a a
37 a 45
39 ·0 110
41 165 170
43 90 150
45 40 185
47 20 0
49 a 0
50 a a
51 a 0
52 a a
53 a a
54 a a
55 a a
56 a a
57 a a
58 a a
60 a a
62 a a
64 a 0
66 a a fiR a a
C1 is concentration in n9lm3 determined with first calibration curve.
C2 is concentration In ng/m3 determined with second calibration curve.
(concentration values have been corrected by subtracting a
background concentration of
-112-
\

Table 72 -113-RUN 5 (22 December 1977)
Time in GMT
meas. period 1 12.00-12.30 period 2 12.30-13.00
pOint C1 C2 C1 C2
52 5 5 0 0
54 0 0 0 0
56 0 0 0 0
57 0 0 0 0
58 0 0 30 35
59 5 5 0 0
60 5 5 0 0
61 10 10 0 0
62 0 0 0 0
63 0 0 5 5
64 0 0 5 5
65 150 160 300 320
66 640 700 B40 940
67 1900 2150 2200 2500
6B 2650 3000 2600 2950
69 2500 2Boo 2350 2650
70 2350 2650 2100 2350
71 1650 1B5o 1150 1300
72 B50 940 640 700
73 140 160 220 240
74 20 20 20 20
76 20 25 30 30
7B 5 5 0 0
80 - - 'i -.2
C1 is concentration in ng/m3 determined with first calibration curv~.
C2 is concentration in ng/m 3 determined with second calibration curve.
(co n cent ration value s have been corrected by subtracting a
background concentration of 5 ng/m 3) .
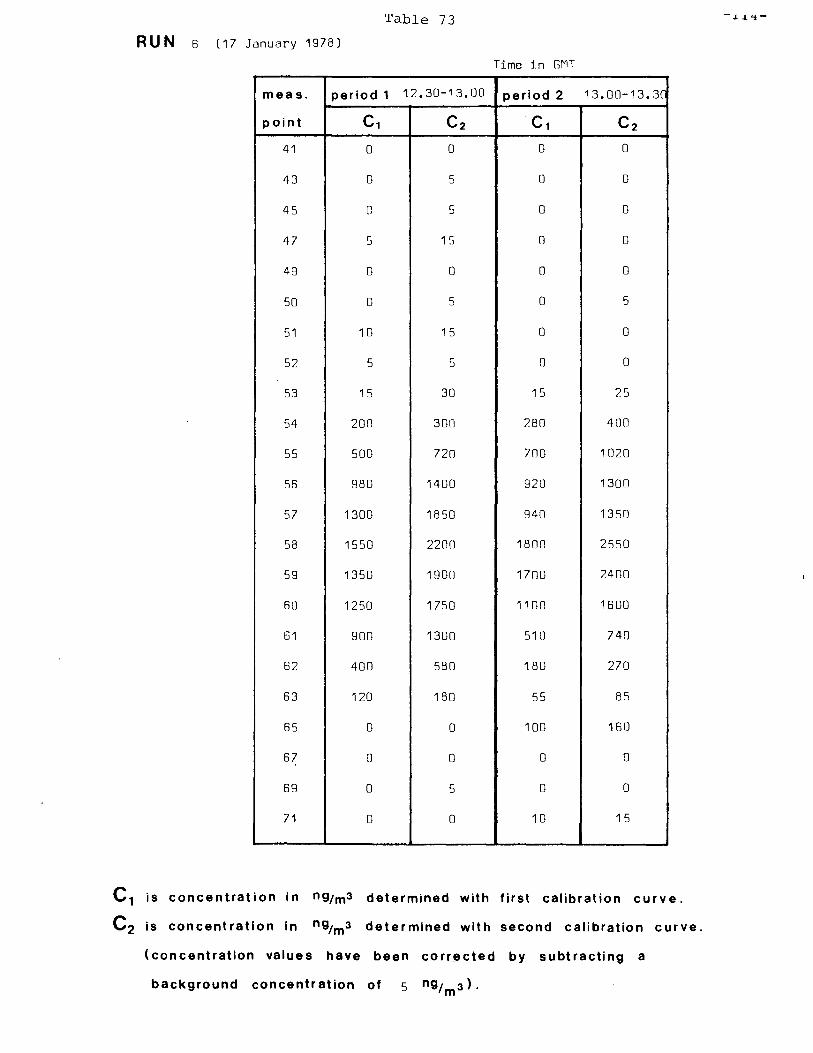
Table 73
RUN 6 (17 January 1978)
Time in GMT
meas. period 1 12.30-13.00 period 2 13.o0-13.3Cl
point C1 C2 C1 C2
41 0 0 0 0
43 0 5 0 0
45 0 5 0 0
47 5 15 0 0
49 0 0 0 0
50 0 5 0 5
51 10 15 0 0
52 5 5 0 0
53 15 30 15 25
54 200 30n 280 400
55 500 720 700 1020
56 980 1400 920 1300
57 1300 1850 940 1350
58 1550 2200 1800 2550
59 1350 1900 1700 2400
60 1250 1750 1100 1600
61 900 1300 510 740
62 400 580 180 270
63 120 180 55 85
65 0 0 100 160
67 0 0 0 Cl
69 0 5 0 0
71 0 0 10 15
C1 is concentrat i on in ng/m3 determined with first calibration curve.
C2 is concentration in ng/m3 determined with second calibration curve.
(concentration values have been corrJ)cted by subtracting a
background concentration of 5 ng/m3 ).

Table 74 RUN 7 (18 April 19781
Time in GMT
meas. period 1 11. []r1-11 • :FJ period 2 11.3n-12.00
point C1 C2 C1 C2
7(-J 1 r) l ??CJ 430 5flf1
n 1!C :'J(1 3c!r] Llf]:;
24 ~!5 4') 2flrJ 260
26 12'] 1 ~ll 22(1 310
27 1 fJn 1 ~~:j j 24r) 32'1
28 tlll 12[1 17[: 24i-,
29 8::) 120 150 22[-J
30 14rJ 1% 13rJ '18 (]
31 ~[1 130 4rJ :i 5
32 fi5 0fj 1 'i =:n :: 33 1401 1 r :I~
4 'in 7[,
34 1 tlC,D 1", Cl ! S ~~ 5 ~
~ 35 q/'l 1::' 'W n Cl
3G BGfl 1"5'1 rJ ~l
37 '.inci ~ ... l! :I fi " I
3B :' B CJ -1 {1:,'", n [i I 3g ~ r-, ., [1 ~
40 fJ (.) (] n
41 [] 1 0 ~ ]
42 11 J .., ~, '1
I 43 n n [] c;
45 (] [J [) " I I
47 f] (1 n ;1
I 49 rJ rJ n n
I I
I I
J
C1 is concentration in ng/m3 determined with first calibration curve.
C2 is concentration in ng/m 3 determined with second calibration curve.
(concentration values have been corrected by subtracting a
background concentration of [) ng/m 3).
-115-
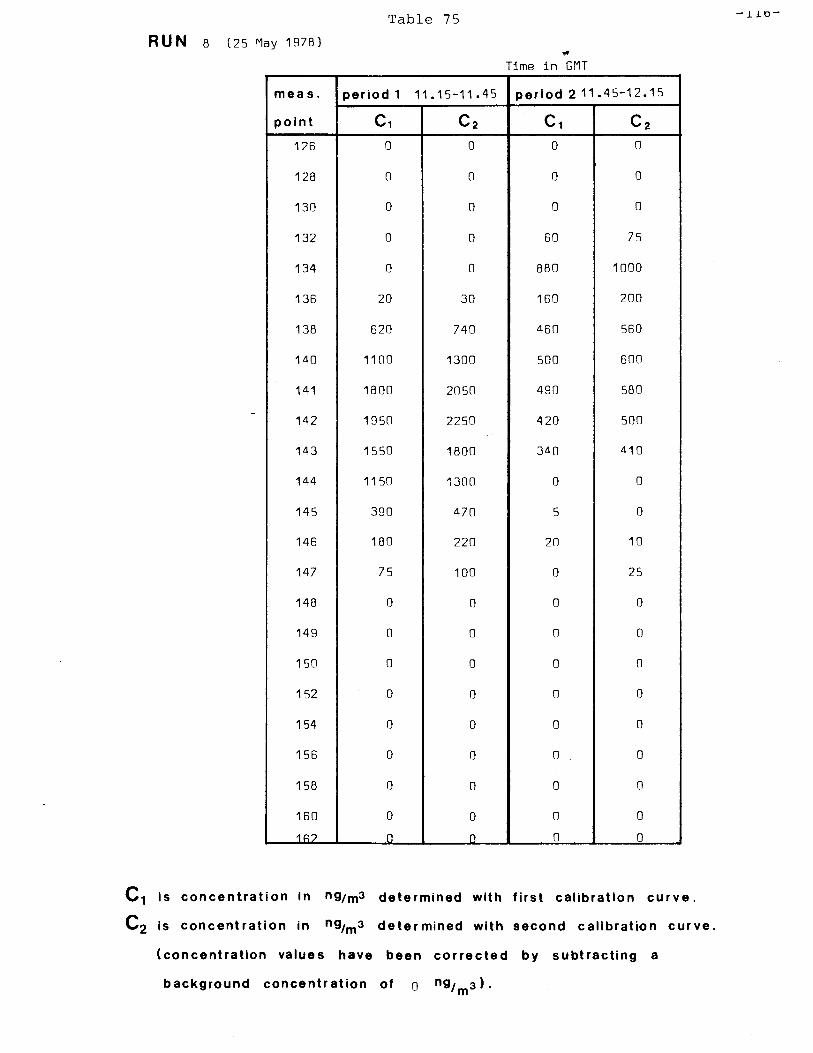
Table 75
RUN 8 (25 May 1978)
Time in GMT
meas. period 1 11.15-11.45 period 211.45-12.15
point C1 C2 C1 C2
126 0 0 0 0
128 0 0 0 0
130 0 0 0 0
132 0 0 60 75
134 0 0 880 1000
136 20 30 160 200
138 620 740 460 560
140 1100 1300 500 600
141 1800 2050 490 580
142 1950 2250 420 500
143 1550 1800 340 410
144 1150 1300 0 0
145 390 470 5 0
146 180 220 20 10
147 75 100 0 25
148 0 0 0 0
149 0 0 0 0
150 0 0 0 0
152 0 0 0 0
154 0 0 0 0
156 0 0 0 0
158 0 0 0 0
160 0 0 0 0
1R? 0 0 0 0
C1 is concentration In ng/m3 determined with first calibration curve.
C2 is concentration in ng/m 3 dete r mined with second calibration cur ve.
(concentration values have been corrected by subtracting a
background concentration of 0 ng/m 3).

Table 76 -117-
RUN 9 (13 June 1978)
-; mp ; n r;MT
meas. period 1 10.45-11.15 period 2 11.15-11.45
point C1 C2 C 1 C 2
132 0 0 0 0
134 5 5 0 0
136 5 5 10 5
138 0 0 0 0
140 - - - -
142 0 0 0 0
144 0 0 0 0
146 0 0 0 0
148 0 0 0 0
149 10 5 0 0
150 20 20 0 0
151 55 60 120 120
152 390 410 40 45
153 580 600 120 130
154 790 810 450 460
155 910 930 850 880
156 1050 1050 940 970
157 1350 1350 1050 1100
158 1450 1500 1100 1100
159 1250 1250 990 1000
161 510 520 900 920
163 230 240 450 470
165 45 45 30 35
167 0 0 0 0
C1 is concentration in n9lm3 determined with first calibration curve.
C2 is concentration in ng/m3 determined with second calibration cur ve.
(concentration values have been corrected by subtracting a
background concentration of 0 ng/m3 ).
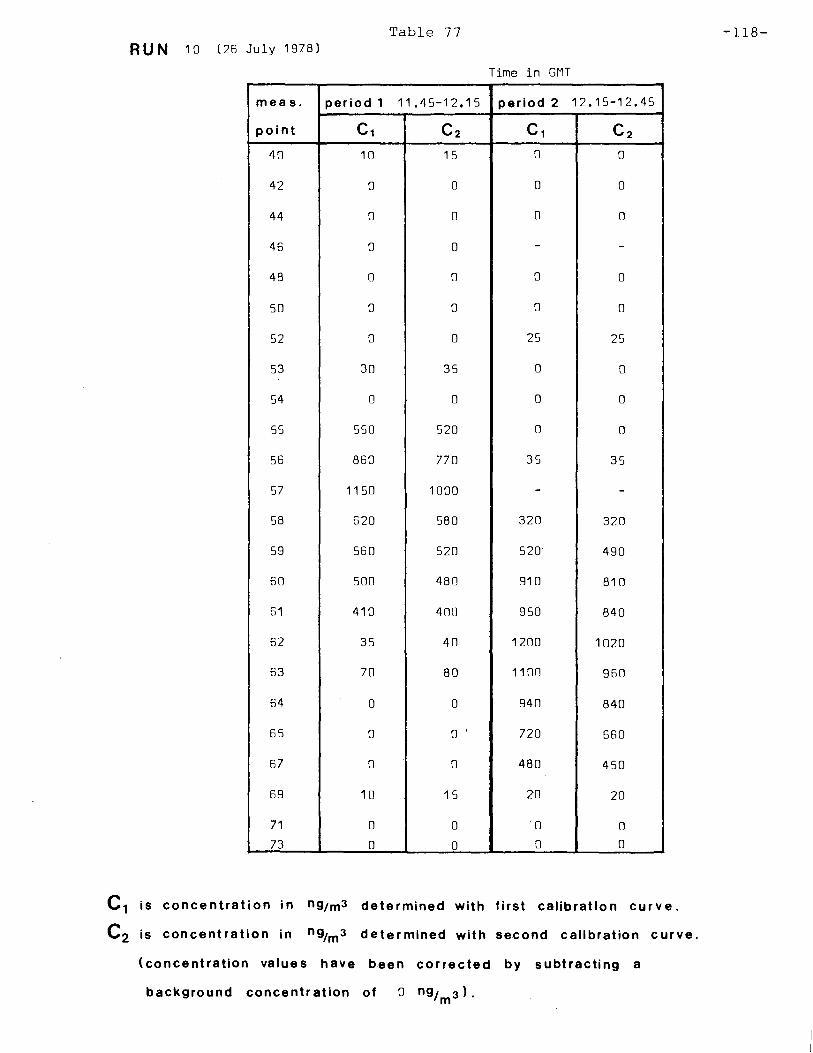
Table 77 RUN 10 (26 July 1978)
Time in GMT
meas. period 1 11.45-12.15 period 2 12.15-12.45
point C1 Cz C1 C2
40 10 15 0 0
42 0 0 0 0
44 0 0 0 0
46 0 0 - -
48 0 0 0 0
50 0 0 0 0
52 0 0 25 25
53 30 35 0 0
54 0 0 0 0
55 550 520 0 0
56 860 770 35 35
57 1150 1000 - -
58 620 580 320 320
59 560 520 520 490
60 500 480 910 810
61 410 400 950 840
62 35 40 1200 1020
63 70 80 1100 960
64 0 0 940 840
65 0 0 720 660
67 0 0 480 450
69 10 15 20 20
71 0 0 0 0
73 0 0 0 0
C1 is concentration in ng/m3 determined with first calibration curve.
C2 is concentration in ng/m 3 determined with second calibration curve.
(concentration values have been corrected by subtracting a
background concentr ation of 0 ng/m 3).
-118-

RUN 12 (16 August 1978) Table 78
-119-
Time in GMT
meas. period 1 09.30-10.00 p'eriod 2 10.00-10.30
point C1 C2 C1 C2
66 0 0 0 0
68 0 0 0 0
70 0 0 5 5
72 5 5 0 (l
74 0 5 0 0
76 0 0 - -
77 10 5 - -
78 10 10 0 0
79 45 45 0 0
80 170 180 0 0
81 100 100 0 0
82 45 45 0 10
83 70 75 0 0
84 190 190 0 0
85 540 560 0 5
86 830 850 0 n
87 750 760 0 0
88 680 700 0 0
90 9S 95 0 0
92 80 80 0 0
94 120 120 5 5
96 70 70 10 10
98 0 0 80 85
100 80 85 0 0
C1 is concentration in ng/m3 determined with fi rst calibration curve, .
C2 is concentration in ng/m3 determined with second calibration cu~ve.
(concentr,atlon values have been corrected by subtracting a
background concentration of 0 ng/m 3).

Table 79 RUN 13 (10 October 1978)
Time in GMT
meas. period 1 13.00-13.30 period 2 13.30-14.00
point C1 C2 C1 C2
2 35 30 1400 1500
4 1600 1700 1950 2050
6 3350 3500 510 530
8 1800 1900 650 680
9 350 360 2250 2350
10 140 160 3000 3100
11 5 5 1900 2000
12 5 5 290 300
13 50 50 10 10
14 65 65 20 20
15 10 10 10 10
16 15 15 5 5
17 130 130 5 5
18 25 25 15 15
19 35 35 15 15
20 35 35 60 60
22 5 5 15 15
24 0 0 15 15
26 25 25 10 10
28 15 15 0 0
30 5 5 5 5
32 5 5 5 5
34 5 5 10 10
36 10 10 5 5
C1 is concentration in ng/m3 determined with first calibration curve.
C2 is concentration in ng/m 3 determined with second calibration curve.
(concentration values have been corrected by subtracting a
background concentration of 10 ng /m3 ).
-120-
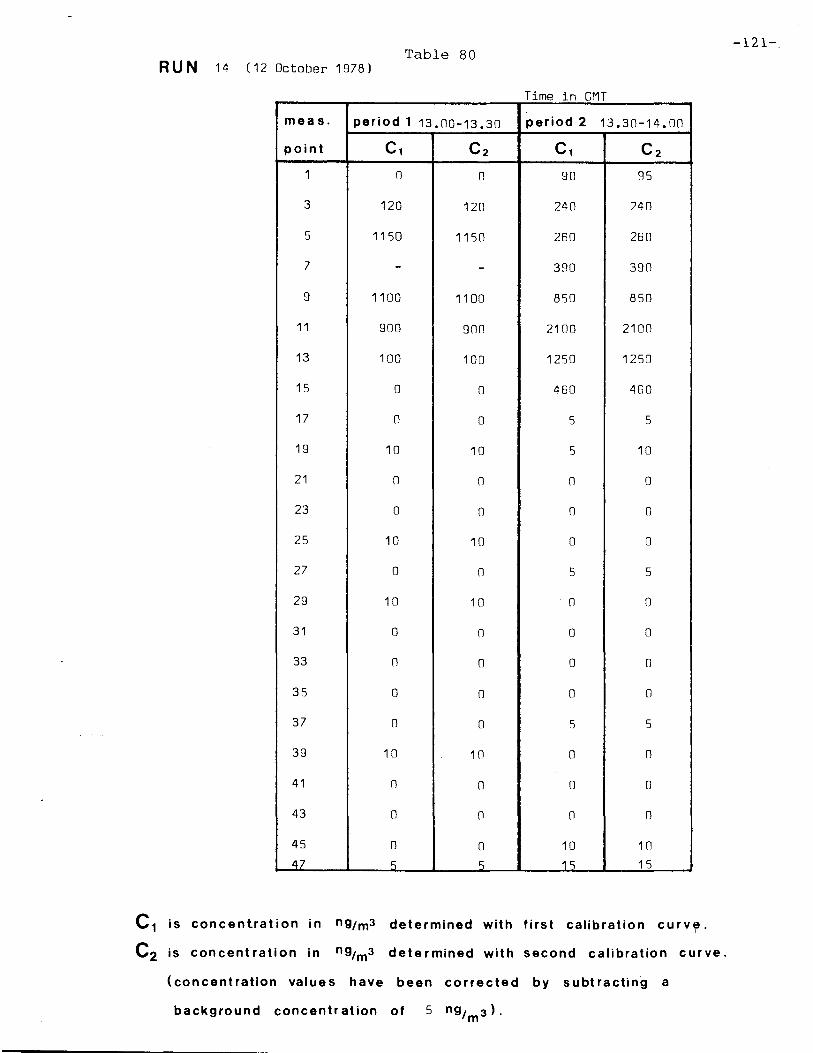
-121-. Table 80
RUN 14 (12 October 1978)
Time in GMT
meas. period 1 13.00-13.30 period 2 13.30-14.00
pOint C1 C 2 C 1 C 2
1 0 0 90 g5
3 120 120 240 240
5 1150 1150 260 260
7 - - 3g0 390
9 1100 1100 850 850
11 900 900 2100 2100
13 100 100 1250 1250
15 0 0 460 460
17 0 0 5 5
19 10 10 5 10
21 0 0 0 0
23 0 0 0 0
25 10 10 0 0
27 0 0 5 5
29 10 10 . 0 0
31 0 0 0 0
33 0 0 0 0
35 0 0 0 0
37 0 0 5 5
39 10 10 0 0
41 0 0 0 0
43 0 0 0 0
45 0 0 10 10
47 'i 5 i2 15
C1 is concentration in ng/ m3 determined with fi rs t calibration curv13·
C2 is con cent ration in ng/m 3 determined with second calibration cur ve.
(concent ration values have been corrected by s ubt racting a
background concentration of 5 ng/m 3).

Table 81
RUN 15 (31 October 1978)
Time in GMT
meas. period 1 12.30-13.00 period 2 13.00-13.30
point C1 C2 C1 C2
47 75 80 0 0
49 210 220 0 0
51 380 400 200 210
52 1250 1250 110 120
53 1750 1800 280 300
54 1750 1800 800 840
55 1650 1700 650 680
56 1200 1250 560 580
57 780 820 350 370
58 200 220 380 400
59 150 160 810 840
60 120 130 7FiO 790
61 0 0 80 90
62 20 20 10 10
63 - - 0 0
64 0 0 0 0
65 0 0 0 0
66 0 0 0 0
67 0 0 0 0
68 10 15 0 0
69 0 0 0 0
70 0 0 0 0
72 0 0 0 0
74 0 0 0 0
C1 is concentration in ng/m3 determined with first calibration curve.
C2 is concentration in ng/m3 determined with second calibration curve.
(concentration values have been corrected by subtracting a
background concentr ation of 0 n g/m3 ).
-122--

Table 82 -123-
RUN Period Cy ex. O"y
1 11.45 -12.15 1.93 151 315
12.15 -12.45 0.88 148 228
2 12.00 -12.30 0.76 192 195
12.30 - 13.00 0.51 189 238
3 12.45 -13.15 1.85 147 212
13.15 -13.45 1.44 149 188
4 13.45 -14.15 0.06 160 166
14.15 -14.45 0.12 1R2 221
5 12.00 -12.30 1.46 203 198
12.30 -13.00 1 .41 204 209
6 12.30 -13.00 0.91 187 185
13.00 -13.30 0.B7 186 206
7 11.00 -11.30 0.70 149 367
11.30 -12.00 - --- -- - - --
8 11.15 -11.45 1.09 347 210
11.45 -12.15 0.70 352 401
9 10.45 -11.15 1.19 320 330
11.15 -11.45 1.08 320 333
10 11.45 -12.15 0.39 186 178
12.15 -12.45 0.71 193 247
Cy is cross -wind integrated concent ration in mg/m2
is wind direction of the plume axis in degrees
cry is lateral dispersion coefficiet in m

Table 82 (continued) -124-
RUN Period Cy oc. cry
11 10.30 - 11.00 ---- --- ---
11.00 - 11.30 - --- -- - - --
12 09.30 - 10.00 0.45 230 376
10.00 - 10.30 - --- - -- - --
13 13.00 - 13.30 1.60 107 184
13.30 - 14.00 1 .61 105 355
14 13.00 - 13.30 1 .13 11 (l 283
13.30 - 14.00 1 .16 114 373
15 12.30 - 13.00 0.9(l 18(l 2(l2
13.00 - 13.30 (l.44 185 243
-
-
-
-
-
-
-
--
-
Cy is cross-wind integrated concent ration in mg/m2
oC. is wind direction of the plume axis in degrees
cry is lateral dispersion coefficiet in m

Table 83
Run Period X Run Period X
1 11.45-12.15 3150 9 10.45-11.15 4250
12.15-12.45 3160 11.15-11.45 4300
2 12.00-12.30 3400 10 11.45-12.15 3250
12.30-13.00 3310 12.15-12.45 3480
3 12.45-13.15 3160 11 10.30-11.00 --
13.15-13.45 3160 11.00-11.30 --
4 13.45-14.15 3200 12 09.30-10.00 3850
14.15-14.45 3230 10.00-10.30 --
5 12.00-12.30 3880 13 13.00-13.30 4310
12.30-13.00 3880 13.30-14.00 4250
6 12.30-13.00 3280 14 13.00-13.30 4200
13.00-13.30 3250 13.30-14.00 3950
7 11.00-11.30 3160 15 12.30-13.00 3110
11.30-12.00 -- 13.00-13.30 3200
8 11.15-11. 45 4100
11.45-12.15 4300
X is distance in m between mast and concentration distri
bution, measured along the plume axis.
-125-

-126-
B A
6p
o
o
Figure 23 Schematic drawing of the sampling vessel

x sampling point
Figure 24 Configurations of the source and the sampling
points. The x-axis is directed along the projection
of the plume-axis. The y-axis is perpendicular to
the x-axis. In calculations the concentration
distribution c is projected on to the y-axis.
-127-

13 References
C.J. Cats, 1977: The calculation of the geostrophic wind.
Royal Netherlands Metereological Institute,
Scientific-Report 77-2 (in Dutch) .
A.G.M. Driedonks, H. van Dop and W.H. Kohsiek, 1978:
Meteorological observations on the
213 m mast at Cabauw, in The Netherlands.
Fourth Symposium on Meteorological Observations
and Instrumentation, Denver, April 10-14,
American Meteorological Society.
H. van Duuren and F.T.M. Nieuwstadt, 1980: Dispersion
experiments from the 213 m high meteorological
mast at Cabauw in The Netherlands. Proceedings
of the 14th International Colloqium, Paris,
May 5-8. M.M. Benarie (Ed.), Studies in
Environmental Science, Volume 8, Elseviers
Scientific Publishing Company, Amsterdam.
W.A.A. Monna and A.G.M. Driedonks, 1979: Experimental data
on the dynamic properties of several propeller
vanes. J.Appl. Meteor. 18, 699-702.
F.T.M. Nieuwstadt and H. van Duuren, 1979: Dispersion
experiments with SF6 from the 213 m high
meteorological mast at Cabauw in The
Netherlands. Fourth Symposium on Turbulence
Diffusion and Air Pollution, Reno, Jan. 15~8
American Meteorological Society.
W. Slob, 1978: Errors of aspiration thermometers.
Scientific Report. Royal Netherlands
Meteorological Institute.
J. Wiering, 1972: Tilt errors and precipitation effects
in trivane measurements of turbulent fluxes
over open water. Bound. Layer Meteor. ~,
406-426.
J. Wieringa, 1976: An objective exposure correction method
for average wind speeds measured at a
sheltered location, Quart. J. Roy. Met.
Soc. 102 , 241-253.