discussion paper no. 7884
TRANSCRIPT
DI
SC
US
SI
ON
P
AP
ER
S
ER
IE
S
Forschungsinstitut zur Zukunft der ArbeitInstitute for the Study of Labor
The Impact of Fiscal and Political Decentralization on Local Public Investments in Indonesia
IZA DP No. 7884
January 2014
Krisztina Kis-KatosBambang Suharnoko Sjahrir
The Impact of Fiscal and Political Decentralization on Local Public
Investments in Indonesia
Krisztina Kis-Katos University of Freiburg
and IZA
Bambang Suharnoko Sjahrir University of Freiburg
Discussion Paper No. 7884 January 2014
IZA
P.O. Box 7240 53072 Bonn
Germany
Phone: +49-228-3894-0 Fax: +49-228-3894-180
E-mail: [email protected]
Any opinions expressed here are those of the author(s) and not those of IZA. Research published in this series may include views on policy, but the institute itself takes no institutional policy positions. The IZA research network is committed to the IZA Guiding Principles of Research Integrity. The Institute for the Study of Labor (IZA) in Bonn is a local and virtual international research center and a place of communication between science, politics and business. IZA is an independent nonprofit organization supported by Deutsche Post Foundation. The center is associated with the University of Bonn and offers a stimulating research environment through its international network, workshops and conferences, data service, project support, research visits and doctoral program. IZA engages in (i) original and internationally competitive research in all fields of labor economics, (ii) development of policy concepts, and (iii) dissemination of research results and concepts to the interested public. IZA Discussion Papers often represent preliminary work and are circulated to encourage discussion. Citation of such a paper should account for its provisional character. A revised version may be available directly from the author.
IZA Discussion Paper No. 7884 January 2014
ABSTRACT
The Impact of Fiscal and Political Decentralization on Local Public Investments in Indonesia*
We investigate the effects of the Indonesian decentralization and democratization process on budget allocation at the sub-national level. Based on panel data for 271 Indonesian districts for the years of 1994 to 2009, we address the determinants of local investment expenditures in public infrastructure in the sectors of education, health, and physical infrastructure. We find that after the dramatic expenditure decentralization of 2001, districts with relatively lower levels of public infrastructure started to invest more in these sectors. In contrast to the marked budgeting changes following fiscal and administrative decentralization, we find no consistent effects of the democratization process on local public investments. Our results reflect initial improvements in local targeting but show no evidence of increasing electoral accountability. JEL Classification: H72, H75 Keywords: decentralization, democratic elections, budget allocation, Indonesia Corresponding author: Krisztina Kis-Katos University of Freiburg Department of International Economic Policy Platz der Alten Synagoge 1 79085 Freiburg Germany E-mail: [email protected]
* This research has been supported by the German Federal Ministry of Education and Research under the grant no. 01UC0906. We would like to thank Christian von Lübke for sharing the data on the timing of direct elections and the World Bank team in Jakarta for help with the data and helpful discussions. We are also grateful to Raul Caruso, Günther G. Schulze, Thomas Stratmann, and the participants at seminars at the University of Freiburg, the Decentralization and Democratization in Southeast Asia Conference at the University of Freiburg (2011), the Conference in Public Economics at the University of Marseilles (2011), the AEL Conference in Berlin (2011), the World Meeting of Public Choice Societies in Miami (2012), the conference of Contemporary Issues in Southeast Asia in Oxford (2012), and the Silvaplana Workshop on Political Economy in Pontresina (2013) for helpful comments and discussions. All remaining errors are ours.

2
1 Introduction
Decentralization has played a major role on the agenda for institutional reform throughout the
world (World Bank 2003a). Internal and external pressures forced many developing countries
to increase the administrative, fiscal, and political powers granted to the lower tiers of the
government. To understand how these changes affected local public finances is of crucial policy
importance. Indonesia’s decentralization and democratization of the last decade offers a large-
scale natural experiment to study the interactions between various forms of decentralization
and their effects on local public finance outcomes. The Indonesian decentralization process has
led to an extensive devolution of fiscal expenditure and administrative powers to local
governments, while the introduction of democratic and later direct elections aimed at increasing
electoral accountability at the local level. All these changes were introduced with the aim of
improving local public policies; the goal of this paper is to disentangle their effects on the
relationship between local public investment expenditures and the existing coverage of local
public infrastructure.
The overall effects of decentralization on public service delivery are theoretically ambiguous.
Inter-jurisdictional competition for attracting mobile citizens should result in higher
responsiveness to local needs (Tiebout 1956), although mobility in developing countries might
not be high enough for this effect to dominate (Bardhan 2002). Informational advantages on the
side of local governments (Hayek 1948) are also expected to improve the allocative efficiency of
public expenditures. These benefits increase with regional heterogeneity of preferences and
decrease with spillovers in public goods provision across regions (Oates1972 and Besley and
Coate 2003). However, decentralization in developing countries can also bring disadvantages:
when the mechanisms of local accountability are relatively weak, local elites can capture the
process of public service delivery and disfavour the poor (Bardhan and Mookherjee 2005,
2006a). Improvements in electoral accountability are thus an important prerequisite for
efficient local public goods provision (Seabright 1996).
The existing empirical evidence shows that fiscal and administrative decentralization can indeed
lead to improved public service delivery. Faguet (2004) documents that in Bolivia,
decentralization empowered especially the smaller and poorer districts, which resulted in a
higher overall responsiveness to local needs and a shift of public expenditures towards
education, health, and sanitation. Solé-Ollé and Esteller-Moré (2005) find that after
decentralization, Spanish provinces’ investment expenditures on roads and education became
more responsive to changes in output, users, and costs. Several other studies show local
outcomes improving with the degree of fiscal decentralization. Barankay and Lockwood (2007)
3
find that in Switzerland, education outcomes improve with the increasing share of education
expenditures by local counties relative to the Swiss cantons. Cross-country analyses also show
various outcomes to be improving with fiscal decentralization (see e.g., Robalino et al. 2001,
Khalegian 2004, and Jiménez-Rubio 2011 for health or Fisman and Gatti 2002 and de Mello and
Barenstein 2001 for corruption). Informational advantages seem to play a key role in the success
of decentralization. For instance, localities are found to be considerably better at targeting anti-
poverty programs than the central government (see Alderman 2002 for Albania and Galasso and
Ravallion 2005 for the Food-for-Education Program in Bangladesh), or, at least, to be able to
achieve higher local satisfaction (Alatas et al. 2012).1
However, there is also a growing body of evidence on deficiencies of accountability in
decentralized settings. Empirical evidence documents a serious extent of elite capture (Reinikka
and Svensson 2004) as well as missing benefits from decentralization to the very poor (e.g.,
Bardhan and Mookherjee 2006b and Galiani, Gertler, and Schargrodsky 2008).2 Experimental
evidence shows that in Indonesia, top-down monitoring has had a larger impact on curbing
corruption than local monitoring, which was subject to local elite capture (Olken 2007).3 In
China, newly elected village heads in China tend to provide more public services relative to the
appointed cadres (Zhang et al 2004). In India, political geography and politicians’ identity
affected the distribution of public goods (Besley et al 2004). As for political decentralization, the
cross-country analysis by Enikolopov and Zhuravskaya (2007) argue that the presence of strong
national political parties can mitigate local capture by acting as a disciplining device for local
politicians.
Indonesia provides a unique opportunity to compare the effects of fiscal and political
decentralization on local expenditures in a developing country. Its fiscal and administrative
decentralization took place in 2001 in a “big bang” fashion, dramatically increasing the
expenditure powers of the then 299 districts while leaving most revenue sources centralized.4 In
a parallel process, districts also gained considerable political powers. In 1999, local parliaments
1 However, targeting inequalities can arise if not only expenditure but also revenue decentralization takes place (Ravallion, 2007). 2This stays in strong contrast with the policy expectations of large benefits from decentralization for the poorest (World Bank 2003a). 3Further experimental results show that the effects of local public monitoring on public service delivery are strongly context-specific: Björkmann and Svensson (2009) document large improvements in monitoring of health care services in Uganda after a NGO campaign, while Banerjee et al. (2010) find no improvements through beneficiary monitoring in the educational sector in India. 4 Among developing countries, asymmetric fiscal decentralization is fairly common. Countries opt for a considerably stronger decentralization of expenditures than of revenues partly because of a low tax base and the relatively lower importance of taxes in total government revenues (Gadenne and Singhal 2013).
4
were formed in democratic elections for the first time: they became the new local legislative
units and gradually started to elect the new heads of the local executive. In an attempt to further
increase electoral control over the local governments, a further electoral reform introduced
direct elections of the district heads in 2004.
The effects of Indonesia’s fiscal decentralization and democratization processes can be
distinguished from each other due to differences in their timing. Although the effects of the “big-
bang” of fiscal and administrative decentralization of 2001 cannot be cleanly disentangled from
a common time effect, the dramatic change in fiscal and administrative procedures makes it very
likely that our analysis captures the decentralization effect itself instead that of further
confounding factors. By contrast, the timing of the local democratization process was
determined in a quasi-random way as all district heads were allowed to serve their full term
before changes in procedures could take place. The shifts to democratically and later to directly
elected heads of local executive happened in an idiosyncratic way, and thus their effects on
budgeting outcomes can be directly identified.
Indonesia’s large size and vast economic and social diversity result in a large variation in public
infrastructure and investment levels across the districts. We base our analysis on a unique
dataset that contains consistent time series for 15 years of public investment expenditures by
271 Indonesian districts in three major sectors: education, health, and infrastructure. We explain
the evolution of these investment expenditures by panel models including district and time fixed
effects while also controlling for public infrastructure coverage in the previous period, district
revenues, district GDP, and urbanization. Our central explanatory variables consist of indicators
for decentralization and the democratic and later direct elections of the district heads. We
measure the effects of decentralization through an average decentralization effect but also
through the fiscal channel of increased district revenues and compare the effects of
decentralization with those of democratization and direct elections.
From a theoretical perspective, the effects of fiscal and political decentralization on budgeting
outcomes are a priori unclear. If inter-jurisdictional competition and electoral considerations
make local governments more responsive to local constituencies, districts that have a
considerably lower coverage of public infrastructure than others should increase their
investments in local public infrastructure once granted spending powers. Moreover, if
democratically elected local governors are more strongly constrained by electoral
accountability, we expect this convergence effect to become stronger with the democratization
process. If, however, electoral accountability mechanisms are dysfunctional, local elite capture
can limit the convergence across districts. In order to test for whether districts with relatively
lower levels of public infrastructure invested ceteris paribus more in infrastructure after
5
decentralization and/or democratization, we focus on the interaction between indicators for the
decentralization and democratization process and the lagged level of public infrastructure
coverage.
Our main findings document that after expenditure decentralization, local governments indeed
became more responsive to lower levels of local public infrastructure. Local public expenditures
in all three sectors increased due to increasing local fiscal size (expenditure decentralization)
and this effect was larger than what can be explained by the fiscal revenue effect only. More
importantly, investment expenditures increased in all three sectors by more in those districts
where the level of public infrastructure was originally lower. By contrast, we do not find
comparably strong effects of the democratization process. Neither democratic nor direct
elections of local heads led to consistent increases of public infrastructure investments in
districts with lower coverage levels. If anything, there is some evidence for a reversal of the
favourable decentralization effect with the progression of the democratization process. Directly
elected heads invested less in the healthcare infrastructure in districts with relatively worse
public healthcare coverage rates.
By using both pre- and post-decentralization data, our study is the first to compare the effects of
fiscal and political decentralization on local public finance decisions in a developing country.
Existing empirical evidence on decentralization and service delivery in Indonesia focuses on the
governments’ fiscal behaviour in the aftermath of fiscal decentralization. Lewis (2005) finds
local government spending to be correlated with local poverty levels. Kruse et al. (2012)
document that health spending at the local level is mostly driven by the size of the central
government’s transfers and increases the overall utilization of public health care facilities.
Skoufias et al. (2011) compare districts around the first direct elections (pre-2005 and in 2006)
and document larger increases in expenditures in districts with directly elected heads. At the
same time, they do not find these increases to be robustly related to local needs. Burgess et al.
(2011) show the presence of a strong local electoral cycle in illegal logging. Moreover, direct
elections have also resulted in an electoral cycle in unspecified—and hence unaccounted for—
administrative expenditures (Sjahrir et al 2013a) as well as in an increased local occurrence of
corruption cases (Valsecchi 2013).5 There is also evidence for local autonomy affecting the
investment climate as local governments tend to misuse business licenses and permits (Kuncoro
2006 and Henderson and Kuncoro 2010). Our paper complements this body of evidence on the
5 Moreover, Sjahrir et al (2013b) document that administrative (over-)spending by districts in the aftermath of decentralization is related to the strength of local concentration of political power.
6
negative effects of the local democratization process in Indonesia by contrasting these with the
potentially more favourable effects of fiscal decentralization.
The remainder of this paper is organized as follows. Section 2 outlines the decentralization
process in Indonesia, section 3 describes data sources, and section 4 presents and discusses the
applied empirical approach. Section 5 presents the results and discusses robustness issues.
Section 6 concludes.
2 Decentralization in Indonesia
Decentralization in Indonesia was triggered by the democracy movement and long suppressed
dissatisfaction with the centralized government. After being severely hit by the 1997 economic
crisis, Indonesians called for democracy and forced president Soeharto to step down and end his
33 years old authoritarian “New Order” regime. The country faced serious threats of
disintegration from regions with a history of armed conflict, such as Aceh and East Timor, and
from natural resource rich regions, such as Papua. These regions had long been suppressing
dissatisfaction with the centralistic government and unequal distribution of power and wealth.
The first democratic elections in 1999 marked the beginning of the new era. The caretaker
government, led by Habibie, conducted more open general elections in June 1999, which
involved 48 political parties as opposed to only three parties under the ‘New Order’ regime. The
opposition party (PDIP at that time) won the elections with almost 34% of the votes,6 but
Suharto’s political party (Golkar) was still strong and came second.7 This new election changed
the composition not only of the national but also of the local parliaments. The decentralization
process progressed rapidly. The parliament approved the decentralization laws in May 1999
(law 22/1999 on regional autonomy and law 25/1999 on intergovernmental fiscal relations). In
2001, the central government transferred 67% of its 3.9 million civil servants, some government
assets, and documentation to the regions (World Bank 2003b). The new intergovernmental
fiscal scheme resulted in a doubling of the central government transfers to the regions as
compared to 1999 (World Bank 2007). Indonesia decentralized in several dimensions–political,
fiscal, and administrative–simultaneously.
Administrative decentralization involved the granting of autonomy to two levels of the
government: to provinces and Kabupaten and Kota (districts and cities, for simplicity referred to
6 Source: Homepage of General Election Commission (KPU). http://www.kpu.go.id. 7 This was due to Indonesia’s special democratic transition, which accommodated all major political players instead of distancing the new democratic regime from the old ‘New Order’ (Aspinall 2010).
7
as districts or local governments). Only the governmental functions of defence, security, justice,
foreign affairs, fiscal affairs, and religion remained in the hands of the central government.
Provinces were set to coordinate and perform the functions affecting more than one local
government. All other functions became the responsibility of local governments. The two levels
of autonomous government have no hierarchic relationship, but provincial governors acted as
the central government’s representatives in the region. Administrative decentralization
increased the number of local governments by almost 40%, from 26 provinces and 292 local
governments in 1999 to 33 provinces and 451 local governments in 2008.8 Some of these newly
created local governments lacked human resources and infrastructure to deliver public services
(Decentralization Support Facility 2007). The splitting of districts followed fiscal incentives,
natural resource endowments, geographic dispersion, and political and ethnic diversity (Fitrani
et al 2004). In October 2004, Indonesia redesigned its decentralization by issuing the revised
versions of the decentralization laws (Law 32/2004 on regional autonomy and Law 33/2004 on
intergovernmental fiscal relations). These introduced local direct elections to strengthen local
accountability while also giving provinces supervisory powers (instead of powers of
coordination) and strengthening their role as representatives of the central government,
particularly in the area of planning and budgeting.
Political decentralization took place in two distinct steps. Law 22/1999 gave autonomy to the
newly democratically elected local parliaments (Dewan Perwakilan Rakyat Daerah/DPRD) to
elect the heads of local governments. However, local parliaments still needed to work with the
heads of local governments from the ‘New Order’ regime until the latters’ mandated five-year
term ended. Thus, at the end of their tenure, the heads of local governments were gradually
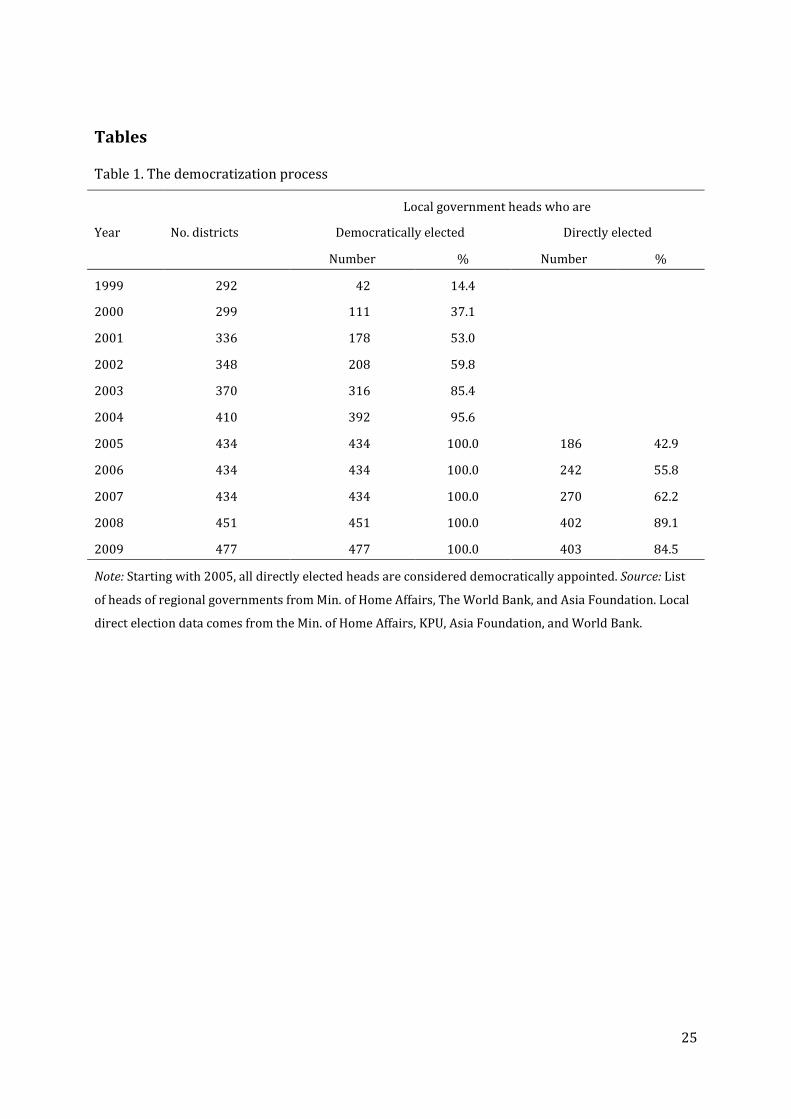
substituted by those elected by the members of the local parliaments (cf. Table 1): in 178
districts, the heads of local governments were already democratically elected by the new local
parliaments before the administrative and fiscal decentralization took place in 2001, while by
the end of 2004, almost all local governments were headed by democratically elected leaders.
The second step of political decentralization introduced direct elections of regional government
heads and DPRD members and abolished reservations for the military. Direct elections of the
heads of regional governments were once again implemented only gradually as the central
government allowed the incumbents to finish their term.9 The first local direct elections
8 Numbers are based on General Allocation Grant (DAU) data published by the Ministry of Finance. 9 By law, the head of the local government could only serve for two consecutive periods. Those who were serving their second term already were not allowed to enter local direct elections (Hofman and Kaiser 2006 and Schiller 2009).
8
(Pemilihan Langsung Kepala Daerah/Pilkada) were conducted in the second half of 2005; by the
end of 2009, more than 80% of the local governments already held direct elections. The timing
of office entry for both the democratically elected and the directly elected local government
heads was purely based on the tenure of the incumbent, which was path-dependent and
historically predetermined. This allows us to consider variations in the timing of the
democratically and later directly elected local heads of governments as exogenous and to use
them to identify the effects of the democratization process on the responsiveness of public
expenditures to local infrastructure coverage.
Administrative and fiscal decentralization in Indonesia transferred resources and
responsibilities for basic services directly to the level of local governments. Fiscal
decentralization resulted in a new system of intergovernmental fiscal relations, mostly affecting
the expenditure side. By 2007, the regional governments managed 36% of total government
expenditures but only 10% of total government revenues; most taxes were still set and
administered by the central government (World Bank 2007). Prior to decentralization, all
provincial and local expenditures were earmarked and administered through the ministries’
offices at the provincial and local government level. The main revenue sources included the
Subsidy for Autonomous Regions (Subsidi Daerah Otonom/SDO), which was earmarked for
salaries and recurrent expenditures, and the Presidential Instruction Fund (Dana Inpres), which
was earmarked for development projects (World Bank 2003b). Since fiscal decentralization,
regions have received central government transfers to secure the provision of basic public
services. In contrast to the pre-decentralization period, a large part of these transfers (shared
tax and natural resource revenues and payments from the General Allocation Grants, Dana
Alokasi Umum/DAU) is not earmarked and can be freely allocated by the regions. Additionally,
regions also receive earmarked revenues in form of the Special Allocation Grant (Dana Alokasi
Khusus/DAK).10
After decentralization, large parts of the three sectors included in our analysis (education,
health, and infrastructure) became the sole responsibility of the local governments. Local
governments are responsible for the first nine years of education, which include six years of
primary and three years of junior secondary education.11 Although the division of roles and
10 The resource rich provinces of Nanggroe Aceh Darusalam (NAD) and Papua also receive payments from a Special Autonomy Fund. In addition, Papua receives a higher share of the shared revenues from natural resources (World Bank 2007). 11In principle, local governments are also responsible for senior secondary education, but in practice, senior secondary schools are usually funded by the provinces. For discussions on the funding

9
responsibilities is not entirely clear, local governments also became responsible for the majority
of primary healthcare services, their financing, and human resources (World Bank 2008a). The
primary providers of community health services, the health clinics (Puskesmas), became
financed exclusively by the local governments. The responsibility for roads, transportation, and
water services was also transferred to the local governments. As for the network of national,
provincial, and district roads, the local governments became responsible for the latter. They are
now also responsible for the water services and own the local water supply utilities (World Bank
2007) but are not responsible for the electricity sector.
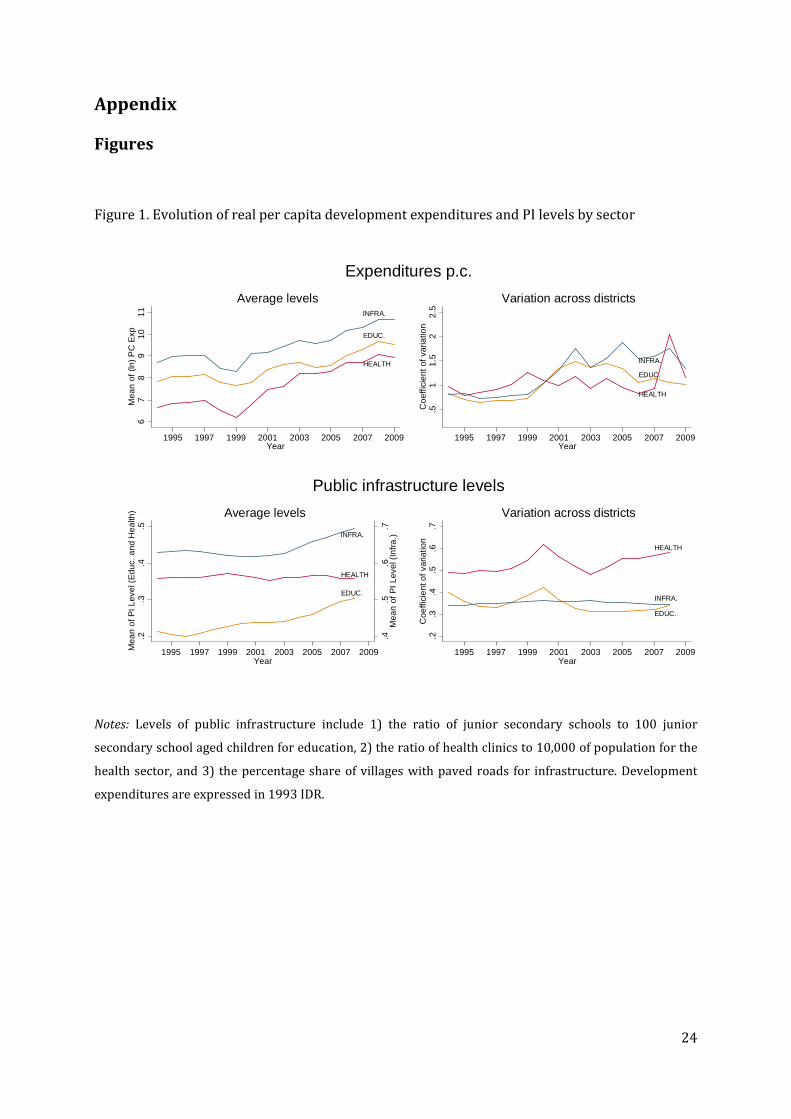
Real per capita development expenditures by the local governments have been fairly constant
before decentralization, with a crisis-related decrease in 1998 and 1999 (Figure 1, upper panel).
Since then, development expenditures have been steadily rising, which shows a substantial
increase in the fiscal scope at the local level. The increases were largest in health development
expenditures, which started from relatively low levels as compared to education and
infrastructure. After decentralization, the variation in investment expenditures also increased
somewhat across districts, although to a sectorally varying degree.
At the same time, service coverage in education, health, and physical infrastructure also
improved (cf. Figure 1, lower panel). While primary school attendance has been almost universal
in Indonesia for the last decade, the gaps in junior secondary school enrolment rates are still
considerable. This is partly because of lack in physical infrastructure. In 1999, there was only
one junior secondary school for about 400 children aged 13 to 15 years. This improved over
time, in 2008, one school was available for about 300 children. The share of villages with paved
roads also increased (from 64 to 69% from 1999 to 2008), while the average number of health
clinics per 10,000 of population stayed relatively constant over the same time period. The
variation across local governments in public service coverage levels is also large. Some local
governments have one school for less than 150 junior secondary aged children, while others
have only one school for almost 1000 children. In many cities in Java and Sumatra, virtually all
roads are paved, while rural local governments in e.g., central Kalimantan have less than 6% of
their roads paved.
arrangements between the provincial and local governments see World Bank (2005, 2008b, 2008c) and Australia-Nusa Tenggara Assistance for Regional Autonomy (2009).
10
3 Data
Our panel dataset includes 271 Indonesian local governments from 1994 to 2009. From the
original 292 local governments, we exclude those located in Aceh and Papua due to missing data
and also opt for excluding the structurally strongly different national capital Jakarta. The period
of observation is restricted by data availability, especially by the availability of local budget data,
but contains a uniquely long series of observations of 16 years, spanning both the years before
and after decentralization (7 years before and 9 years after). Missing fiscal data due to
incomplete or delayed reporting (or missing further controls) restricts our sample to 3707
observations, resulting in an average of 13.7 years of observation per district.
After decentralization, the number of local governments increased considerably due to district
splits and the proliferation of new local governments. In order to ensure comparability of budget
figures over time, we treat the newly formed districts together with their origin districts: We
combine their fiscal and socio-economic data to fit the original frame of observation and include
an indicator for district splits as a further control in all regressions. We investigate the
sensitivity of our results to districts splits in section 5.2.
Our dependent variables are given by per capita sectoral development expenditures (see Table 2
for descriptive statistics), which capture fiscal resources spent on investments in public
infrastructure. The three sectors, education, health, and physical infrastructure, play a major
role in local expenditures: they constituted more than half of the local government development
budgets in 2009. The main source of the local government budget data is the Regional Financial
Information System (Sistem Informasi Keuangan Daerah/SIKD) of the Ministry of Finance.12 This
database allows us to access both expenditure and revenue data, however, fiscal years have to be
adjusted in order to make the pre and post decentralization budget comparable. We focus on
development expenditures since this is the only budgeting category that can be consistently
traced back across changing budgeting rules. To map and match the different budget rules we
follow the mapping procedure developed by the World Bank (2005, 2007,2009).
To capture the available stock of public infrastructure, we focus on outcomes that became
unambiguously the responsibility of the districts under the decentralized regime. In the
education sector, we measure the stock of junior secondary schools since it is still dynamically
evolving, whereas primary education is almost universal in Indonesia.13 We measure public
educational infrastructure by the density of junior secondary schools per 100 of junior
12 See http://www.djpk.depkeu.go.id. 13 The large increases in primary school attendance were partly due to large-scale school construction programs that took place in the mid-eighties (Duflo 2001).
11
secondary school aged children (13 to 15 years). After decentralization, local governments
became responsible for the first nine years of education, and the investment expenditures on
junior secondary schools are the second largest item after the expenditures on primary
education (World Bank 2007). Public infrastructure in the health sector is measured by the ratio
of health clinics (Puskesmas) to 10,000 of population. These clinics provide a wider array of
primary health services than other health care centres and are exclusively financed by the
districts.14 The share of villages with paved roads is used as an indicator of the level of physical
infrastructure in the district. Overlaps with national or provincial road investments are
relatively smaller for this indicator since village roads are part of the districts’ own road
network. For a better comparability across sectors, we standardize the infrastructure indicators
to have mean zero and a standard deviation of one across all observations. The three public
infrastructure indicators come from the Indonesian Central Bureau of Statistics (Badan Pusat
Statistik/BPS) and combine data from various waves of the village census (Podes 1993, 1996,
1999, 2002, 2005, 2008) and the yearly national household surveys (Susenas 1993-2009).
The indicator for decentralization takes one for all the years following 2001. The indicator for
the democratization process takes one if the head of the local government was appointed by the
democratically elected local parliament. We identify the appointment date and tenure of local
government heads based on a list of local government heads from the Ministry of Home Affairs.
Those who entered office after the first democratic elections in June 1999 are considered as
democratically elected. The indicator for directly elected heads takes one if the head was directly
elected in a local direct election (Pilkada) starting in 2005. Data on local direct elections comes
from various sources that include the General Election Commission (KPU), the Pilkada desk at
the Ministry of Home Affairs, the Asia Foundation, and the World Bank as well as from direct
internet search. If the appointment or the elections took place in the last quarter of a year, the
indicators for both the democratically and the directly elected head take one only in the
following year. This better reflects the reality of budgeting procedures because the elected head
can only revise the on-going budget before the last quarter of each year. For splitting districts,
the democratic and direct election indicators take one when at least the original district part
(the “mother district”) has a democratically/directly elected head.15
14 Health clinics offer a better proxy of health infrastructure than the integrated health service points (Posyandu) because the latter often do not rely on a fixed infrastructure, while the maintenance of hospitals is shared with the province. 15 Our results are not sensitive to this merging procedure. We get qualitatively the same results if we define democratic and direct elections as both splitting districts having a democratically/directly elected head or if we run the regressions on the sample of non-splitting districts only (cf. section 5.2).
12
Data on district revenues and sectoral provincial expenditures comes from the Regional
Financial Information System (SIKD) of the Ministry of Finance.16 Information on splitting
districts was derived from the list of districts that receive capitation grants (DAU) each year and
from the laws that created them. We treat new districts as autonomous when they receive
separate fiscal transfers from the central government. We use the DAU list to identify the
number of districts for each year and the laws to identify their origin. Urbanization rates and the
real gross regional domestic product come from the Central Bureau of Statistics (BPS).
4 Empirical approach
4.1 Estimation models
We measure the effects of decentralization on the expenditure structure by estimating the
determinants of per capita local expenditures in the sectors of education, health, and
infrastructure. The three sectoral regressions (𝑠 = 𝐸,𝐻, 𝐼) take the following form:
𝐸𝑋𝑃𝑖𝑡𝑠 = 𝛽0𝑠𝑃𝐼𝑖𝑡−1𝑠 + 𝛽1𝑠𝐷𝐸𝐶𝑖𝑡𝑠 + 𝛽2𝑠𝑅𝐸𝑉𝑖𝑡𝑠 + 𝑋𝑖𝑡𝑠′𝛿𝑠 + 𝜇𝑡𝑠 + 𝜆𝑖𝑠 + 𝜀𝑖𝑡𝑠 (1)
The dependent variables 𝐸𝑋𝑃𝑖𝑡𝑠 stand for the natural logarithm of the per capita annual
development expenditures of the local government i in year t in sector s. They measure
expenditures on extending the public infrastructure in education, health, and transportation and
irrigation. We estimate (1) with fixed effect panel data models that factor out the time-constant
district-specific differences in the average size of expenditures 𝜆𝑖𝑠. All regressions include a set of
time fixed effects 𝜇𝑡𝑠 that control for common macroeconomic and policy shocks. We drop one
time effect as the average fiscal decentralization effect is measured over the last nine years. As
sectoral fiscal decisions are interrelated and underlie the same overall budget constraint, we
allow for a contemporaneous correlation between the error terms of the three equations
(𝜀𝑖𝑡𝐸 , 𝜀𝑖𝑡𝐻 , 𝜀𝑖𝑡𝐼 ) and estimate the three equations jointly by feasible generalized least squares (FGLS)
in a seemingly unrelated regression (SUR) framework. Clustering error terms at the district level
corrects for potential autocorrelation.
The lagged level of local public infrastructure in the given sector 𝑃𝐼𝑖𝑡−1𝑠 captures the relationship
between the local public infrastructure and development expenditures. The use of lagged levels
excludes the possibility of instantaneous feedback from investments to public infrastructure. We
are less concerned about the potential endogeneity of past public infrastructure coverage as this
16 Data on sectoral province expenditure in each district is unavailable. Therefore we allocate provincial expenditures according to district population size.

13
rather reflects the total stock of past public investments. For the education sector, 𝑃𝐼𝑖𝑡−1𝑠 is
proxied by junior secondary school density (per 100 school-aged children), for the health sector
by health clinic density (No. of Puskesmas to 10,000 of population), and for infrastructure
investments by the share of villages with paved roads.17 A negative sign for the coefficient
𝛽0𝑠 would imply that, holding everything else constant, districts with relatively lower levels of
public infrastructure coverage spend more on extending this infrastructure, which is what we
would generally expect.
The coefficient on the decentralization indicator 𝛽1𝑠 captures the average size of the increase in
expenditures after decentralization. The regressions also include the natural logarithm of the
per capita total revenues 𝑅𝐸𝑉𝑖𝑡𝑠 , which control for the intensity of fiscal devolution to the local
governments and should be relatively closely related to differences in expenditure size. The
nature of the Indonesian fiscal devolution (mainly expenditure decentralization) reduces
potential endogeneity issues whereby districts raise additional revenues in order to finance
sectoral infrastructure investments.
Further controls in vector 𝑋𝑖𝑡𝑠 include the natural logarithm of the regional GDP per capita to
proxy for differences in local wealth, urbanization rates, the natural logarithm of per capita
sectoral development expenditures of the province, and an indicator for splitting districts.
Urbanization can bring potential benefits of scale: in more urban environments, less
infrastructure investment is required in p.c. terms to reach the same level of relative coverage.
Sectoral development expenditures at the provincial level potentially capture co-financing of
projects by provinces and districts in a given sector. We minimize the importance of such
expenditure overlaps by focusing mainly on indicators that are solely under the local
government’s responsibility. Finally, changes in district boundaries increase the need for public
investments as after administrative splits, the newly formed districts might end up with missing
hospitals, schools, or roads.18
In order to measure the effects of decentralization on the responsiveness of local development
expenditures to gaps in local public infrastructure, we augment equation (1) by including
additional interactions between the lagged levels of public service coverage and our indicators
of decentralization and revenue size, thus allowing for changes in public infrastructure
coefficients and revenue elasticity after decentralization:
17 We also experimented with other conceivable measures of service coverage (secondary school enrolment rates, share of villages with access to clean water, etc.); our overall results are not sensitive to the choice of public service coverage measures. 18As noted earlier (Section 2), district splits followed mainly economic and political incentives and thus might also reflect revenue prospects of the districts.

14
𝐸𝑋𝑃𝑖𝑡𝑠 = 𝛽0𝑠𝑃𝐼𝑖𝑡−1𝑠 + 𝛽1𝑠𝐷𝐸𝐶𝑖𝑡𝑠 + 𝛽2𝑠𝑅𝐸𝑉𝑖𝑡𝑠 + 𝛾1𝑠𝑃𝐼𝑖𝑡−1𝑠 × 𝐷𝐸𝐶𝑖𝑡 + 𝛾2𝑠𝑅𝐸𝑉𝑖𝑡 × 𝐷𝐸𝐶𝑖𝑡 +
𝑋𝑖𝑡𝑠′𝛿𝑠 + 𝜇𝑡𝑠 + 𝜆𝑖𝑠 + 𝜀𝑖𝑡𝑠
(2)
Our main coefficient of interest is 𝛾1𝑠, which shows by how much the responsiveness of
investments to levels in public infrastructure coverage in a given sector changed after
decentralization. A negative 𝛾1𝑠 would imply that after decentralization, local governments
increased development expenditures by more in places with lower coverage of local public
service infrastructure. This is the coefficient that Faguet (2004) interprets as depicting
“responsiveness to local needs”. The coefficient 𝛾2𝑠 captures changes in revenue elasticity of
infrastructure expenditures after decentralization.
In a similar procedure to equation (2), further models investigate the effects of the
democratization process by including interactions between the first democratically and later
directly elected heads of the local government, 𝐷𝐸𝑀𝑖𝑡 and 𝐷𝐼𝑅𝑖𝑡 , and local public infrastructure
coverage, 𝑃𝐼𝑖𝑡−1𝑠 :
𝐸𝑋𝑃𝑖𝑡𝑠 = 𝛽0𝑠𝑃𝐼𝑖𝑡−1𝑠 + 𝛽1𝑠𝐷𝐸𝐶𝑖𝑡𝑠 + 𝛽2𝑠𝑅𝐸𝑉𝑖𝑡𝑠 + 𝛾1𝑠𝑃𝐼𝑖𝑡−1𝑠 × 𝐷𝐸𝐶𝑖𝑡 + 𝛾2𝑠𝑅𝐸𝑉𝑖𝑡 × 𝐷𝐸𝐶𝑖𝑡 +
𝛽3𝑠𝐷𝐸𝑀𝑖𝑡𝑠 + 𝛽4𝑠𝐷𝐼𝑅𝑖𝑡𝑠 + 𝛾3𝑠𝑃𝐼𝑖𝑡−1𝑠 × 𝐷𝐸𝑀𝑖𝑡 + 𝛾4𝑠𝑃𝐼𝑖𝑡−1𝑠 × 𝐷𝐼𝑅𝑖𝑡 +
𝑋𝑖𝑡𝑠′𝛿𝑠 + 𝜇𝑡𝑠 + 𝜆𝑖𝑠 + 𝜀𝑖𝑡𝑠 .
(2)
Once again, negative coefficients on the interaction terms 𝛾3𝑠 and 𝛾4𝑠 would imply increases in
public investments in districts with relatively lower public infrastructure coverage. A
comparison of interaction coefficients with expenditure decentralization and the
democratization process shows whether investment expenditures are more strongly affected by
changes in budgeting rules or by the gradual introduction of democratic procedures and
increasing electoral incentives for the local leaders.
4.2 Mechanisms and issues of identification
Theoretically, the various decentralization measures can be expected to capture different
mechanisms. For given revenue size, the interaction of the indicator for fiscal and administrative
decentralization with lagged public service coverage captures potential improvements in the
sectoral targeting of development expenditures, which might be due to informational
advantages at the local level, increasing inter-jurisdictional competition, or stronger electoral
incentives to cater to the needs of the local population. By contrast, our democratization
indicators measure the effects of decreasing central control on political careers of the local
government heads and the added effects of the new electoral procedures on the selection of
political candidates. This democratization effect could result both in a convergence of local

15
public infrastructure expenditures but also in local elite capture of the not yet fully developed
electoral process. Furthermore, the effects of democratic and direct elections might also differ as
direct elections were intended to increase the direct accountability of the local heads of
governments to their constituencies as opposed to their parties. From a theoretical perspective,
the relative importance of democratic and direct elections once again depends on the strength of
the disciplining power of the party (in democratic elections) as compared to the disciplining
power of the electorate (in direct elections).
The main challenge of identifying the effect of decentralization lies in the nature of the
decentralization process. As fiscal and administrative decentralization was introduced in 2001
as a “big-bang” policy change, our main decentralization measure, 𝐷𝐸𝐶𝑖𝑡 , does not vary across
local units and becomes an indicator for a structural break, 𝐷𝐸𝐶𝑡. This poses a clear challenge for
identification as the effects of decentralization cannot be disentangled from a pure average time
effect. However, since decentralization brought a very dramatic change to local fiscal and
administrative procedures, it constituted the largest and main policy change over the last two
decades in Indonesian regions and regional fiscal policies. It is thus very unlikely that the
average decentralization effect would be picking up the effects of other macro-economic shocks
or additional institutional changes taking place in 2001. The only other major macro-economic
shock over the analyzed time period that surely affected regional budgets is the monetary crisis
of 1997/1998. Although controlling for revenues captures changes in the fiscal scope of local
governments during the crisis, local investment decisions during the crisis might have changed
beyond the revenue effects. We address this issue by investigating the sensitivity of our results
to more specific controls for the crisis year effects in section 5.2.
In contrast to the average decentralization effect, our measures of the local democratization
process, 𝐷𝐸𝑀𝑖𝑡 and 𝐷𝐼𝑅𝑖𝑡 , are well identified through the quasi-random variation in the timing
of the first democratically elected and later directly elected local government heads (cf. Section
2). As the timing of democratic and later direct elections resulted from applying the term limit
rules to local government heads already in office, these capture idiosyncratic changes in the
municipalities’ political environment, the expenditure effects of which can thus be directly
measured. The first democratic elections of district heads by the local parliament occurred
around the same time as decentralization (between 1999 and 2004), whereas directly elected
district heads took office starting in 2005. The first democratization wave thus partially
coincides with the big-bang fiscal decentralization, whereas changes due to direct elections
started to materialize several years after fiscal decentralization.
A comparison between the decentralization effect and the effects of the somewhat slower
democratization process shows whether the changes in local public investments were rather
16
related to the sudden and general changes in fiscal procedures or to the district-specific changes
in the local political environment. A further interaction of public infrastructure coverage with
both decentralization and democratization can help to shed light on whether the
decentralization effects were reinforced by the political process. Even though the timing of the
decentralization effect does not vary across districts, interactions between the idiosyncratic
democratization and the decentralization effects are still identified.
5 Results
5.1 Baseline results
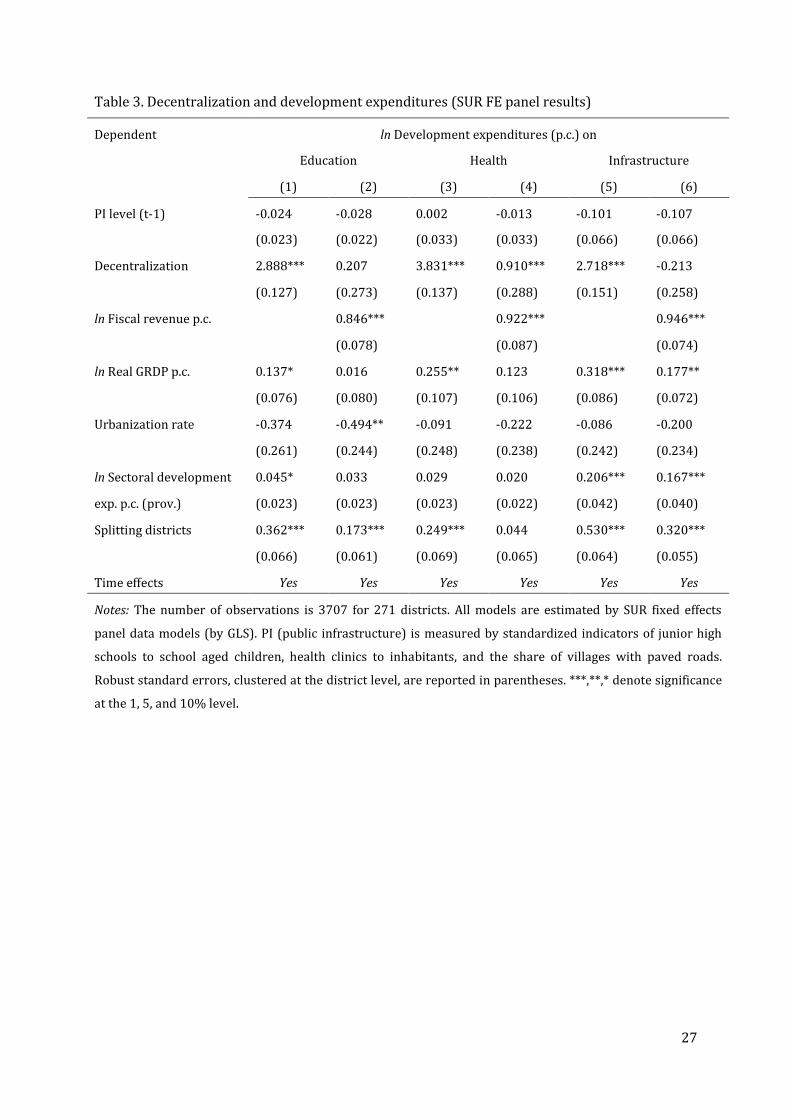
Table 3 shows the results from the baseline specification (eq. 1) for each of the three sectors.
Columns 1, 3, and 5 introduce the indicator for fiscal and administrative decentralization while
controlling for district wealth, urbanization, provincial expenditures, district splits, and common
time effects. The results show a strong average increase in local development expenditures after
decentralization. The largest part of this effect, however, was due to increases in fiscal revenues,
mostly allocated to the districts from the centre (see columns 2, 4, and 6). When controlling for
the size of fiscal revenues, the average effect of decentralization decreases considerably for
health and vanishes for the other sectors. Thus, expenditure decentralization can explain a large
part of the changes in investment behaviour of the districts.
In terms of additional controls, we do not find a significant correlation between sectoral
infrastructure coverage levels and development expenditures over the full time period. Sectoral
investments increase with real pc. GRDP, but this effect is mostly due to differences in the size of
district revenues. Only the physical infrastructure sector is an exception as investments to it are
positively correlated with regional wealth even after controlling for revenue size. Higher
urbanization results in significantly lower expenditures in education once revenue size has been
controlled for; this reflects scale effects in providing educational infrastructure in more
urbanized areas. Coefficients on the other sectors are also negative but not significant. There is
also evidence for complementarity between the expenditures of different tiers of the
government, especially for investments in physical infrastructure, where local development
expenditures are positively related to provincial expenditures. This is not surprising as large
infrastructure projects are more likely to be co-financed by the districts and the province.
Finally, as expected, districts with splitting administrative units also tend to spend more on
public infrastructure: part of this effect is once again due to the districts’ increasing per capita
revenues following the splits, but it partly also reflects the needs for additional public schools,
clinics, or roads after administrative splits.

17
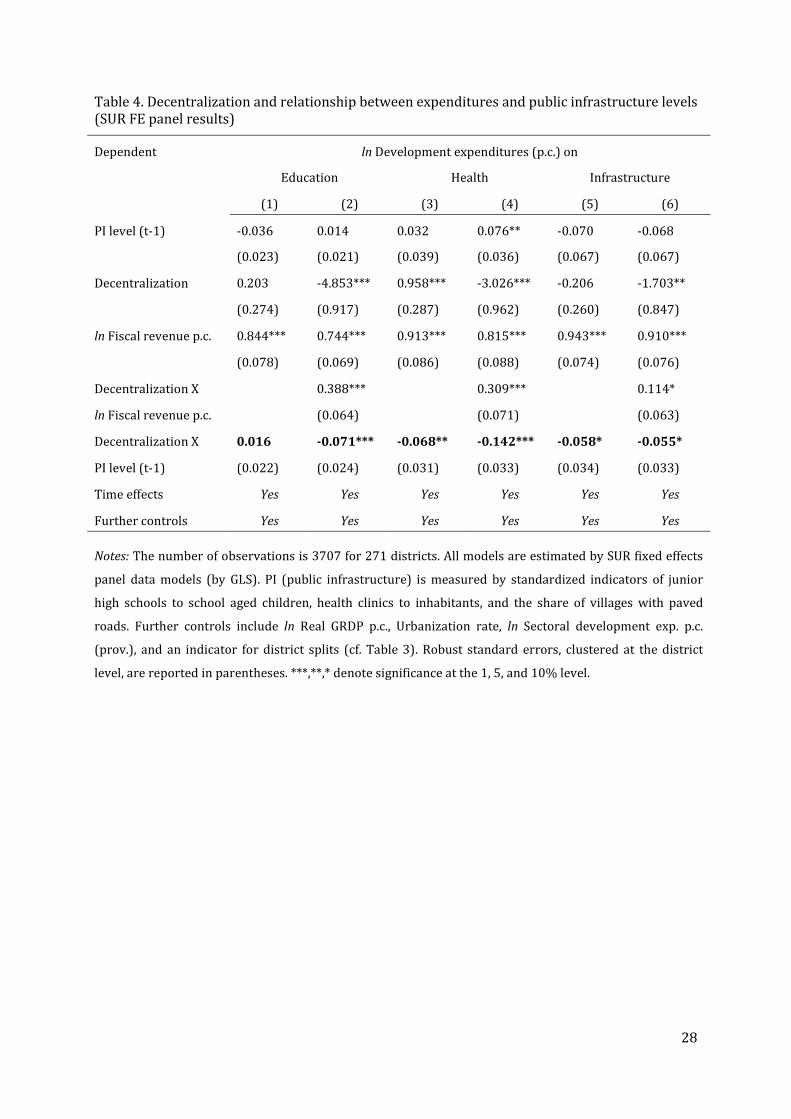
Table 4 presents our main results on the effects of fiscal and administrative decentralization on
the development expenditures for given local stocks of infrastructure (eq. 2). Additionally to all
previous controls, these specifications include an interaction term between the decentralization
indicator and the lagged level of public infrastructure. Once we control for the increased revenue
elasticity after decentralization, investments into sectoral infrastructure increase significantly in
all three sectors in districts with lower infrastructure stocks (significantly negative 𝛾1𝑠
coefficients in columns 2, 4, and 6). The post-decentralization change is largest in the health
sector: a one standard deviation lower coverage with health care centres (normalized by
population size) resulted in about 14% higher investments in the health care sector after
decentralization. The same effects were about 7% for schooling and 6% for physical
infrastructure. Interaction coefficients between the decentralization indicator and fiscal
revenues also show that the revenue elasticity of these expenditures considerably increased
after decentralization. Thus, local governments started to invest more in public infrastructure in
places with relatively lower public infrastructure levels, and this spending also became more
closely coupled to their own revenue size. These findings suggest that local governments
improved the targeting efficiency of public infrastructure investments once expenditures were
substantially decentralized.
Table 5 compares the effects of fiscal and administrative decentralization in 2001 with the
effects of the first wave of the democratization process, which produced democratically elected
local government heads. Whereas the decentralization coefficients capture an average structural
break, the effects of the democratization variables are idiosyncratic for the individual districts.
Overall, the democratization process seems to have had less pronounced effects than the big-
bang decentralization. Newly democratically elected government heads did not increase sectoral
investments on average, neither did they increase targeting efficiency: with democratization,
investments did not further increase in districts that were especially lagging behind.
Insignificant triple interactions of PI levels with the democratization and decentralization
indicators show that the responsiveness effects of decentralization did not depend on the
democratic legitimacy of the district heads.
Table 6 further investigates the democratization process by introducing effects of the direct
elections of local heads (starting with 2005). Interactions with direct elections are only
significant in one of the sectors: If anything, direct elections seem to have lead to an increase in
health sector investments in districts with already higher infrastructure coverage.
In contrast to the much more clear-cut evidence on the administrative and fiscal
decentralization, the democratization process does not seem to have yielded comparable
improvements in investment targeting. The decentralization interactions with public

18
infrastructure coverage remain significant for the education and health sectors, even when
detailed controls of the democratization process are introduced, and remain of comparable
magnitude, even though they lose significance for physical infrastructure. Overall, there is no
evidence that these effects depended on the local progress of the democratization process.
Although these results do not present direct evidence for local elites capturing the political
process, the gradual progress of democratization does not lead to improvements in targeting of
local public investments and hence does not further promote convergence across districts.
5.2 Robustness
A remaining concern is whether the increase in investments in districts with relatively lower
infrastructure coverage is just capturing the effects of a recovery from the Indonesian monetary
crisis of 1997/98 and not those of the fiscal and administrative decentralization. We document
the sensitivity of our results to the crisis effects in Table 7, which additionally introduces
interactions between the two main crisis years (affecting the 1998 and 1999 budgets) and public
infrastructure levels as well as fiscal revenues. If our decentralization results were just driven by
a post-crisis recovery effect, the public infrastructure interaction with decentralization should
lose significance once we control for differences in the slope of public infrastructure and
revenue effects during the crisis. We see that responsiveness was lower during the crisis years in
two of the three sectors. Nonetheless, our decentralization effects stay stable and show increases
in investments in district with less infrastructure coverage. The positive PI interactions with
direct elections in the health sector also stay on.
The proliferation of new districts is potentially a second issue of concern. In our estimation
models, districts are treated jointly even after they split up: expenditures, public infrastructure,
and economic indicators are calculated for the original districts, and average budgetary changes
after the split are controlled for by a splitting indicator. In order to investigate the sensitivity of
our main findings to this procedure, we re-estimate two of the main specifications (eqns. 2 and
3) only for the subsample of those districts that did not split. This results in an unbalanced
sample of 3430 observations that include 271 districts up to the point before the first
administrative split of each district occurred. Table 8 presents the results and shows that all
major results also hold in this restricted sample: responsiveness increases after decentralization
and decreases in the health sector after direct elections.
6 Conclusion
Our paper investigated the effects of administrative and fiscal as well as of political
decentralization in Indonesia on local investments into public infrastructure. Indonesia’s vast

19
regional diversity together with the large scale big-bang decentralization and the accompanying
democratization process offer a valuable case study on the effects of decentralization and
democratization. We studied this process by estimating fixed effect panel models explaining
local investments in public infrastructure in the sectors education, health, and physical
infrastructure and relating the changes in investment to past levels of public infrastructure. Our
main findings show that fiscal and administrative decentralization increased the responsiveness
of local governments to local public infrastructure coverage and that this effect cannot be
explained by increases in the districts’ fiscal revenues only. After gaining expenditure authority,
district investments in public infrastructure exhibited a converging pattern; this could be driven
by informational advantages or some form of inter-jurisdictional competition. The budgetary
effects of the democratization process are less clear-cut. We find no favourable investment
effects of either the early party representation based democratization or the later introduction
of direct elections (after controlling for fiscal decentralization). If anything, responsiveness
might have deteriorated in the health sector after the introduction of direct elections. These
results thus also show that the early improvements in targeting that came from the fiscal
expenditure decentralization were less sensitive to the political process.

20
7 References
Alatas, Vivi, Abhijit V. Banerjee, Rema Hanna, Benjamin A. Olken and Julia Tobias (2012),
Targeting the poor: Evidence from a field experiment in Indonesia, American Economic Review,
102(4): 1206-1240.
Alderman, Harold (2002), Do local officials know something we don’t? Decentralization of
targeted transfers in Albania, Journal of Public Economics, 83(3): 375-404.
Aspinall, Edward (2010), The irony of success, Journal of Democracy, 21(2): 20-34.
Australia–Nusa Tenggara Assistance for Regional Autonomy (2009), East Nusa Tenggara Public
Expenditure Analysis, Australia–Nusa Tenggara Assistance for Regional Autonomy, Kupang, NTT.
Banerjee, Abhijit V., Rukmini Banerji, Esther Duflo, Rachel Glennerster, Stuti Khemani (2010),
Pitfalls in participatory programs: Evidence from a randomized evaluation in education in India,
American Economic Journal: Economic Policy, 2(1):1-30.
Barankay, Iwan and Ben Lockwood (2007), Decentralization and the productive efficiency of
government: Evidence from Swiss cantons, Journal of Public Economics, 91(5-6): 1197-1218.
Bardhan, Pranab (2002), Decentralization of governance and development, Journal of Economic
Perspectives, 16(4): 185-205.
Bardhan, Pranab and Dilip Mookherjee (2005), Decentralizing antipoverty program delivery in
developing countries, Journal of Public Economics, 89 (4): 675-704.
Bardhan, Pranab and Dilip Mookherjee (2006a), Decentralization and accountability in
infrastructure delivery in developing countries, Economic Journal, 116(508): 101-127.
Bardhan, Pranab and Dilip Mookherjee (2006b), Pro-poor targeting and accountability of local
governments in West Bengal, Journal of Development Economics, 79(2): 303-327.
Besley, Timothy and Stephen Coate (2003), Centralized versus decentralized provision of local
public goods: A political economy approach, Journal of Public Economics, 87(12): 2611-2637.
Besley, Timothy, Rohini Pande, Lupin Rahman and Vijayendra Rao (2004), The politics of public
good provision: Evidence from Indian local governments, Journal of the European Economic
Association, 2(2-3): 416-426.
Björkmann, Martina and Jakob Svensson (2009), Power to the people: Evidence from a
randomized field experiment on community-based monitoring in Uganda, Quarterly Journal of
Economics, 124(2): 735-769.
21
Burgess, Robin, Matthew Hansen, Benjamin A. Olken, Peter Potapov, and Stefanie Sieber (2011),
The political economy of deforestation in the tropics, NBER Working Paper Series No. 17417,
National Bureau of Economic Research Inc., Cambridge, Mass.
de Mello, Luiz and Matias Barenstein (2001), Fiscal decentralization and governance: A cross-
country analysis, IMF Working Paper No. 01/71, International Monetary Fund, Washington D.C.
Decentralization Support Facility (2007), Costs and benefits of new region creation in Indonesia:
Final report, Decentralization Support Facility, Jakarta.
Duflo, Esther (2001), Schooling and labour market consequences of school construction in
Indonesia: Evidence from an unusual policy experiment, American Economic Review, 91(1): 795-
813.
Enikolopov, Ruben and Ekaterina Zhuravskaya (2007), Decentralization and political
institutions, Journal of Public Economics, 91(11-12): 2261-2290.
Faguet, Jean-Paul (2004), Does decentralization increase government responsiveness to local
needs? Evidence from Bolivia, Journal of Public Economics, 88(3-4): 867-893.
Fisman, Raymond and Roberta Gatti (2002), Decentralization and corruption: evidence across
countries, Journal of Public Economics, 83(3): 325-345.
Fitrani, Fitria, Bert Hofman and Kai Kaiser (2005), Unity in diversity? The creation of new local
governments in a decentralizing Indonesia, Bulletin of Indonesian Economic Studies, 41(1): 57-
79.
Gadenne, Lucie and Monica Singhal (2013), Decentralization in developing economies, NBER
Working Paper Series No. 19402, National Bureau of Economic Research Inc., Cambridge, Mass.
Galasso, Emanuela and Martin Ravallion (2005), Decentralized targeting of an antipoverty
program, Journal of Public Economics, 89(4): 705-727.
Galiani, Sebastian, Paul Gertler and Ernesto Schargrodsky (2008), School decentralization:
Helping the good get better, but leaving the poor behind, Journal of Public Economics, 92(10-11):
2106-2120.
Hayek, Friedrich A. (1948), Individualism and Economic Order, University of Chicago Press,
Chicago.
Henderon, Vernon J. and Ari Kuncoro (2010), Corruption and local democratization in Indonesia:
The role of Islamic parties, Journal of Development Economics, 94(2): 164-180.
Hofman, Bert and Kai Kaiser (2006), Decentralization, democratic transition, and local
governance in Indonesia, In: Decentralization and local governance in developing countries, eds.

22
Pranab Bardhan and Dilip Mookherjee, The Massachusetts Institute of Technology Press,
Cambridge.
Jiménez-Rubio, Dolores (2011), The impact of fiscal decentralization on infant mortality rates:
Evidence from OECD countries, Social Science & Medicine, 73(9):1401-1407.
Khaleghian, Peyvand (2004), Decentralization and public services: The case of immunization,
Social Science and Medicine, 59(1): 163-183.
Kruse, Ioana, Menno Pradhan and Robert Sparrow (2012), Marginal benefit incidence of public
health spending: Evidence from Indonesian sub-national data, Journal of Health Economics,
31(1):147-157.
Kuncoro, Ari (2006), Corruption and business uncertainty in Indonesia, ASEAN Economic
Bulletin, 33(1): 11-30.
Lewis, Blane D. (2005), Indonesian local government spending, taxing and saving: An
explanation of pre and post-decentralization fiscal outcomes, Asian Economic Journal, 19(3):
291-317.
Oates, Wallace (1972), Fiscal Federalism, Harcourt Brace Jovanovich, New York.
Olken, Ben (2007), Monitoring corruption: Evidence from a field experiment in Indonesia,
Journal of Political Economy, 115(2): 200-249.
Ravallion, Martin (2007), Geographic inequity in a decentralized anti-poverty program: A case
study of China, Policy Research Working Paper Series No. 4303, The World Bank, Washington D.C.
Reinikka, Ritva and Jakob Svensson(2004), Local capture: Evidence from a central government
transfer program in Uganda, Quarterly Journal of Economics, 119(2): 679-705.
Robalino, David, Oscar Picazo and Albertus Voetberg (2001), Does fiscal decentralization
improve health outcomes? Evidence from a cross-country analysis, Policy Research Working
Paper Series No. 2565, World Bank, Washington D.C.
Schiller, Jim (2009), Electing district heads in Indonesia: Democratic deepening or elite
entrenchment? In: Deepening democracy in Indonesia? Direct elections for local leaders (Pilkada),
eds. Maribeth Erb and Priyambudhi Sulistiyanto, Institute of South East Asian Studies
Publishing, Singapore.
Seabright, Paul (1996), Accountability and decentralization in government: An incomplete
contracts model, European Economic Review, 40(1): 61-89.
Sjahrir, Bambang S., Krisztina Kis-Katos, and Günther G. Schulze. (2013a), Political budget cycles
in Indonesia at the district level, Economics Letters 120(2): 342-345.

23
Sjahrir, Bambang S., Krisztina Kis-Katos, and Günther G. Schulze (2013b), Administrative
overspending in Indonesian districts: The role of local politics, IEP Discussion Paper Series No.
24, University of Freiburg, Freiburg.
Skoufias, Emmanuel, Ambar Narayan, Basap Dasgupta and Kai Kaiser (2011), Electoral
accountability, fiscal decentralization and service delivery in Indonesia, Policy Research Working
Paper Series No. 5614, World Bank, Washington D.C.
Solé-Ollé, Albert and Alejandro Esteller-Moré (2005), Decentralized provision of public inputs,
government responsiveness to local needs, and regional growth. Evidence from Spain, Institut
d’Economia de Barcelona Working Paper, Institut d’Economia de Barcelona, Barcelona.
Tiebout, Charles M. (1956), A pure theory of local expenditures, Journal of Political Economy,
64(5): 416-424.
World Bank (2003a), World Development Report 2004: Making Services Work for Poor People,
World Bank and Oxford University Press, Washington, D.C.
World Bank (2003b), Decentralizing Indonesia: A regional public expenditure review overview
report, World Bank, Jakarta.
World Bank (2005), Papua public expenditure analysis: Regional finance and service delivery in
Indonesia’s most remote region, World Bank, Jakarta.
World Bank (2007), Spending for development: Making the most of Indonesia’s new opportunities,
World Bank, Jakarta.
World Bank (2008a), Investing in Indonesia’s health: Challenges and opportunities for future
public spending, World Bank, Jakarta.
World Bank (2008b), Managing resources for better outcomes in a special autonomy region: Aceh
public expenditure analysis update, World Bank, Jakarta.
World Bank (2008c), Service delivery and financial management in a new province: Gorontalo
public expenditure analysis 2008, World Bank, Jakarta.
World Bank (2009), Practical guidelines for analyzing public expenditure at the sub-national level:
Conference edition, World Bank, Jakarta.
Zhang, Xiaobo, Shenggen Fan, Linxiu Zhang and Jikun Huang (2004), Local governance and
public goods provision in rural China, Journal of Public Economics, 88(12): 2857-2871.
24
Appendix
Figures
Figure 1. Evolution of real per capita development expenditures and PI levels by sector
Notes: Levels of public infrastructure include 1) the ratio of junior secondary schools to 100 junior
secondary school aged children for education, 2) the ratio of health clinics to 10,000 of population for the
health sector, and 3) the percentage share of villages with paved roads for infrastructure. Development
expenditures are expressed in 1993 IDR.
EDUC.
HEALTH
INFRA.
67
89
1011
Mea
n of
(ln)
PC
Exp
1995 1997 1999 2001 2003 2005 2007 2009Year
Average levels
EDUC.
HEALTH
INFRA.
.51
1.5
22.
5C
oeffi
cien
t of v
aria
tion
1995 1997 1999 2001 2003 2005 2007 2009Year
Variation across districts
Expenditures p.c.
EDUC.
HEALTH
INFRA.
.4.5
.6.7
Mea
n of
PI L
evel
(Inf
ra.)
.2.3
.4.5
Mea
n of
PI L
evel
(Edu
c. a
nd H
ealth
)
1995 1997 1999 2001 2003 2005 2007 2009Year
Average levels
EDUC.
HEALTH
INFRA.
.2.3
.4.5
.6.7
Coe
ffici
ent o
f var
iatio
n
1995 1997 1999 2001 2003 2005 2007 2009Year
Variation across districts
Public infrastructure levels
25
Tables
Table 1. The democratization process
Local government heads who are
Year No. districts Democratically elected Directly elected
Number % Number %
1999 292 42 14.4
2000 299 111 37.1
2001 336 178 53.0
2002 348 208 59.8
2003 370 316 85.4
2004 410 392 95.6
2005 434 434 100.0 186 42.9
2006 434 434 100.0 242 55.8
2007 434 434 100.0 270 62.2
2008 451 451 100.0 402 89.1
2009 477 477 100.0 403 84.5
Note: Starting with 2005, all directly elected heads are considered democratically appointed. Source: List
of heads of regional governments from Min. of Home Affairs, The World Bank, and Asia Foundation. Local
direct election data comes from the Min. of Home Affairs, KPU, Asia Foundation, and World Bank.

26
Table 2. Descriptive statistics
Mean Std. Dev. Min Max
ln Dev. Exp. (p.c.) on education 9.413 1.318 4.252 13.746
ln Dev. Exp. (p.c.) on health 8.522 1.661 2.780 14.762
ln Dev. Exp. (p.c.) on infrastructure 10.281 1.438 2.451 15.664
PI level in education 0.000 1.000 -2.197 9.403
PI level in health 0.000 1.000 -1.927 7.764
PI level in infrastructure 0.000 1.000 -2.508 1.373
Decentralization (DEC) 0.529 0.499 0 1
Democratically elected head (DEM) 0.485 0.500 0 1
Directly elected head (DIR) 0.131 0.337 0 1
ln Fiscal revenue p.c. 12.532 1.240 9.479 16.142
ln Real GRDP p.c. 15.248 0.619 12.432 18.197
Urbanization rate 0.387 0.316 0.006 1
ln Dev. Exp. p.c. (prov.) on education 8.049 1.180 5.602 12.612
ln Dev. Exp. p.c. (prov.) on health 7.596 1.451 -0.168 12.878
ln Dev. Exp. p.c. (prov.) on infrastructure 9.267 1.082 6.433 13.409
Splitting districts 0.075 0.263 0 1
Crisis years (1998-1999) 0.132 0.339 0 1
Note: Number of observations is 3707 for 271 local governments.
27
Table 3. Decentralization and development expenditures (SUR FE panel results)
Dependent ln Development expenditures (p.c.) on
Education Health Infrastructure
(1) (2) (3) (4) (5) (6)
PI level (t-1)
-0.024 -0.028 0.002 -0.013 -0.101 -0.107
(0.023) (0.022) (0.033) (0.033) (0.066) (0.066)
Decentralization 2.888*** 0.207 3.831*** 0.910*** 2.718*** -0.213
(0.127) (0.273) (0.137) (0.288) (0.151) (0.258)
ln Fiscal revenue p.c. 0.846*** 0.922*** 0.946***
(0.078) (0.087) (0.074)
ln Real GRDP p.c. 0.137* 0.016 0.255** 0.123 0.318*** 0.177**
(0.076) (0.080) (0.107) (0.106) (0.086) (0.072)
Urbanization rate -0.374 -0.494** -0.091 -0.222 -0.086 -0.200
(0.261) (0.244) (0.248) (0.238) (0.242) (0.234)
ln Sectoral development 0.045* 0.033 0.029 0.020 0.206*** 0.167***
exp. p.c. (prov.) (0.023) (0.023) (0.023) (0.022) (0.042) (0.040)
Splitting districts 0.362*** 0.173*** 0.249*** 0.044 0.530*** 0.320***
(0.066) (0.061) (0.069) (0.065) (0.064) (0.055)
Time effects Yes Yes Yes Yes Yes Yes
Notes: The number of observations is 3707 for 271 districts. All models are estimated by SUR fixed effects
panel data models (by GLS). PI (public infrastructure) is measured by standardized indicators of junior high
schools to school aged children, health clinics to inhabitants, and the share of villages with paved roads.
Robust standard errors, clustered at the district level, are reported in parentheses. ***,**,* denote significance
at the 1, 5, and 10% level.
28
Table 4. Decentralization and relationship between expenditures and public infrastructure levels (SUR FE panel results)
Dependent ln Development expenditures (p.c.) on
Education Health Infrastructure
(1) (2) (3) (4) (5) (6)
PI level (t-1) -0.036 0.014 0.032 0.076** -0.070 -0.068
(0.023) (0.021) (0.039) (0.036) (0.067) (0.067)
Decentralization 0.203 -4.853*** 0.958*** -3.026*** -0.206 -1.703**
(0.274) (0.917) (0.287) (0.962) (0.260) (0.847)
ln Fiscal revenue p.c. 0.844*** 0.744*** 0.913*** 0.815*** 0.943*** 0.910***
(0.078) (0.069) (0.086) (0.088) (0.074) (0.076)
Decentralization X
0.388***
0.309***
0.114*
ln Fiscal revenue p.c.
(0.064)
(0.071)
(0.063)
Decentralization X 0.016 -0.071*** -0.068** -0.142*** -0.058* -0.055*
PI level (t-1) (0.022) (0.024) (0.031) (0.033) (0.034) (0.033)
Time effects Yes Yes Yes Yes Yes Yes
Further controls Yes Yes Yes Yes Yes Yes
Notes: The number of observations is 3707 for 271 districts. All models are estimated by SUR fixed effects
panel data models (by GLS). PI (public infrastructure) is measured by standardized indicators of junior
high schools to school aged children, health clinics to inhabitants, and the share of villages with paved
roads. Further controls include ln Real GRDP p.c., Urbanization rate, ln Sectoral development exp. p.c.
(prov.), and an indicator for district splits (cf. Table 3). Robust standard errors, clustered at the district
level, are reported in parentheses. ***,**,* denote significance at the 1, 5, and 10% level.

29
Table 5. The impact of democratically elected local heads on local public investment (SUR FE panel results)
Dependent ln Development expenditures (p.c.) on Education Health Infrastructure
(1) (2) (3) (4) (5) (6)
PI Level (t-1) 0.006 0.007 0.075** 0.082** -0.068 -0.070
(0.022) (0.022) (0.036) (0.036) (0.068) (0.067)
Decentralization -4.845*** -4.846*** -3.035*** -3.016*** -1.699** -1.680**
(0.918) (0.921) (0.972) (0.975) (0.852) (0.851)
ln Fiscal revenue p.c. 0.744*** 0.743*** 0.814*** 0.802*** 0.910*** 0.908***
(0.069) (0.069) (0.088) (0.087) (0.076) (0.077)
Decentralization X 0.386*** 0.386*** 0.308*** 0.309*** 0.114* 0.114*
ln Fiscal revenue p.c. (0.064) (0.064) (0.071) (0.071) (0.063) (0.062)
Decentralization X -0.125*** -0.130** -0.167*** -0.211*** -0.048 -0.029
PI Level (t-1) (0.041) (0.059) (0.055) (0.067) (0.035) (0.043)
Democratic head 0.027 0.034 0.028 -0.013 -0.001 0.058
(0.048) (0.068) (0.055) (0.105) (0.046) (0.073)
Democratic head X 0.069 0.057 0.031 -0.065 -0.009 0.038
PI Level (t-1) (0.044) (0.038) (0.047) (0.071) (0.034) (0.041)
Decentralization X
-0.009 0.058 -0.074
Democratic head
(0.089) (0.116) (0.087)
Dec. X Democr. X
0.017 0.139 -0.067
PI Level (t-1)
(0.071) (0.093) (0.059)
Further controls Yes Yes Yes Yes Yes Yes
Notes: The number of observations is 3707 for 271 districts. All models are estimated by SUR fixed effects panel
data models (by GLS). PI (public infrastructure) is measured by standardized indicators of junior high schools to
school aged children, health clinics to inhabitants, and the share of villages with paved roads. Further controls
include a set of time fixed effects, ln Real GRDP p.c., Urbanization rate, ln Sectoral development exp. p.c., (prov.),
and district split indicators (cf. Table 3). Robust standard errors, clustered at the district level, are reported in
parentheses. ***,**,* denote significance at the 1, 5, and 10% level.

30
Table 6. The impact of directly elected local heads on local public investment (SUR FE panel results)
Dependent ln Development expenditures (p.c.) on Education Health Infrastructure
(1) (2) (3) (4) (5) (6)
PI Level (t-1) 0.005 0.012 0.077** 0.078** -0.071 -0.072
(0.022) (0.021) (0.036) (0.036) (0.067) (0.067)
Decentralization -4.780*** -4.796*** -2.932*** -2.900*** -1.665** -1.675**
(0.903) (0.902) (0.970) (0.961) (0.845) (0.839)
ln Fiscal revenue p.c. 0.741*** 0.740*** 0.806*** 0.806*** 0.909*** 0.909***
(0.068) (0.068) (0.088) (0.088) (0.076) (0.076)
Decentralization X 0.386*** 0.389*** 0.302*** 0.302*** 0.115* 0.115*
ln Fiscal revenue p.c. (0.064) (0.064) (0.072) (0.071) (0.062) (0.062)
Decentralization X -0.128*** -0.078*** -0.173*** -0.156*** -0.051 -0.060
PI Level (t-1) (0.042) (0.026) (0.056) (0.034) (0.037) (0.037)
Democratic head 0.021 0.030 -0.006
(0.048) (0.055) (0.046)
Democratic head X 0.067 0.021 -0.012
PI Level (t-1) (0.043) (0.047) (0.035)
Directly elected head -0.069 -0.072 0.014 0.010 -0.053 -0.051
(0.075) (0.076) (0.050) (0.050) (0.071) (0.071)
Directly elected head X 0.017 0.025 0.065** 0.068** 0.023 0.021
PI Level (t-1) (0.057) (0.057) (0.027) (0.028) (0.045) (0.044)
Further controls Yes Yes Yes Yes Yes Yes
Notes: The number of observations is 3707 for 271 districts. All models are estimated by SUR fixed effects panel
data models (by GLS). PI (public infrastructure) is measured by standardized indicators of junior high schools to
school aged children, health clinics to inhabitants, and the share of villages with paved roads. Further controls
include a set of time fixed effects, ln Real GRDP p.c., Urbanization rate, ln Sectoral development exp. p.c., (prov.),
and district split indicators (cf. Table 3). Robust standard errors, clustered at the district level, are reported in
parentheses. ***,**,* denote significance at the 1, 5, and 10% level.

31
Table 7. Robustness: Controlling for crisis years (SUR FE panel results)
Dependent ln Development expenditures (p.c.) on Education Health Infrastructure
(1) (2) (3) (4) (5) (6)
PI Level (t-1) 0.010 -0.001 0.048 0.048 -0.070 -0.072
(0.021) (0.022) (0.036) (0.037) (0.068) (0.068)
Decentralization -4.907*** -4.868*** -3.042*** -2.957*** -1.808** -1.794**
(0.920) (0.906) (0.964) (0.974) (0.848) (0.851)
ln Fiscal revenue p.c. 0.747*** 0.744*** 0.841*** 0.832*** 0.908*** 0.907***
(0.070) (0.069) (0.088) (0.088) (0.076) (0.076)
Decentralization X 0.392*** 0.390*** 0.306*** 0.299*** 0.122* 0.123**
ln Fiscal revenue p.c. (0.064) (0.064) (0.071) (0.072) (0.063) (0.063)
Crisis indicator -0.484*** -0.541*** -0.841*** -0.885*** -1.140*** -1.157***
(0.135) (0.164) (0.158) (0.196) (0.137) (0.161)
Crisis indicator X 0.023*** 0.028*** 0.008 0.013 0.033*** 0.034***
ln Fiscal revenue p.c. (0.007) (0.010) (0.009) (0.013) (0.007) (0.010)
Crisis indicator X 0.017 0.022 0.099*** 0.100*** 0.008 0.007
PI Level (t-1) (0.020) (0.021) (0.038) (0.039) (0.018) (0.019)
Decentralization X -0.065*** -0.123*** -0.112*** -0.150*** -0.055* -0.052
PI Level (t-1) (0.025) (0.041) (0.034) (0.055) (0.034) (0.037)
Democratic head 0.035 0.037 0.011
(0.051) (0.059) (0.049)
Democratic head X -0.066 0.015 -0.050
PI Level (t-1) (0.075) (0.050) (0.071)
Directly elected head 0.070 0.031 -0.012
(0.044) (0.047) (0.035)
Directly elected head X 0.018 0.064** 0.022
PI Level (t-1) (0.057) (0.027) (0.045)
Further controls Yes Yes Yes Yes Yes Yes
Notes: The number of observations is 3707 for 271 districts. All models are estimated by SUR fixed effects
panel data models (by GLS). PI (public infrastructure) is measured by standardized indicators of junior high
schools to school aged children, health clinics to inhabitants, and the share of villages with paved roads.
Further controls include ln Real GRDP p.c., Urbanization rate, and ln Sectoral development exp. p.c. (prov.),
and a district split indicator (cf. Table 3). Robust standard errors, clustered at the district level, are reported
in parentheses. ***,**,* denote significance at the 1, 5, and 10% level.
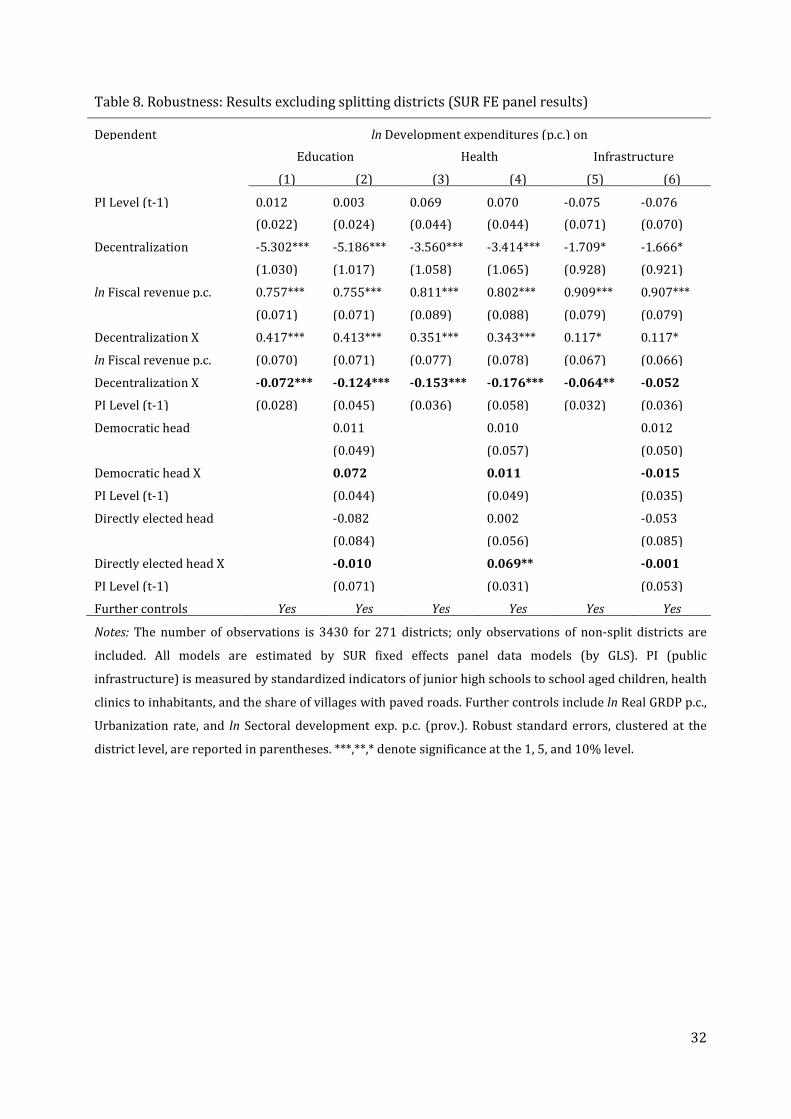
32
Table 8. Robustness: Results excluding splitting districts (SUR FE panel results)
Dependent ln Development expenditures (p.c.) on Education Health Infrastructure
(1) (2) (3) (4) (5) (6)
PI Level (t-1) 0.012 0.003 0.069 0.070 -0.075 -0.076
(0.022) (0.024) (0.044) (0.044) (0.071) (0.070)
Decentralization -5.302*** -5.186*** -3.560*** -3.414*** -1.709* -1.666*
(1.030) (1.017) (1.058) (1.065) (0.928) (0.921)
ln Fiscal revenue p.c. 0.757*** 0.755*** 0.811*** 0.802*** 0.909*** 0.907***
(0.071) (0.071) (0.089) (0.088) (0.079) (0.079)
Decentralization X 0.417*** 0.413*** 0.351*** 0.343*** 0.117* 0.117*
ln Fiscal revenue p.c. (0.070) (0.071) (0.077) (0.078) (0.067) (0.066)
Decentralization X -0.072*** -0.124*** -0.153*** -0.176*** -0.064** -0.052
PI Level (t-1) (0.028) (0.045) (0.036) (0.058) (0.032) (0.036)
Democratic head 0.011 0.010 0.012
(0.049) (0.057) (0.050)
Democratic head X 0.072 0.011 -0.015
PI Level (t-1) (0.044) (0.049) (0.035)
Directly elected head -0.082 0.002 -0.053
(0.084) (0.056) (0.085)
Directly elected head X -0.010 0.069** -0.001
PI Level (t-1) (0.071) (0.031) (0.053)
Further controls Yes Yes Yes Yes Yes Yes
Notes: The number of observations is 3430 for 271 districts; only observations of non-split districts are
included. All models are estimated by SUR fixed effects panel data models (by GLS). PI (public
infrastructure) is measured by standardized indicators of junior high schools to school aged children, health
clinics to inhabitants, and the share of villages with paved roads. Further controls include ln Real GRDP p.c.,
Urbanization rate, and ln Sectoral development exp. p.c. (prov.). Robust standard errors, clustered at the
district level, are reported in parentheses. ***,**,* denote significance at the 1, 5, and 10% level.