discovery of molecular hydrogen line emission associated with methanol maser emission
TRANSCRIPT

Discovery of molecular hydrogen line emission associated with methanolmaser emission
J.-K. Lee,P† A. J. Walsh,‡ M. G. Burton and M. C. B. AshleySchool of Physics, University of New South Wales, Sydney, NSW 2052, Australia
Accepted 2001 February 6. Received 2001 February 6; in original form 2000 March 9
A B S T R A C T
We report the discovery of H2 line emission associated with 6.67-GHz methanol maser
emission in massive star-forming regions. In our UNSWIRF/AAT observations, H2 1–0 S(1)
line emission was found associated with an ultracompact H II region IRAS 14567–5846 and
isolated methanol maser sites in G318:95–0:20, IRAS 15278–5620 and IRAS 16076–5134.
Owing to the lack of radio continuum in the latter three sources, we argue that their H2
emission is shock excited, while it is UV-fluorescently excited in IRAS 14567–5846. Within
the positional uncertainties of 3 arcsec, the maser sites correspond to the location of infrared
sources. We suggest that 6.67-GHz methanol maser emission is associated with hot molecular
cores, and propose an evolutionary sequence of events for the process of massive star
formation.
Key words: masers – stars: formation – ISM: lines and bands – ISM: molecules – infrared:
ISM.
1 I N T R O D U C T I O N
6.7 GHz methanol (CH3OH) maser emission in the 51–60A 1
transition is one of the strongest astrophysical masers. Since the
first detection by Menten (1991), it has been established as a tracer
of massive star-forming regions, often containing ultracompact
(UC) H II regions (e.g. Caswell et al. 1995; Slysh et al. 1999).
However it is not clear how the masers are related to the physical
process of massive star formation, and how they are associated
with UC H II regions. Norris et al. (1993, 1998) and Phillips et al.
(1998) proposed that the methanol maser emission comes from
circumstellar discs. Menten (1996) suggested that it comes from
warm shells around UC H II regions, and Walsh et al. (1998)
suggested that the maser emission occurs behind shocks.
Walsh et al. (1997, 1998; hereafter Papers I and II, respectively)
investigated the association between methanol masers and UC H II
regions by carrying out low and high spatial resolution radio
surveys. They found that methanol maser emission usually occurs
in massive star-forming regions, but only 25 per cent (46 out of
232) of maser sites were found close to an UC H II region, contrary
to expectations. To explain this, they hypothesized an evolutionary
sequence, where methanol maser emission commences during an
early phase of pre-main-sequence evolution of massive stars,
before being destroyed as the star creates an UC H II region.
This hypothesis can be tested by searching for other indicators of
star formation, such as deeply embedded infrared (IR) or sub-
millimetre sources and outflows, associated with the maser
emission. Walsh et al. (1999; hereafter Paper III) carried out a near-
IR (NIR) survey to identify embedded stellar counterparts to the
UC H II regions and maser sources. Using the positional
coincidences and colours of the NIR sources, they identified
about half (12 out of 25) of the maser sites and about two-thirds (12
out of 18) of UC H II regions with a NIR counterpart, i.e.
proportionately more maser sites are found to have no observable
NIR counterpart than UC H II regions. From this, they concluded
that maser sites are associated with more deeply embedded objects
than UC H II regions are.
In an attempt to extend this work, we have searched for H2 1–0
S(1) line emission in the NIR, as a tracer of outflow activity
associated with the early stages of star formation. Here we report
the discovery of H2 line emission associated with methanol maser
sites. This is the first part of a larger survey for H2 emission
associated with either the UC H II regions and/or the methanol
masers.
2 O B S E RVAT I O N S A N D DATA R E D U C T I O N
The sources listed in Table 1 were observed in H2 1–0 S(1)
2.12-mm line emission using the University of New South Wales
Infrared Fabry–Perot (UNSWIRF; Ryder et al. 1998) on the 3.9-m
Anglo-Australian Telescope (AAT). The UNSWIRF is a narrow-
band ðl/dl , 4000Þ tunable filter for the NIR, used in conjunction
with the 128 � 128 pixel Infrared Imager and Spectrometer (IRIS;
† Present address: Dublin Institute of Advanced Studies, 5 Merrion Sq.,
Dublin 2, Ireland.
‡ Present address: Max-Planck-Institut fur Radioastronomie, auf dem
Hugel 69, Bonn D-53121, Germany.
PE-mail: [email protected]
Mon. Not. R. Astron. Soc. 324, 1102–1108 (2001)
q 2001 RAS

Allen et al. 1993). Used at f/36, it produces a circular image of
100 arcsec diameter with a pixel scale of 0.8 arcsec. The velocity
resolution is 75 km s21 full width at half-maximum (FWHM). The
observations were made on 1997 July 23 and 1998 June 16.
The observing sequence with UNSWIRF included one off-line
setting (for continuum subtraction) and several on-line Fabry–
Perot (FP) spacings, equally spaced at 39 km s21 about the line
centre, determined by the maser radial velocities. This sequence
was carried out with a few minutes integration time for each FP
spacing, first on a source and then on a sky position, for both sky
and continuum subtraction. An integration time of 3 min was used
for IRAS 14567–5846 and G318.9520.20 and 2 min for IRAS
1527825620 and 1607625134. A standard star was imaged at
each of the FP settings for flux calibration, as was a diffuse dome
lamp to obtain a flat field.
For data reduction, bias subtraction and linearization were
performed during readout using a non-destructive readout method.
The object frames were sky-subtracted, and then flat-fielded by
normalized dome flat-fields at matching FP settings. All frames are
then registered using field stars in the continuum frame. For
continuum subtraction, the continuum frame is scaled based on the
photometric result of a standard star and subtracted from all other
on-line frames. The line flux and central velocities of the H2
emission were then determined through Lorentzian fitting of
Table 1. List of sources observed by the UNSWIRF/AAT. The sourcenames are given in the first column, with their position in the secondand third columns. The range of Vlsr for the methanol maser emissionis presented in the fourth column, and these values are from Paper II.
Source Name Coordinates Vlsr
R.A. Dec. (km s21)(J2000) (J2000)
UC H II regionIRAS 14567–5846 15 00 35.0 258 58 10 –
Methanol Maser SitesG318.95–0.20 15 00 55.4 258 58 53 238.2 to 232.0IRAS 15278–5620 15 31 45.4 256 30 50 247.7 to 256.3;
257.4IRAS 16076–5134 16 11 26.6 251 41 57 285.2 to 278.3
Table 2. Results from the UNSWIRF observation of H2 1–0 S(1) line emission. The source name is given in the first column,followed by the observed velocity range of H2 emission in the second. The peak and integrated flux of H2 line emission aregiven in the third and fourth columns, respectively. The distance to the sources and the luminosity of H2 1–0 S(1) line emissionare in the fifth and sixth columns.
Source name DVH2Fpeak(H2) Fint(H2) Distance L[H2 1–0 S(1)]
(km s21) (�10216 erg s21 cm22 arcsec22) (�10213 erg s21 cm22) (kpc) (�1021 L()
UC H II regionIRAS 14567–5846 ,20 3^ 6% 0.7 2.4 0.1
Methanol Maser SitesG318.95–0.20 $50 17*^ 2% $1* 2.4 $0.2IRAS 15278–5620 ,70 17^ 2% 10 3.6 4.0IRAS 16076–5134 ,15 8^ 3% 2 5.6 1.6
* A lower limit for Fpeak and Fint, with insufficient FP coverage of the H2 emission.
Figure 1. Left: the UNSWIRF image of the IRAS 14567–5846 UC H II region. The H2 1–0 S(1) 2.12-mm line emission is drawn in contours, and a 2.2-mm
continuum image as a grey-scale (Paper III). Contour levels are 1.3 and 2:3 � 10216 erg cm22 s21 arcsec22. The ellipse indicates the IRAS error ellipse. Right:
the H2 line emission map (contours) overlaid on the 6.67-GHz radio continuum image (grey-scale) from Paper I. The same contour levels are used. H2 emission
encompasses the 2.2-mm continuum nebulosity as well as the radio continuum (Paper II).
Discovery of H2 associated with methanol masers 1103
q 2001 RAS, MNRAS 324, 1102–1108
on-line frames stacked into a cube of increasing etalon spacing, or
wavelength. The absolute flux measurement involves ,30 per cent
error, and the absolute velocity can be measured, based on
comparison with that of known H2-emitting sources, to within 15 to
20 km s21 accuracy. Meanwhile, relative velocity differences
between emitting regions in a source can be discerned when they
are $10 km s21. The data were reduced mostly with a customized
program using IRAF routines. A detailed UNSWIRF data reduction
procedure can be found in Ryder et al. (1998).
3 R E S U LT S
Results from our UNSWIRF observation of H2 line emission
associated with one UC H II region and three methanol maser sites
are summarized in Table 2. Features for individual sources are
described below. The source names are from Paper II, with other
common names also provided in square brackets. The images of
2.2-mm broad-band K-band continuum emission are displayed in
comaprison with H2 line emission. They are from Paper III as they
have superior quality to those of our narrow-band continuum
obtained by UNSWIRF.
3.1 IRAS 14567–5846
A large bright cometary UC H II region is associated with this IRAS
source (Paper II). No methanol maser emission is found associated
with this source. The extent of the UC H II region is approximated
by the 2.2-mm K-band continuum emission, seen in grey-scale at
the centre of Fig. 1. Weak H2 emission, represented by the
contours, appears to surround the UC H II region in a shell. The
observed velocity structure has line centre velocities varying
within a 20 km s21 range. We do not expect to see any velocity
structure with our spectral resolution as other UC H II regions show
expansion velocities of typically 5 km s21 (Kawamura & Masson
1998).
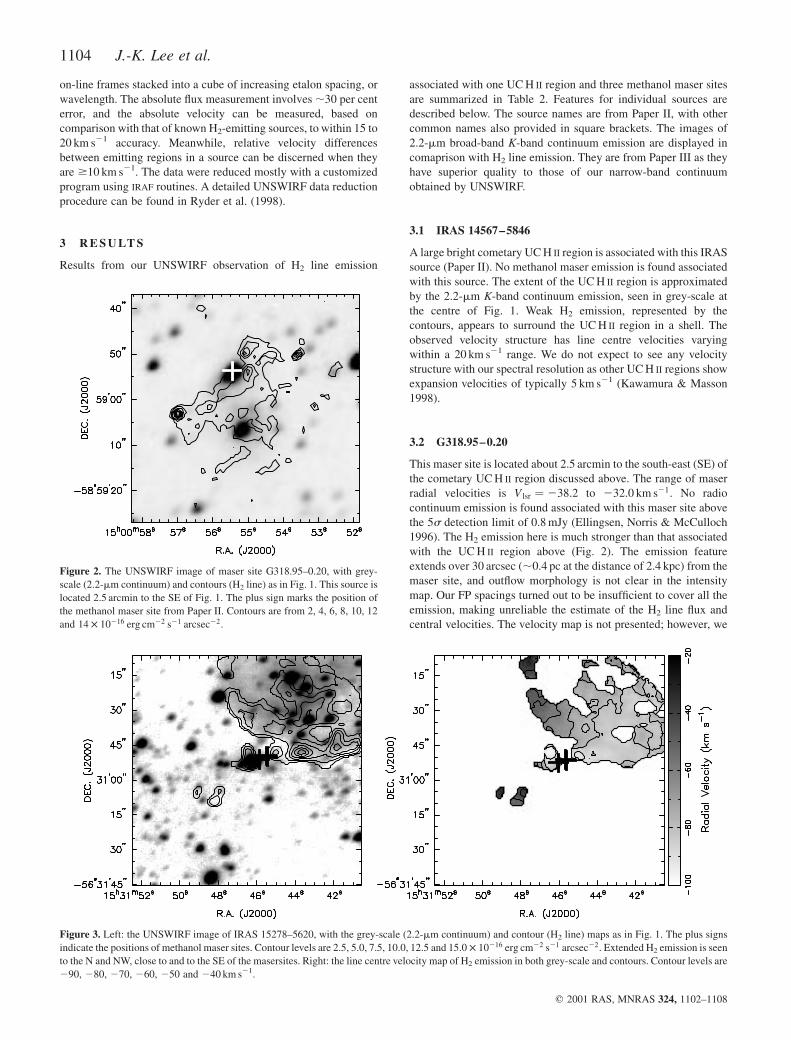
3.2 G318.95–0.20
This maser site is located about 2.5 arcmin to the south-east (SE) of
the cometary UC H II region discussed above. The range of maser
radial velocities is V lsr ¼ 238:2 to 232:0 km s21. No radio
continuum emission is found associated with this maser site above
the 5s detection limit of 0.8 mJy (Ellingsen, Norris & McCulloch
1996). The H2 emission here is much stronger than that associated
with the UC H II region above (Fig. 2). The emission feature
extends over 30 arcsec (,0.4 pc at the distance of 2.4 kpc) from the
maser site, and outflow morphology is not clear in the intensity
map. Our FP spacings turned out to be insufficient to cover all the
emission, making unreliable the estimate of the H2 line flux and
central velocities. The velocity map is not presented; however, we
Figure 2. The UNSWIRF image of maser site G318:95–0:20, with grey-
scale (2.2-mm continuum) and contours (H2 line) as in Fig. 1. This source is
located 2.5 arcmin to the SE of Fig. 1. The plus sign marks the position of
the methanol maser site from Paper II. Contours are from 2, 4, 6, 8, 10, 12
and 14 � 10216 erg cm22 s21 arcsec22.
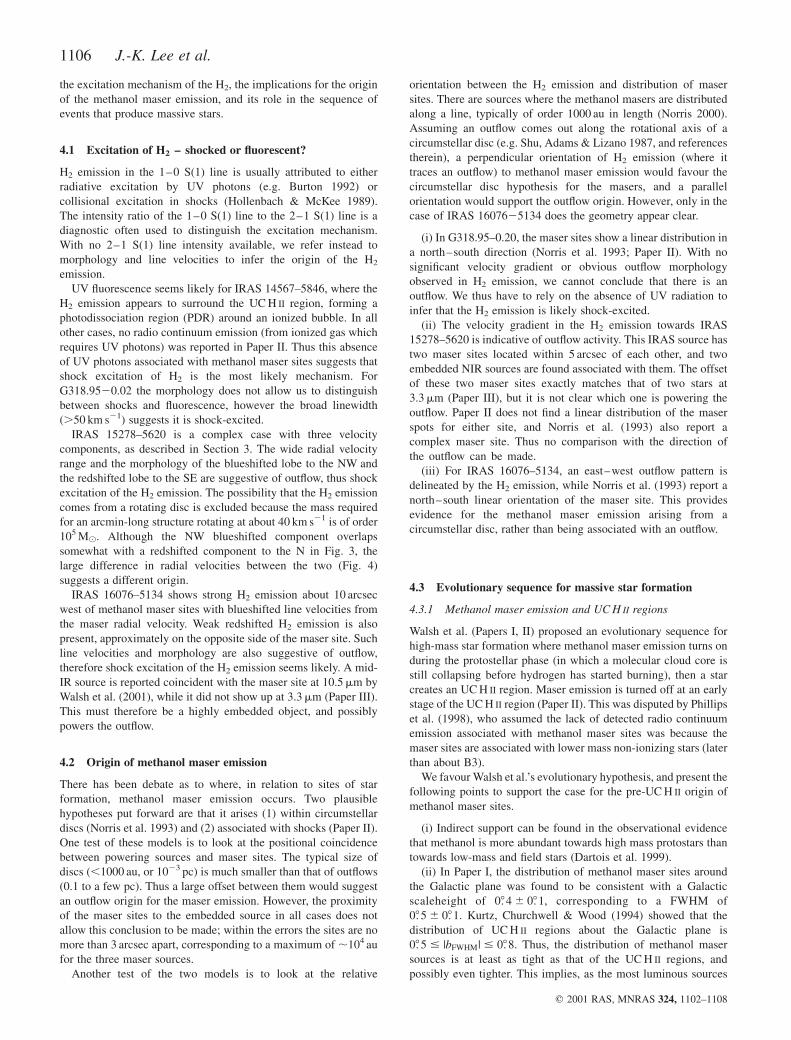
Figure 3. Left: the UNSWIRF image of IRAS 15278–5620, with the grey-scale (2.2-mm continuum) and contour (H2 line) maps as in Fig. 1. The plus signs
indicate the positions of methanol maser sites. Contour levels are 2.5, 5.0, 7.5, 10.0, 12.5 and 15:0 � 10216 erg cm22 s21 arcsec22. Extended H2 emission is seen
to the N and NW, close to and to the SE of the masersites. Right: the line centre velocity map of H2 emission in both grey-scale and contours. Contour levels are
290, 280, 270, 260, 250 and 240 km s21.
1104 J.-K. Lee et al.
q 2001 RAS, MNRAS 324, 1102–1108

note from a Lorentzian fitting of the available frames that the
velocity of the H2 emission extends over at least 50 km s21.
3.3 IRAS 15278–5620 [G323.74–0.26]
Two methanol maser sites ðV lsr ¼ 247:7 to 256:3 and
257.4 km s21; separated by 5 arcsec) were found associated with
two embedded NIR sources (Paper III). The maser sites are located
to the SE of a cluster of stars which exhibit 2.2-mm continuum
nebulosity. The UNSWIRF observation reveals fan-shaped H2
emission north-west (NW) of the maser sites with weak emission to
the SE (Fig. 3). The 2.2-mm continuum emission extends over a
larger area than the H2 line emission does.
The velocity maps (Figs 3 and 4) show three components with
the line centre velocities smoothly changing about a 70 km s21
range (293 to 225 km s21Þ. Two redshifted components are seen;
one being weak redshifted emission to the SE, and the other
,30 arcsec N of the maser sites. The third component is
blueshifted emission to the NW of the maser sites. The second
red component appears to be connected to the blueshifted
component.
3.4 IRAS 16076–5134 [G331.28–0.19]
A knot, slightly elongated along the R.A. axis, is seen 10 arcsec to
the west of the maser site in the 2.2-mm continuum image (Paper
III), pointing towards, but stopping short of, the maser site ðV lsr ¼
285:2 to 278:3 km s21; Fig. 5). Our UNSWIRF data show it is H2
emission, and the H2 line centre velocities range over 13 km s21
(255 to 268 km s21Þ, redshifted relative to the maser emission
velocity. Weaker H2 emission is also present to the south-west
(SW) of the maser site, with velocity ranging from 263 to
244 km s21.
4 D I S C U S S I O N
All sources show excited H2 line emission at 2.12-mm, and the H2
emission associated with the UC H II region is weaker than that
associated with the methanol maser sites. In this section we discuss
Figure 4. Maps of the H2 line emission centre velocity for IRAS 1527825620. The plus signs again mark the position of methanol maser sites. From left to
right, each panel shows velocity components at 242,2 59,2 76 and 293 km s21. The redshifted components in the first and second panels are clearly separated
from the blueshifted components in the fourth.
Figure 5. Left: the UNSWIRF image of IRAS 16076–5134, both in grey-scale (continuum) and contours (H2 line) as in Fig. 1. Contour levels are 2, 4, 6 and
8 � 10216 erg cm22 s21 arcsec22. The H2 emission peaks to the west of a masersite, and coincides with a K-band feature elongated in the R.A. direction. Right:
the line centre velocity map as in Fig. 3. Contour levels are 265, 260 and 255 km s21.
Discovery of H2 associated with methanol masers 1105
q 2001 RAS, MNRAS 324, 1102–1108
the excitation mechanism of the H2, the implications for the origin
of the methanol maser emission, and its role in the sequence of
events that produce massive stars.
4.1 Excitation of H2 – shocked or fluorescent?
H2 emission in the 1–0 S(1) line is usually attributed to either
radiative excitation by UV photons (e.g. Burton 1992) or
collisional excitation in shocks (Hollenbach & McKee 1989).
The intensity ratio of the 1–0 S(1) line to the 2–1 S(1) line is a
diagnostic often used to distinguish the excitation mechanism.
With no 2–1 S(1) line intensity available, we refer instead to
morphology and line velocities to infer the origin of the H2
emission.
UV fluorescence seems likely for IRAS 14567–5846, where the
H2 emission appears to surround the UC H II region, forming a
photodissociation region (PDR) around an ionized bubble. In all
other cases, no radio continuum emission (from ionized gas which
requires UV photons) was reported in Paper II. Thus this absence
of UV photons associated with methanol maser sites suggests that
shock excitation of H2 is the most likely mechanism. For
G318.9520.02 the morphology does not allow us to distinguish
between shocks and fluorescence, however the broad linewidth
(.50 km s21) suggests it is shock-excited.
IRAS 15278–5620 is a complex case with three velocity
components, as described in Section 3. The wide radial velocity
range and the morphology of the blueshifted lobe to the NW and
the redshifted lobe to the SE are suggestive of outflow, thus shock
excitation of the H2 emission. The possibility that the H2 emission
comes from a rotating disc is excluded because the mass required
for an arcmin-long structure rotating at about 40 km s21 is of order
105 M(. Although the NW blueshifted component overlaps
somewhat with a redshifted component to the N in Fig. 3, the
large difference in radial velocities between the two (Fig. 4)
suggests a different origin.
IRAS 16076–5134 shows strong H2 emission about 10 arcsec
west of methanol maser sites with blueshifted line velocities from
the maser radial velocity. Weak redshifted H2 emission is also
present, approximately on the opposite side of the maser site. Such
line velocities and morphology are also suggestive of outflow,
therefore shock excitation of the H2 emission seems likely. A mid-
IR source is reported coincident with the maser site at 10.5mm by
Walsh et al. (2001), while it did not show up at 3.3mm (Paper III).
This must therefore be a highly embedded object, and possibly
powers the outflow.
4.2 Origin of methanol maser emission
There has been debate as to where, in relation to sites of star
formation, methanol maser emission occurs. Two plausible
hypotheses put forward are that it arises (1) within circumstellar
discs (Norris et al. 1993) and (2) associated with shocks (Paper II).
One test of these models is to look at the positional coincidence
between powering sources and maser sites. The typical size of
discs (,1000 au, or 1023 pc) is much smaller than that of outflows
(0.1 to a few pc). Thus a large offset between them would suggest
an outflow origin for the maser emission. However, the proximity
of the maser sites to the embedded source in all cases does not
allow this conclusion to be made; within the errors the sites are no
more than 3 arcsec apart, corresponding to a maximum of ,104 au
for the three maser sources.
Another test of the two models is to look at the relative
orientation between the H2 emission and distribution of maser
sites. There are sources where the methanol masers are distributed
along a line, typically of order 1000 au in length (Norris 2000).
Assuming an outflow comes out along the rotational axis of a
circumstellar disc (e.g. Shu, Adams & Lizano 1987, and references
therein), a perpendicular orientation of H2 emission (where it
traces an outflow) to methanol maser emission would favour the
circumstellar disc hypothesis for the masers, and a parallel
orientation would support the outflow origin. However, only in the
case of IRAS 1607625134 does the geometry appear clear.
(i) In G318:95–0:20, the maser sites show a linear distribution in
a north–south direction (Norris et al. 1993; Paper II). With no
significant velocity gradient or obvious outflow morphology
observed in H2 emission, we cannot conclude that there is an
outflow. We thus have to rely on the absence of UV radiation to
infer that the H2 emission is likely shock-excited.
(ii) The velocity gradient in the H2 emission towards IRAS
15278–5620 is indicative of outflow activity. This IRAS source has
two maser sites located within 5 arcsec of each other, and two
embedded NIR sources are found associated with them. The offset
of these two maser sites exactly matches that of two stars at
3.3mm (Paper III), but it is not clear which one is powering the
outflow. Paper II does not find a linear distribution of the maser
spots for either site, and Norris et al. (1993) also report a
complex maser site. Thus no comparison with the direction of
the outflow can be made.
(iii) For IRAS 16076–5134, an east–west outflow pattern is
delineated by the H2 emission, while Norris et al. (1993) report a
north–south linear orientation of the maser site. This provides
evidence for the methanol maser emission arising from a
circumstellar disc, rather than being associated with an outflow.
4.3 Evolutionary sequence for massive star formation
4.3.1 Methanol maser emission and UC H II regions
Walsh et al. (Papers I, II) proposed an evolutionary sequence for
high-mass star formation where methanol maser emission turns on
during the protostellar phase (in which a molecular cloud core is
still collapsing before hydrogen has started burning), then a star
creates an UC H II region. Maser emission is turned off at an early
stage of the UC H II region (Paper II). This was disputed by Phillips
et al. (1998), who assumed the lack of detected radio continuum
emission associated with methanol maser sites was because the
maser sites are associated with lower mass non-ionizing stars (later
than about B3).
We favour Walsh et al.’s evolutionary hypothesis, and present the
following points to support the case for the pre-UC H II origin of
methanol maser sites.
(i) Indirect support can be found in the observational evidence
that methanol is more abundant towards high mass protostars than
towards low-mass and field stars (Dartois et al. 1999).
(ii) In Paper I, the distribution of methanol maser sites around
the Galactic plane was found to be consistent with a Galactic
scaleheight of 08: 4 ^ 08: 1, corresponding to a FWHM of
08: 5 ^ 08: 1. Kurtz, Churchwell & Wood (1994) showed that the
distribution of UC H II regions about the Galactic plane is
08: 5 # |bFWHM| # 08: 8. Thus, the distribution of methanol maser
sources is at least as tight as that of the UC H II regions, and
possibly even tighter. This implies, as the most luminous sources
1106 J.-K. Lee et al.
q 2001 RAS, MNRAS 324, 1102–1108
have the tightest distribution about the Galactic plane, that the
majority of methanol maser sites come from the most luminous
(ionizing) stars in the Galaxy. This is inconsistent with Phillips
et al.’s assumption that maser emission is excited by non-ionizing
stars. As 75 per cent of the maser sites are not associated with
UC H II regions, yet their distribution about the Galactic plane is at
least as tight, it seems unlikely they are all associated with non-
ionizing stars.
(iii) In Paper II, it was found that those UC H II regions
associated with methanol maser sites are smaller, and thus
presumably younger, than the general population of UC H II
regions imaged in that survey. This suggests the maser emission
is seen at the earliest stages of formation of an UC H II region and
disappears as the UC H II region evolves and expands.
(iv) One methanol maser source (IRAS 15541–5349Þ reported in
Paper III was found to have an associated embedded source with a
bolometric luminosity (inferred from the IR luminosity) commen-
surate with that of an ionizing star. However, no radio continuum
emission was detected, i.e. when such a (ionizing) star is present, a
UCH II region has not yet formed. This is supporting evidence for the
pre-UC H II origin of methanol maser emission, i.e. when this type
of (ionizing) star is present, an UC H II region has not yet formed.
(v) Cesaroni et al. (1994) reported the detection of hot ammonia
cores towards three massive star-forming regions (G9.6210.19,
G29.9620.02, and G31.4110.31), which were interpreted as a pre-
main-sequence stage of massive star formation. In each case, there
is methanol maser emission associated with the ammonia clump
(Paper II). Both the maser sites and ammonia clumps are offset
from an UC H II region. This again supports the pre-UC H II origin
of methanol maser emission.
(v) The results of this paper show methanol maser emission is
associated with the powering sources of outflows, traced by
shocked H2 emission. Such outflows are thought to occur only
during an early stage of star formation.
These points demonstrate that the majority of methanol maser
sites are indeed associated with massive (possibly ionizing) stars
before the UC H II region can be seen. As methanol maser emission
is easily detectable throughout the Galaxy, and as it signposts such
an early stage in massive star formation, it is potentially the most
useful tool currently available for identifying massive protostellar
sources. It is still possible, however, that a number of maser sites
arise from lower mass (non-ionizing) stars because there is no a
priori reason why the stellar mass cut-off limit for maser emission
should be the same as that of ionizing radiation. In such a case, the
number of these non-ionizing stars, inferred from the tight
distribution of methanol maser sites around the Galactic plane,
must be small compared with the number of maser sites associated
with pre-UC H II ionizing stars.
4.3.2 Methanol maser emission and HMCs
The existence of compact, dense hot molecular cores (HMCs) has
been well established by various observations (eg. Plume, Jaffe &
Evans 1992). HMCs are believed to be sites of massive star
formation (Kurtz et al. 2000), and may represent an earlier stage in
the star formation process than UC H II regions (Codella, Testi &
Cesaroni 1997). Hot core chemistry has shown that molecules,
such as ammonia, water and methanol on the icy grain mantles,
evaporate at the temperature ($100 K) of HMCs over a time-scale
of 104 to 105 yr (see review by van Dishoeck & Blake 1998). Now
with HMCs being the sites of massive star formation and with
methanol maser emission signposting an earlier stage of massive
star formation, we hypothesize that the methanol maser emission
comes from HMCs.
An interesting question to address is that of when methanol
maser emission commences and terminates? When a massive
stellar core is formed from the infall of gaseous material, it reaches
the main sequence before it stops accreting. This is followed by
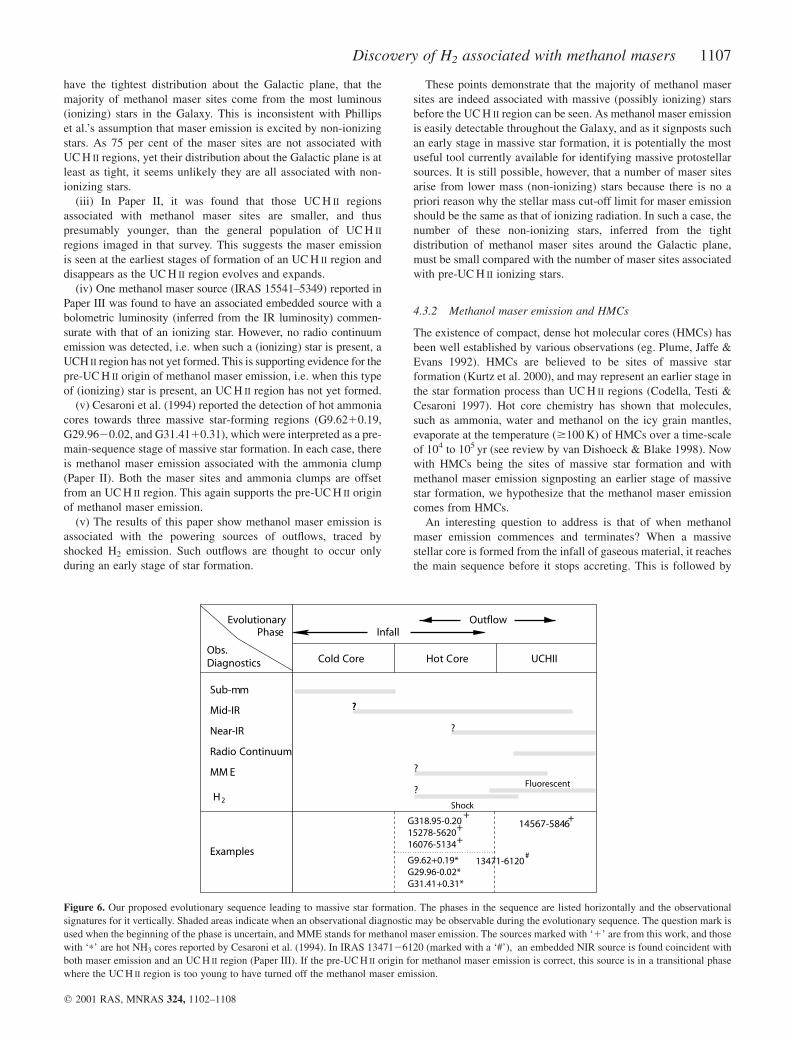
Figure 6. Our proposed evolutionary sequence leading to massive star formation. The phases in the sequence are listed horizontally and the observational
signatures for it vertically. Shaded areas indicate when an observational diagnostic may be observable during the evolutionary sequence. The question mark is
used when the beginning of the phase is uncertain, and MME stands for methanol maser emission. The sources marked with ‘1’ are from this work, and those
with ‘*’ are hot NH3 cores reported by Cesaroni et al. (1994). In IRAS 1347126120 (marked with a ‘#’), an embedded NIR source is found coincident with
both maser emission and an UC H II region (Paper III). If the pre-UC H II origin for methanol maser emission is correct, this source is in a transitional phase
where the UC H II region is too young to have turned off the methanol maser emission.
Discovery of H2 associated with methanol masers 1107
q 2001 RAS, MNRAS 324, 1102–1108

formation of an UC H II region, with copious UV photons produced
by the star (Garay & Lizano 1999). We propose that the formation
of massive stars begins in HMCs where (1) heat from contraction
releases methanol from the grain surface into the gas phase; (2) the
gas is compressed, by outflows and/or in circumstellar discs, to
create a sufficient column for masing – this stage is signposted by
methanol maser emission and shocked H2 line emission; (3) As the
UC H II region expands, it turns off methanol maser emission and
forms a PDR envelope where H2 is excited by UV fluorescence.
This scenario is summarized in Fig. 6, where we attempted to fit
observational diagnostics of massive star formation into the
evolutionary sequence they represent. Based on this, we suggest
that UC H II region IRAS 1456725864 is at a later stage of massive
star formation than other methanol maser sources observed. Hot
ammonia cores from Cesaroni et al. (1994) are also presented in
their corresponding evolutionary stage in Fig. 6.
There are questions still unanswered. When does methanol
maser emission commence and terminate? Does it commence
during the infall/accretion phase or later in the outflow phase? How
long does methanol maser emission survive after an UC H II region
has formed? One test is to look for cold molecular cores in the
submillimetre, and determine any association with methanol maser
emission. Such an association would be definite proof of the
methanol maser emission being the signpost of an early stage of
massive star formation. In addition, spectral energy distributions of
the powering sources would help determine their spectral type,
enabling us to discern between the pre-UC H II origin and non-
ionizing star origin for methanol maser emission.
5 S U M M A RY
We report the discovery of H2 1–0 S(1) 2.12-mm line emission
associated with one UC H II region and three methanol maser sites.
The H2 emission is excited by UV fluorescence in the case of the
UC H II region IRAS 14567–5846, and traces the outer boundary of
the UC H II region. The other three regions ðG318:95–0:20, IRAS
15278–5620 and IRAS 16076–5134Þ all show convincing evidence
for shock-excited H2 emission: G318:95–0:20 shows strong H2
emission, but no outflow can be discerned in either the morphology
or the velocity structure of H2 emission. IRAS 15278–5620 shows
a fan-shaped, blueshifted outflow, stemming from two sites of
maser emission. It is not clear which source is powering the
outflow. Extended H2 emission is also found to the north of the
maser sites, but we suspect that this arises from a separate source.
In the case of IRAS 16076–5134, we report the detection of an
outflow shown by highly blueshifted H2 emission offset from an
extremely deeply embedded object, the maser emission of which
falls along a line perpendicular to that of the outflow. We interpret
this as evidence of a circumstellar disc origin for the maser
emission. Along with the detection of outflows traced by H2
emission in this paper, we summarize evidence available to support
the hypothesis that methanol maser emission appears before
UC H II regions. Then we propose further that the methanol gas,
released from grains in HMCs, is compressed to emit maser
emission either by outflows or in circumstellar discs of protostars.
H2 is excited by shocks during the outflow phase, and by UV
photons later during the UC H II region phase. An evolutionary
sequence leading to massive star formation is proposed.
AC K N OW L E D G M E N T S
We thank the AAT staff for their support during the observations,
and Drs Lori Allen and Stuart Ryder for their valuable help during
the UNSWIRF reduction.
R E F E R E N C E S
Allen D. A. et al., 1993, Proc. Astron. Soc. Aust., 10, 298
Burton M. G., 1992, Aust. J. Phys., 45, 463
Caswell J., Vaile R., Ellingsen S., Whiteoak J., Norris R., 1995, MNRAS,
272, 96
Cesaroni R., Churchwell E., Hofner P., Walmsley M., Kurtz S., 1994, A&A,
288, 903
Codella C., Testi L., Cesaroni R., 1997, A&A, 325, 282
Dartois E., Schutte W., Geballe T., Demyk K., Ehrenfreund P.,
d’Hendecourt L., 1999, A&A, 342, L32
Ellingsen S., Norris R., McCulloch P., 1996, MNRAS, 279, 101
Garay G., Lizano S., 1999, PASP, 111, 1049
Hollenbach D., McKee C. F., 1989, ApJ, 342, 306
Kawamura J. H., Masson C. R., 1998, ApJ, 509, 270
Kurtz S., Churchwell E., Wood D., 1994, ApJS, 91, 659
Kurtz S., Cesaroni R., Churchwell E., Hofner P., Walmsley M., 2000, in
Mannings V., Boss A., Russell S., eds, Protostars and Planets IV. Univ.
Arizona Press, Tucson, p. 299
Menten K. M., 1991, ApJ, 380, 75
Menten K. M., 1996, in van Dishoeck E. F., ed, IAU Symp. 178, Molecules
in astrophysics: probes and processes. Kluwer, Dordrecht, p. 163
Norris R. P., 2000, in Minh Y. C., van Dishoeck E. F., eds, IAU Symp. 197:
Astrochemistry – From Molecular Clouds to Planetary Systems.
Astron. Soc. Pac., San Francisco, p. 223
Norris R. P., Whiteoak J. B., Caswell J. L., Wieringa M. H., Gough R. G.,
1993, ApJ, 412, 222
Norris R. P. et al., 1998, ApJ, 508, 275
Phillips C. J., Norris R. P., Ellingsen S. P., McCulloch P. M., 1998, MNRAS,
300, 1131
Plume R., Jaffe D. T., Evans N. J., II, 1992, ApJ, 78, 505
Ryder S. D., Sun Y.-S., Ashley M. C. B., Burton M. G., Allen L. E., Storey
J. W. V., 1998, Proc. Astron. Soc. Aust., 15, 228
Shu F. H., Adams F. C., Lizano S., 1987, ARA&A, 25, 23
Slysh V., Val’tts I., Kalenskii S., Voronkov M., Palagi F., Tofani G., Catarzi
M., 1999, A&A, 134, 115
van Dishoeck E. F., Blake G. A., 1998, ARA&A, 36, 317
Walsh A. J., Hyland A. R., Robinson G., Burton M. G., 1997, MNRAS, 291,
261 (Paper I)
Walsh A. J., Burton M. G., Hyland A. R., Robinson G., 1998, MNRAS, 301,
640 (Paper II)
Walsh A. J., Burton M. G., Hyland A. R., Robinson G., 1999, MNRAS, 309,
905 (Paper III)
Walsh A. J., Bertoldi F., Burton M. G., Nikola T., MNRAS, 2001, in press
This paper has been typeset from a TEX/LATEX file prepared by the author.
1108 J.-K. Lee et al.
q 2001 RAS, MNRAS 324, 1102–1108