discovering social networks from enterprise data laks v.s. lakshmanan based on: wil m.p. van der...
TRANSCRIPT
Discovering Social Networks from Enterprise Data
Laks V.S. Lakshmanan Based on: Wil M.P. van der Aalst, Hajo A. Reijers, Minseok Song. Discovering Social Networks from Event Logs. Full version of paper in Business Process Management (BPM) 2004.
General Remarks Discovering/mining SN from (some) data
vs. mining a given SN for extracting some value (we’re talking about the former here).
What kind of data: ◦Can be email ◦Event log from a business process (this paper) ◦Video capturing interactions
Event log – also called audit trail, history, transaction file.
Project opportunity here. 2
Model Events = {(case, activity, person), ... ordered by
time}. Case (process instance) = “thing” being handled:
e.g., customer order, job app., building permit, license app., loan app, insurance claim etc.
Activity (task, operation, action, work-item) = some operation performed on the case by a person: e.g., contact customer, check credit rating, contact references, visit site etc.
What do you look for?: ◦ Is there a handover? (e.g., (c,a1,p1)(c,a2,p2)). ◦ Does it happen often enough? ◦ What are the org roles of persons involved?
3
Process Mining – A Related Area
Given an event log, mine a process, which can be: ◦A Petri net. ◦A model with org/temporal/info/social
aspects (most relevant to us). ◦Here is an example log and an
example social graph we can extract right away, based on handover or “immediately followed by” on a case.
4
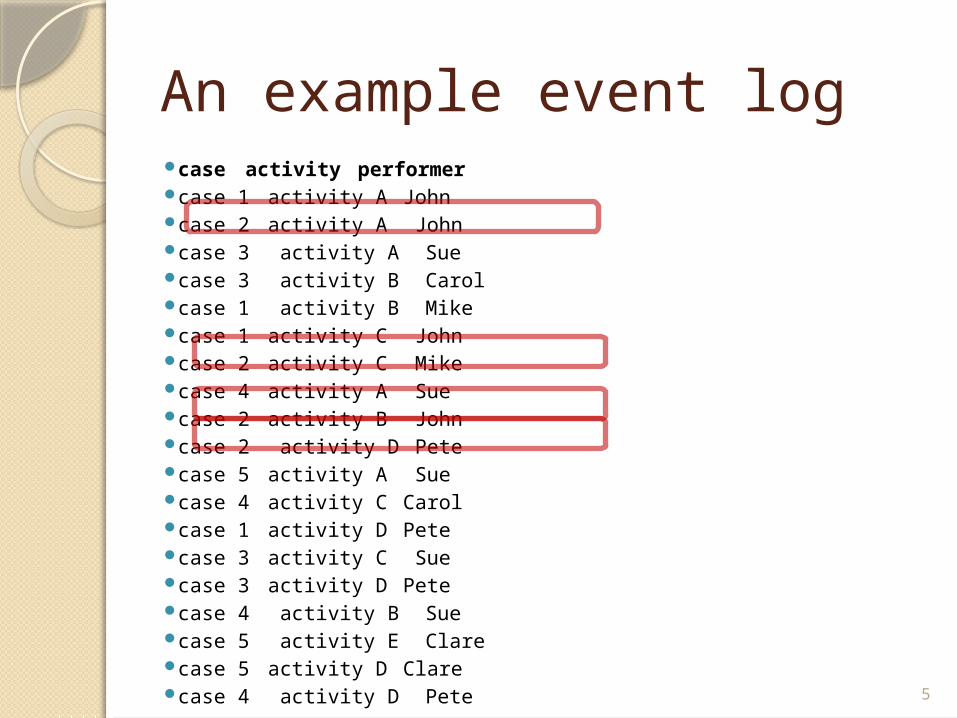
An example event log case activity performer case 1 activity A John case 2 activity A John case 3 activity A Sue case 3 activity B Carol case 1 activity B Mike case 1 activity C John case 2 activity C Mike case 4 activity A Sue case 2 activity B John case 2 activity D Pete case 5 activity A Sue case 4 activity C Carol case 1 activity D Pete case 3 activity C Sue case 3 activity D Pete case 4 activity B Sue case 5 activity E Clare case 5 activity D Clare case 4 activity D Pete
5
Social Graph Mined John
Sue
Mike
Carol
Pete
Clare
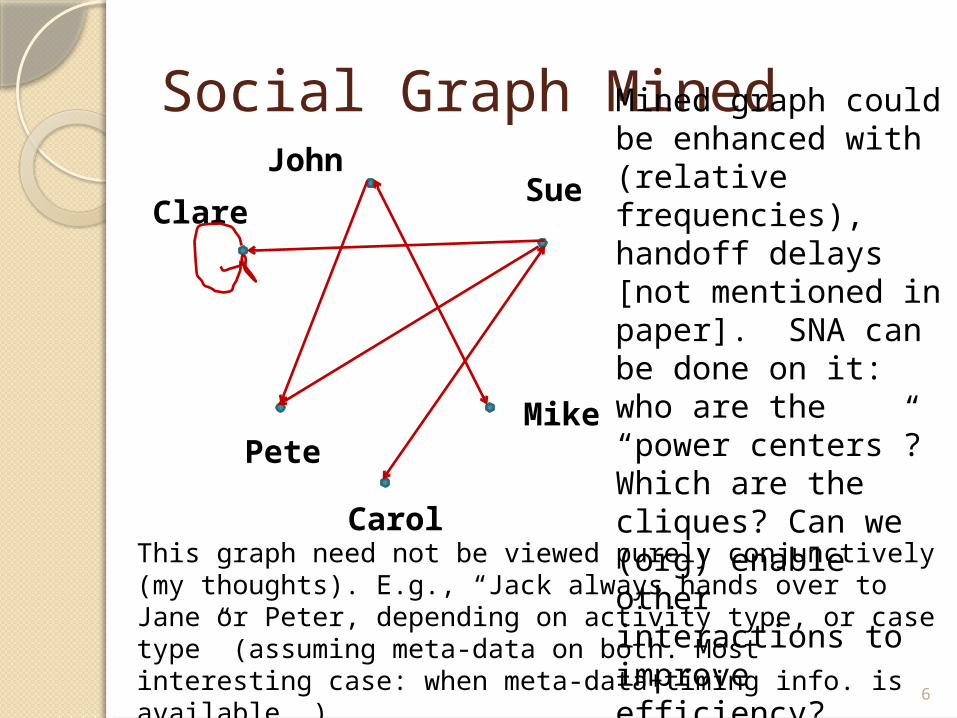
Mined graph could be enhanced with (relative frequencies), handoff delays [not mentioned in paper]. SNA can be done on it: who are the “power centers”? Which are the cliques? Can we (org) enable other interactions to improve efficiency? ...
This graph need not be viewed purely conjunctively (my thoughts). E.g., “Jack always hands over to Jane or Peter, depending on activity type, or case type” (assuming meta-data on both. Most interesting case: when meta-data+timing info. is available. )
6
Some challenges (in)completeness: log may not
exhibit all possible orders (when concurrency is in the underlying model); rare occurrences and exceptions (both + and –) should be handled with care.
noise: data could be missing and/or erroneous.
legal issues: affect quality/utility/granularity of data available, if at all. 7
Social Network Analysis Here are some interesting measuremenets
one can make on the mined SN. Convention: distance for us = distance of
geodesic, unless otherwise stated; duv = distance between u and v.
What is the density of the whole graph (sociocentric) or of a person’s neighborhood network (egocentric)?: density = #edges/possible no.; what is the diameter?
What is the average distance of v to other nodes? What proportion of the geodesics between other node pairs passes through v?
8
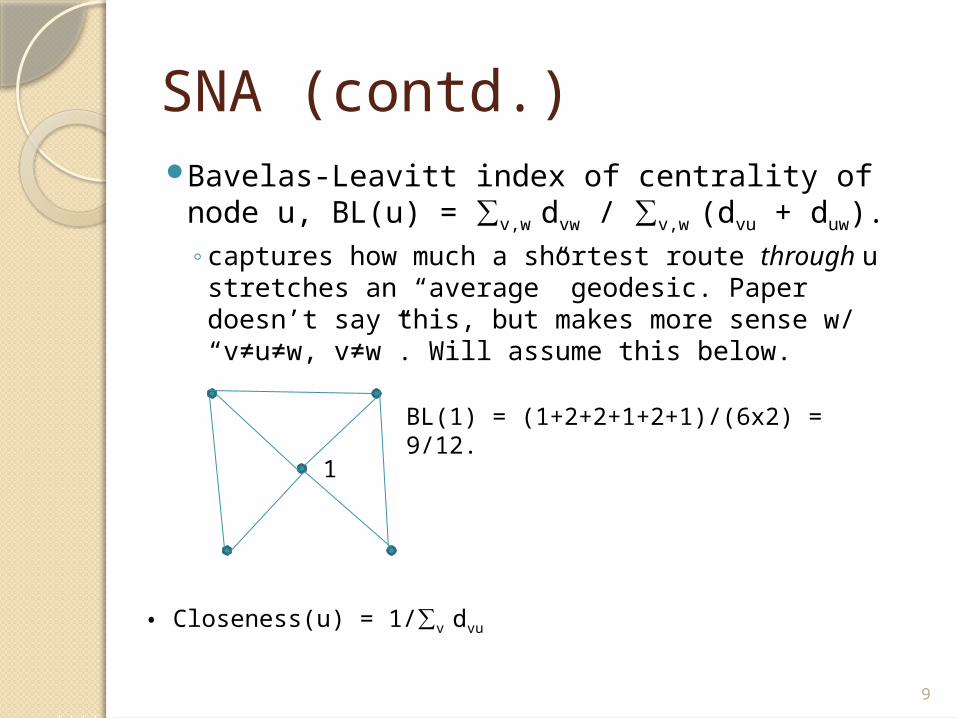
SNA (contd.) Bavelas-Leavitt index of centrality of node u,
BL(u) = ∑v,w dvw / ∑v,w (dvu + duw). ◦ captures how much a shortest route through u
stretches an “average” geodesic. Paper doesn’t say this, but makes more sense w/ “v≠u≠w, v≠w”. Will assume this below.
1
BL(1) = (1+2+2+1+2+1)/(6x2) = 9/12.
• Closeness(u) = 1/∑v dvu
9
Digression into process mining Efficient algorithms exist for mining
a process model from an event log. Can reveal if true causality exists
between activities. E.g., can say process = A followed
by one of {B,C} in any order OR E, then followed by D.
Note: Will use this later for discriminating between causal and non-causal transfers of work.
10
A slightly more general def. of event log Let A be a set of activities and P a set of
performers. E = A×P is the set of (possible) events, i.e., combinations of an activity and a performer ((a, p) denotes the execution of
activity a by performer p). C = E∗ is the set of possible event sequences (traces describing a case). L ∈ B(C) is an event log, where B(C) is the set of all bags (multi-sets) over C.
How does this def. abstract actual event logs? Notation: π$a(e) = a and π$p(e) = p for event
e = (a, p).
11
Mining SN from an event log Can use a mining algorithm
analogous to frequent itemset mining or more specifically episode mining (to be overviewed soon).
Key is choosing the right metric for filtering arcs.
Some metrics look at just transfer of work, some insist on causality (need knowledge of process). 12
Metrics based on (possible) causality Direct and indirect succession
(direct a special case): e.g., John-1->Mike, John-3->Pete.
With or without checking causality: e.g., Mike=1=>John is false and Mike=2=>Pete is true (taking causality into account).
Boolean vs count version: |John-1->Mike| = 2; |Mike=2=>Pete| = 2. (Verify using log table.)
13
Metrics based on work transfer p-X->q = #times p transferred work to
q/total #possible such times: e.g., John-X->Mike = 2/(3+3+3+3+2).
p-.X->q = #cases in which p transferred work to q at least once/length of log.
p-βX->q = same as p-X->q, except longer successions (length n) are penalized by βn-
1, where 0<β<1. P-β.X->q = same as p-βX->q, except only
count distinct successions within each case.
β – “causality fall factor”. 14
“In between” metrics p-◊n->q = p did some action at i
and some other at i+n, and q did some action at j: i<j<i+n.
||p-◊2->q|| = total #times a “◊2-in-between” occurred between p and q/total #possible such occurrences.
We can inject causality into this. We can introduce causality fall
factor β here too. 15
Working together metric p cq = p and q do some action (not
necessarily same) for case c. Then p Lq = #cases on which they worked together/#cases on which p worked (does that remind you of some familiar measure?).
E.g., John L Pete = 2/2 whereas Pete L
John = 2/4. Can compute a matrix of users x actions
with M[u,a] = #times u did a (e.g.). Then use row vectors (users) to define similarity (similarly to what we will do in RecSys!)
16
Patterns Found Conducted on Dutch national
public works dept. Responsible for road and water infrastructure. ◦17 activities, 4,988 cases, 33,603
lines of log, and 43 employees (users).
17
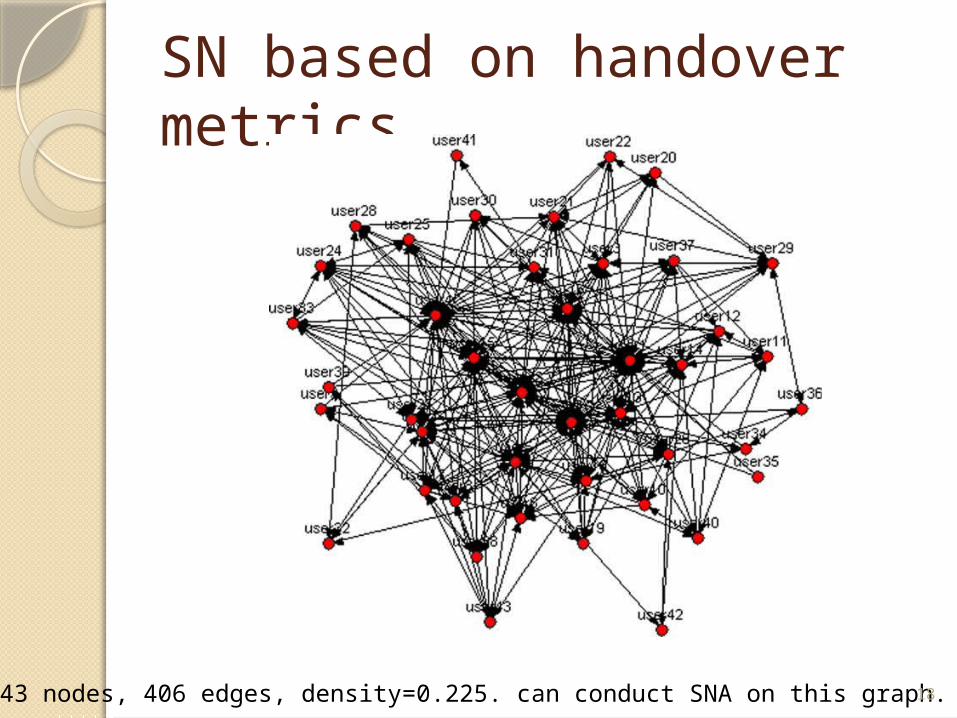
SN based on handover metrics
43 nodes, 406 edges, density=0.225. can conduct SNA on this graph. 18
Concluding Remarks See paper for other SN mined by
using different metrics. Challenges:
◦scalability of actually mining SN using different metrics.
◦Scalability of conducting requisite SNA on the mined networks.
19
Other Questions Can you think of other things
worth measuring in event logs? Key is measured
patterns/quantities should be actionable and should yield value for business.
20
Other Social Network Discovery Papers (for your talks) Ting Yu; Lim, S.-N.; Patwardhan, K.;
Krahnstoever, N., "Monitoring, recognizing and discovering social networks," Computer Vision and Pattern Recognition, 2009. CVPR 2009. IEEE Conference on , vol., no., pp.1462,1469, 20-25 June 2009.
Sinisa Pajevic and Dietmar Plenz. Efficient Network Reconstruction from Dynamical Cascades Identifies Small-World Topology of Neuronal Avalanches. PLoS Comput Biol. 5(1), 2009.
21