discover better designs, faster. · optimization 18-19 propeller cavitation 14-17 propeller...
TRANSCRIPT
Discover better designs, faster.Multidisciplinary simulation and design exploration in the Marine industry.
CONTENTS
10-13COMPLEX FLOW
PROBLEMS
6-9TWIN MARINE
LIFTER
4-5INTRODUCTION -
DEJAN RADOSAVLJEVIC
20-23HYDRODYNAMIC HULL
OPTIMIZATION
18-19PROPELLER CAVITATION
14-17PROPELLER
OPTIMIZATION
34-37SOLVING THE
DOLPHIN CONUNDRUM
30-33BALLAST WATER MANAGEMENT
24-29OFFSHORE FLOATER
DESIGN
CONTENTS
TIME = MONEY
52-53DR. MESH TALKS EHP
46-51CONFLICTING OBJECTIVES
IN SHIP DESIGN
42-45SKIFF R3 DESIGN
62-66INTERVIEW WITH CAPE HORN ENGINEERING
58-61NUMERICAL TOWING
TANKS
54-57ENERGY SAVING
DEVICES
38-41OPTIMIZATION OF
SPORTING VESSEL
72-74NEW CFD TRENDS
68-71THE BECKER
MEWIS DUCT®
CONTENTS

4 SPECIAL REPORT
INTRODUCTION DEJAN RADOSAVLJEVIC
5SPECIAL REPORT
transition, the advent of sophisticated simulation and optimization technologies (such as HEEDS), and the availability of ever-increasing computing power, the only remaining obstacle is the traditional design approach still deeply root ed in the marine industry thinking process.
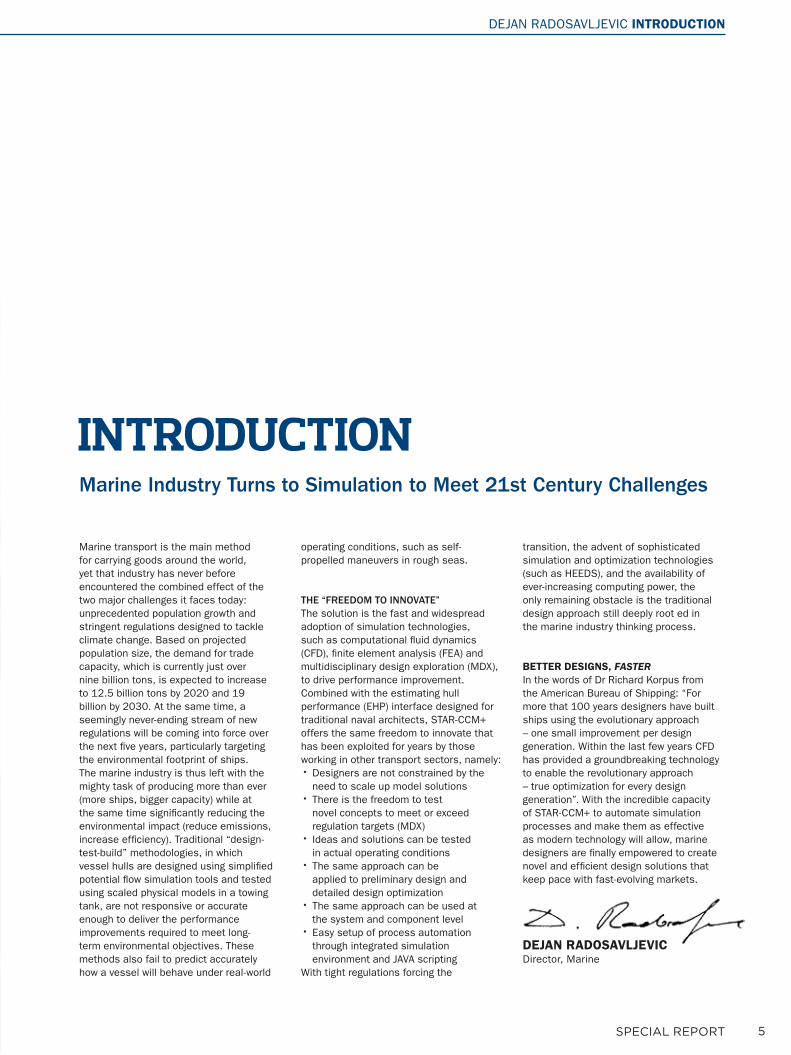
BETTER DESIGNS, FASTERIn the words of Dr Richard Korpus from the American Bureau of Shipping: “For more that 100 years designers have built ships using the evolutionary approach – one small improvement per design generation. Within the last few years CFD has provided a groundbreaking technology to enable the revolutionary approach – true optimization for every design generation”. With the incredible capacity of STAR-CCM+ to automate simulation processes and make them as effective as modern technology will allow, marine designers are finally empowered to create novel and efficient design solutions that keep pace with fast-evolving markets.
INTRODUCTION
DEJAN RADOSAVLJEVIC INTRODUCTION
Marine transport is the main method for carrying goods around the world, yet that industry has never before encountered the combined effect of the two major challenges it faces today: unprecedented population growth and stringent regulations designed to tackle climate change. Based on projected population size, the demand for trade capacity, which is currently just over nine billion tons, is expected to increase to 12.5 billion tons by 2020 and 19 billion by 2030. At the same time, a seemingly never-ending stream of new regulations will be coming into force over the next five years, particularly targeting the environmental footprint of ships.The marine industry is thus left with the mighty task of producing more than ever (more ships, bigger capacity) while at the same time significantly reducing the environmental impact (reduce emissions, increase efficiency). Traditional “design-test-build” methodologies, in which vessel hulls are designed using simplified potential flow simulation tools and tested using scaled physical models in a towing tank, are not responsive or accurate enough to deliver the performance improvements required to meet long-term environmental objectives. These methods also fail to predict accurately how a vessel will behave under real-world
DEJAN RADOSAVLJEVICDirector, Marine
Marine Industry Turns to Simulation to Meet 21st Century Challenges
operating conditions, such as self-propelled maneuvers in rough seas.
THE “FREEDOM TO INNOVATE” The solution is the fast and widespread adoption of simulation technologies, such as computational fluid dynamics (CFD), finite element analysis (FEA) and multidisciplinary design exploration (MDX), to drive performance improvement.Combined with the estimating hull performance (EHP) interface designed for traditional naval architects, STAR-CCM+ offers the same freedom to innovate that has been exploited for years by those working in other transport sectors, namely:• Designers are not constrained by the
need to scale up model solutions• There is the freedom to test
novel concepts to meet or exceed regulation targets (MDX)
• Ideas and solutions can be tested in actual operating conditions
• The same approach can be applied to preliminary design and detailed design optimization
• The same approach can be used at the system and component level
• Easy setup of process automation through integrated simulation environment and JAVA scripting
With tight regulations forcing the
6 SPECIAL REPORT
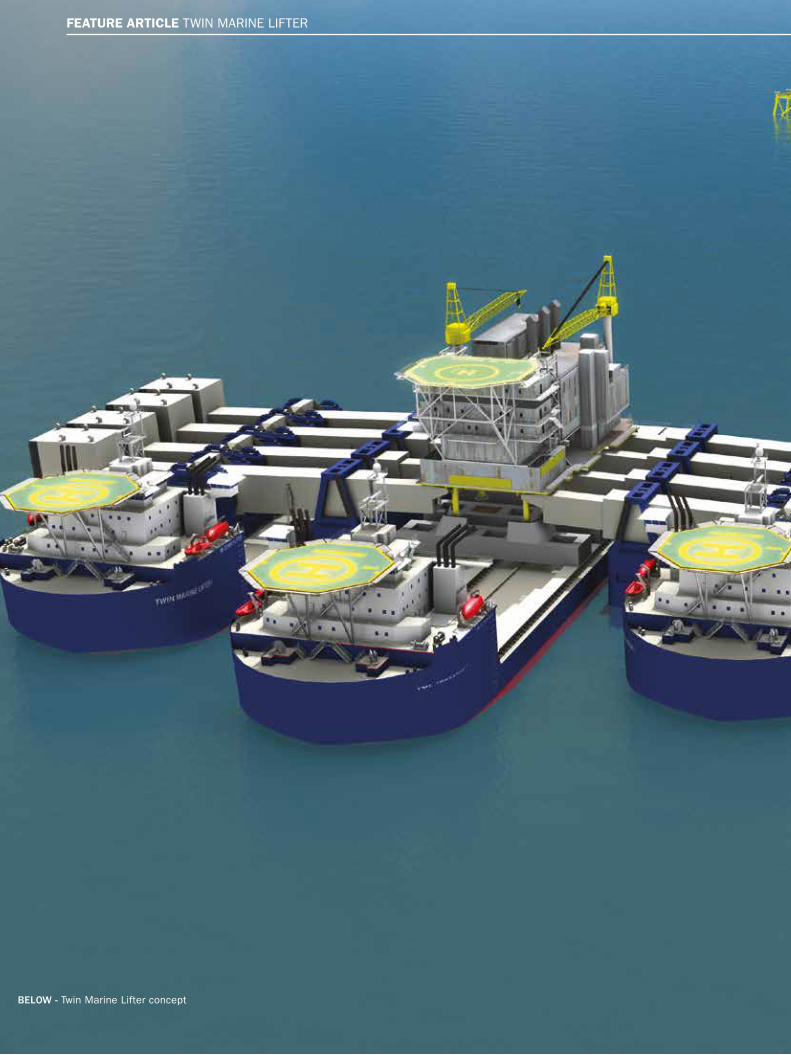
BELOW - Twin Marine Lifter concept
FEATURE ARTICLE TWIN MARINE LIFTER
7SPECIAL REPORT
Twin Marine Heavylift AS (TMHL) is designing the Twin Marine Lifter system for installing and removing platforms. Each of the two heavy lifters has 4 rectangular buoyancy elements at one side, helping to lift the platform (on site) and place it on the bigger transport vessel. The buoyancy tanks are a challenge when assessing both resistance and course stability. DNV was called to assess the viscous resistance in calm water, the forces on the buoyancy tanks and course stability.
Resistance Calculation for the Twin Marine Lifter
Transporting the platforms from one location offshore to onshore for dismantling and recycling is a cheaper and more environmentally friendly option than destroying them offshore. Twin Marine conceived a system that achieves this using a Twin Marine Lifter system (TML). The system features buoyancy tanks on one side of the ship, which help lifting the platform by taking part of the weight. The ship is 133m long and 40m wide, with a transit draught of 5.35m. The buoyancy tanks are rather large, with a rectangular section of 10m x 12m. In transit condition, the draught of the buoyancy tanks is 8.9m.
Obviously, the presence of large blunt bodies at the side of the ship will have a large influence on the resistance and course stability. Vortex shedding is certain to be an issue for flow analysis. In addition, the interaction between the buoyancy tanks and the hull is another problem to tackle.
The simulations were performed using STAR-CCM+®. Two grids were used in order to check the sensitivity of the results to grid coarseness, using around 4 and 5 millions cells respectively. Trimmed cells were used, with prisms layers around the hull and tanks and increased refinement in their vicinity.
The prescribed ship motion was advancing head-on, with no incidence angle to the flow. The simulations were performed for velocities of 3, 5, 7 and 10kn. For the 3 and 5kn simulations, the free surface was not considered. The ship and tanks were not allowed to sink and trim; they were considered on even keel.
RESULTS The presence of the tanks makes it difficult to validate the results against traditional hulls predictions. It was decided to check the methodology by performing a simulation of the bare hull, without the tanks and with no free surface effects. Therefore, the results refer to the viscous resistance only, and as such can be compared with the ITTC ’57 formula.
Even so, as the ITTC ’57 formula refers to a flat plate, a shape coefficient must be employed. The value of the shape coefficient was estimated to be 0.35 for a perfect match with the results. But considering that a typical value for a Very-Large Crude Carriers (VLCCs) is about 0.25 and that the VLCCs bodies in our case are more slender and streamlined than average, the value of 0.35 seems realistic.
TWIN MARINE LIFTER FEATURE ARTICLE
Cosmin Ciortan, Kåre BakkenDNV (now DNV GL)
EXTREME WEIGHT LIFTING
8 SPECIAL REPORT
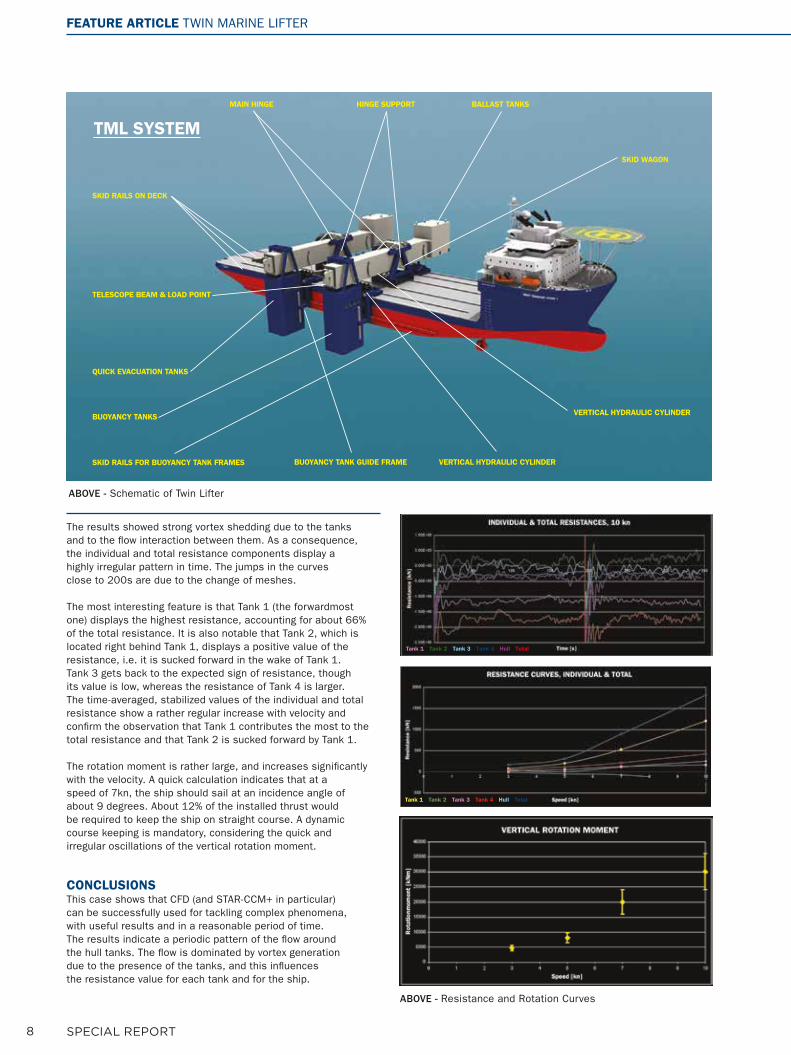
The results showed strong vortex shedding due to the tanks and to the flow interaction between them. As a consequence, the individual and total resistance components display a highly irregular pattern in time. The jumps in the curves close to 200s are due to the change of meshes.
The most interesting feature is that Tank 1 (the forwardmost one) displays the highest resistance, accounting for about 66% of the total resistance. It is also notable that Tank 2, which is located right behind Tank 1, displays a positive value of the resistance, i.e. it is sucked forward in the wake of Tank 1. Tank 3 gets back to the expected sign of resistance, though its value is low, whereas the resistance of Tank 4 is larger. The time-averaged, stabilized values of the individual and total resistance show a rather regular increase with velocity and confirm the observation that Tank 1 contributes the most to the total resistance and that Tank 2 is sucked forward by Tank 1.
The rotation moment is rather large, and increases significantly with the velocity. A quick calculation indicates that at a speed of 7kn, the ship should sail at an incidence angle of about 9 degrees. About 12% of the installed thrust would be required to keep the ship on straight course. A dynamic course keeping is mandatory, considering the quick and irregular oscillations of the vertical rotation moment.
CONCLUSIONS This case shows that CFD (and STAR-CCM+ in particular) can be successfully used for tackling complex phenomena, with useful results and in a reasonable period of time. The results indicate a periodic pattern of the flow around the hull tanks. The flow is dominated by vortex generation due to the presence of the tanks, and this influences the resistance value for each tank and for the ship.
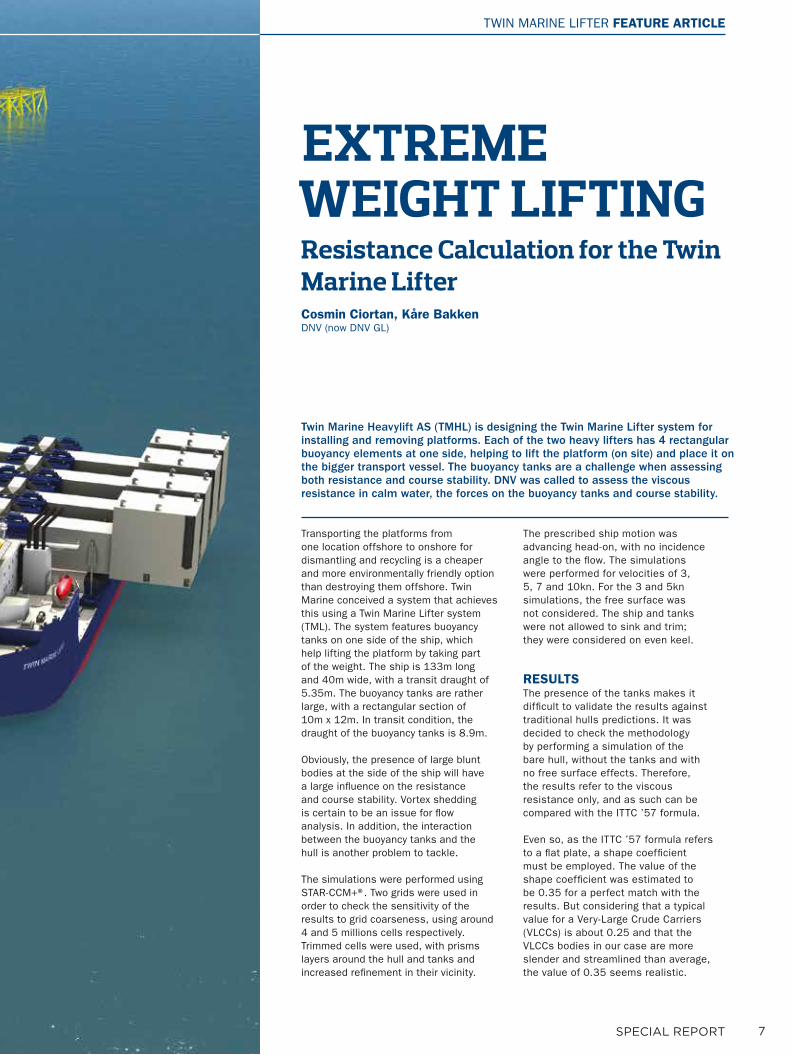
TML SYSTEM
SKID RAILS ON DECK
SKID RAILS FOR BUOYANCY TANK FRAMES
TELESCOPE BEAM & LOAD POINT
QUICK EVACUATION TANKS
MAIN HINGE HINGE SUPPORT BALLAST TANKS
BUOYANCY TANKS
BUOYANCY TANK GUIDE FRAME VERTICAL HYDRAULIC CYLINDER
VERTICAL HYDRAULIC CYLINDER
SKID WAGON
ABOVE - Schematic of Twin Lifter
ABOVE - Resistance and Rotation Curves
Tank 1 Tank 2 Tank 3 Tank 4 Hull Total
Tank 1 Tank 2 Tank 3 Tank 4 Hull Total
FEATURE ARTICLE TWIN MARINE LIFTER
9SPECIAL REPORT
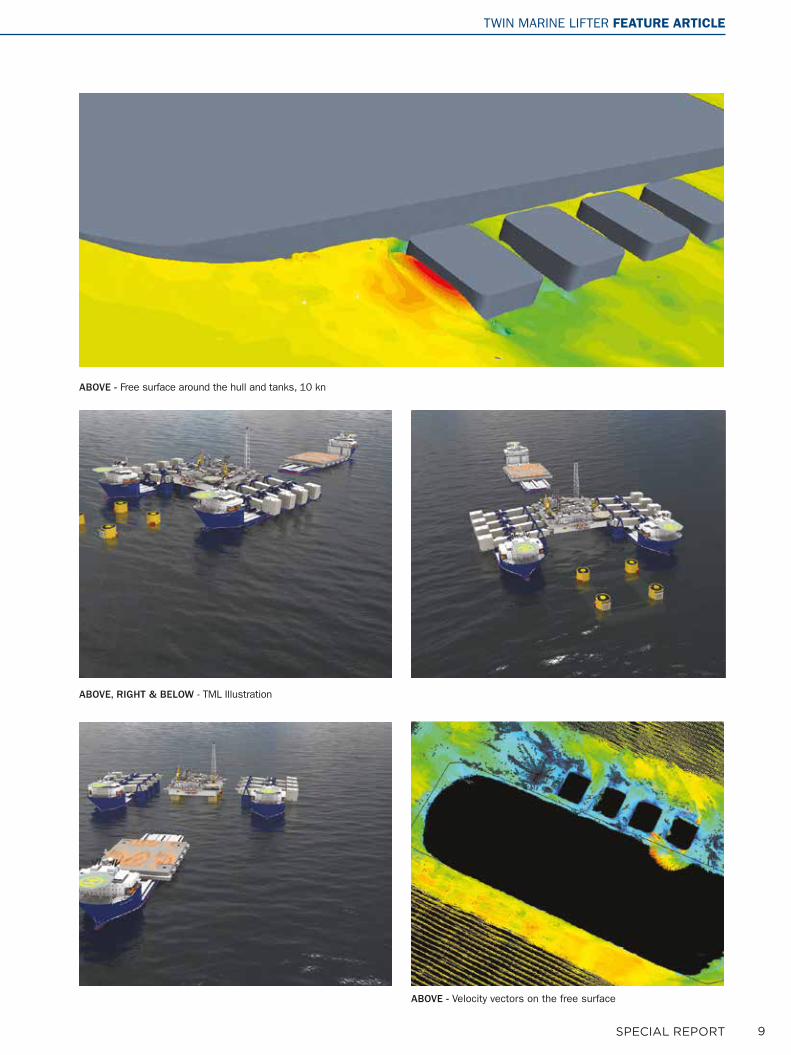
ABOVE - Velocity vectors on the free surface
ABOVE - Free surface around the hull and tanks, 10 kn
ABOVE, RIGHT & BELOW - TML Illustration
TWIN MARINE LIFTER FEATURE ARTICLE
10 SPECIAL REPORT
As the application of CFD to design, evaluation and optimization of ships and off-shore structures in their early development stage increases, and more complex geometries and operations are being considered, a thorough knowledge and a solid experience of the CFD tools--including validation against experiments - is required to meet the present and future challenges related to practical flow problems.
To test and demonstrate the capabilities of RANS-based CFD in connection with complex ship flows, FORCE Technology, MAN Diesel A/S and DTU
in Denmark have recently been involved in a project under DCMT [Danish Centre for Maritime Technology].
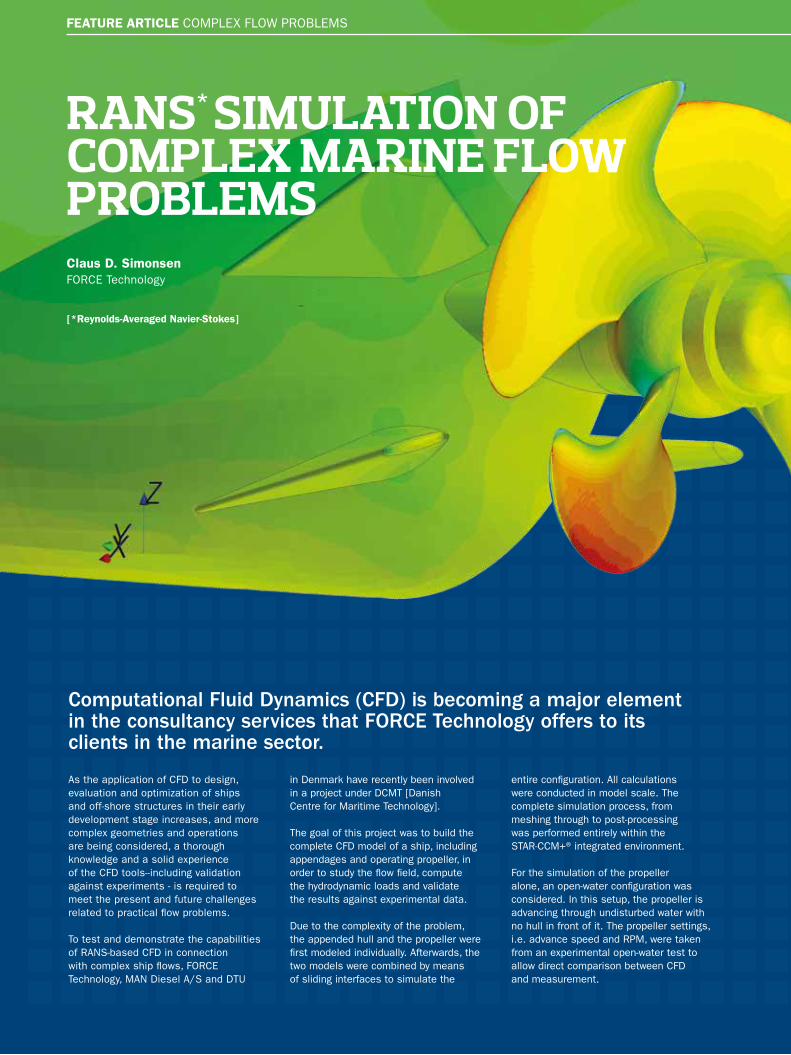
The goal of this project was to build the complete CFD model of a ship, including appendages and operating propeller, in order to study the flow field, compute the hydrodynamic loads and validate the results against experimental data.
Due to the complexity of the problem, the appended hull and the propeller were first modeled individually. Afterwards, the two models were combined by means of sliding interfaces to simulate the
entire configuration. All calculations were conducted in model scale. The complete simulation process, from meshing through to post-processing was performed entirely within the STAR-CCM+® integrated environment.
For the simulation of the propeller alone, an open-water configuration was considered. In this setup, the propeller is advancing through undisturbed water with no hull in front of it. The propeller settings, i.e. advance speed and RPM, were taken from an experimental open-water test to allow direct comparison between CFD and measurement.
Claus D. SimonsenFORCE Technology
RANS* SIMULATION OF COMPLEX MARINE FLOW PROBLEMS
Computational Fluid Dynamics (CFD) is becoming a major element in the consultancy services that FORCE Technology offers to its clients in the marine sector.
[*Reynolds-Averaged Navier-Stokes]
FEATURE ARTICLE COMPLEX FLOW PROBLEMS
11SPECIAL REPORT
A polyhedral mesh was used. The flow solver was run in steady mode with the rotation of the propeller modeled using the moving reference frame approach.
One of the principle advantages of CFD simulation regards the ability to visualize the flow, which gives the engineer a valuable insight into the performance of the design, not easily available using alternative means. For instance, it provides information about the hydrodynamic loads on the propeller, i.e. the propeller thrust and torque. Comparison between calculated open-water data and data measured in FORCE Technology’s towing
tank shows that the computed data agrees fairly well with the measurement. At the typical operation point of the propeller, both thrust and torque were predicted within 3.4% of the measured values.
For the hull alone, the flow was calculated in a traditional resistance test setup. Dynamic sinkage and trim were not predicted, so the model was positioned according to the measured dynamic sinkage and trim position. The speed was taken equal to 1.915 m/s, which corresponds to a Froude and Reynolds numbers of Fr = 0.289 and Re = 7.24 millions respectively. Trimmed cells were
used for the mesh. The effect of the free surface was included via the two-phase VOF model available in STAR-CCM+.
Comparison between computed and measured data shows that the resistance was calculated within 2.4% of the measured value.
To check the grid quality, a grid study on three different grids was made; it showed that the calculated resistance changed by 11% between coarse and medium grids, while it changed by 1% between medium and fine grids. The fine grid was used for the comparison above.
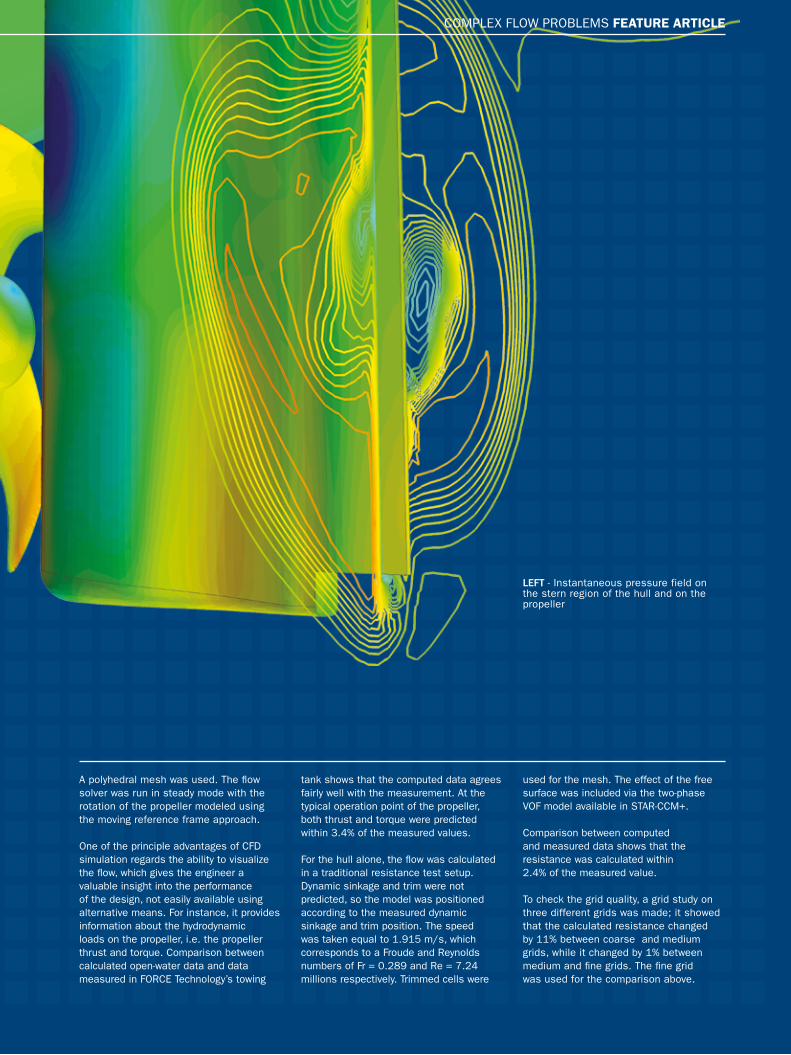
LEFT - Instantaneous pressure field on the stern region of the hull and on the propeller
COMPLEX FLOW PROBLEMS FEATURE ARTICLE
12 SPECIAL REPORT
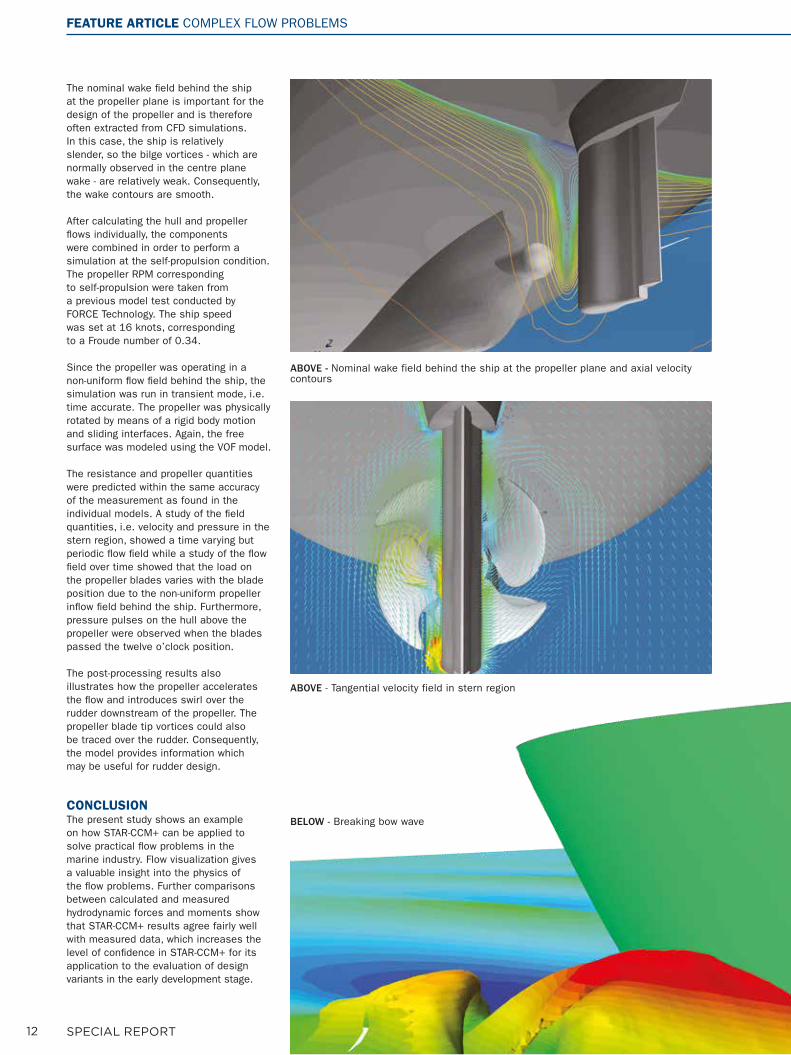
The nominal wake field behind the ship at the propeller plane is important for the design of the propeller and is therefore often extracted from CFD simulations. In this case, the ship is relatively slender, so the bilge vortices - which are normally observed in the centre plane wake - are relatively weak. Consequently, the wake contours are smooth.
After calculating the hull and propeller flows individually, the components were combined in order to perform a simulation at the self-propulsion condition. The propeller RPM corresponding to self-propulsion were taken from a previous model test conducted by FORCE Technology. The ship speed was set at 16 knots, corresponding to a Froude number of 0.34.
Since the propeller was operating in a non-uniform flow field behind the ship, the simulation was run in transient mode, i.e. time accurate. The propeller was physically rotated by means of a rigid body motion and sliding interfaces. Again, the free surface was modeled using the VOF model.
The resistance and propeller quantities were predicted within the same accuracy of the measurement as found in the individual models. A study of the field quantities, i.e. velocity and pressure in the stern region, showed a time varying but periodic flow field while a study of the flow field over time showed that the load on the propeller blades varies with the blade position due to the non-uniform propeller inflow field behind the ship. Furthermore, pressure pulses on the hull above the propeller were observed when the blades passed the twelve o’clock position.
The post-processing results also illustrates how the propeller accelerates the flow and introduces swirl over the rudder downstream of the propeller. The propeller blade tip vortices could also be traced over the rudder. Consequently, the model provides information which may be useful for rudder design. CONCLUSION The present study shows an example on how STAR-CCM+ can be applied to solve practical flow problems in the marine industry. Flow visualization gives a valuable insight into the physics of the flow problems. Further comparisons between calculated and measured hydrodynamic forces and moments show that STAR-CCM+ results agree fairly well with measured data, which increases the level of confidence in STAR-CCM+ for its application to the evaluation of design variants in the early development stage.
BELOW - Breaking bow wave
ABOVE - Nominal wake field behind the ship at the propeller plane and axial velocity contours
ABOVE - Tangential velocity field in stern region
FEATURE ARTICLE COMPLEX FLOW PROBLEMS
13SPECIAL REPORT
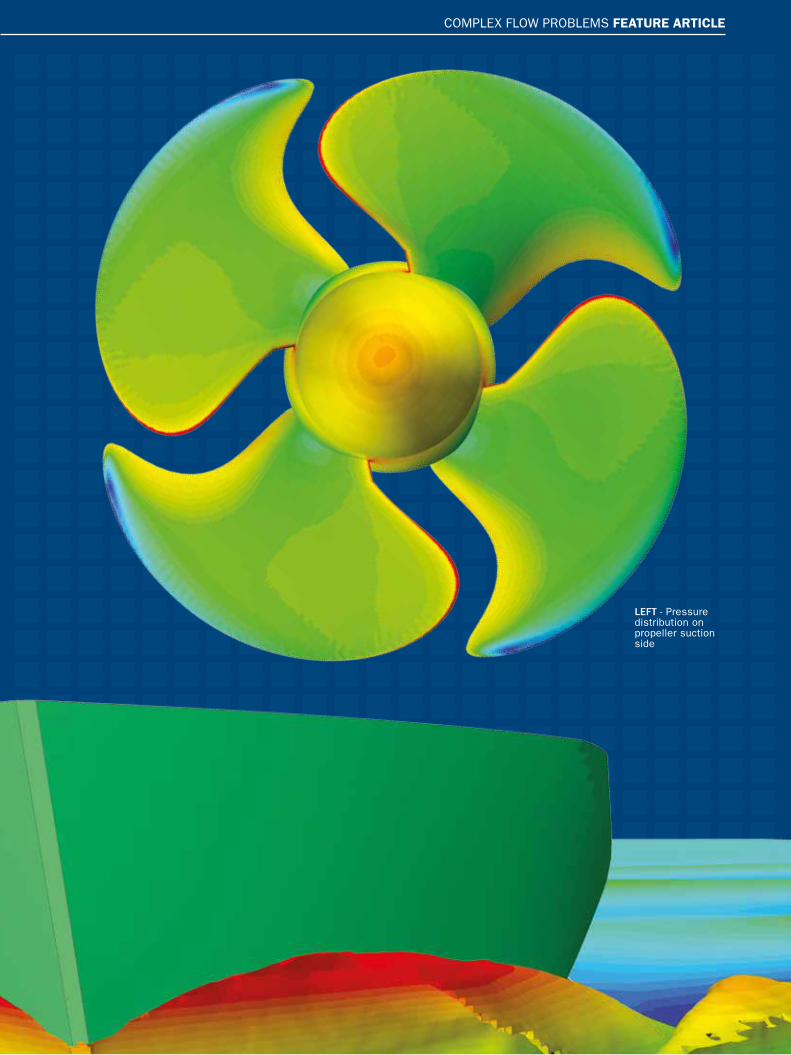
LEFT - Pressure distribution on propeller suction side
COMPLEX FLOW PROBLEMS FEATURE ARTICLE
14 SPECIAL REPORT
The GRC 43 is a state-of-the-art patrol vessel, built to comply with the American Bureau of Shipbuilding (ABS) standards for high-speed crafts. The vessel, built in response to anticipated worldwide demands for a fast response cutter, is constructed entirely from composite materials. Innovative design and
manufacturing techniques have resulted in a vessel that is on-time, on-budget and as-promised. Among other technologies, Computational Fluid Dynamics (CFD) played a major role in the vessel’s design. CFD was used to design an optimized strut-rudder-propeller system that efficiently interacts with the GRC hull form.
MARINE PROPULSION SYSTEM DESIGN – AN OVERVIEW The main components of a propulsion system are the power plant, transmission, and propulsor. With an ever-increasing demand for both larger and faster vessels, optimized propeller design is integral to maximizing performance
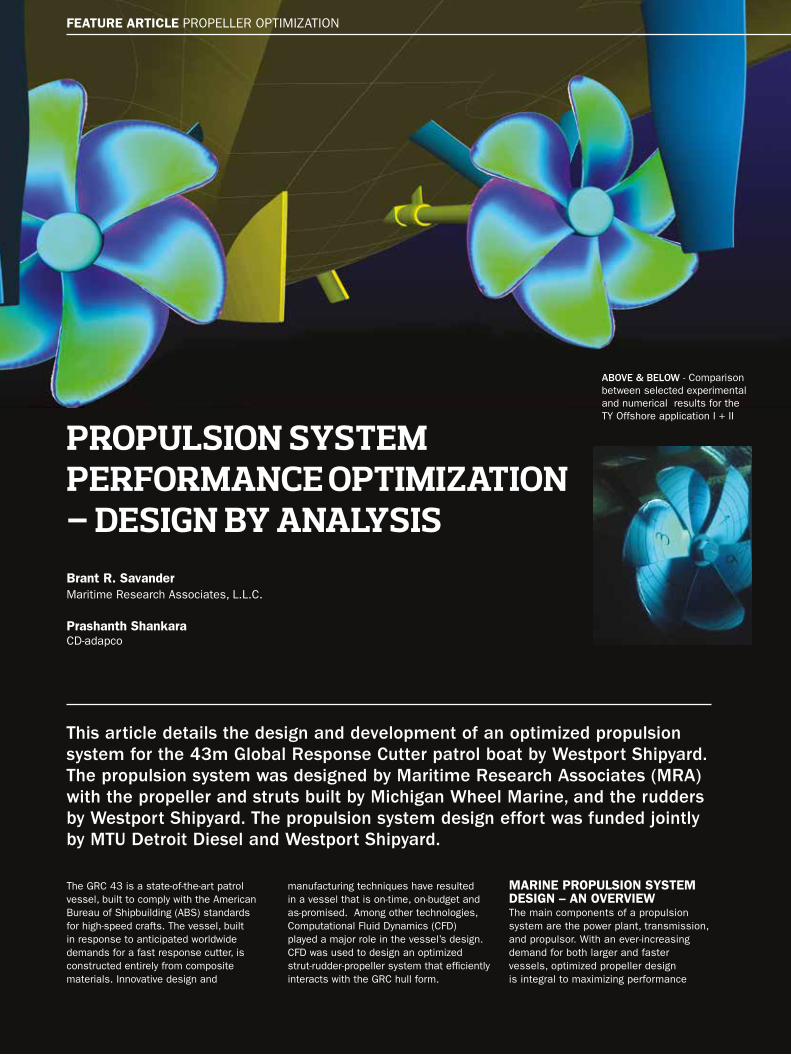
ABOVE & BELOW - Comparison between selected experimental and numerical results for the TY Offshore application I + II
This article details the design and development of an optimized propulsion system for the 43m Global Response Cutter patrol boat by Westport Shipyard. The propulsion system was designed by Maritime Research Associates (MRA) with the propeller and struts built by Michigan Wheel Marine, and the rudders by Westport Shipyard. The propulsion system design effort was funded jointly by MTU Detroit Diesel and Westport Shipyard.
Brant R. SavanderMaritime Research Associates, L.L.C.
Prashanth ShankaraCD-adapco
PROPULSION SYSTEM PERFORMANCE OPTIMIZATION – DESIGN BY ANALYSIS
FEATURE ARTICLE PROPELLER OPTIMIZATION
15SPECIAL REPORT
DRIVEN BY COMMERCIAL PRESSURES, THE DESIGN OF THE MODERN PROPULSION SYSTEMS HAVE RELIED LESS ON TRADITIONAL MODEL TESTS AND MOVED TO A COMBINATION OF COMPUTATIONAL DESIGN BY ANALYSIS METHODS COUPLED WITH SYSTEMATIC VALIDATION TESTS AT BOTH MODEL AND FULL SCALE.
PROPELLER OPTIMIZATION FEATURE ARTICLE
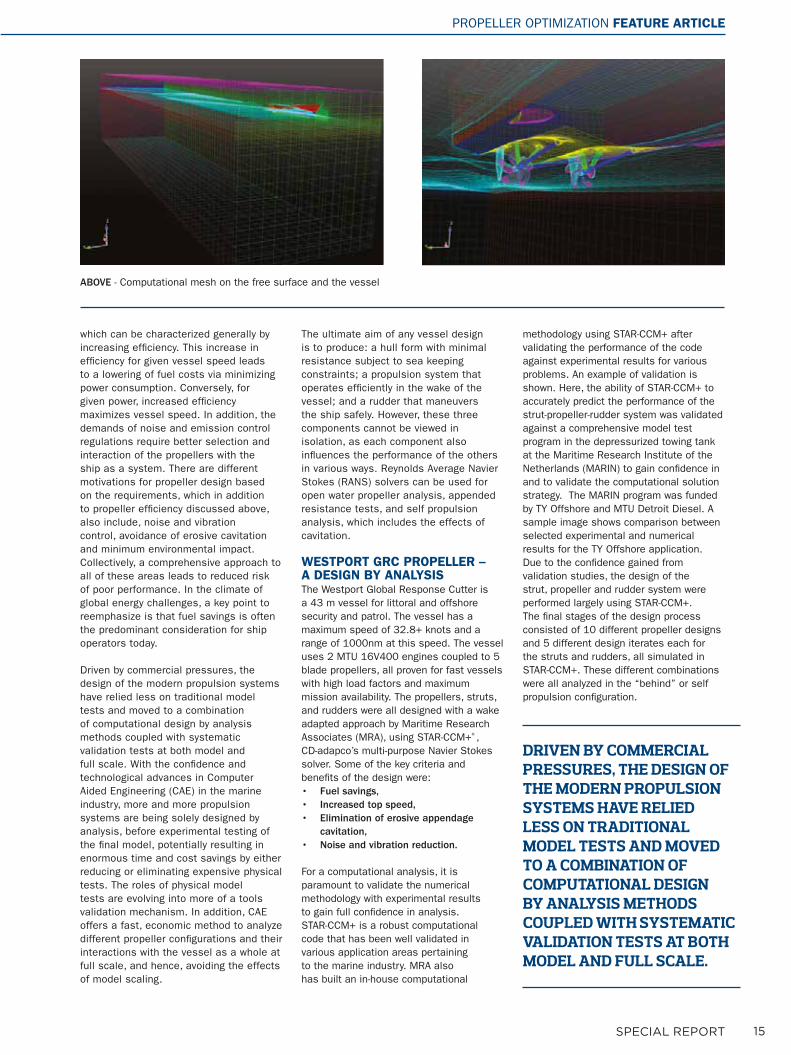
ABOVE - Computational mesh on the free surface and the vessel
which can be characterized generally by increasing efficiency. This increase in efficiency for given vessel speed leads to a lowering of fuel costs via minimizing power consumption. Conversely, for given power, increased efficiency maximizes vessel speed. In addition, the demands of noise and emission control regulations require better selection and interaction of the propellers with the ship as a system. There are different motivations for propeller design based on the requirements, which in addition to propeller efficiency discussed above, also include, noise and vibration control, avoidance of erosive cavitation and minimum environmental impact. Collectively, a comprehensive approach to all of these areas leads to reduced risk of poor performance. In the climate of global energy challenges, a key point to reemphasize is that fuel savings is often the predominant consideration for ship operators today.
Driven by commercial pressures, the design of the modern propulsion systems have relied less on traditional model tests and moved to a combination of computational design by analysis methods coupled with systematic validation tests at both model and full scale. With the confidence and technological advances in Computer Aided Engineering (CAE) in the marine industry, more and more propulsion systems are being solely designed by analysis, before experimental testing of the final model, potentially resulting in enormous time and cost savings by either reducing or eliminating expensive physical tests. The roles of physical model tests are evolving into more of a tools validation mechanism. In addition, CAE offers a fast, economic method to analyze different propeller configurations and their interactions with the vessel as a whole at full scale, and hence, avoiding the effects of model scaling.
The ultimate aim of any vessel design is to produce: a hull form with minimal resistance subject to sea keeping constraints; a propulsion system that operates efficiently in the wake of the vessel; and a rudder that maneuvers the ship safely. However, these three components cannot be viewed in isolation, as each component also influences the performance of the others in various ways. Reynolds Average Navier Stokes (RANS) solvers can be used for open water propeller analysis, appended resistance tests, and self propulsion analysis, which includes the effects of cavitation.
WESTPORT GRC PROPELLER – A DESIGN BY ANALYSISThe Westport Global Response Cutter is a 43 m vessel for littoral and offshore security and patrol. The vessel has a maximum speed of 32.8+ knots and a range of 1000nm at this speed. The vessel uses 2 MTU 16V400 engines coupled to 5 blade propellers, all proven for fast vessels with high load factors and maximum mission availability. The propellers, struts, and rudders were all designed with a wake adapted approach by Maritime Research Associates (MRA), using STAR-CCM+®, CD-adapco’s multi-purpose Navier Stokes solver. Some of the key criteria and benefits of the design were:• Fuel savings,• Increased top speed,• Elimination of erosive appendage
cavitation,• Noise and vibration reduction.
For a computational analysis, it is paramount to validate the numerical methodology with experimental results to gain full confidence in analysis. STAR-CCM+ is a robust computational code that has been well validated in various application areas pertaining to the marine industry. MRA also has built an in-house computational
methodology using STAR-CCM+ after validating the performance of the code against experimental results for various problems. An example of validation is shown. Here, the ability of STAR-CCM+ to accurately predict the performance of the strut-propeller-rudder system was validated against a comprehensive model test program in the depressurized towing tank at the Maritime Research Institute of the Netherlands (MARIN) to gain confidence in and to validate the computational solution strategy. The MARIN program was funded by TY Offshore and MTU Detroit Diesel. A sample image shows comparison between selected experimental and numerical results for the TY Offshore application.Due to the confidence gained from validation studies, the design of the strut, propeller and rudder system were performed largely using STAR-CCM+. The final stages of the design process consisted of 10 different propeller designs and 5 different design iterates each for the struts and rudders, all simulated in STAR-CCM+. These different combinations were all analyzed in the “behind” or self propulsion configuration.
16 SPECIAL REPORT
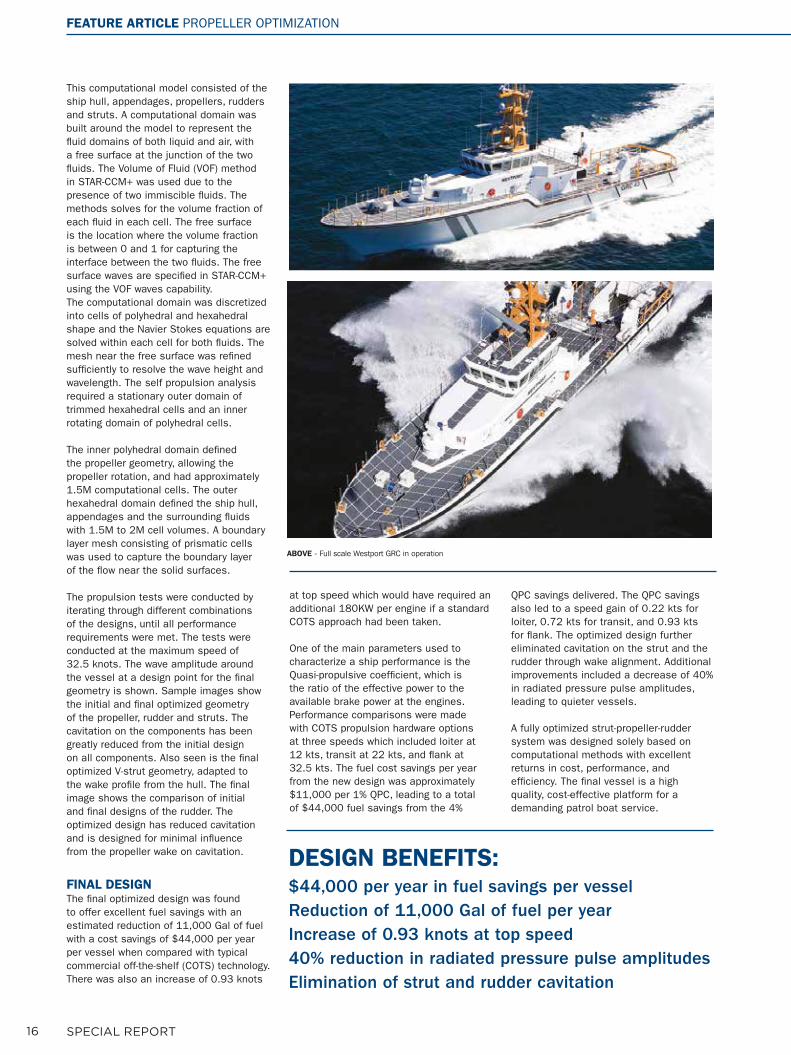
ABOVE - Full scale Westport GRC in operation
DESIGN BENEFITS: $44,000 per year in fuel savings per vesselReduction of 11,000 Gal of fuel per yearIncrease of 0.93 knots at top speed40% reduction in radiated pressure pulse amplitudesElimination of strut and rudder cavitation
This computational model consisted of the ship hull, appendages, propellers, rudders and struts. A computational domain was built around the model to represent the fluid domains of both liquid and air, with a free surface at the junction of the two fluids. The Volume of Fluid (VOF) method in STAR-CCM+ was used due to the presence of two immiscible fluids. The methods solves for the volume fraction of each fluid in each cell. The free surface is the location where the volume fraction is between 0 and 1 for capturing the interface between the two fluids. The free surface waves are specified in STAR-CCM+ using the VOF waves capability.The computational domain was discretized into cells of polyhedral and hexahedral shape and the Navier Stokes equations are solved within each cell for both fluids. The mesh near the free surface was refined sufficiently to resolve the wave height and wavelength. The self propulsion analysis required a stationary outer domain of trimmed hexahedral cells and an inner rotating domain of polyhedral cells. The inner polyhedral domain defined the propeller geometry, allowing the propeller rotation, and had approximately 1.5M computational cells. The outer hexahedral domain defined the ship hull, appendages and the surrounding fluids with 1.5M to 2M cell volumes. A boundary layer mesh consisting of prismatic cells was used to capture the boundary layer of the flow near the solid surfaces.
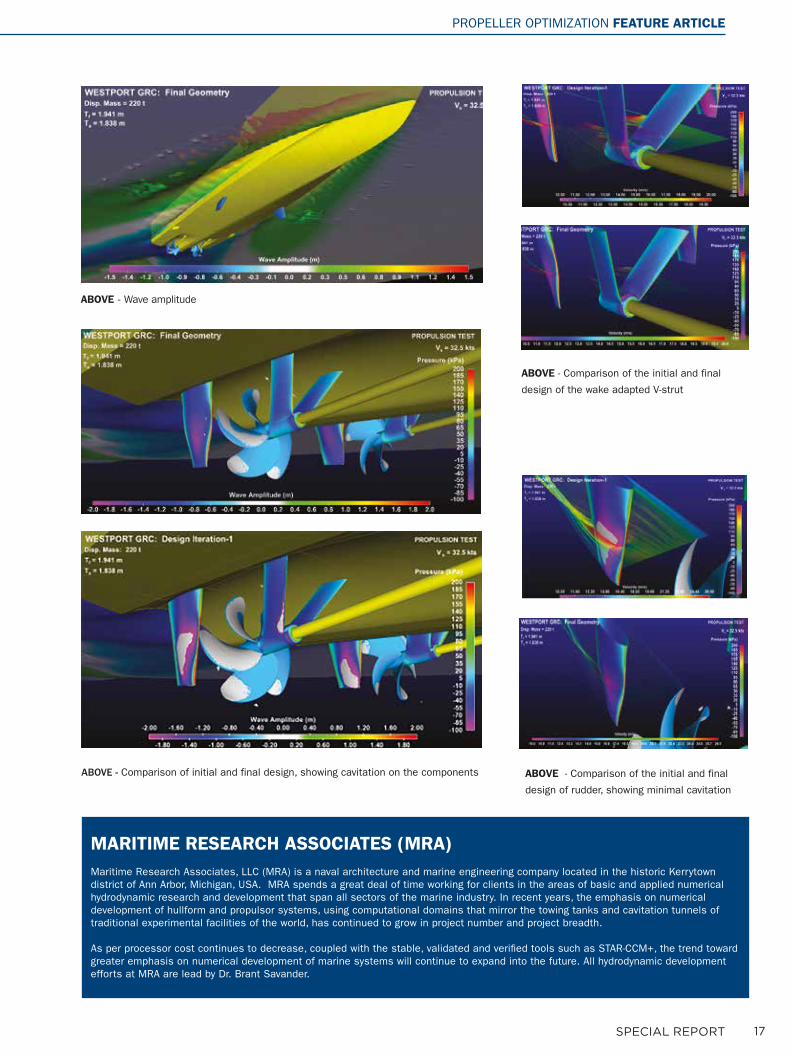
The propulsion tests were conducted by iterating through different combinations of the designs, until all performance requirements were met. The tests were conducted at the maximum speed of 32.5 knots. The wave amplitude around the vessel at a design point for the final geometry is shown. Sample images show the initial and final optimized geometry of the propeller, rudder and struts. The cavitation on the components has been greatly reduced from the initial design on all components. Also seen is the final optimized V-strut geometry, adapted to the wake profile from the hull. The final image shows the comparison of initial and final designs of the rudder. The optimized design has reduced cavitation and is designed for minimal influence from the propeller wake on cavitation.
FINAL DESIGN The final optimized design was found to offer excellent fuel savings with an estimated reduction of 11,000 Gal of fuel with a cost savings of $44,000 per year per vessel when compared with typical commercial off-the-shelf (COTS) technology. There was also an increase of 0.93 knots
FEATURE ARTICLE PROPELLER OPTIMIZATION
at top speed which would have required an additional 180KW per engine if a standard COTS approach had been taken.
One of the main parameters used to characterize a ship performance is the Quasi-propulsive coefficient, which is the ratio of the effective power to the available brake power at the engines. Performance comparisons were made with COTS propulsion hardware options at three speeds which included loiter at 12 kts, transit at 22 kts, and flank at 32.5 kts. The fuel cost savings per year from the new design was approximately $11,000 per 1% QPC, leading to a total of $44,000 fuel savings from the 4%
QPC savings delivered. The QPC savings also led to a speed gain of 0.22 kts for loiter, 0.72 kts for transit, and 0.93 kts for flank. The optimized design further eliminated cavitation on the strut and the rudder through wake alignment. Additional improvements included a decrease of 40% in radiated pressure pulse amplitudes, leading to quieter vessels.
A fully optimized strut-propeller-rudder system was designed solely based on computational methods with excellent returns in cost, performance, and efficiency. The final vessel is a high quality, cost-effective platform for a demanding patrol boat service.
17SPECIAL REPORT
ABOVE - Wave amplitude
ABOVE - Comparison of the initial and final
design of rudder, showing minimal cavitation
ABOVE - Comparison of initial and final design, showing cavitation on the components
PROPELLER OPTIMIZATION FEATURE ARTICLE
MARITIME RESEARCH ASSOCIATES (MRA)Maritime Research Associates, LLC (MRA) is a naval architecture and marine engineering company located in the historic Kerrytown district of Ann Arbor, Michigan, USA. MRA spends a great deal of time working for clients in the areas of basic and applied numerical hydrodynamic research and development that span all sectors of the marine industry. In recent years, the emphasis on numerical development of hullform and propulsor systems, using computational domains that mirror the towing tanks and cavitation tunnels of traditional experimental facilities of the world, has continued to grow in project number and project breadth. As per processor cost continues to decrease, coupled with the stable, validated and verified tools such as STAR-CCM+, the trend toward greater emphasis on numerical development of marine systems will continue to expand into the future. All hydrodynamic development efforts at MRA are lead by Dr. Brant Savander.
ABOVE - Comparison of the initial and final
design of the wake adapted V-strut

18 SPECIAL REPORT
PROPELLER CAVITATION ANALYSIS WITH CFDBART STOCKDILLRobert Allan Ltd.
ABOVE & BELOW - Absolute Pressure Distribution on forward side of propeller blades (top) and aft side (bottom)
FEATURE ARTICLE PROPELLER CAVITATION
19SPECIAL REPORT
Just like a wing generating lift, marine propellers use pressure differences across their blades to generate thrust. The pressure distribution on a propeller blade depends on its shape and how that shape influences the speed of the water flowing around the blade. As the flow speeds up, the pressure drops and conversely when the flow slows down, the pressure rises. Thus the blade is shaped to promote higher speed on the forward or suction side and lower speed on the aft or pressure side. If the blade shape is too aggressive, very low pressure can result. Indeed, this pressure can be low enough to reach the boiling point of water which then leads to cavitation.
In the figures on the left, the pressure distribution on the propeller of a semi-displacement hull is shown at 18 knots and 1200 rpm. The low pressure areas on the forward side of the propeller are shown in blue in the above figure. The high pressure areas on the aft side of the propeller are shown in orange in the left below figure. Since the hydrostatic pressure increases with depth below the water surface, the pressure on the bottom half of the propeller is slightly higher than the top half.
The pressure plots show a problem with this propeller near the leading edge of the blades. There is a narrow band of high pressure (red area, above) on the suction side and a narrow band of low pressure (blue area, left below) on the pressure side. This is undesirable since it means that the leading part of each blade is generating thrust in the wrong direction!
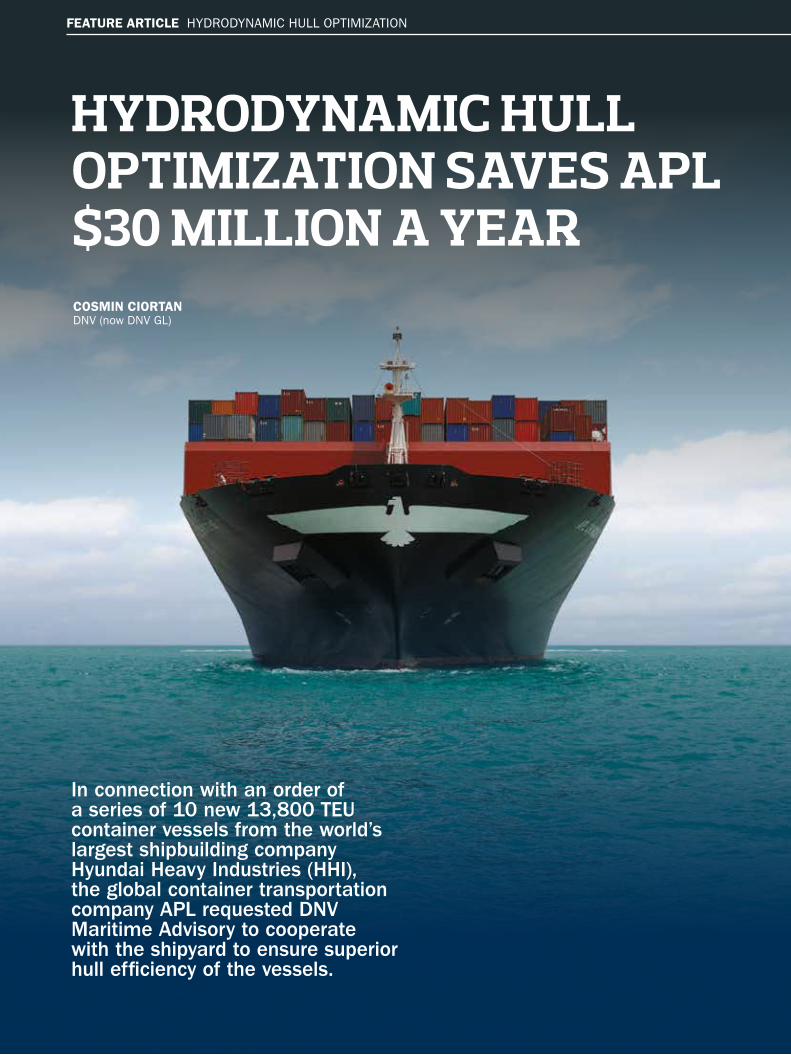
There is one catch though: these pressure plots do not include the effect of cavitation. The dark blue areas show pressure below the vapour pressure of water which means cavitation should occur in those areas.
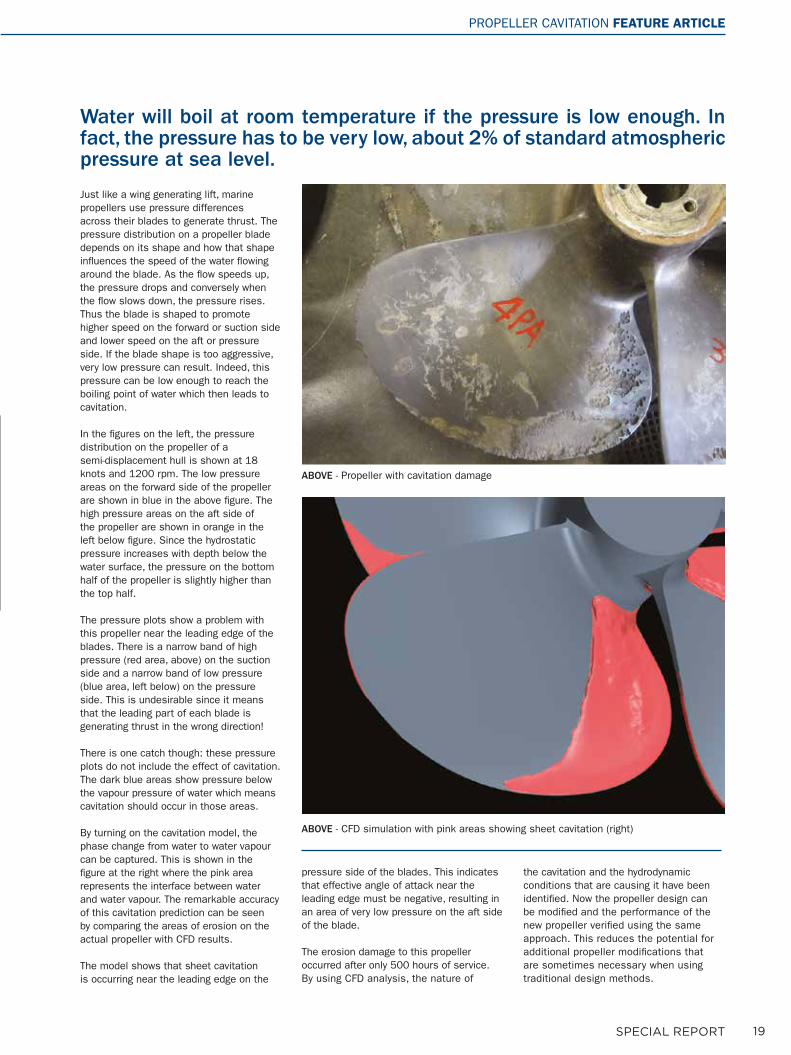
By turning on the cavitation model, the phase change from water to water vapour can be captured. This is shown in the figure at the right where the pink area represents the interface between water and water vapour. The remarkable accuracy of this cavitation prediction can be seen by comparing the areas of erosion on the actual propeller with CFD results. The model shows that sheet cavitation is occurring near the leading edge on the
Water will boil at room temperature if the pressure is low enough. In fact, the pressure has to be very low, about 2% of standard atmospheric pressure at sea level.
ABOVE - CFD simulation with pink areas showing sheet cavitation (right)
ABOVE - Propeller with cavitation damage
PROPELLER CAVITATION FEATURE ARTICLE
pressure side of the blades. This indicates that effective angle of attack near the leading edge must be negative, resulting in an area of very low pressure on the aft side of the blade. The erosion damage to this propeller occurred after only 500 hours of service. By using CFD analysis, the nature of
the cavitation and the hydrodynamic conditions that are causing it have been identified. Now the propeller design can be modified and the performance of the new propeller verified using the same approach. This reduces the potential for additional propeller modifications that are sometimes necessary when using traditional design methods.
20 SPECIAL REPORT
HYDRODYNAMIC HULL OPTIMIZATION SAVES APL $30 MILLION A YEAR
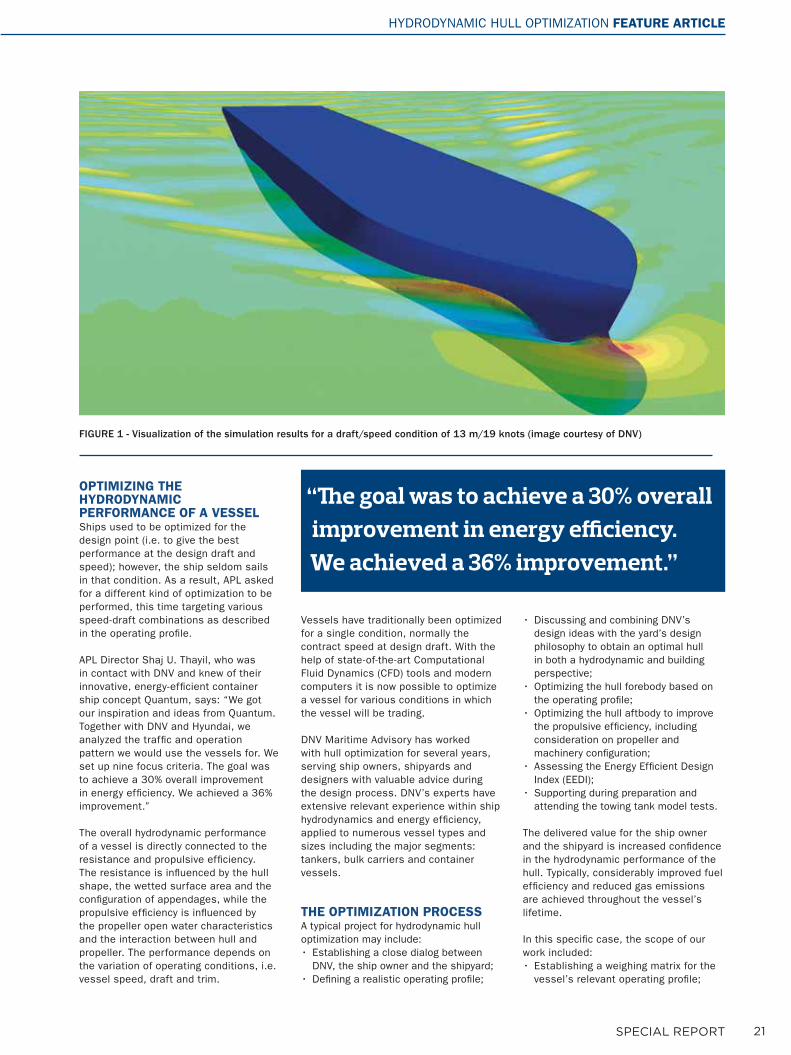
In connection with an order of a series of 10 new 13,800 TEU container vessels from the world’s largest shipbuilding company Hyundai Heavy Industries (HHI), the global container transportation company APL requested DNV Maritime Advisory to cooperate with the shipyard to ensure superior hull efficiency of the vessels.
COSMIN CIORTANDNV (now DNV GL)
FEATURE ARTICLE HYDRODYNAMIC HULL OPTIMIZATION
21SPECIAL REPORT
OPTIMIZING THE HYDRODYNAMIC PERFORMANCE OF A VESSELShips used to be optimized for the design point (i.e. to give the best performance at the design draft and speed); however, the ship seldom sails in that condition. As a result, APL asked for a different kind of optimization to be performed, this time targeting various speed-draft combinations as described in the operating profile.
APL Director Shaj U. Thayil, who was in contact with DNV and knew of their innovative, energy-efficient container ship concept Quantum, says: “We got our inspiration and ideas from Quantum. Together with DNV and Hyundai, we analyzed the traffic and operation pattern we would use the vessels for. We set up nine focus criteria. The goal was to achieve a 30% overall improvement in energy efficiency. We achieved a 36% improvement.”
The overall hydrodynamic performance of a vessel is directly connected to the resistance and propulsive efficiency. The resistance is influenced by the hull shape, the wetted surface area and the configuration of appendages, while the propulsive efficiency is influenced by the propeller open water characteristics and the interaction between hull and propeller. The performance depends on the variation of operating conditions, i.e. vessel speed, draft and trim.
Vessels have traditionally been optimized for a single condition, normally the contract speed at design draft. With the help of state-of-the-art Computational Fluid Dynamics (CFD) tools and modern computers it is now possible to optimize a vessel for various conditions in which the vessel will be trading.
DNV Maritime Advisory has worked with hull optimization for several years, serving ship owners, shipyards and designers with valuable advice during the design process. DNV’s experts have extensive relevant experience within ship hydrodynamics and energy efficiency, applied to numerous vessel types and sizes including the major segments: tankers, bulk carriers and container vessels.
THE OPTIMIZATION PROCESSA typical project for hydrodynamic hull optimization may include:• Establishing a close dialog between
DNV, the ship owner and the shipyard;• Defining a realistic operating profile;
• Discussing and combining DNV’s design ideas with the yard’s design philosophy to obtain an optimal hull in both a hydrodynamic and building perspective;
• Optimizing the hull forebody based on the operating profile;
• Optimizing the hull aftbody to improve the propulsive efficiency, including consideration on propeller and machinery configuration;
• Assessing the Energy Efficient Design Index (EEDI);
• Supporting during preparation and attending the towing tank model tests.
The delivered value for the ship owner and the shipyard is increased confidence in the hydrodynamic performance of the hull. Typically, considerably improved fuel efficiency and reduced gas emissions are achieved throughout the vessel’s lifetime.
In this specific case, the scope of our work included:• Establishing a weighing matrix for the
vessel’s relevant operating profile;
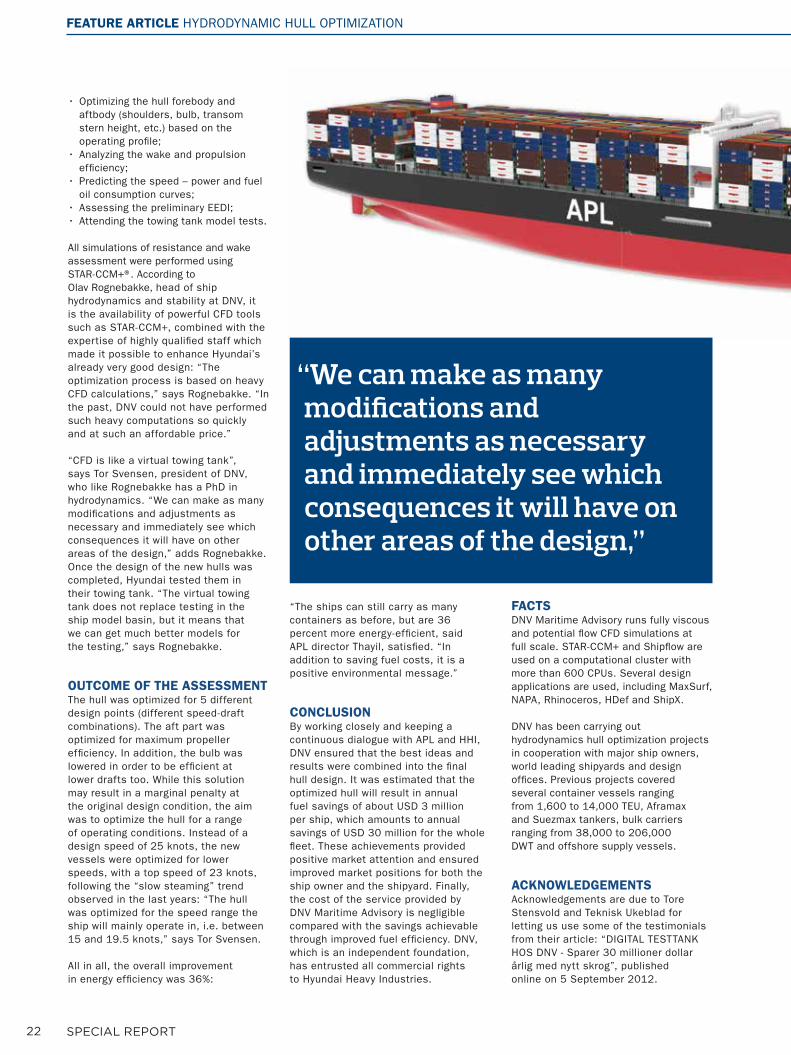
FIGURE 1 - Visualization of the simulation results for a draft/speed condition of 13 m/19 knots (image courtesy of DNV)
“The goal was to achieve a 30% overall improvement in energy efficiency. We achieved a 36% improvement.”
HYDRODYNAMIC HULL OPTIMIZATION FEATURE ARTICLE
22 SPECIAL REPORT
• Optimizing the hull forebody and aftbody (shoulders, bulb, transom stern height, etc.) based on the operating profile;
• Analyzing the wake and propulsion efficiency;
• Predicting the speed – power and fuel oil consumption curves;
• Assessing the preliminary EEDI;• Attending the towing tank model tests.
All simulations of resistance and wake assessment were performed using STAR-CCM+®. According to Olav Rognebakke, head of ship hydrodynamics and stability at DNV, it is the availability of powerful CFD tools such as STAR-CCM+, combined with the expertise of highly qualified staff which made it possible to enhance Hyundai’s already very good design: “The optimization process is based on heavy CFD calculations,” says Rognebakke. “In the past, DNV could not have performed such heavy computations so quickly and at such an affordable price.”
“CFD is like a virtual towing tank”, says Tor Svensen, president of DNV, who like Rognebakke has a PhD in hydrodynamics. “We can make as many modifications and adjustments as necessary and immediately see which consequences it will have on other areas of the design,” adds Rognebakke. Once the design of the new hulls was completed, Hyundai tested them in their towing tank. “The virtual towing tank does not replace testing in the ship model basin, but it means that we can get much better models for the testing,” says Rognebakke.
OUTCOME OF THE ASSESSMENT The hull was optimized for 5 different design points (different speed-draft combinations). The aft part was optimized for maximum propeller efficiency. In addition, the bulb was lowered in order to be efficient at lower drafts too. While this solution may result in a marginal penalty at the original design condition, the aim was to optimize the hull for a range of operating conditions. Instead of a design speed of 25 knots, the new vessels were optimized for lower speeds, with a top speed of 23 knots, following the “slow steaming” trend observed in the last years: “The hull was optimized for the speed range the ship will mainly operate in, i.e. between 15 and 19.5 knots,” says Tor Svensen.
All in all, the overall improvement in energy efficiency was 36%:
“The ships can still carry as many containers as before, but are 36 percent more energy-efficient, said APL director Thayil, satisfied. “In addition to saving fuel costs, it is a positive environmental message.”
CONCLUSIONBy working closely and keeping a continuous dialogue with APL and HHI, DNV ensured that the best ideas and results were combined into the final hull design. It was estimated that the optimized hull will result in annual fuel savings of about USD 3 million per ship, which amounts to annual savings of USD 30 million for the whole fleet. These achievements provided positive market attention and ensured improved market positions for both the ship owner and the shipyard. Finally, the cost of the service provided by DNV Maritime Advisory is negligible compared with the savings achievable through improved fuel efficiency. DNV, which is an independent foundation, has entrusted all commercial rights to Hyundai Heavy Industries.
FEATURE ARTICLE HYDRODYNAMIC HULL OPTIMIZATION
FACTSDNV Maritime Advisory runs fully viscous and potential flow CFD simulations at full scale. STAR-CCM+ and Shipflow are used on a computational cluster with more than 600 CPUs. Several design applications are used, including MaxSurf, NAPA, Rhinoceros, HDef and ShipX.
DNV has been carrying out hydrodynamics hull optimization projects in cooperation with major ship owners, world leading shipyards and design offices. Previous projects covered several container vessels ranging from 1,600 to 14,000 TEU, Aframax and Suezmax tankers, bulk carriers ranging from 38,000 to 206,000 DWT and offshore supply vessels.
ACKNOWLEDGEMENTSAcknowledgements are due to Tore Stensvold and Teknisk Ukeblad for letting us use some of the testimonials from their article: “DIGITAL TESTTANK HOS DNV - Sparer 30 millioner dollar årlig med nytt skrog”, published online on 5 September 2012.
“We can make as many modifications and adjustments as necessary and immediately see which consequences it will have on other areas of the design,”
23SPECIAL REPORT
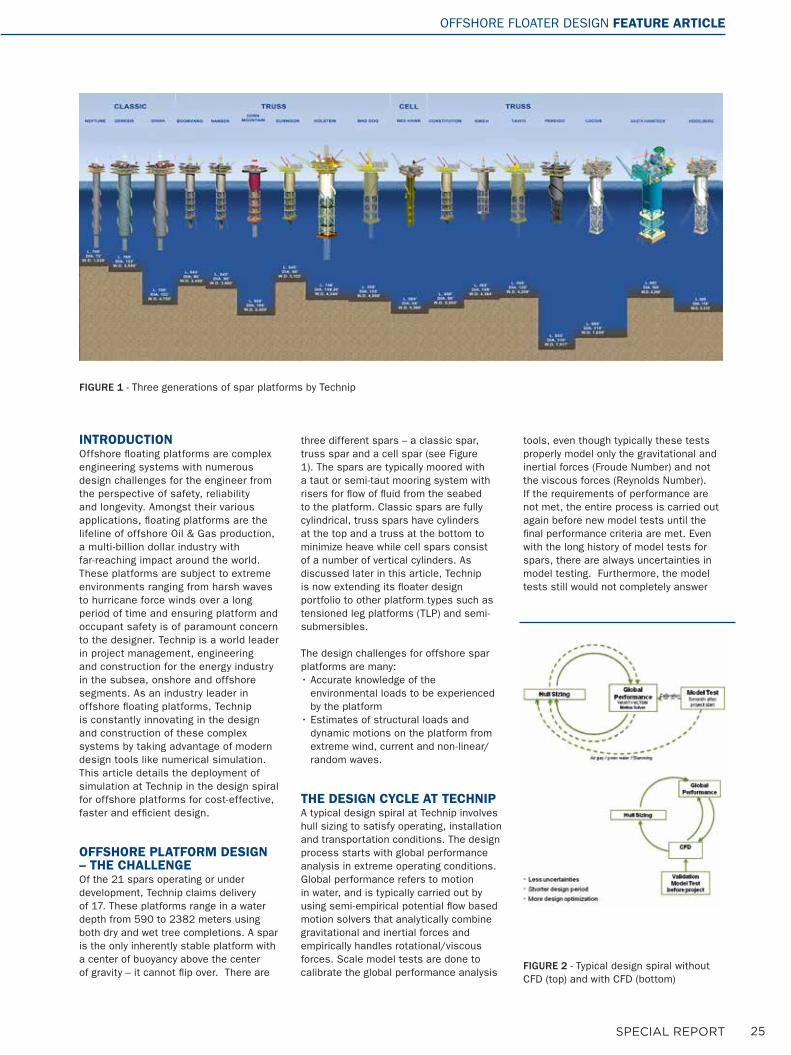
FIGURE 5 - Example of an operating profile (image courtesy of DNV)
FIGURE 4 - Comparison between the CFD analysis and model tests (image courtesy of DNV)
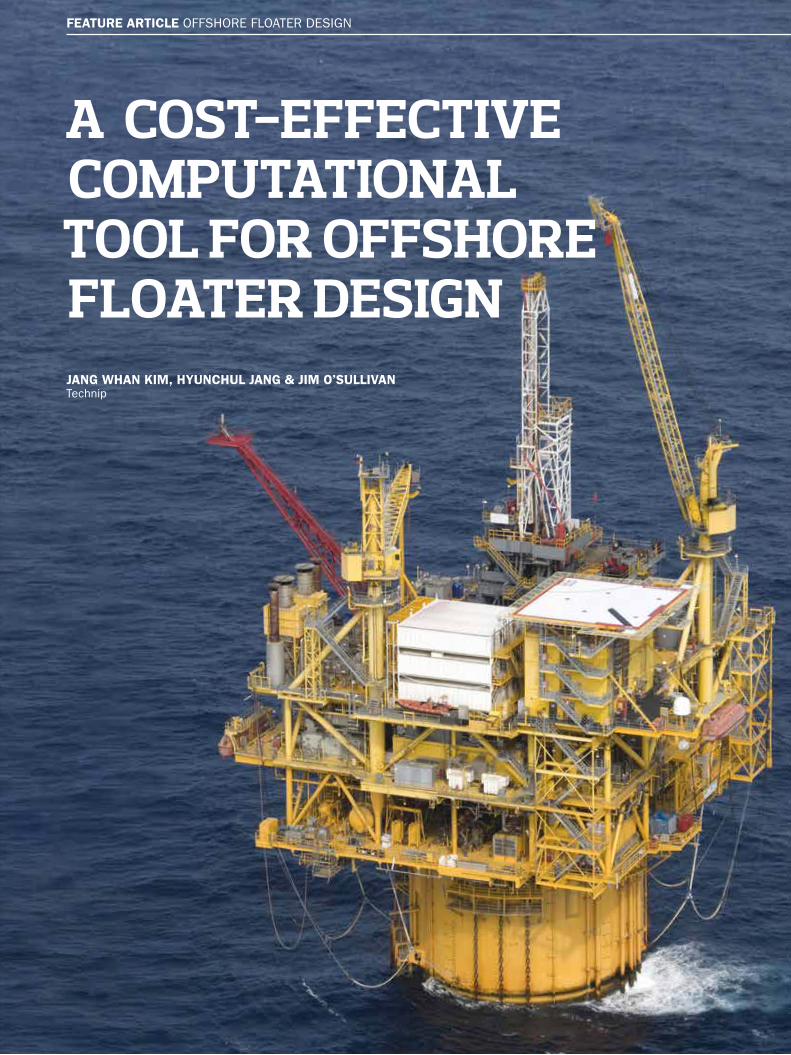
FIGURE3 - Hull performance improvements for different draft-speed conditions (image courtesy of DNV)
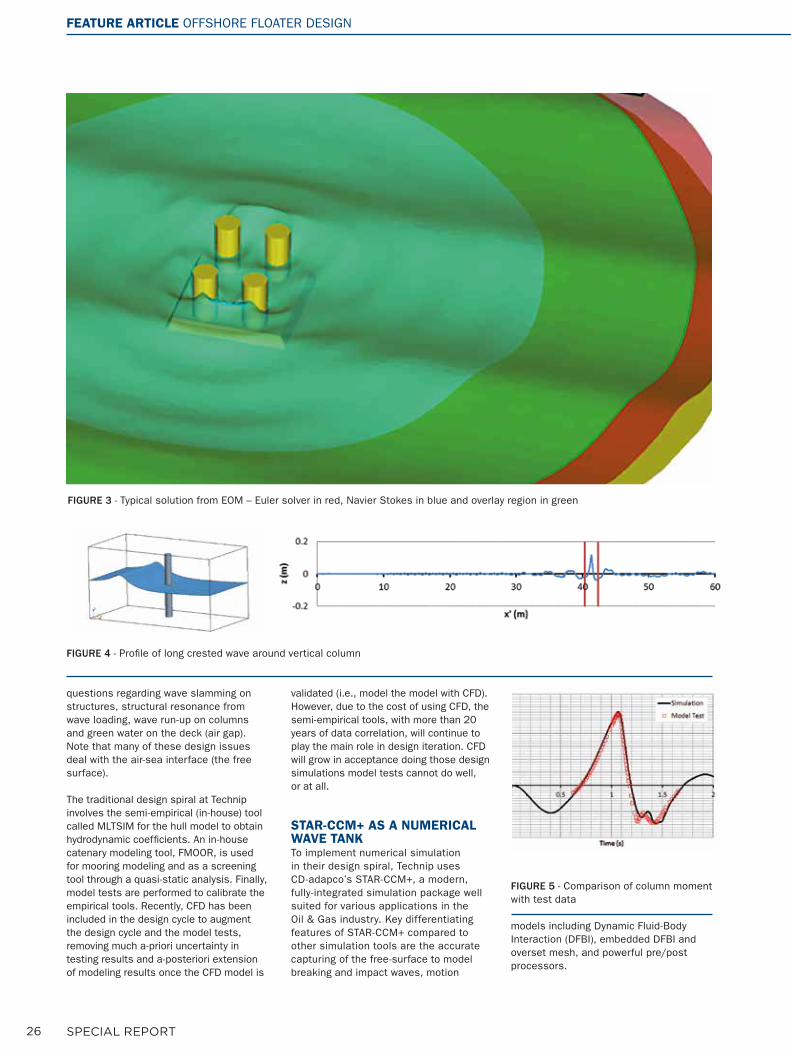
FIGURE 6 - Distribution of hull pressure in the initial and final hull forms (image courtesy of DNV)
FIGURE 7 - Visualization of calculated wave pattern (image courtesy of DNV)
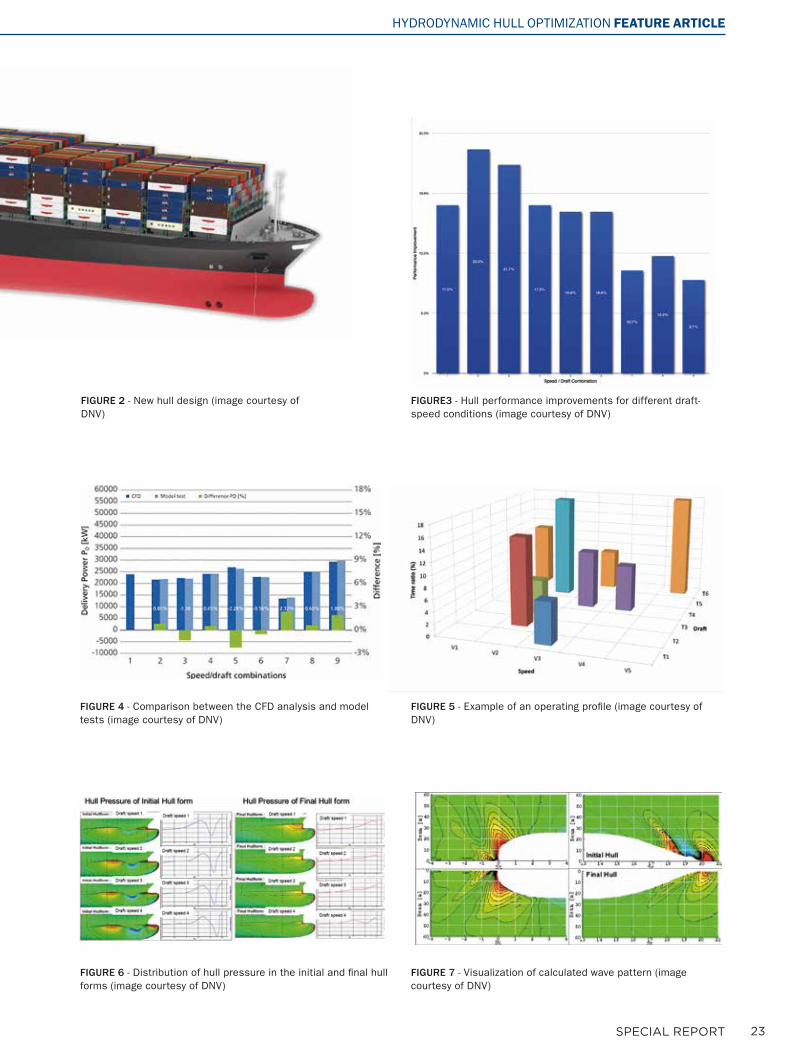
FIGURE 2 - New hull design (image courtesy of DNV)
HYDRODYNAMIC HULL OPTIMIZATION FEATURE ARTICLE
24 SPECIAL REPORT
A COST-EFFECTIVE COMPUTATIONAL TOOL FOR OFFSHORE FLOATER DESIGNJANG WHAN KIM, HYUNCHUL JANG & JIM O’SULLIVANTechnip
FEATURE ARTICLE OFFSHORE FLOATER DESIGN
25SPECIAL REPORT
FIGURE 1 - Three generations of spar platforms by Technip
FIGURE 2 - Typical design spiral without CFD (top) and with CFD (bottom)
OFFSHORE FLOATER DESIGN FEATURE ARTICLE
INTRODUCTIONOffshore floating platforms are complex engineering systems with numerous design challenges for the engineer from the perspective of safety, reliability and longevity. Amongst their various applications, floating platforms are the lifeline of offshore Oil & Gas production, a multi-billion dollar industry with far-reaching impact around the world. These platforms are subject to extreme environments ranging from harsh waves to hurricane force winds over a long period of time and ensuring platform and occupant safety is of paramount concern to the designer. Technip is a world leader in project management, engineering and construction for the energy industry in the subsea, onshore and offshore segments. As an industry leader in offshore floating platforms, Technip is constantly innovating in the design and construction of these complex systems by taking advantage of modern design tools like numerical simulation. This article details the deployment of simulation at Technip in the design spiral for offshore platforms for cost-effective, faster and efficient design.
OFFSHORE PLATFORM DESIGN– THE CHALLENGEOf the 21 spars operating or under development, Technip claims delivery of 17. These platforms range in a water depth from 590 to 2382 meters using both dry and wet tree completions. A spar is the only inherently stable platform with a center of buoyancy above the center of gravity – it cannot flip over. There are
three different spars – a classic spar, truss spar and a cell spar (see Figure 1). The spars are typically moored with a taut or semi-taut mooring system with risers for flow of fluid from the seabed to the platform. Classic spars are fully cylindrical, truss spars have cylinders at the top and a truss at the bottom to minimize heave while cell spars consist of a number of vertical cylinders. As discussed later in this article, Technip is now extending its floater design portfolio to other platform types such as tensioned leg platforms (TLP) and semi-submersibles.
The design challenges for offshore spar platforms are many:• Accurate knowledge of the
environmental loads to be experienced by the platform
• Estimates of structural loads and dynamic motions on the platform from extreme wind, current and non-linear/random waves.
THE DESIGN CYCLE AT TECHNIPA typical design spiral at Technip involves hull sizing to satisfy operating, installation and transportation conditions. The design process starts with global performance analysis in extreme operating conditions. Global performance refers to motion in water, and is typically carried out by using semi-empirical potential flow based motion solvers that analytically combine gravitational and inertial forces and empirically handles rotational/viscous forces. Scale model tests are done to calibrate the global performance analysis
tools, even though typically these tests properly model only the gravitational and inertial forces (Froude Number) and not the viscous forces (Reynolds Number). If the requirements of performance are not met, the entire process is carried out again before new model tests until the final performance criteria are met. Even with the long history of model tests for spars, there are always uncertainties in model testing. Furthermore, the model tests still would not completely answer
26 SPECIAL REPORT
FIGURE 3 - Typical solution from EOM – Euler solver in red, Navier Stokes in blue and overlay region in green
FIGURE 4 - Profile of long crested wave around vertical column
FIGURE 5 - Comparison of column moment with test data
FEATURE ARTICLE OFFSHORE FLOATER DESIGN
questions regarding wave slamming on structures, structural resonance from wave loading, wave run-up on columns and green water on the deck (air gap). Note that many of these design issues deal with the air-sea interface (the free surface).
The traditional design spiral at Technip involves the semi-empirical (in-house) tool called MLTSIM for the hull model to obtain hydrodynamic coefficients. An in-house catenary modeling tool, FMOOR, is used for mooring modeling and as a screening tool through a quasi-static analysis. Finally, model tests are performed to calibrate the empirical tools. Recently, CFD has been included in the design cycle to augment the design cycle and the model tests, removing much a-priori uncertainty in testing results and a-posteriori extension of modeling results once the CFD model is
validated (i.e., model the model with CFD). However, due to the cost of using CFD, the semi-empirical tools, with more than 20 years of data correlation, will continue to play the main role in design iteration. CFD will grow in acceptance doing those design simulations model tests cannot do well, or at all.
STAR-CCM+ AS A NUMERICALWAVE TANKTo implement numerical simulation in their design spiral, Technip uses CD-adapco’s STAR-CCM+, a modern, fully-integrated simulation package well suited for various applications in the Oil & Gas industry. Key differentiating features of STAR-CCM+ compared to other simulation tools are the accurate capturing of the free-surface to model breaking and impact waves, motion
models including Dynamic Fluid-Body Interaction (DFBI), embedded DFBI and overset mesh, and powerful pre/post processors.
27SPECIAL REPORT
Technip is constantly innovating in the design and construction of offshore floating platforms by taking advantage of modern design tools like numerical simulation.
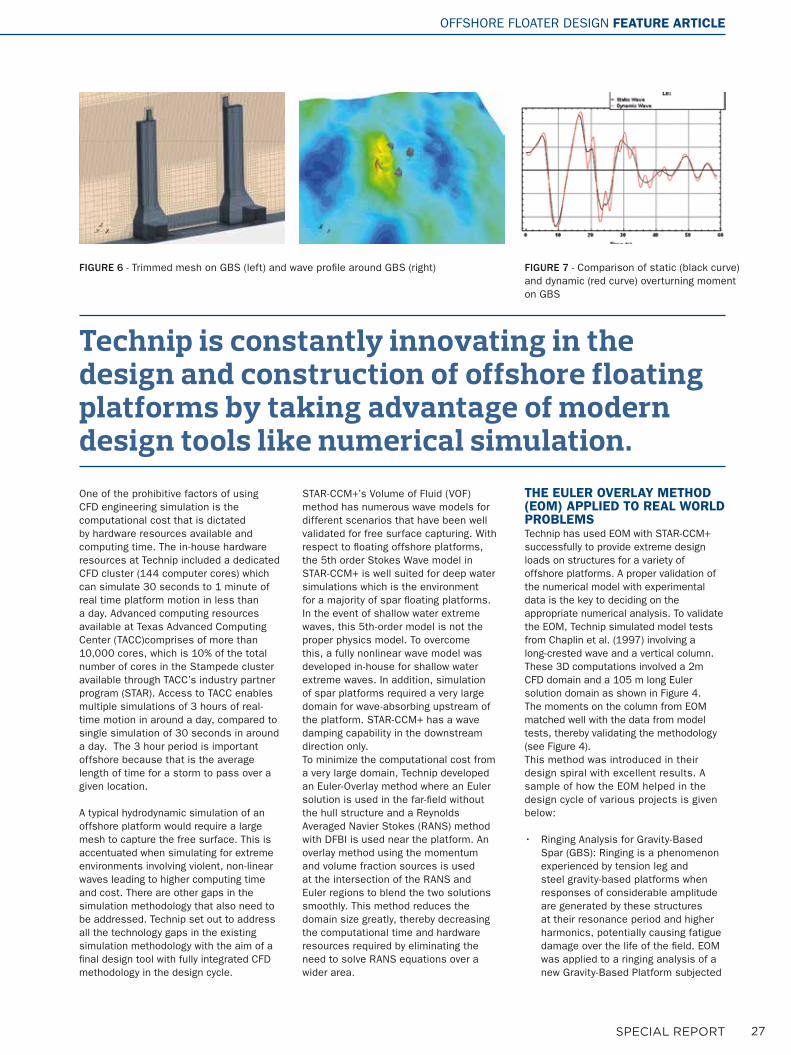
FIGURE 6 - Trimmed mesh on GBS (left) and wave profile around GBS (right) FIGURE 7 - Comparison of static (black curve) and dynamic (red curve) overturning moment on GBS
OFFSHORE FLOATER DESIGN FEATURE ARTICLE
One of the prohibitive factors of using CFD engineering simulation is the computational cost that is dictated by hardware resources available and computing time. The in-house hardware resources at Technip included a dedicated CFD cluster (144 computer cores) which can simulate 30 seconds to 1 minute of real time platform motion in less than a day. Advanced computing resources available at Texas Advanced Computing Center (TACC)comprises of more than 10,000 cores, which is 10% of the total number of cores in the Stampede cluster available through TACC’s industry partner program (STAR). Access to TACC enables multiple simulations of 3 hours of real-time motion in around a day, compared to single simulation of 30 seconds in around a day. The 3 hour period is important offshore because that is the average length of time for a storm to pass over a given location.
A typical hydrodynamic simulation of an offshore platform would require a large mesh to capture the free surface. This is accentuated when simulating for extreme environments involving violent, non-linear waves leading to higher computing time and cost. There are other gaps in the simulation methodology that also need to be addressed. Technip set out to address all the technology gaps in the existing simulation methodology with the aim of a final design tool with fully integrated CFD methodology in the design cycle.
STAR-CCM+’s Volume of Fluid (VOF) method has numerous wave models for different scenarios that have been well validated for free surface capturing. With respect to floating offshore platforms, the 5th order Stokes Wave model in STAR-CCM+ is well suited for deep water simulations which is the environment for a majority of spar floating platforms. In the event of shallow water extreme waves, this 5th-order model is not the proper physics model. To overcome this, a fully nonlinear wave model was developed in-house for shallow water extreme waves. In addition, simulation of spar platforms required a very large domain for wave-absorbing upstream of the platform. STAR-CCM+ has a wave damping capability in the downstream direction only. To minimize the computational cost from a very large domain, Technip developed an Euler-Overlay method where an Euler solution is used in the far-field without the hull structure and a Reynolds Averaged Navier Stokes (RANS) method with DFBI is used near the platform. An overlay method using the momentum and volume fraction sources is used at the intersection of the RANS and Euler regions to blend the two solutions smoothly. This method reduces the domain size greatly, thereby decreasing the computational time and hardware resources required by eliminating the need to solve RANS equations over a wider area.
THE EULER OVERLAY METHOD (EOM) APPLIED TO REAL WORLD PROBLEMSTechnip has used EOM with STAR-CCM+ successfully to provide extreme design loads on structures for a variety of offshore platforms. A proper validation of the numerical model with experimental data is the key to deciding on the appropriate numerical analysis. To validate the EOM, Technip simulated model tests from Chaplin et al. (1997) involving a long-crested wave and a vertical column. These 3D computations involved a 2m CFD domain and a 105 m long Euler solution domain as shown in Figure 4. The moments on the column from EOM matched well with the data from model tests, thereby validating the methodology (see Figure 4). This method was introduced in their design spiral with excellent results. A sample of how the EOM helped in the design cycle of various projects is given below:
• Ringing Analysis for Gravity-Based Spar (GBS): Ringing is a phenomenon experienced by tension leg and steel gravity-based platforms when responses of considerable amplitude are generated by these structures at their resonance period and higher harmonics, potentially causing fatigue damage over the life of the field. EOM was applied to a ringing analysis of a new Gravity-Based Platform subjected
28 SPECIAL REPORT
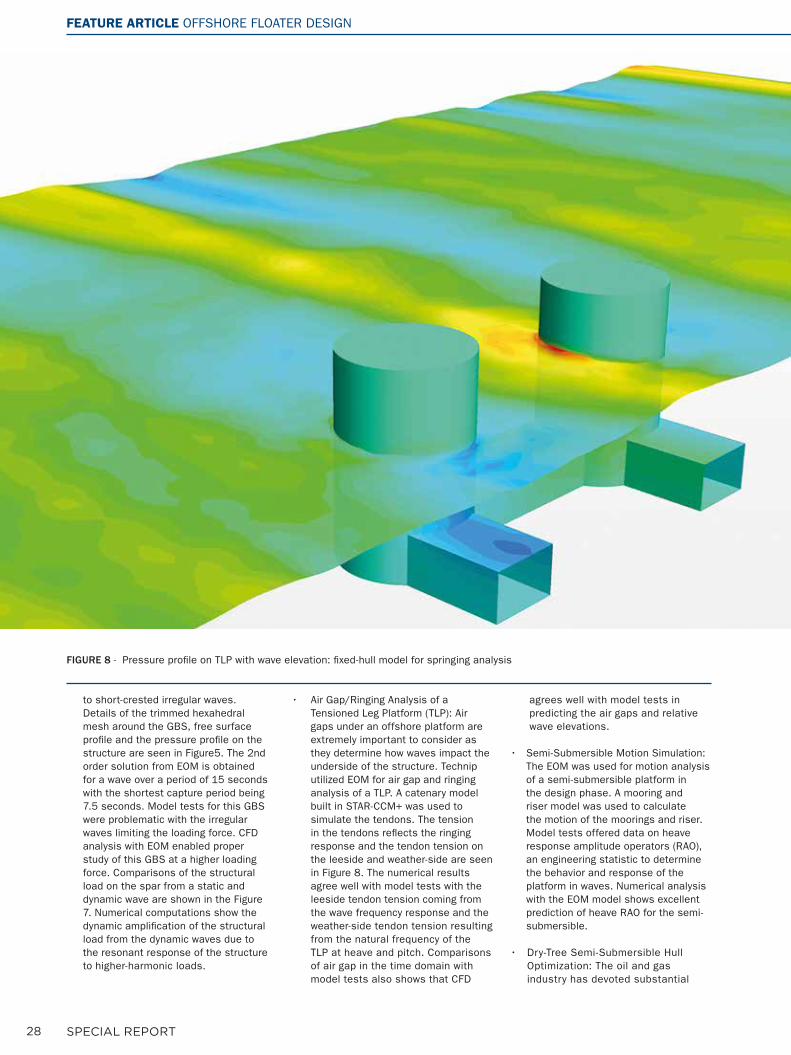
FIGURE 8 - Pressure profile on TLP with wave elevation: fixed-hull model for springing analysis
FEATURE ARTICLE OFFSHORE FLOATER DESIGN
to short-crested irregular waves. Details of the trimmed hexahedral mesh around the GBS, free surface profile and the pressure profile on the structure are seen in Figure5. The 2nd order solution from EOM is obtained for a wave over a period of 15 seconds with the shortest capture period being 7.5 seconds. Model tests for this GBS were problematic with the irregular waves limiting the loading force. CFD analysis with EOM enabled proper study of this GBS at a higher loading force. Comparisons of the structural load on the spar from a static and dynamic wave are shown in the Figure 7. Numerical computations show the dynamic amplification of the structural load from the dynamic waves due to the resonant response of the structure to higher-harmonic loads.
• Air Gap/Ringing Analysis of a Tensioned Leg Platform (TLP): Air gaps under an offshore platform are extremely important to consider as they determine how waves impact the underside of the structure. Technip utilized EOM for air gap and ringing analysis of a TLP. A catenary model built in STAR-CCM+ was used to simulate the tendons. The tension in the tendons reflects the ringing response and the tendon tension on the leeside and weather-side are seen in Figure 8. The numerical results agree well with model tests with the leeside tendon tension coming from the wave frequency response and the weather-side tendon tension resulting from the natural frequency of the TLP at heave and pitch. Comparisons of air gap in the time domain with model tests also shows that CFD
agrees well with model tests in predicting the air gaps and relative wave elevations.
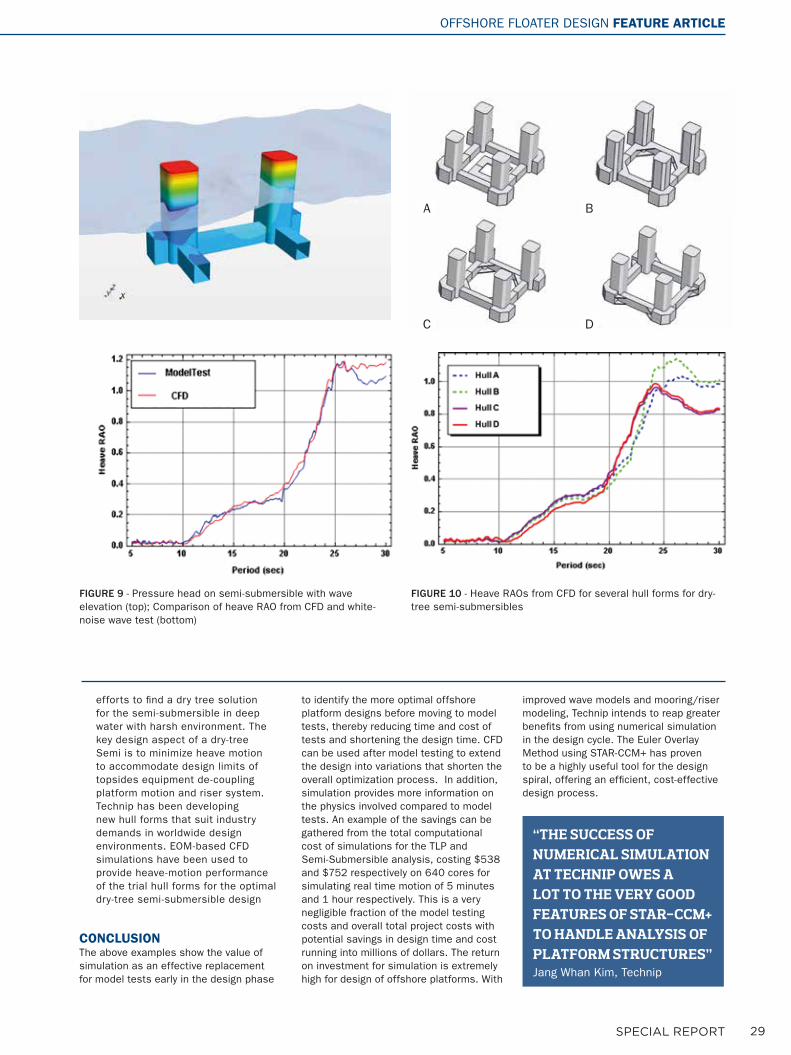
• Semi-Submersible Motion Simulation: The EOM was used for motion analysis of a semi-submersible platform in the design phase. A mooring and riser model was used to calculate the motion of the moorings and riser. Model tests offered data on heave response amplitude operators (RAO), an engineering statistic to determine the behavior and response of the platform in waves. Numerical analysis with the EOM model shows excellent prediction of heave RAO for the semi-submersible.
• Dry-Tree Semi-Submersible Hull Optimization: The oil and gas industry has devoted substantial
29SPECIAL REPORT
FIGURE 9 - Pressure head on semi-submersible with wave elevation (top); Comparison of heave RAO from CFD and white-noise wave test (bottom)
FIGURE 10 - Heave RAOs from CFD for several hull forms for dry-tree semi-submersibles
A
C
B
D
OFFSHORE FLOATER DESIGN FEATURE ARTICLE
efforts to find a dry tree solution for the semi-submersible in deep water with harsh environment. The key design aspect of a dry-tree Semi is to minimize heave motion to accommodate design limits of topsides equipment de-coupling platform motion and riser system. Technip has been developing new hull forms that suit industry demands in worldwide design environments. EOM-based CFD simulations have been used to provide heave-motion performance of the trial hull forms for the optimal dry-tree semi-submersible design
CONCLUSIONThe above examples show the value of simulation as an effective replacement for model tests early in the design phase
to identify the more optimal offshore platform designs before moving to model tests, thereby reducing time and cost of tests and shortening the design time. CFD can be used after model testing to extend the design into variations that shorten the overall optimization process. In addition, simulation provides more information on the physics involved compared to model tests. An example of the savings can be gathered from the total computational cost of simulations for the TLP and Semi-Submersible analysis, costing $538 and $752 respectively on 640 cores for simulating real time motion of 5 minutes and 1 hour respectively. This is a very negligible fraction of the model testing costs and overall total project costs with potential savings in design time and cost running into millions of dollars. The return on investment for simulation is extremely high for design of offshore platforms. With
improved wave models and mooring/riser modeling, Technip intends to reap greater benefits from using numerical simulation in the design cycle. The Euler Overlay Method using STAR-CCM+ has proven to be a highly useful tool for the design spiral, offering an efficient, cost-effective design process.
“THE SUCCESS OF NUMERICAL SIMULATION AT TECHNIP OWES A LOT TO THE VERY GOOD FEATURES OF STAR-CCM+ TO HANDLE ANALYSIS OF PLATFORM STRUCTURES”Jang Whan Kim, Technip
30 SPECIAL REPORT
Ballast water management poses problems in design and operation of ships. Computational fluid dynamics (CFD) offers solutions with design, type approval and trouble-shooting.
BALLAST WATER MANAGEMENT PROBLEMS SOLVED BY ADVANCED SIMULATIONTOBIAS ZORN, JAN KAUFMANNFUTURESHIP (now DNV GL)
MILOVAN PERIĆCD-adapco
FEATURE ARTICLE BALLAST WATER MANAGEMENT
31SPECIAL REPORT
INTRODUCTIONCFD denotes collectively techniques for solving equations describing the physics of fluid flows. CFD is by now widely known and accepted in the maritime industry, but mostly associated with flows around the hull and propellers, for example in the context of designing more fuel-efficient ships. However, CFD is in many ways far more versatile than classical model testing: the same software can be used with a variety of flows, including internal flows. A key advantage of CFD is the insight it gives into flow details. As flow quantities are computed in each computational cell, local information is easy to retrieve during post-processing by looking at arbitrary or specific cross-sections and zooming in and out at will.
With recent IMO (International Maritime Organization) regulations driving the transition towards ballast water management to curb the spread of invasive species, ballast water management systems have moved into the spotlight. And where ballast water handling may pose challenges for ship operators, CFD simulations may very well
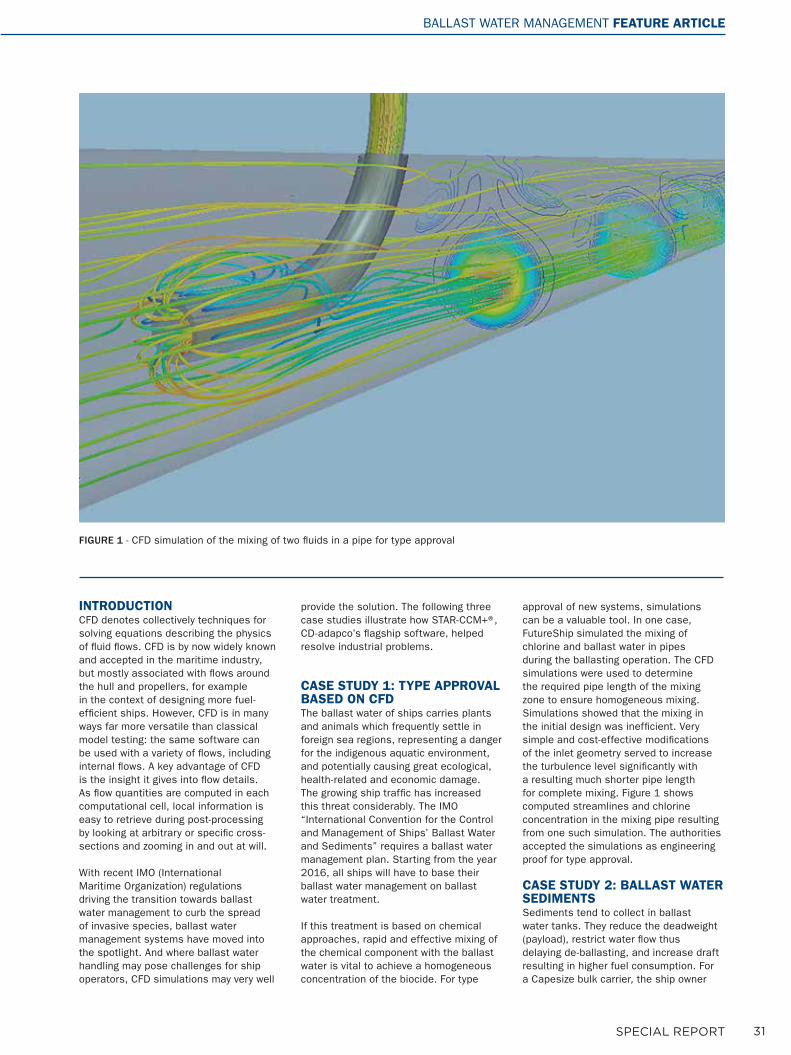
provide the solution. The following three case studies illustrate how STAR-CCM+®, CD-adapco’s flagship software, helped resolve industrial problems.
CASE STUDY 1: TYPE APPROVAL BASED ON CFDThe ballast water of ships carries plants and animals which frequently settle in foreign sea regions, representing a danger for the indigenous aquatic environment, and potentially causing great ecological, health-related and economic damage. The growing ship traffic has increased this threat considerably. The IMO “International Convention for the Control and Management of Ships’ Ballast Water and Sediments” requires a ballast water management plan. Starting from the year 2016, all ships will have to base their ballast water management on ballast water treatment.
If this treatment is based on chemical approaches, rapid and effective mixing of the chemical component with the ballast water is vital to achieve a homogeneous concentration of the biocide. For type
approval of new systems, simulations can be a valuable tool. In one case, FutureShip simulated the mixing of chlorine and ballast water in pipes during the ballasting operation. The CFD simulations were used to determine the required pipe length of the mixing zone to ensure homogeneous mixing. Simulations showed that the mixing in the initial design was inefficient. Very simple and cost-effective modifications of the inlet geometry served to increase the turbulence level significantly with a resulting much shorter pipe length for complete mixing. Figure 1 shows computed streamlines and chlorine concentration in the mixing pipe resulting from one such simulation. The authorities accepted the simulations as engineering proof for type approval.
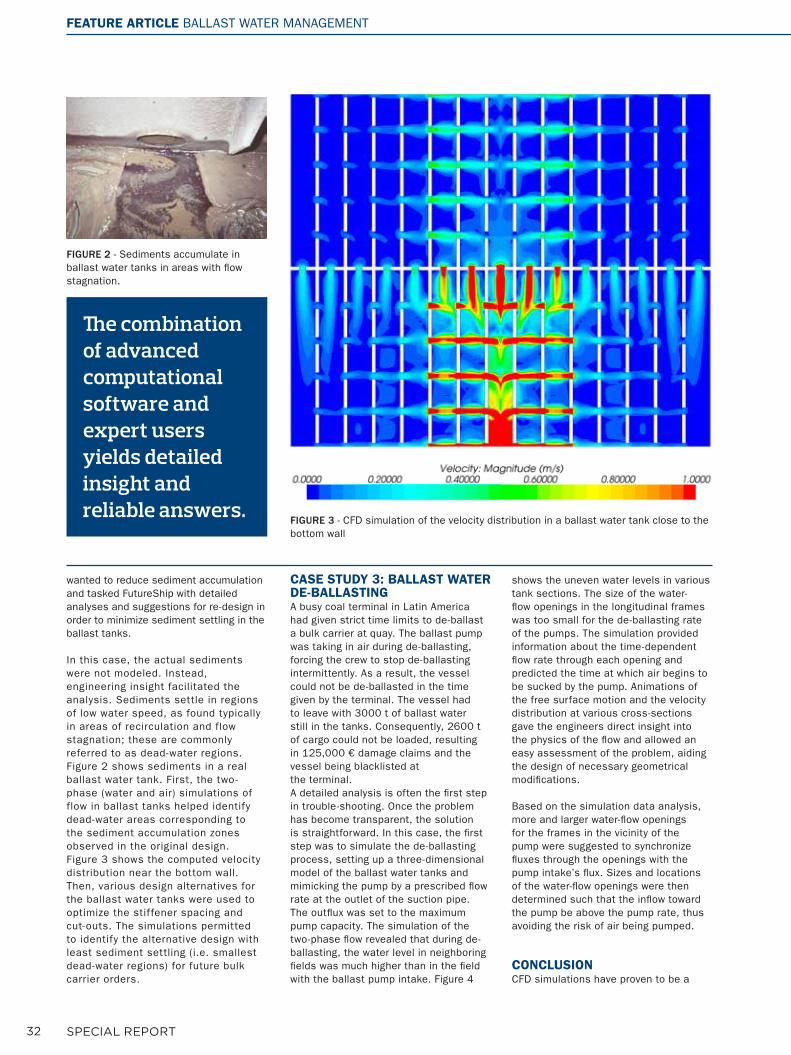
CASE STUDY 2: BALLAST WATER SEDIMENTSSediments tend to collect in ballast water tanks. They reduce the deadweight (payload), restrict water flow thus delaying de-ballasting, and increase draft resulting in higher fuel consumption. For a Capesize bulk carrier, the ship owner
FIGURE 1 - CFD simulation of the mixing of two fluids in a pipe for type approval
BALLAST WATER MANAGEMENT FEATURE ARTICLE
32 SPECIAL REPORT
wanted to reduce sediment accumulation and tasked FutureShip with detailed analyses and suggestions for re-design in order to minimize sediment settling in the ballast tanks.
In this case, the actual sediments were not modeled. Instead, engineering insight facilitated the analysis. Sediments settle in regions of low water speed, as found typically in areas of recirculation and flow stagnation; these are commonly referred to as dead-water regions. Figure 2 shows sediments in a real ballast water tank. First, the two-phase (water and air) simulations of flow in ballast tanks helped identify dead-water areas corresponding to the sediment accumulation zones observed in the original design. Figure 3 shows the computed velocity distribution near the bottom wall. Then, various design alternatives for the ballast water tanks were used to optimize the stiffener spacing and cut-outs. The simulations permitted to identify the alternative design with least sediment settling (i.e. smallest dead-water regions) for future bulk carrier orders.
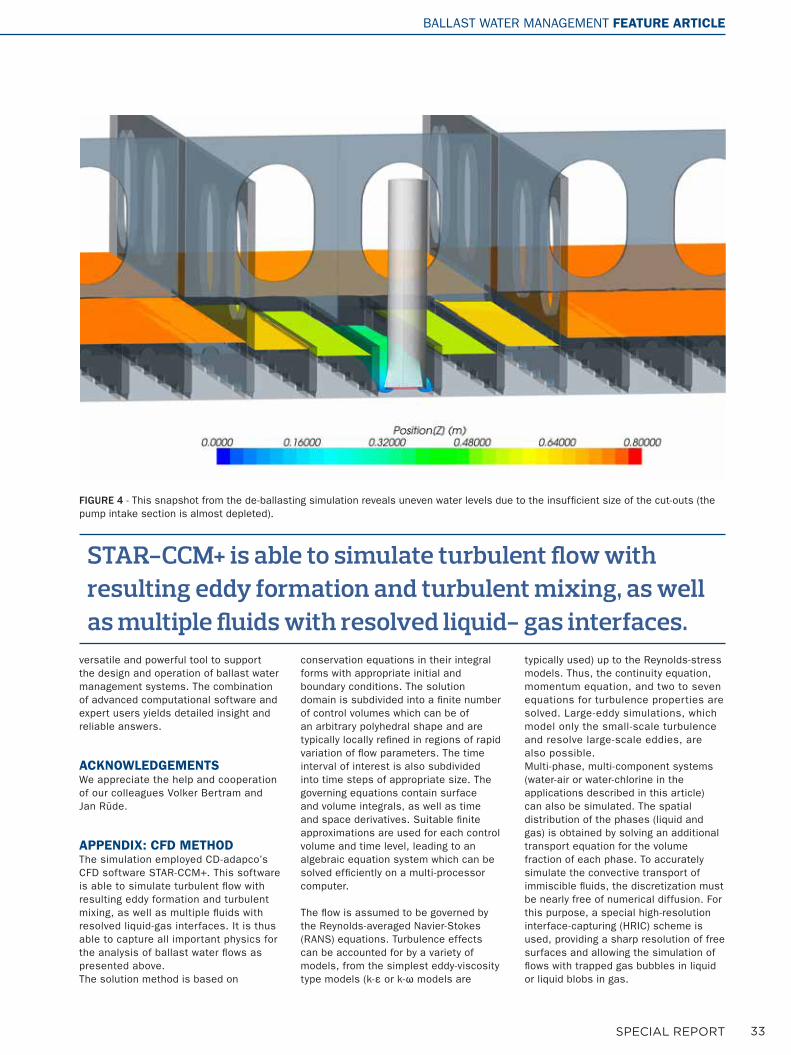
CASE STUDY 3: BALLAST WATER DE-BALLASTINGA busy coal terminal in Latin America had given strict time limits to de-ballast a bulk carrier at quay. The ballast pump was taking in air during de-ballasting, forcing the crew to stop de-ballasting intermittently. As a result, the vessel could not be de-ballasted in the time given by the terminal. The vessel had to leave with 3000 t of ballast water still in the tanks. Consequently, 2600 t of cargo could not be loaded, resulting in 125,000 € damage claims and the vessel being blacklisted at the terminal.A detailed analysis is often the first step in trouble-shooting. Once the problem has become transparent, the solution is straightforward. In this case, the first step was to simulate the de-ballasting process, setting up a three-dimensional model of the ballast water tanks and mimicking the pump by a prescribed flow rate at the outlet of the suction pipe. The outflux was set to the maximum pump capacity. The simulation of the two-phase flow revealed that during de-ballasting, the water level in neighboring fields was much higher than in the field with the ballast pump intake. Figure 4
shows the uneven water levels in various tank sections. The size of the water-flow openings in the longitudinal frames was too small for the de-ballasting rate of the pumps. The simulation provided information about the time-dependent flow rate through each opening and predicted the time at which air begins to be sucked by the pump. Animations of the free surface motion and the velocity distribution at various cross-sections gave the engineers direct insight into the physics of the flow and allowed an easy assessment of the problem, aiding the design of necessary geometrical modifications.
Based on the simulation data analysis, more and larger water-flow openings for the frames in the vicinity of the pump were suggested to synchronize fluxes through the openings with the pump intake’s flux. Sizes and locations of the water-flow openings were then determined such that the inflow toward the pump be above the pump rate, thus avoiding the risk of air being pumped.
CONCLUSIONCFD simulations have proven to be a
The combination of advanced computational software and expert users yields detailed insight and reliable answers.
FIGURE 2 - Sediments accumulate in ballast water tanks in areas with flow stagnation.
FIGURE 3 - CFD simulation of the velocity distribution in a ballast water tank close to the bottom wall
FEATURE ARTICLE BALLAST WATER MANAGEMENT
33SPECIAL REPORT
versatile and powerful tool to support the design and operation of ballast water management systems. The combination of advanced computational software and expert users yields detailed insight and reliable answers.
ACKNOWLEDGEMENTSWe appreciate the help and cooperation of our colleagues Volker Bertram and Jan Rüde.
APPENDIX: CFD METHODThe simulation employed CD-adapco’s CFD software STAR-CCM+. This software is able to simulate turbulent flow with resulting eddy formation and turbulent mixing, as well as multiple fluids with resolved liquid-gas interfaces. It is thus able to capture all important physics for the analysis of ballast water flows as presented above.The solution method is based on
conservation equations in their integral forms with appropriate initial and boundary conditions. The solution domain is subdivided into a finite number of control volumes which can be of an arbitrary polyhedral shape and are typically locally refined in regions of rapid variation of flow parameters. The time interval of interest is also subdivided into time steps of appropriate size. The governing equations contain surface and volume integrals, as well as time and space derivatives. Suitable finite approximations are used for each control volume and time level, leading to an algebraic equation system which can be solved efficiently on a multi-processor computer.
The flow is assumed to be governed by the Reynolds-averaged Navier-Stokes (RANS) equations. Turbulence effects can be accounted for by a variety of models, from the simplest eddy-viscosity type models (k-ε or k-ω models are
STAR-CCM+ is able to simulate turbulent flow with resulting eddy formation and turbulent mixing, as well as multiple fluids with resolved liquid- gas interfaces.
FIGURE 4 - This snapshot from the de-ballasting simulation reveals uneven water levels due to the insufficient size of the cut-outs (the pump intake section is almost depleted).
typically used) up to the Reynolds-stress models. Thus, the continuity equation, momentum equation, and two to seven equations for turbulence properties are solved. Large-eddy simulations, which model only the small-scale turbulence and resolve large-scale eddies, are also possible.Multi-phase, multi-component systems (water-air or water-chlorine in the applications described in this article) can also be simulated. The spatial distribution of the phases (liquid and gas) is obtained by solving an additional transport equation for the volume fraction of each phase. To accurately simulate the convective transport of immiscible fluids, the discretization must be nearly free of numerical diffusion. For this purpose, a special high-resolution interface-capturing (HRIC) scheme is used, providing a sharp resolution of free surfaces and allowing the simulation of flows with trapped gas bubbles in liquid or liquid blobs in gas.
BALLAST WATER MANAGEMENT FEATURE ARTICLE
34 SPECIAL REPORT
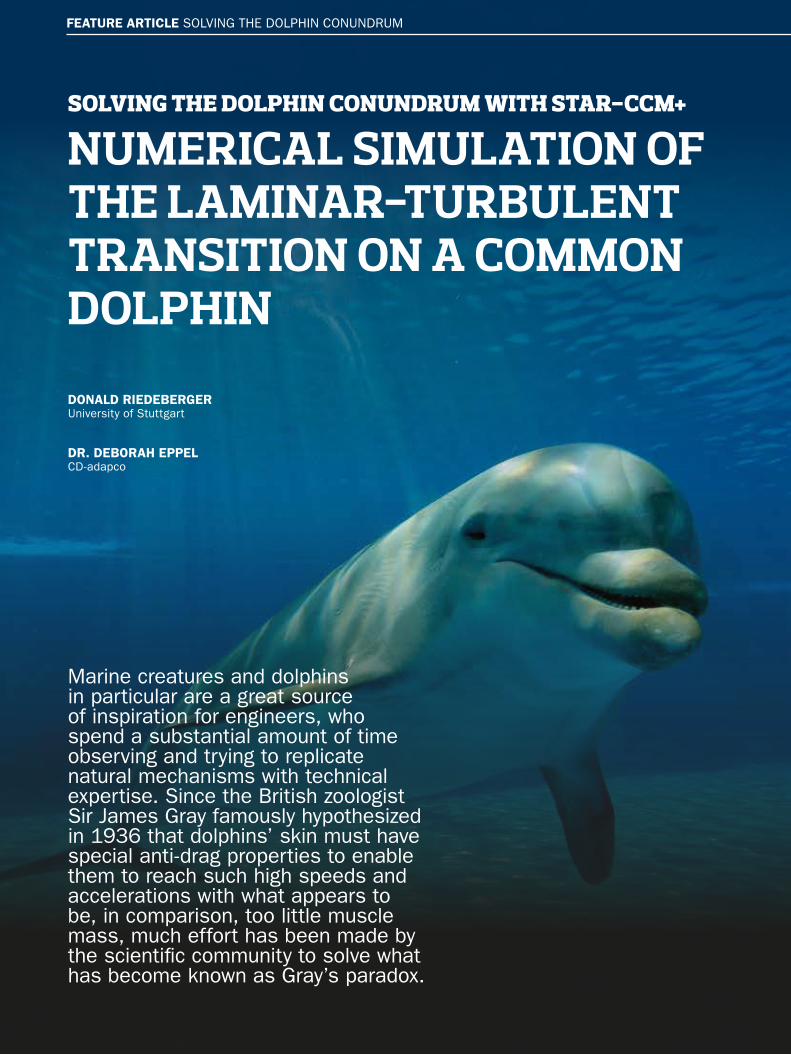
SOLVING THE DOLPHIN CONUNDRUM WITH STAR-CCM+
NUMERICAL SIMULATION OF THE LAMINAR-TURBULENT TRANSITION ON A COMMON DOLPHIN
DONALD RIEDEBERGERUniversity of Stuttgart
DR. DEBORAH EPPELCD-adapco
Marine creatures and dolphins in particular are a great source of inspiration for engineers, who spend a substantial amount of time observing and trying to replicate natural mechanisms with technical expertise. Since the British zoologist Sir James Gray famously hypothesized in 1936 that dolphins’ skin must have special anti-drag properties to enable them to reach such high speeds and accelerations with what appears to be, in comparison, too little muscle mass, much effort has been made by the scientific community to solve what has become known as Gray’s paradox.
FEATURE ARTICLE SOLVING THE DOLPHIN CONUNDRUM
35SPECIAL REPORT
In 2011, as part as his diploma thesis at the University of Stuttgart, Donald Riedeberger used high-end numerical simulation tools to analyze the laminar-turbulent transition on a common dolphin, thereby bringing the resolution of the dolphin conundrum one step closer to its completion and incidentally scooping the 1st place in both CD-adapco’s 2012 Academic CFD Image Contest and CD-adapco’s 2013 Calendar Contest. This article gives some insight into Donald’s simulation work about dolphins’ unique hydrodynamic properties.
WHY STAR-CCM+?The inherent differences between the characteristics of laminar and turbulent flow relating to skin-friction, and how these may impact dolphins’ locomotion, have been discussed for most of the past century: whether the dolphin shows a potential to extend the laminar flow region and thus reduce the drag force on its body has been in question since the proposition of Gray’s paradox.
Using CD-adapco’s flagship CFD-focused simulation software, STAR-CCM+®, the simulation of complex geometries may be approached using Reynolds-Averaged Navier-Stokes (RANS) equations combined with two-equation eddy-viscosity turbulence models. In
addition, STAR-CCM+’s γ-ReΘ model, a correlation-based transition model, enables the prediction of the laminar-turbulent transition. This is because of this transition model, and more particularly because its underlying correlations may easily be altered by user-defined functions, that STAR-CCM+ was chosen over the several (commercial and in-house) other CFD codes available at the Institute of Aerodynamics and Gas Dynamics (IAG) of the University of Stuttgart. Furthermore, the workflow, from geometry import to post-processing, was found intuitive and straightforward, making STAR-CCM+ an ideal candidate for short-term projects such as graduation theses.In the scope of this project, STAR-CCM+ was used to:• Analyze the behavior of the laminar-
turbulent transition depending on the Reynolds number.
• Assess the influence of the free-stream turbulence level on the onset of the transition.
• Estimate the potential of the dolphin’s skin for active laminarization.
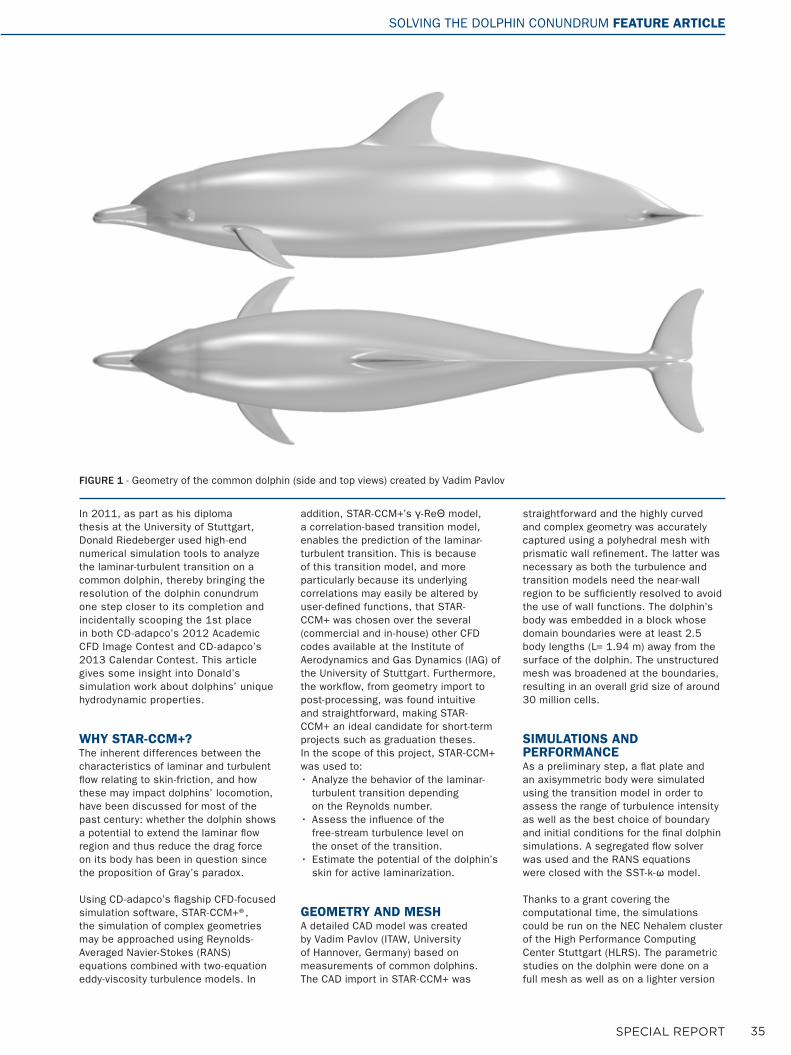
GEOMETRY AND MESHA detailed CAD model was created by Vadim Pavlov (ITAW, University of Hannover, Germany) based on measurements of common dolphins. The CAD import in STAR-CCM+ was
straightforward and the highly curved and complex geometry was accurately captured using a polyhedral mesh with prismatic wall refinement. The latter was necessary as both the turbulence and transition models need the near-wall region to be sufficiently resolved to avoid the use of wall functions. The dolphin’s body was embedded in a block whose domain boundaries were at least 2.5 body lengths (L= 1.94 m) away from the surface of the dolphin. The unstructured mesh was broadened at the boundaries, resulting in an overall grid size of around 30 million cells.
SIMULATIONS AND PERFORMANCEAs a preliminary step, a flat plate and an axisymmetric body were simulated using the transition model in order to assess the range of turbulence intensity as well as the best choice of boundary and initial conditions for the final dolphin simulations. A segregated flow solver was used and the RANS equations were closed with the SST-k-ω model.
Thanks to a grant covering the computational time, the simulations could be run on the NEC Nehalem cluster of the High Performance Computing Center Stuttgart (HLRS). The parametric studies on the dolphin were done on a full mesh as well as on a lighter version
FIGURE 1 - Geometry of the common dolphin (side and top views) created by Vadim Pavlov
SOLVING THE DOLPHIN CONUNDRUM FEATURE ARTICLE
36 SPECIAL REPORT
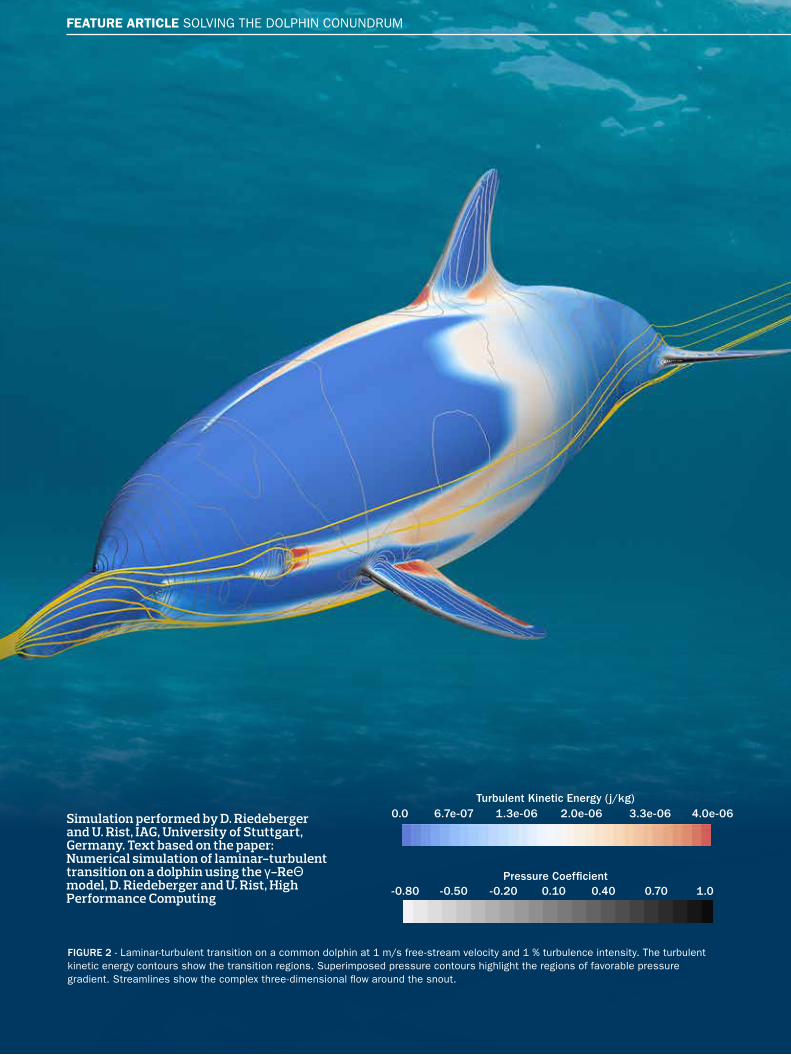
Turbulent Kinetic Energy (j/kg)0.0 6.7e-07 1.3e-06 2.0e-06 3.3e-06 4.0e-06
-0.80 -0.50 -0.20 0.10 0.40 0.70 1.0Pressure Coefficient
Simulation performed by D. Riedeberger and U. Rist, IAG, University of Stuttgart, Germany. Text based on the paper: Numerical simulation of laminar-turbulent transition on a dolphin using the γ-ReΘ model, D. Riedeberger and U. Rist, High Performance Computing
FIGURE 2 - Laminar-turbulent transition on a common dolphin at 1 m/s free-stream velocity and 1 % turbulence intensity. The turbulent kinetic energy contours show the transition regions. Superimposed pressure contours highlight the regions of favorable pressure gradient. Streamlines show the complex three-dimensional flow around the snout.
FEATURE ARTICLE SOLVING THE DOLPHIN CONUNDRUM
37SPECIAL REPORT
the analysis of a complex natural phenomenon on a realistic geometry possible. The γ-ReΘ transition model was coupled with the eddy-viscosity SST k-ω turbulence model to study the flow around a half-symmetric, three-dimensional dolphin geometry, including fin appendices. It was found that, at normal swimming speeds of about 3 m/s in a 1% turbulence-intensity environment, the flow around the dolphin is mainly turbulent with limited laminar regions at the front of the head. It was possible to roughly estimate drag reductions of around 20% if laminarization techniques exist which can delay the onset of the laminar-turbulent transition to locations comparable to those associated with lower values of free-stream turbulence intensity.
without fin appendices in order to reduce calculation costs. For most of the parametric studies, 48 processes on 8 nodes with 12 GB each were used, relating to 650,000 cells per core to gain a sufficient balance between work share and communication. Overall convergence for the momentum and continuity equations was gained as early as after 4000 iterations in 42 hours of elapsed time.
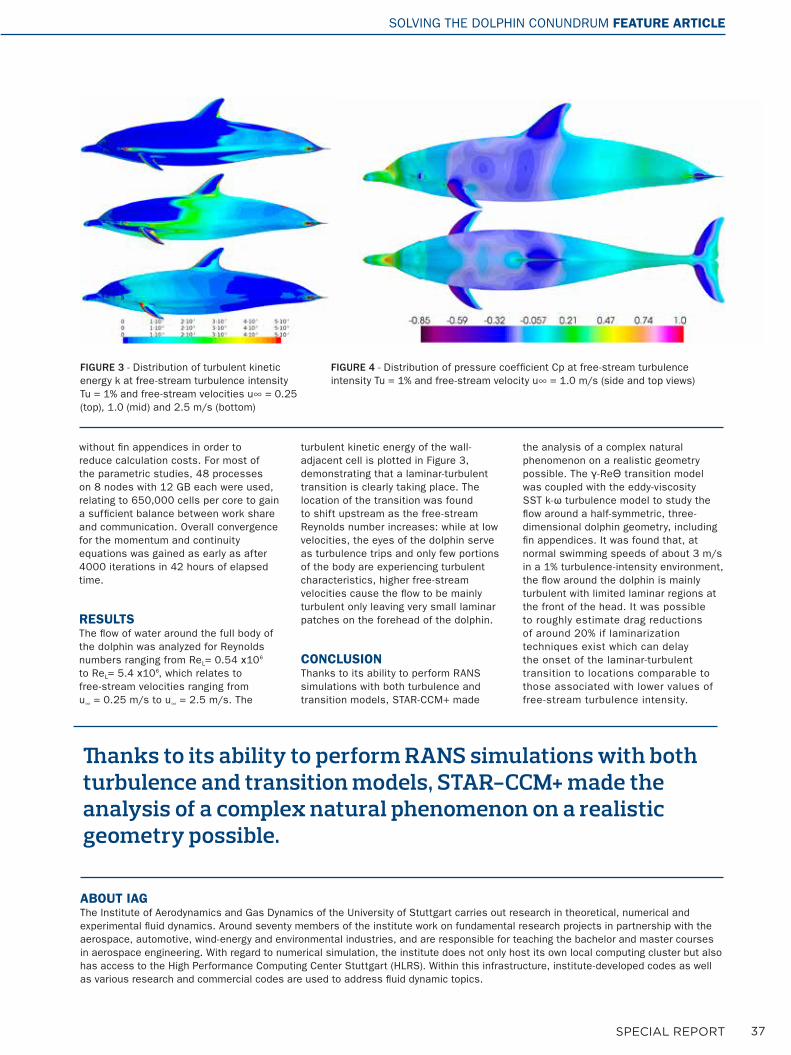
RESULTSThe flow of water around the full body of the dolphin was analyzed for Reynolds numbers ranging from ReL= 0.54 x10⁶ to ReL= 5.4 x10⁶, which relates to free-stream velocities ranging from u∞ = 0.25 m/s to u∞ = 2.5 m/s. The
turbulent kinetic energy of the wall-adjacent cell is plotted in Figure 3, demonstrating that a laminar-turbulent transition is clearly taking place. The location of the transition was found to shift upstream as the free-stream Reynolds number increases: while at low velocities, the eyes of the dolphin serve as turbulence trips and only few portions of the body are experiencing turbulent characteristics, higher free-stream velocities cause the flow to be mainly turbulent only leaving very small laminar patches on the forehead of the dolphin. CONCLUSIONThanks to its ability to perform RANS simulations with both turbulence and transition models, STAR-CCM+ made
FIGURE 3 - Distribution of turbulent kinetic energy k at free-stream turbulence intensity Tu = 1% and free-stream velocities u∞ = 0.25 (top), 1.0 (mid) and 2.5 m/s (bottom)
FIGURE 4 - Distribution of pressure coefficient Cp at free-stream turbulence intensity Tu = 1% and free-stream velocity u∞ = 1.0 m/s (side and top views)
ABOUT IAGThe Institute of Aerodynamics and Gas Dynamics of the University of Stuttgart carries out research in theoretical, numerical and experimental fluid dynamics. Around seventy members of the institute work on fundamental research projects in partnership with the aerospace, automotive, wind-energy and environmental industries, and are responsible for teaching the bachelor and master courses in aerospace engineering. With regard to numerical simulation, the institute does not only host its own local computing cluster but also has access to the High Performance Computing Center Stuttgart (HLRS). Within this infrastructure, institute-developed codes as well as various research and commercial codes are used to address fluid dynamic topics.
Thanks to its ability to perform RANS simulations with both turbulence and transition models, STAR-CCM+ made the analysis of a complex natural phenomenon on a realistic geometry possible.
SOLVING THE DOLPHIN CONUNDRUM FEATURE ARTICLE
38 SPECIAL REPORT
FEATURE ARTICLE OPTIMIZATION OF SPORTING VESSEL
39SPECIAL REPORT
SAIL DESIGN USING AN OPTIMIZATION AND FLUID STRUCTURE INTERACTION ALGORITHMEDWARD CANEPAUniversity of Genova
FABIO D’ANGELILa Spezia University
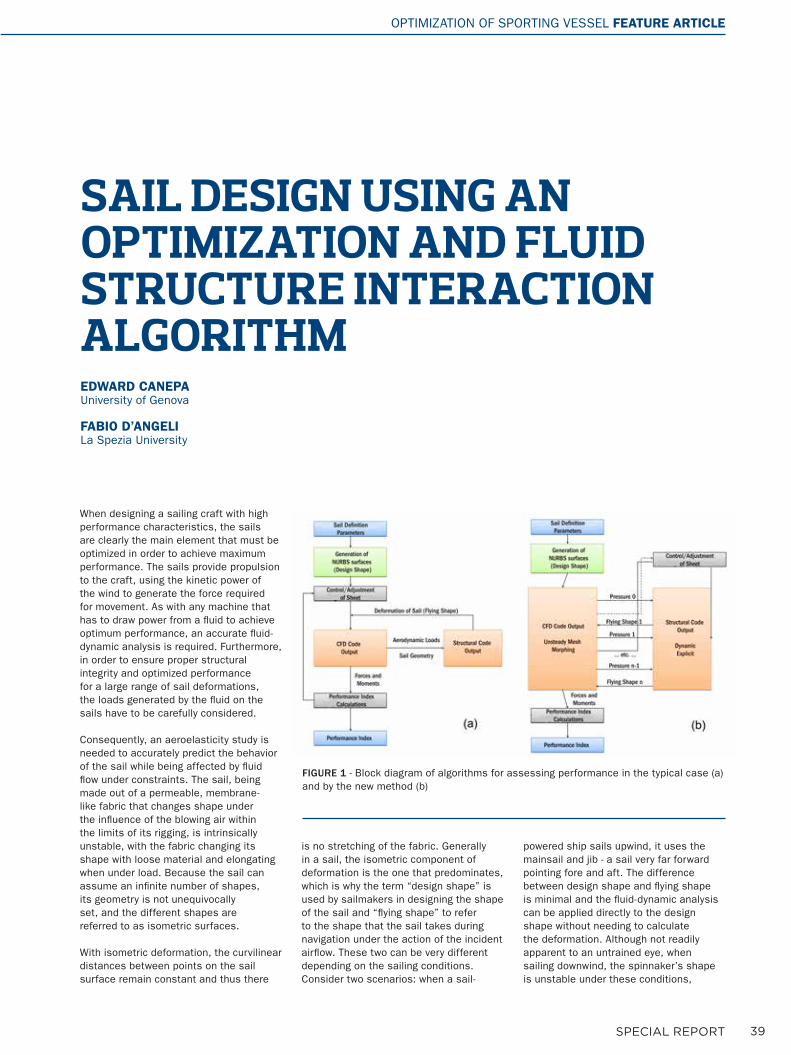
When designing a sailing craft with high performance characteristics, the sails are clearly the main element that must be optimized in order to achieve maximum performance. The sails provide propulsion to the craft, using the kinetic power of the wind to generate the force required for movement. As with any machine that has to draw power from a fluid to achieve optimum performance, an accurate fluid-dynamic analysis is required. Furthermore, in order to ensure proper structural integrity and optimized performance for a large range of sail deformations, the loads generated by the fluid on the sails have to be carefully considered.
Consequently, an aeroelasticity study is needed to accurately predict the behavior of the sail while being affected by fluid flow under constraints. The sail, being made out of a permeable, membrane-like fabric that changes shape under the influence of the blowing air within the limits of its rigging, is intrinsically unstable, with the fabric changing its shape with loose material and elongating when under load. Because the sail can assume an infinite number of shapes, its geometry is not unequivocally set, and the different shapes are referred to as isometric surfaces.
With isometric deformation, the curvilinear distances between points on the sail surface remain constant and thus there
is no stretching of the fabric. Generally in a sail, the isometric component of deformation is the one that predominates, which is why the term “design shape” is used by sailmakers in designing the shape of the sail and “flying shape” to refer to the shape that the sail takes during navigation under the action of the incident airflow. These two can be very different depending on the sailing conditions.Consider two scenarios: when a sail-
powered ship sails upwind, it uses the mainsail and jib - a sail very far forward pointing fore and aft. The difference between design shape and flying shape is minimal and the fluid-dynamic analysis can be applied directly to the design shape without needing to calculate the deformation. Although not readily apparent to an untrained eye, when sailing downwind, the spinnaker’s shape is unstable under these conditions,
FIGURE 1 - Block diagram of algorithms for assessing performance in the typical case (a) and by the new method (b)
OPTIMIZATION OF SPORTING VESSEL FEATURE ARTICLE
40 SPECIAL REPORT
causing the approximation to fail. The flying shape of a sail in the downwind case is vastly different from the design shape; thus if the aerodynamics are analysed solely on the basis of the latter, major performance errors are likely to occur. Calculating the flying shape is thus fundamental as well as incredibly difficult.
In order to properly simulate such a complex phenomenon, two separate regimes must be considered. From a fluid-dynamics perspective, the simulation of a sail when the boat is sailing downwind is more challenging than for a ship sailing upwind as there is considerable flow separation, thereby restricting the simulation to CFD software that solves RANS, LES or similar equation systems. RANS, or Reynolds Averaged Navier Stokes, are a set of time averaged equations of motion for fluid flow. This calculation scheme is relatively fast and calculates turbulent flow well. LES, short for Large Eddy Simulations, is based on filtering instead of averaging. A filter speed is set and flow speeds larger than the filter speed will be exactly calculated, while flow speeds smaller than the filter speed will be modeled. This is a much
more time consuming, but more accurate method of calculating fluid flow. From a structural point of view, the deformation phenomenon is distinctly non-linear both in geometric and material terms and is highly complex.
Because of these complex calculations, the design and construction of sails has historically relied on the experience of sailmakers who have the expertise to create sails garnered by thousands of years of experimentation as opposed to mathematical and physical simulation using CFD codes. Only in the last ten years has sail design started using scientific analyses.Seeking greater clarity on the subject, La Spezia University began a class research project in its Nautical Engineering department aimed at developing a design and optimization algorithm for sail geometry. This research is critical because optimization of the geometry (design shape) in various wind conditions can only be done with a known flying shape. Without one known flying shape, it would be impossible to calculate the load the wind applies to the sail. As has already been noted above, the
optimization process is complex, involving at the very least all of the steps below:
• Determination of the sail geometry based on specified dimensions;
• Generation of the sail surface area using the parameters defined above;
• Analysis of performance (thrust generated by the sail);
• Assessment of the shape of the sail when subjected to the aerodynamic loads calculated in the preceding point, while constrained to the fixed points where the sail attaches to the mast;
• Introduction of possible variations in constraint conditions, representing adjustments made by the crew to achieve maximum propelling thrust.
The conventional workflow summarized by this sequence of operations is shown in figure 1 and can be termed the “analysis algorithm”. This can in turn be used by a plugin optimization code which identifies user-selected input variables and optimizes its output. In the case of sail performance optimization, the above process uses the parameters that define the sail geometry as input
FIGURE 2 - Trend in pressure on mainsail and gennaker with flow lines (view from stern)
FIGURE 3 - Trend in pressure on mainsail and gennaker with flow lines (view from bow)
FIGURE 4 - Trend in displacement and tensile stresses on a gennaker
FIGURE 5 - Flying shape of a gennaker
FEATURE ARTICLE OPTIMIZATION OF SPORTING VESSEL
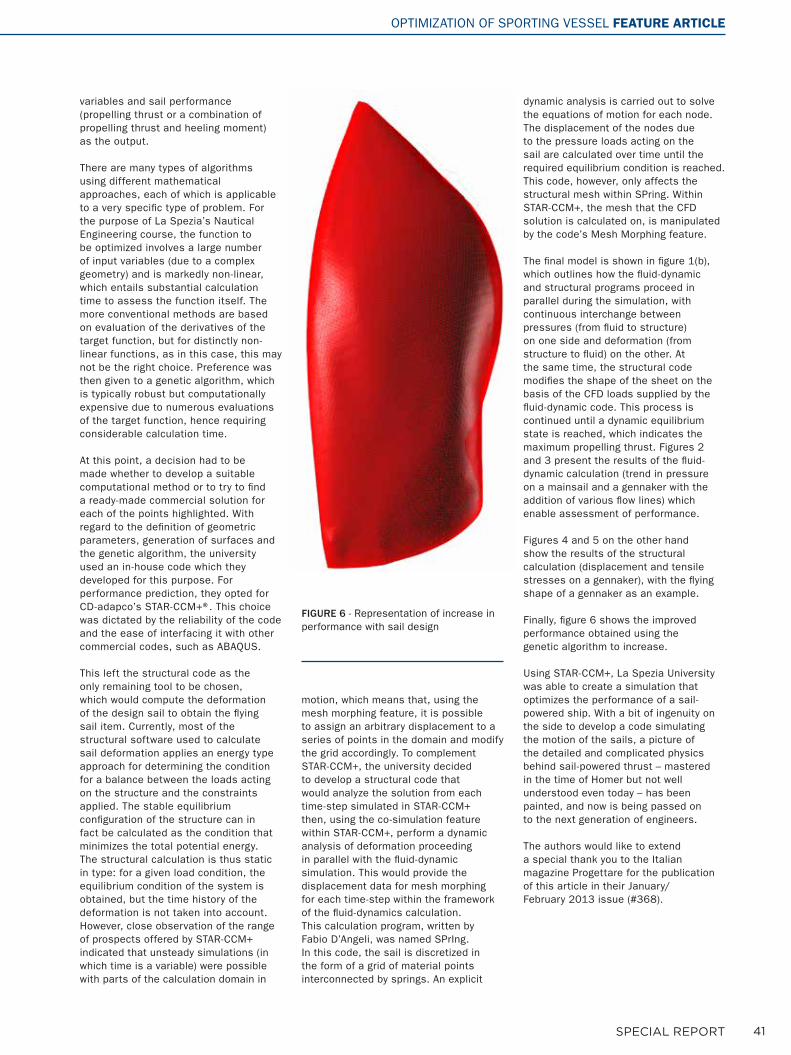
41SPECIAL REPORT
FIGURE 6 - Representation of increase in performance with sail design
variables and sail performance (propelling thrust or a combination of propelling thrust and heeling moment) as the output.
There are many types of algorithms using different mathematical approaches, each of which is applicable to a very specific type of problem. For the purpose of La Spezia’s Nautical Engineering course, the function to be optimized involves a large number of input variables (due to a complex geometry) and is markedly non-linear, which entails substantial calculation time to assess the function itself. The more conventional methods are based on evaluation of the derivatives of the target function, but for distinctly non-linear functions, as in this case, this may not be the right choice. Preference was then given to a genetic algorithm, which is typically robust but computationally expensive due to numerous evaluations of the target function, hence requiring considerable calculation time.
At this point, a decision had to be made whether to develop a suitable computational method or to try to find a ready-made commercial solution for each of the points highlighted. With regard to the definition of geometric parameters, generation of surfaces and the genetic algorithm, the university used an in-house code which they developed for this purpose. For performance prediction, they opted for CD-adapco’s STAR-CCM+®. This choice was dictated by the reliability of the code and the ease of interfacing it with other commercial codes, such as ABAQUS.
This left the structural code as the only remaining tool to be chosen, which would compute the deformation of the design sail to obtain the flying sail item. Currently, most of the structural software used to calculate sail deformation applies an energy type approach for determining the condition for a balance between the loads acting on the structure and the constraints applied. The stable equilibrium configuration of the structure can in fact be calculated as the condition that minimizes the total potential energy. The structural calculation is thus static in type: for a given load condition, the equilibrium condition of the system is obtained, but the time history of the deformation is not taken into account.However, close observation of the range of prospects offered by STAR-CCM+ indicated that unsteady simulations (in which time is a variable) were possible with parts of the calculation domain in
motion, which means that, using the mesh morphing feature, it is possible to assign an arbitrary displacement to a series of points in the domain and modify the grid accordingly. To complement STAR-CCM+, the university decided to develop a structural code that would analyze the solution from each time-step simulated in STAR-CCM+ then, using the co-simulation feature within STAR-CCM+, perform a dynamic analysis of deformation proceeding in parallel with the fluid-dynamic simulation. This would provide the displacement data for mesh morphing for each time-step within the framework of the fluid-dynamics calculation.This calculation program, written by Fabio D’Angeli, was named SPrIng. In this code, the sail is discretized in the form of a grid of material points interconnected by springs. An explicit
dynamic analysis is carried out to solve the equations of motion for each node. The displacement of the nodes due to the pressure loads acting on the sail are calculated over time until the required equilibrium condition is reached. This code, however, only affects the structural mesh within SPring. Within STAR-CCM+, the mesh that the CFD solution is calculated on, is manipulated by the code’s Mesh Morphing feature.
The final model is shown in figure 1(b), which outlines how the fluid-dynamic and structural programs proceed in parallel during the simulation, with continuous interchange between pressures (from fluid to structure) on one side and deformation (from structure to fluid) on the other. At the same time, the structural code modifies the shape of the sheet on the basis of the CFD loads supplied by the fluid-dynamic code. This process is continued until a dynamic equilibrium state is reached, which indicates the maximum propelling thrust. Figures 2 and 3 present the results of the fluid-dynamic calculation (trend in pressure on a mainsail and a gennaker with the addition of various flow lines) which enable assessment of performance.
Figures 4 and 5 on the other hand show the results of the structural calculation (displacement and tensile stresses on a gennaker), with the flying shape of a gennaker as an example.
Finally, figure 6 shows the improved performance obtained using the genetic algorithm to increase.
Using STAR-CCM+, La Spezia University was able to create a simulation that optimizes the performance of a sail-powered ship. With a bit of ingenuity on the side to develop a code simulating the motion of the sails, a picture of the detailed and complicated physics behind sail-powered thrust – mastered in the time of Homer but not well understood even today – has been painted, and now is being passed on to the next generation of engineers.
The authors would like to extend a special thank you to the Italian magazine Progettare for the publication of this article in their January/February 2013 issue (#368).
OPTIMIZATION OF SPORTING VESSEL FEATURE ARTICLE
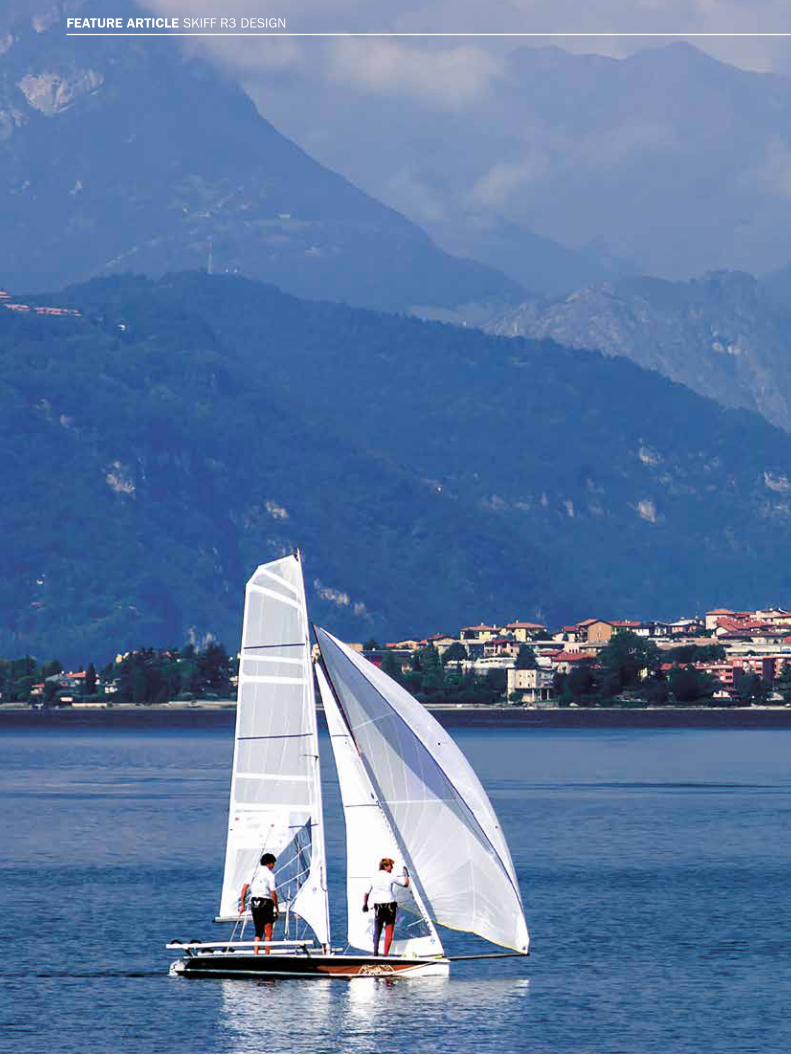
42 SPECIAL REPORT
FEATURE ARTICLE SKIFF R3 DESIGN
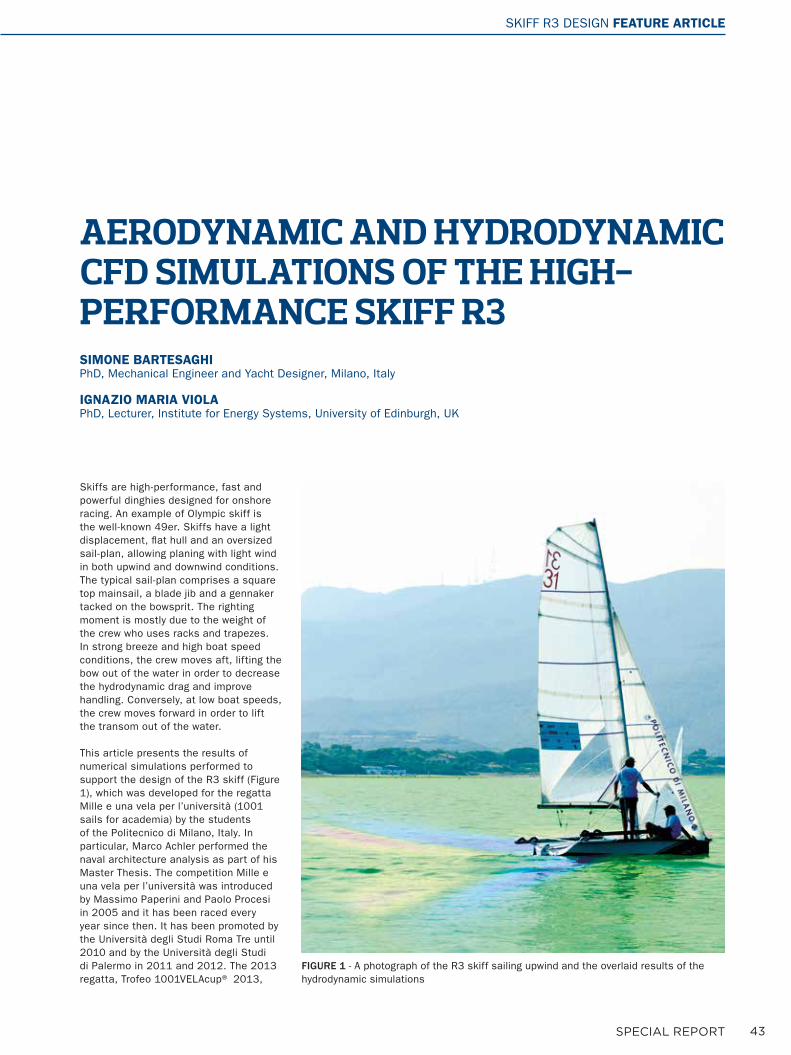
43SPECIAL REPORT
AERODYNAMIC AND HYDRODYNAMIC CFD SIMULATIONS OF THE HIGH-PERFORMANCE SKIFF R3SIMONE BARTESAGHIPhD, Mechanical Engineer and Yacht Designer, Milano, Italy
IGNAZIO MARIA VIOLA PhD, Lecturer, Institute for Energy Systems, University of Edinburgh, UK
Skiffs are high-performance, fast and powerful dinghies designed for onshore racing. An example of Olympic skiff is the well-known 49er. Skiffs have a light displacement, flat hull and an oversized sail-plan, allowing planing with light wind in both upwind and downwind conditions. The typical sail-plan comprises a square top mainsail, a blade jib and a gennaker tacked on the bowsprit. The righting moment is mostly due to the weight of the crew who uses racks and trapezes. In strong breeze and high boat speed conditions, the crew moves aft, lifting the bow out of the water in order to decrease the hydrodynamic drag and improve handling. Conversely, at low boat speeds, the crew moves forward in order to lift the transom out of the water.
This article presents the results of numerical simulations performed to support the design of the R3 skiff (Figure 1), which was developed for the regatta Mille e una vela per l’università (1001 sails for academia) by the students of the Politecnico di Milano, Italy. In particular, Marco Achler performed the naval architecture analysis as part of his Master Thesis. The competition Mille e una vela per l’università was introduced by Massimo Paperini and Paolo Procesi in 2005 and it has been raced every year since then. It has been promoted by the Università degli Studi Roma Tre until 2010 and by the Università degli Studi di Palermo in 2011 and 2012. The 2013 regatta, Trofeo 1001VELAcup® 2013,
FIGURE 1 - A photograph of the R3 skiff sailing upwind and the overlaid results of the hydrodynamic simulations
SKIFF R3 DESIGN FEATURE ARTICLE
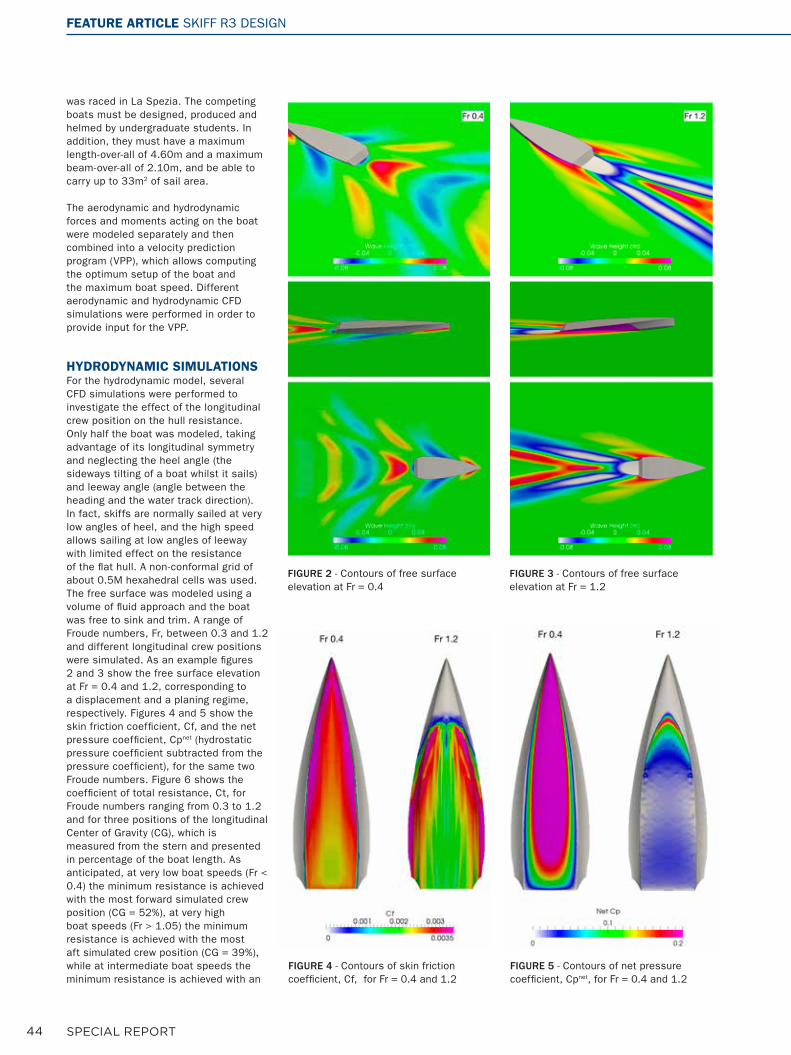
44 SPECIAL REPORT
was raced in La Spezia. The competing boats must be designed, produced and helmed by undergraduate students. In addition, they must have a maximum length-over-all of 4.60m and a maximum beam-over-all of 2.10m, and be able to carry up to 33m2 of sail area.
The aerodynamic and hydrodynamic forces and moments acting on the boat were modeled separately and then combined into a velocity prediction program (VPP), which allows computing the optimum setup of the boat and the maximum boat speed. Different aerodynamic and hydrodynamic CFD simulations were performed in order to provide input for the VPP.
HYDRODYNAMIC SIMULATIONSFor the hydrodynamic model, several CFD simulations were performed to investigate the effect of the longitudinal crew position on the hull resistance. Only half the boat was modeled, taking advantage of its longitudinal symmetry and neglecting the heel angle (the sideways tilting of a boat whilst it sails) and leeway angle (angle between the heading and the water track direction). In fact, skiffs are normally sailed at very low angles of heel, and the high speed allows sailing at low angles of leeway with limited effect on the resistance of the flat hull. A non-conformal grid of about 0.5M hexahedral cells was used. The free surface was modeled using a volume of fluid approach and the boat was free to sink and trim. A range of Froude numbers, Fr, between 0.3 and 1.2 and different longitudinal crew positions were simulated. As an example figures 2 and 3 show the free surface elevation at Fr = 0.4 and 1.2, corresponding to a displacement and a planing regime, respectively. Figures 4 and 5 show the skin friction coefficient, Cf, and the net pressure coefficient, Cpnet (hydrostatic pressure coefficient subtracted from the pressure coefficient), for the same two Froude numbers. Figure 6 shows the coefficient of total resistance, Ct, for Froude numbers ranging from 0.3 to 1.2 and for three positions of the longitudinal Center of Gravity (CG), which is measured from the stern and presented in percentage of the boat length. As anticipated, at very low boat speeds (Fr < 0.4) the minimum resistance is achieved with the most forward simulated crew position (CG = 52%), at very high boat speeds (Fr > 1.05) the minimum resistance is achieved with the most aft simulated crew position (CG = 39%), while at intermediate boat speeds the minimum resistance is achieved with an
FIGURE 3 - Contours of free surface elevation at Fr = 1.2
FIGURE 4 - Contours of skin friction coefficient, Cf, for Fr = 0.4 and 1.2
FIGURE 5 - Contours of net pressure coefficient, Cpnet, for Fr = 0.4 and 1.2
FIGURE 2 - Contours of free surface elevation at Fr = 0.4
FEATURE ARTICLE SKIFF R3 DESIGN
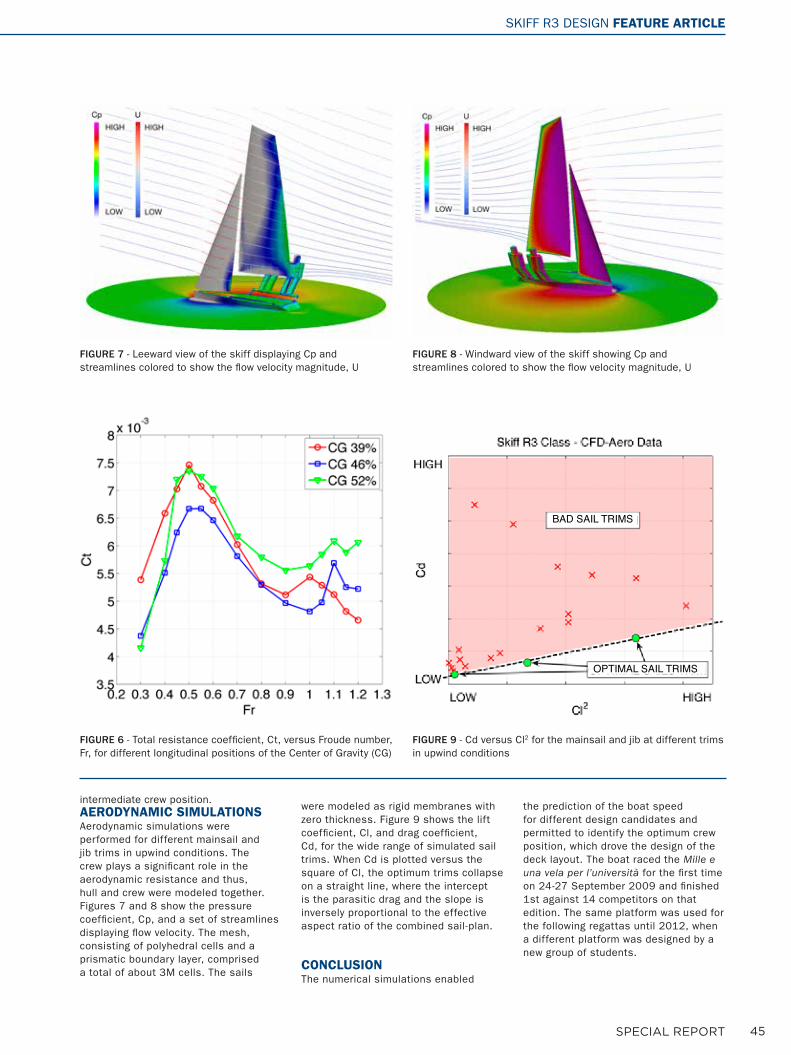
45SPECIAL REPORT
BAD SAIL TRIMS
OPTIMAL SAIL TRIMS
FIGURE 6 - Total resistance coefficient, Ct, versus Froude number, Fr, for different longitudinal positions of the Center of Gravity (CG)
FIGURE 7 - Leeward view of the skiff displaying Cp and streamlines colored to show the flow velocity magnitude, U
FIGURE 8 - Windward view of the skiff showing Cp and streamlines colored to show the flow velocity magnitude, U
FIGURE 9 - Cd versus Cl2 for the mainsail and jib at different trims in upwind conditions
intermediate crew position.AERODYNAMIC SIMULATIONSAerodynamic simulations were performed for different mainsail and jib trims in upwind conditions. The crew plays a significant role in the aerodynamic resistance and thus, hull and crew were modeled together. Figures 7 and 8 show the pressure coefficient, Cp, and a set of streamlines displaying flow velocity. The mesh, consisting of polyhedral cells and a prismatic boundary layer, comprised a total of about 3M cells. The sails
were modeled as rigid membranes with zero thickness. Figure 9 shows the lift coefficient, Cl, and drag coefficient, Cd, for the wide range of simulated sail trims. When Cd is plotted versus the square of Cl, the optimum trims collapse on a straight line, where the intercept is the parasitic drag and the slope is inversely proportional to the effective aspect ratio of the combined sail-plan.
CONCLUSIONThe numerical simulations enabled
the prediction of the boat speed for different design candidates and permitted to identify the optimum crew position, which drove the design of the deck layout. The boat raced the Mille e una vela per l’università for the first time on 24-27 September 2009 and finished 1st against 14 competitors on that edition. The same platform was used for the following regattas until 2012, when a different platform was designed by a new group of students.
SKIFF R3 DESIGN FEATURE ARTICLE
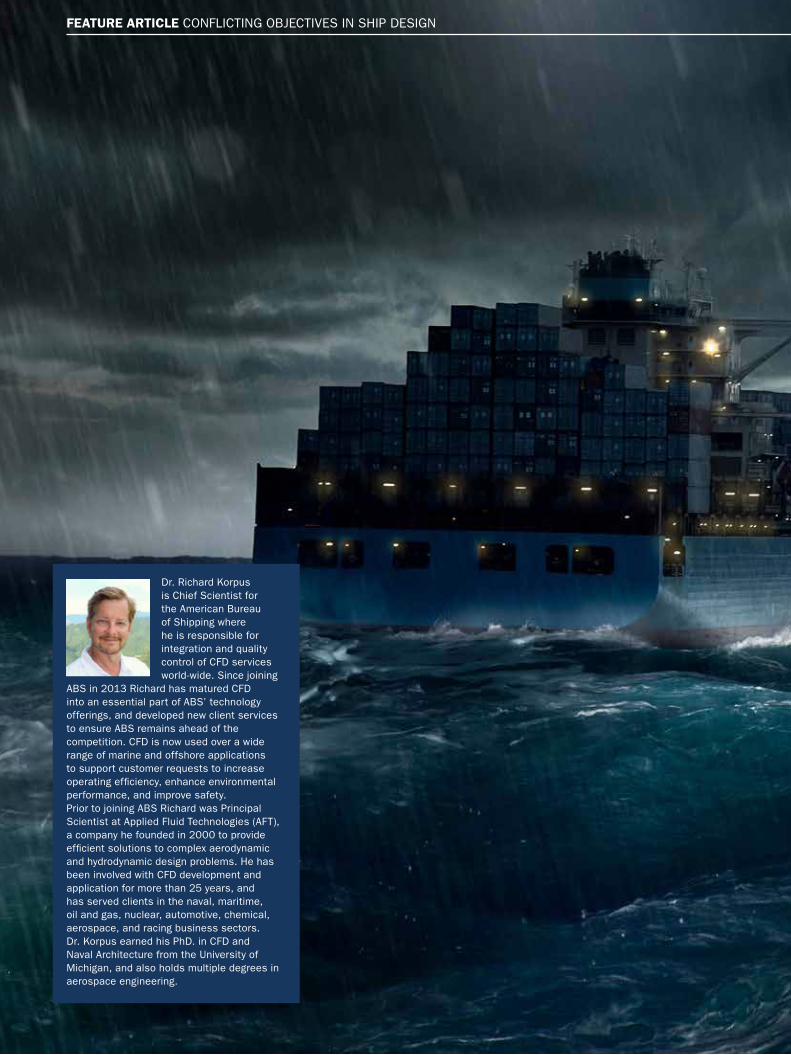
46 SPECIAL REPORT
Dr. Richard Korpus is Chief Scientist for the American Bureau of Shipping where he is responsible for integration and quality control of CFD services world-wide. Since joining
ABS in 2013 Richard has matured CFD into an essential part of ABS’ technology offerings, and developed new client services to ensure ABS remains ahead of the competition. CFD is now used over a wide range of marine and offshore applications to support customer requests to increase operating efficiency, enhance environmental performance, and improve safety. Prior to joining ABS Richard was Principal Scientist at Applied Fluid Technologies (AFT), a company he founded in 2000 to provide efficient solutions to complex aerodynamic and hydrodynamic design problems. He has been involved with CFD development and application for more than 25 years, and has served clients in the naval, maritime, oil and gas, nuclear, automotive, chemical, aerospace, and racing business sectors. Dr. Korpus earned his PhD. in CFD and Naval Architecture from the University of Michigan, and also holds multiple degrees in aerospace engineering.
FEATURE ARTICLE CONFLICTING OBJECTIVES IN SHIP DESIGN
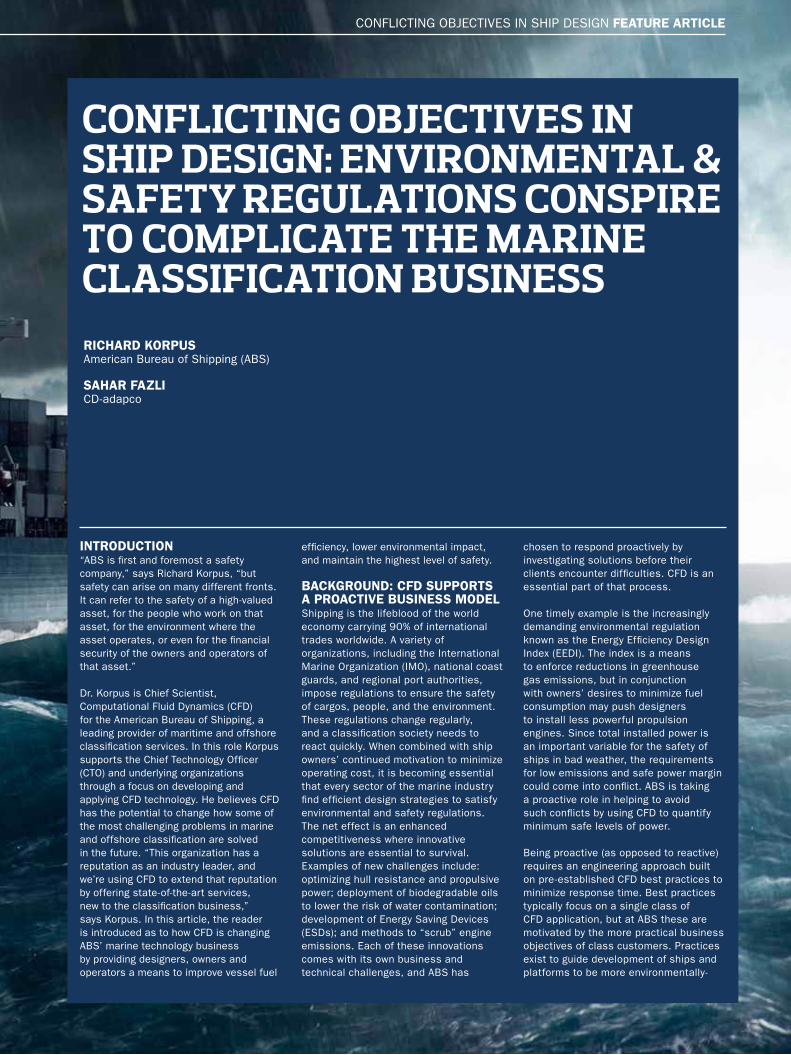
47SPECIAL REPORT
RICHARD KORPUSAmerican Bureau of Shipping (ABS)
SAHAR FAZLICD-adapco
INTRODUCTION“ABS is first and foremost a safety company,” says Richard Korpus, “but safety can arise on many different fronts. It can refer to the safety of a high-valued asset, for the people who work on that asset, for the environment where the asset operates, or even for the financial security of the owners and operators of that asset.”
Dr. Korpus is Chief Scientist, Computational Fluid Dynamics (CFD) for the American Bureau of Shipping, a leading provider of maritime and offshore classification services. In this role Korpus supports the Chief Technology Officer (CTO) and underlying organizations through a focus on developing and applying CFD technology. He believes CFD has the potential to change how some of the most challenging problems in marine and offshore classification are solved in the future. “This organization has a reputation as an industry leader, and we’re using CFD to extend that reputation by offering state-of-the-art services, new to the classification business,” says Korpus. In this article, the reader is introduced as to how CFD is changing ABS’ marine technology business by providing designers, owners and operators a means to improve vessel fuel
CONFLICTING OBJECTIVES IN SHIP DESIGN: ENVIRONMENTAL & SAFETY REGULATIONS CONSPIRE TO COMPLICATE THE MARINE CLASSIFICATION BUSINESS
efficiency, lower environmental impact, and maintain the highest level of safety.
BACKGROUND: CFD SUPPORTS A PROACTIVE BUSINESS MODEL Shipping is the lifeblood of the world economy carrying 90% of international trades worldwide. A variety of organizations, including the International Marine Organization (IMO), national coast guards, and regional port authorities, impose regulations to ensure the safety of cargos, people, and the environment. These regulations change regularly, and a classification society needs to react quickly. When combined with ship owners’ continued motivation to minimize operating cost, it is becoming essential that every sector of the marine industry find efficient design strategies to satisfy environmental and safety regulations. The net effect is an enhanced competitiveness where innovative solutions are essential to survival. Examples of new challenges include: optimizing hull resistance and propulsive power; deployment of biodegradable oils to lower the risk of water contamination; development of Energy Saving Devices (ESDs); and methods to “scrub” engine emissions. Each of these innovations comes with its own business and technical challenges, and ABS has
chosen to respond proactively by investigating solutions before their clients encounter difficulties. CFD is an essential part of that process.
One timely example is the increasingly demanding environmental regulation known as the Energy Efficiency Design Index (EEDI). The index is a means to enforce reductions in greenhouse gas emissions, but in conjunction with owners’ desires to minimize fuel consumption may push designers to install less powerful propulsion engines. Since total installed power is an important variable for the safety of ships in bad weather, the requirements for low emissions and safe power margin could come into conflict. ABS is taking a proactive role in helping to avoid such conflicts by using CFD to quantify minimum safe levels of power.
Being proactive (as opposed to reactive) requires an engineering approach built on pre-established CFD best practices to minimize response time. Best practices typically focus on a single class of CFD application, but at ABS these are motivated by the more practical business objectives of class customers. Practices exist to guide development of ships and platforms to be more environmentally-
CONFLICTING OBJECTIVES IN SHIP DESIGN FEATURE ARTICLE
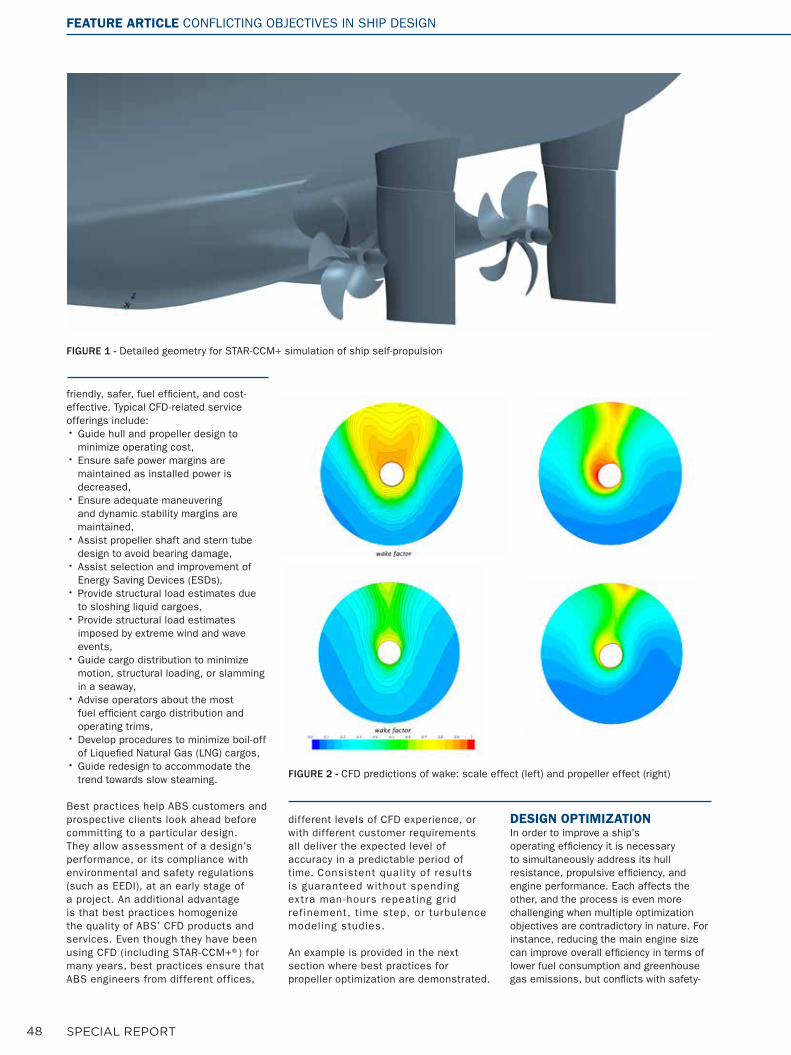
48 SPECIAL REPORT
friendly, safer, fuel efficient, and cost-effective. Typical CFD-related service offerings include:• Guide hull and propeller design to
minimize operating cost, • Ensure safe power margins are
maintained as installed power is decreased,
• Ensure adequate maneuvering and dynamic stability margins are maintained,
• Assist propeller shaft and stern tube design to avoid bearing damage,
• Assist selection and improvement of Energy Saving Devices (ESDs),
• Provide structural load estimates due to sloshing liquid cargoes,
• Provide structural load estimates imposed by extreme wind and wave events,
• Guide cargo distribution to minimize motion, structural loading, or slamming in a seaway,
• Advise operators about the most fuel efficient cargo distribution and operating trims,
• Develop procedures to minimize boil-off of Liquefied Natural Gas (LNG) cargos,
• Guide redesign to accommodate the trend towards slow steaming.
Best practices help ABS customers and prospective clients look ahead before committing to a particular design. They allow assessment of a design’s performance, or its compliance with environmental and safety regulations (such as EEDI), at an early stage of a project. An additional advantage is that best practices homogenize the quality of ABS’ CFD products and services. Even though they have been using CFD (including STAR-CCM+®) for many years, best practices ensure that ABS engineers from different offices,
different levels of CFD experience, or with different customer requirements all deliver the expected level of accuracy in a predictable period of time. Consistent quality of results is guaranteed without spending extra man-hours repeating grid ref inement, time step, or turbulence modeling studies.
An example is provided in the next section where best practices for propeller optimization are demonstrated.
DESIGN OPTIMIZATION In order to improve a ship’s operating efficiency it is necessary to simultaneously address its hull resistance, propulsive efficiency, and engine performance. Each affects the other, and the process is even more challenging when multiple optimization objectives are contradictory in nature. For instance, reducing the main engine size can improve overall efficiency in terms of lower fuel consumption and greenhouse gas emissions, but conflicts with safety-
FIGURE 1 - Detailed geometry for STAR-CCM+ simulation of ship self-propulsion
FIGURE 2 - CFD predictions of wake: scale effect (left) and propeller effect (right)
FEATURE ARTICLE CONFLICTING OBJECTIVES IN SHIP DESIGN
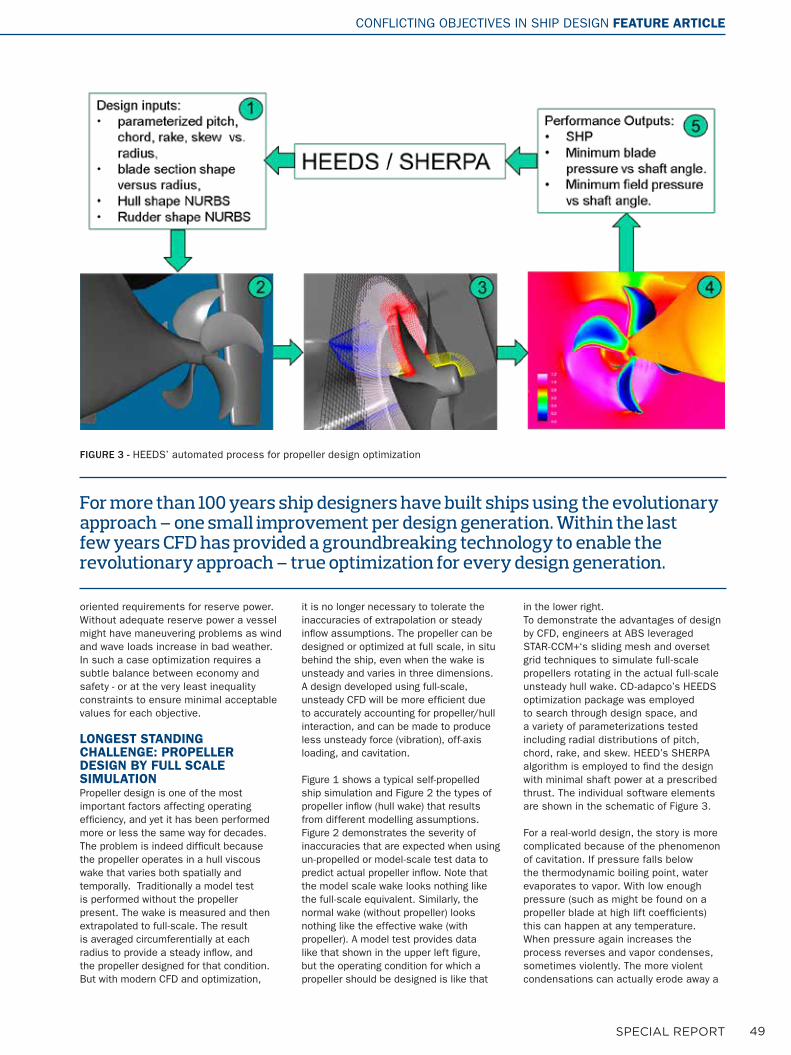
49SPECIAL REPORT
oriented requirements for reserve power. Without adequate reserve power a vessel might have maneuvering problems as wind and wave loads increase in bad weather. In such a case optimization requires a subtle balance between economy and safety - or at the very least inequality constraints to ensure minimal acceptable values for each objective.
LONGEST STANDING CHALLENGE: PROPELLER DESIGN BY FULL SCALE SIMULATIONPropeller design is one of the most important factors affecting operating efficiency, and yet it has been performed more or less the same way for decades. The problem is indeed difficult because the propeller operates in a hull viscous wake that varies both spatially and temporally. Traditionally a model test is performed without the propeller present. The wake is measured and then extrapolated to full-scale. The result is averaged circumferentially at each radius to provide a steady inflow, and the propeller designed for that condition. But with modern CFD and optimization,
it is no longer necessary to tolerate the inaccuracies of extrapolation or steady inflow assumptions. The propeller can be designed or optimized at full scale, in situ behind the ship, even when the wake is unsteady and varies in three dimensions. A design developed using full-scale, unsteady CFD will be more efficient due to accurately accounting for propeller/hull interaction, and can be made to produce less unsteady force (vibration), off-axis loading, and cavitation.
Figure 1 shows a typical self-propelled ship simulation and Figure 2 the types of propeller inflow (hull wake) that results from different modelling assumptions. Figure 2 demonstrates the severity of inaccuracies that are expected when using un-propelled or model-scale test data to predict actual propeller inflow. Note that the model scale wake looks nothing like the full-scale equivalent. Similarly, the normal wake (without propeller) looks nothing like the effective wake (with propeller). A model test provides data like that shown in the upper left figure, but the operating condition for which a propeller should be designed is like that
in the lower right. To demonstrate the advantages of design by CFD, engineers at ABS leveraged STAR-CCM+‘s sliding mesh and overset grid techniques to simulate full-scale propellers rotating in the actual full-scale unsteady hull wake. CD-adapco’s HEEDS optimization package was employed to search through design space, and a variety of parameterizations tested including radial distributions of pitch, chord, rake, and skew. HEED’s SHERPA algorithm is employed to find the design with minimal shaft power at a prescribed thrust. The individual software elements are shown in the schematic of Figure 3. For a real-world design, the story is more complicated because of the phenomenon of cavitation. If pressure falls below the thermodynamic boiling point, water evaporates to vapor. With low enough pressure (such as might be found on a propeller blade at high lift coefficients) this can happen at any temperature. When pressure again increases the process reverses and vapor condenses, sometimes violently. The more violent condensations can actually erode away a
FIGURE 3 - HEEDS’ automated process for propeller design optimization
For more than 100 years ship designers have built ships using the evolutionary approach – one small improvement per design generation. Within the last few years CFD has provided a groundbreaking technology to enable the revolutionary approach – true optimization for every design generation.
CONFLICTING OBJECTIVES IN SHIP DESIGN FEATURE ARTICLE
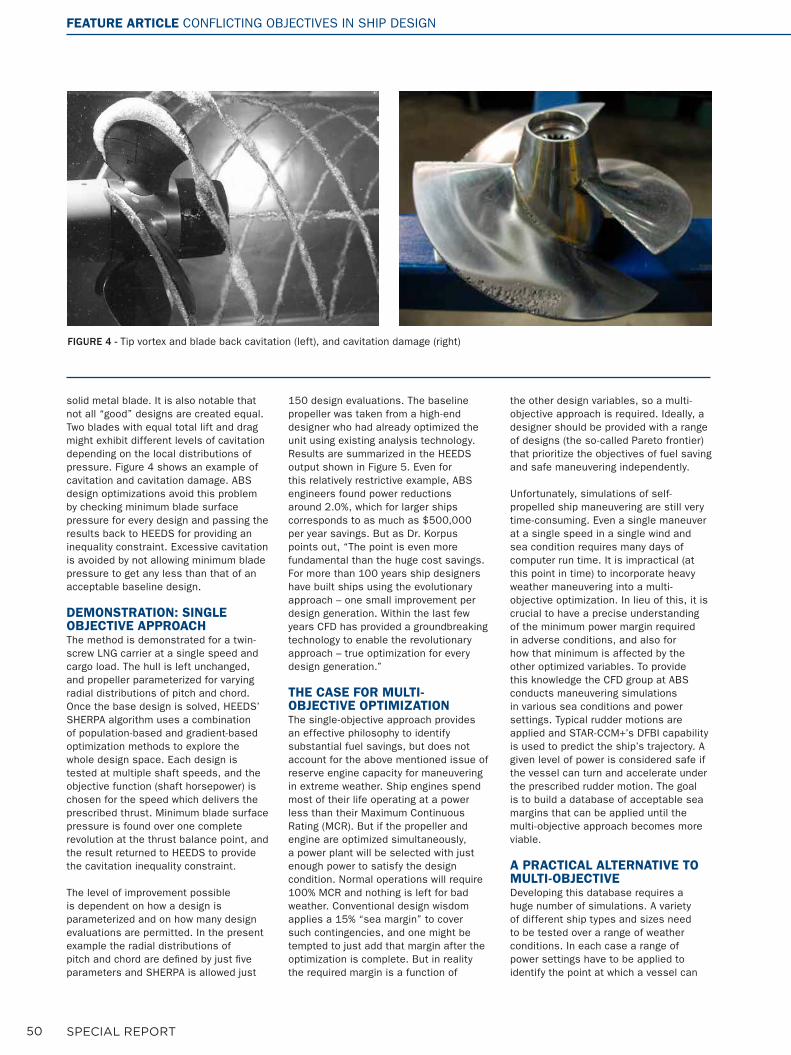
50 SPECIAL REPORT
solid metal blade. It is also notable that not all “good” designs are created equal. Two blades with equal total lift and drag might exhibit different levels of cavitation depending on the local distributions of pressure. Figure 4 shows an example of cavitation and cavitation damage. ABS design optimizations avoid this problem by checking minimum blade surface pressure for every design and passing the results back to HEEDS for providing an inequality constraint. Excessive cavitation is avoided by not allowing minimum blade pressure to get any less than that of an acceptable baseline design.
DEMONSTRATION: SINGLE OBJECTIVE APPROACH The method is demonstrated for a twin-screw LNG carrier at a single speed and cargo load. The hull is left unchanged, and propeller parameterized for varying radial distributions of pitch and chord. Once the base design is solved, HEEDS’ SHERPA algorithm uses a combination of population-based and gradient-based optimization methods to explore the whole design space. Each design is tested at multiple shaft speeds, and the objective function (shaft horsepower) is chosen for the speed which delivers the prescribed thrust. Minimum blade surface pressure is found over one complete revolution at the thrust balance point, and the result returned to HEEDS to provide the cavitation inequality constraint.
The level of improvement possible is dependent on how a design is parameterized and on how many design evaluations are permitted. In the present example the radial distributions of pitch and chord are defined by just five parameters and SHERPA is allowed just
150 design evaluations. The baseline propeller was taken from a high-end designer who had already optimized the unit using existing analysis technology. Results are summarized in the HEEDS output shown in Figure 5. Even for this relatively restrictive example, ABS engineers found power reductions around 2.0%, which for larger ships corresponds to as much as $500,000 per year savings. But as Dr. Korpus points out, “The point is even more fundamental than the huge cost savings. For more than 100 years ship designers have built ships using the evolutionary approach – one small improvement per design generation. Within the last few years CFD has provided a groundbreaking technology to enable the revolutionary approach – true optimization for every design generation.”
THE CASE FOR MULTI-OBJECTIVE OPTIMIZATION The single-objective approach provides an effective philosophy to identify substantial fuel savings, but does not account for the above mentioned issue of reserve engine capacity for maneuvering in extreme weather. Ship engines spend most of their life operating at a power less than their Maximum Continuous Rating (MCR). But if the propeller and engine are optimized simultaneously, a power plant will be selected with just enough power to satisfy the design condition. Normal operations will require 100% MCR and nothing is left for bad weather. Conventional design wisdom applies a 15% “sea margin” to cover such contingencies, and one might be tempted to just add that margin after the optimization is complete. But in reality the required margin is a function of
the other design variables, so a multi-objective approach is required. Ideally, a designer should be provided with a range of designs (the so-called Pareto frontier) that prioritize the objectives of fuel saving and safe maneuvering independently.
Unfortunately, simulations of self-propelled ship maneuvering are still very time-consuming. Even a single maneuver at a single speed in a single wind and sea condition requires many days of computer run time. It is impractical (at this point in time) to incorporate heavy weather maneuvering into a multi-objective optimization. In lieu of this, it is crucial to have a precise understanding of the minimum power margin required in adverse conditions, and also for how that minimum is affected by the other optimized variables. To provide this knowledge the CFD group at ABS conducts maneuvering simulations in various sea conditions and power settings. Typical rudder motions are applied and STAR-CCM+’s DFBI capability is used to predict the ship’s trajectory. A given level of power is considered safe if the vessel can turn and accelerate under the prescribed rudder motion. The goal is to build a database of acceptable sea margins that can be applied until the multi-objective approach becomes more viable. A PRACTICAL ALTERNATIVE TO MULTI-OBJECTIVEDeveloping this database requires a huge number of simulations. A variety of different ship types and sizes need to be tested over a range of weather conditions. In each case a range of power settings have to be applied to identify the point at which a vessel can
FIGURE 4 - Tip vortex and blade back cavitation (left), and cavitation damage (right)
FEATURE ARTICLE CONFLICTING OBJECTIVES IN SHIP DESIGN
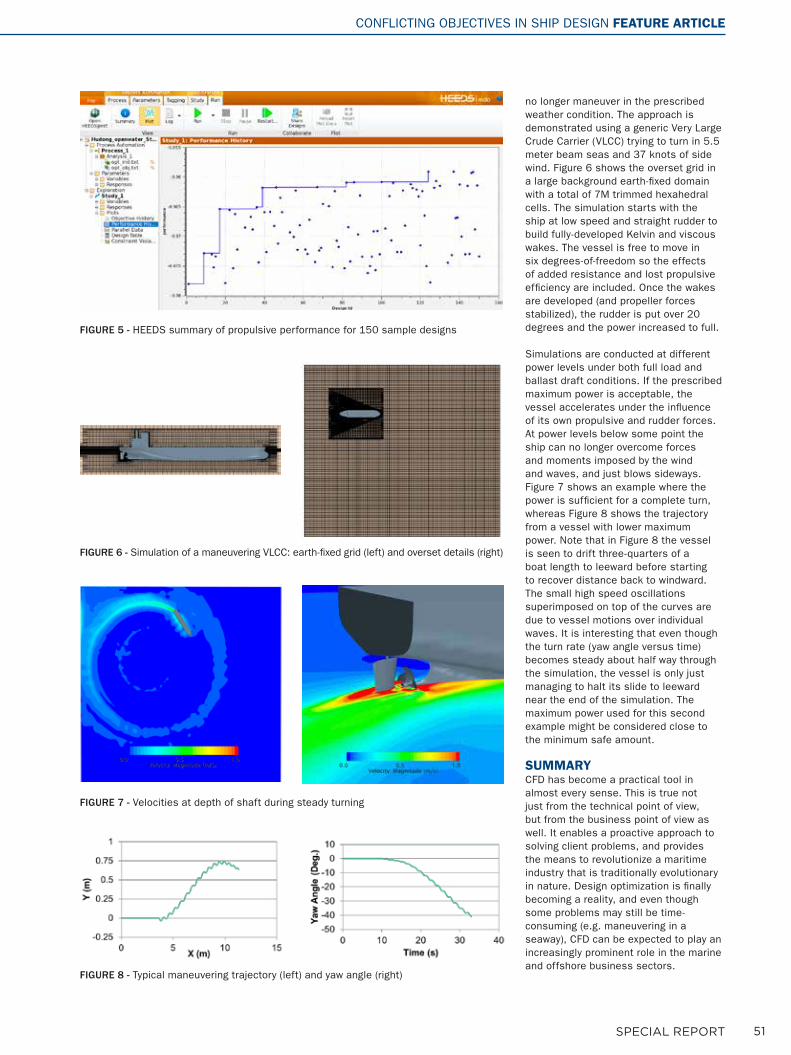
51SPECIAL REPORT
no longer maneuver in the prescribed weather condition. The approach is demonstrated using a generic Very Large Crude Carrier (VLCC) trying to turn in 5.5 meter beam seas and 37 knots of side wind. Figure 6 shows the overset grid in a large background earth-fixed domain with a total of 7M trimmed hexahedral cells. The simulation starts with the ship at low speed and straight rudder to build fully-developed Kelvin and viscous wakes. The vessel is free to move in six degrees-of-freedom so the effects of added resistance and lost propulsive efficiency are included. Once the wakes are developed (and propeller forces stabilized), the rudder is put over 20 degrees and the power increased to full.
Simulations are conducted at different power levels under both full load and ballast draft conditions. If the prescribed maximum power is acceptable, the vessel accelerates under the influence of its own propulsive and rudder forces. At power levels below some point the ship can no longer overcome forces and moments imposed by the wind and waves, and just blows sideways. Figure 7 shows an example where the power is sufficient for a complete turn, whereas Figure 8 shows the trajectory from a vessel with lower maximum power. Note that in Figure 8 the vessel is seen to drift three-quarters of a boat length to leeward before starting to recover distance back to windward. The small high speed oscillations superimposed on top of the curves are due to vessel motions over individual waves. It is interesting that even though the turn rate (yaw angle versus time) becomes steady about half way through the simulation, the vessel is only just managing to halt its slide to leeward near the end of the simulation. The maximum power used for this second example might be considered close to the minimum safe amount. SUMMARYCFD has become a practical tool in almost every sense. This is true not just from the technical point of view, but from the business point of view as well. It enables a proactive approach to solving client problems, and provides the means to revolutionize a maritime industry that is traditionally evolutionary in nature. Design optimization is finally becoming a reality, and even though some problems may still be time-consuming (e.g. maneuvering in a seaway), CFD can be expected to play an increasingly prominent role in the marine and offshore business sectors.
FIGURE 5 - HEEDS summary of propulsive performance for 150 sample designs
FIGURE 6 - Simulation of a maneuvering VLCC: earth-fixed grid (left) and overset details (right)
FIGURE 7 - Velocities at depth of shaft during steady turning
FIGURE 8 - Typical maneuvering trajectory (left) and yaw angle (right)
CONFLICTING OBJECTIVES IN SHIP DESIGN FEATURE ARTICLE

52 SPECIAL REPORT
TIME = MONEY
As you may have noticed, these days, I’m all about showcasing how to use our automated workflow to get your simulation work done faster. Yes, I can admit it now: I used to be a micromanager. You know… that guy who insists on telling you what to do, when to do it and exactly how to do it. These days, I no longer feel I need to actively participate in every step of the meshing and simulation process. Instead, I am preaching workflow automation to reduce the learning curve and embed best practices. And I’m preaching it to Dr. Design (that guy who doesn’t like change)! The other day, he came running into my corner office: “I need to quickly compute EHP (Effective Horse Power) for a new hull design and compare results to towing tank experiments.” I didn’t feel the urge to guide him through a detailed setup and meshing process. I simply pointed him towards the finish line: “Use EHP to compute EHP!” Estimating Hull Performance (EHP) is one of our Virtual Product Development (VPD) add-ons specifically developed to provide naval architects with a streamlined GUI-driven process to simulate hull motion in calm water. Like all tools in the VPD series, EHP enables the user to simply start with talking about the design, the physics and the test conditions and then let the add-on do the CFD technical conversion, automatically and consistently. Let me explain to you how easy it is to import your hull design and get started with estimating its performance with STAR-CCM+®.
STEP 1: IMPORT YOUR HULL!Currently, EHP is delivered via a .nbm file, installed in STAR-CCM+ via the Plug-in Manager. In future releases, this step will no longer be required. Once installed, EHP will accept many different types of geometry, both CAD-based and tessellated, and it will accept fully enclosed hulls (with or without superstructure) or open half hulls. Set the “Import Units” to match your import file. If your geometry is in model scale, insert the model “Scale Factor”. Once your geometry is ready, click on “Import Geometry.” Your hull will be plotted for you in the default orientation. Click the radio button next to the image that matches your orientation and click “Re-Orient Geometry” and go forward.
STEP 2: POSITION YOUR HULL!EHP will plot a graph scene where the goal for the user is to align the aft of the hull perpendicular to the origin of the plotted coordinate system. The buttons in the interface allow the user to move the hull in increments of the center distance value. You can also use the “Top” and “Front” buttons to move the hull laterally and visualize sinkage.EHP will monitor for reasonable values of reference length and will warn you if these values are outside of normal ranges. The RefLength text box will be red when the values do not make sense and you should continue to position the aft perpendicular if this value is still red. Once the positioning is complete, click “Forward.”
DR. MESH TALKS EHP
FEATURE ARTICLE DR. MESH TALKS EHP
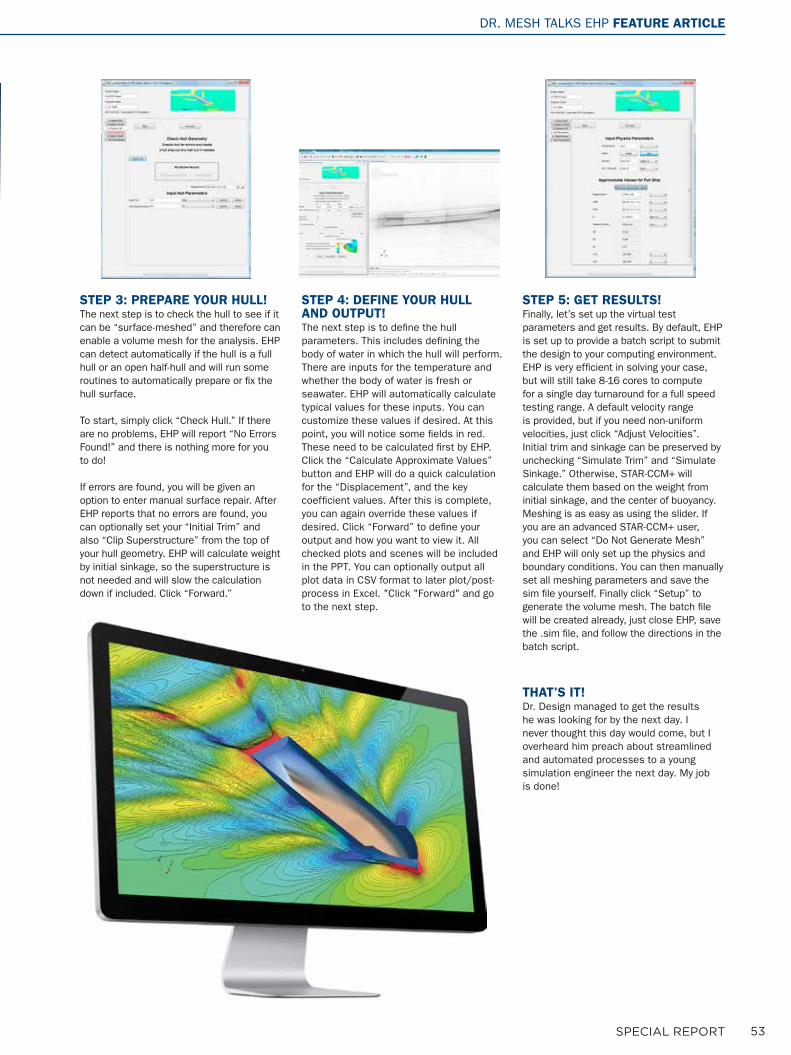
53SPECIAL REPORT
STEP 3: PREPARE YOUR HULL!The next step is to check the hull to see if it can be “surface-meshed” and therefore can enable a volume mesh for the analysis. EHP can detect automatically if the hull is a full hull or an open half-hull and will run some routines to automatically prepare or fix the hull surface.
To start, simply click “Check Hull.” If there are no problems, EHP will report “No Errors Found!” and there is nothing more for you to do!
If errors are found, you will be given an option to enter manual surface repair. After EHP reports that no errors are found, you can optionally set your “Initial Trim” and also “Clip Superstructure” from the top of your hull geometry. EHP will calculate weight by initial sinkage, so the superstructure is not needed and will slow the calculation down if included. Click “Forward.”
STEP 4: DEFINE YOUR HULL AND OUTPUT!The next step is to define the hull parameters. This includes defining the body of water in which the hull will perform. There are inputs for the temperature and whether the body of water is fresh or seawater. EHP will automatically calculate typical values for these inputs. You can customize these values if desired. At this point, you will notice some fields in red. These need to be calculated first by EHP. Click the “Calculate Approximate Values” button and EHP will do a quick calculation for the “Displacement”, and the key coefficient values. After this is complete, you can again override these values if desired. Click “Forward” to define your output and how you want to view it. All checked plots and scenes will be included in the PPT. You can optionally output all plot data in CSV format to later plot/post-process in Excel. "Click "Forward" and go to the next step.
STEP 5: GET RESULTS!Finally, let’s set up the virtual test parameters and get results. By default, EHP is set up to provide a batch script to submit the design to your computing environment. EHP is very efficient in solving your case, but will still take 8-16 cores to compute for a single day turnaround for a full speed testing range. A default velocity range is provided, but if you need non-uniform velocities, just click “Adjust Velocities”. Initial trim and sinkage can be preserved by unchecking “Simulate Trim” and “Simulate Sinkage.” Otherwise, STAR-CCM+ will calculate them based on the weight from initial sinkage, and the center of buoyancy. Meshing is as easy as using the slider. If you are an advanced STAR-CCM+ user, you can select “Do Not Generate Mesh” and EHP will only set up the physics and boundary conditions. You can then manually set all meshing parameters and save the sim file yourself. Finally click “Setup” to generate the volume mesh. The batch file will be created already, just close EHP, save the .sim file, and follow the directions in the batch script.
THAT’S IT!Dr. Design managed to get the results he was looking for by the next day. I never thought this day would come, but I overheard him preach about streamlined and automated processes to a young simulation engineer the next day. My job is done!
DR. MESH TALKS EHP FEATURE ARTICLE
TIME = MONEY
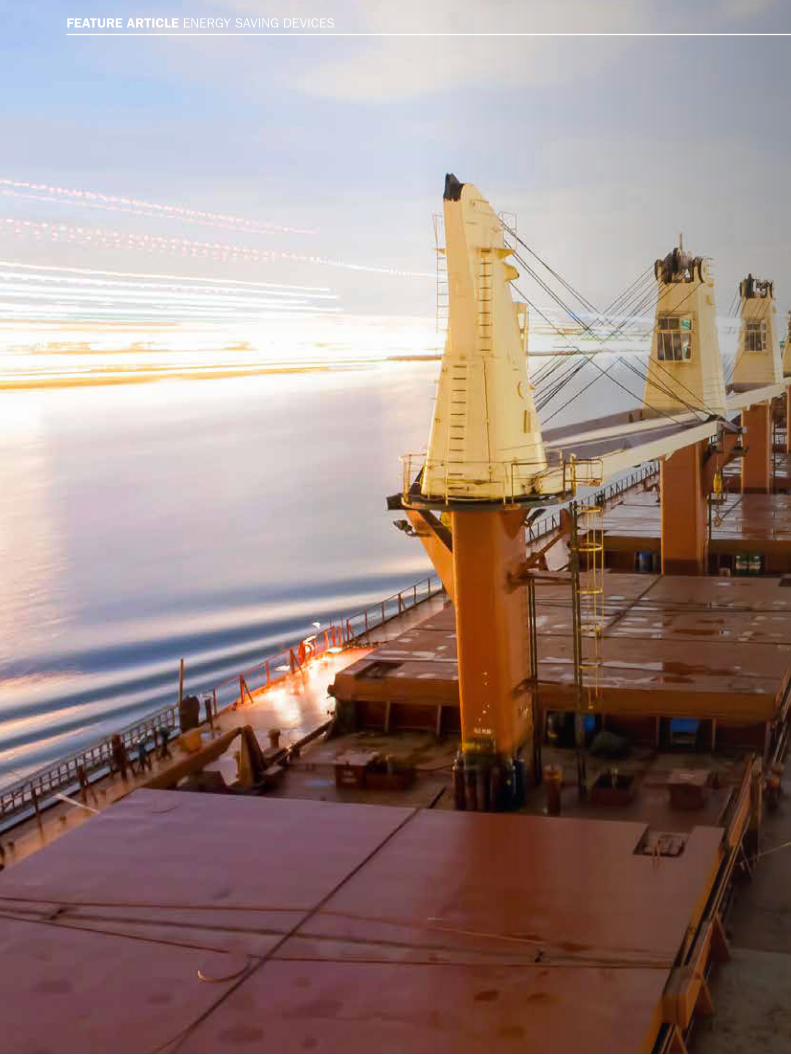
54 SPECIAL REPORT
FEATURE ARTICLE ENERGY SAVING DEVICES
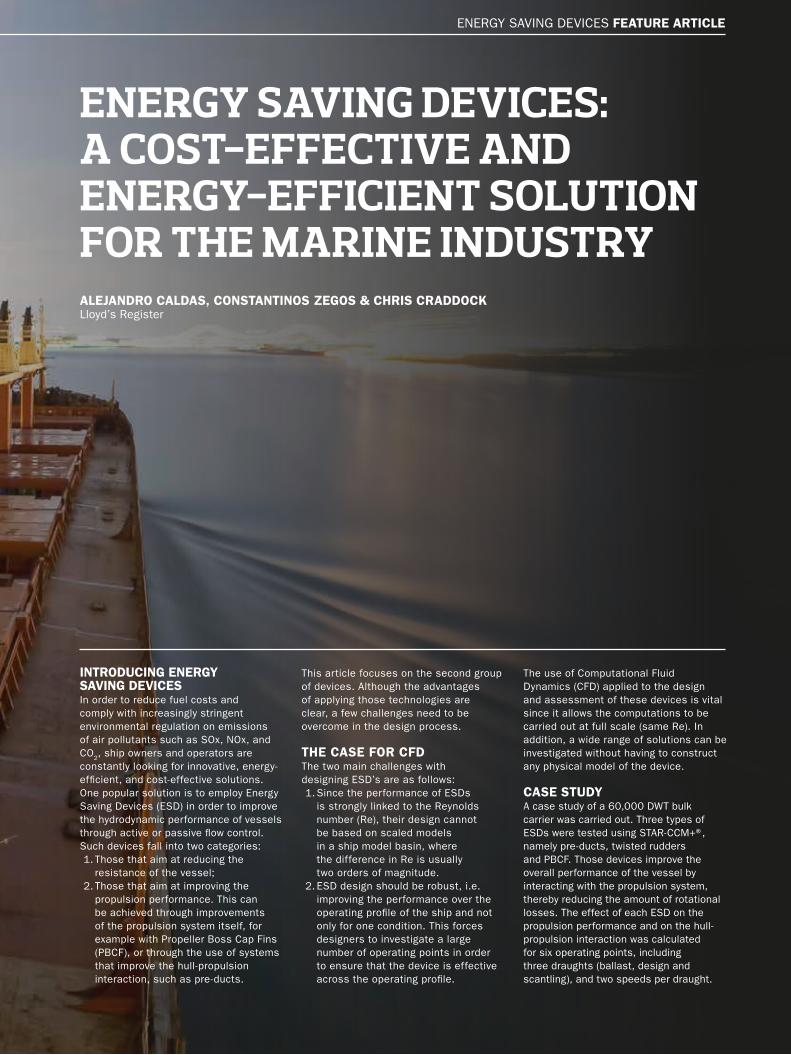
55SPECIAL REPORT
ALEJANDRO CALDAS, CONSTANTINOS ZEGOS & CHRIS CRADDOCKLloyd’s Register
INTRODUCING ENERGY SAVING DEVICESIn order to reduce fuel costs and comply with increasingly stringent environmental regulation on emissions of air pollutants such as SOx, NOx, and CO2, ship owners and operators are constantly looking for innovative, energy-efficient, and cost-effective solutions.One popular solution is to employ Energy Saving Devices (ESD) in order to improve the hydrodynamic performance of vessels through active or passive flow control. Such devices fall into two categories:1. Those that aim at reducing the
resistance of the vessel;2. Those that aim at improving the
propulsion performance. This can be achieved through improvements of the propulsion system itself, for example with Propeller Boss Cap Fins (PBCF), or through the use of systems that improve the hull-propulsion interaction, such as pre-ducts.
ENERGY SAVING DEVICES:A COST-EFFECTIVE ANDENERGY-EFFICIENT SOLUTION FOR THE MARINE INDUSTRY
This article focuses on the second group of devices. Although the advantages of applying those technologies are clear, a few challenges need to be overcome in the design process.
THE CASE FOR CFDThe two main challenges with designing ESD’s are as follows:1. Since the performance of ESDs
is strongly linked to the Reynolds number (Re), their design cannot be based on scaled models in a ship model basin, where the difference in Re is usually two orders of magnitude.
2. ESD design should be robust, i.e. improving the performance over the operating profile of the ship and not only for one condition. This forces designers to investigate a large number of operating points in order to ensure that the device is effective across the operating profile.
The use of Computational Fluid Dynamics (CFD) applied to the design and assessment of these devices is vital since it allows the computations to be carried out at full scale (same Re). In addition, a wide range of solutions can be investigated without having to construct any physical model of the device.
CASE STUDYA case study of a 60,000 DWT bulk carrier was carried out. Three types of ESDs were tested using STAR-CCM+®, namely pre-ducts, twisted rudders and PBCF. Those devices improve the overall performance of the vessel by interacting with the propulsion system, thereby reducing the amount of rotational losses. The effect of each ESD on the propulsion performance and on the hull-propulsion interaction was calculated for six operating points, including three draughts (ballast, design and scantling), and two speeds per draught.
ENERGY SAVING DEVICES FEATURE ARTICLE
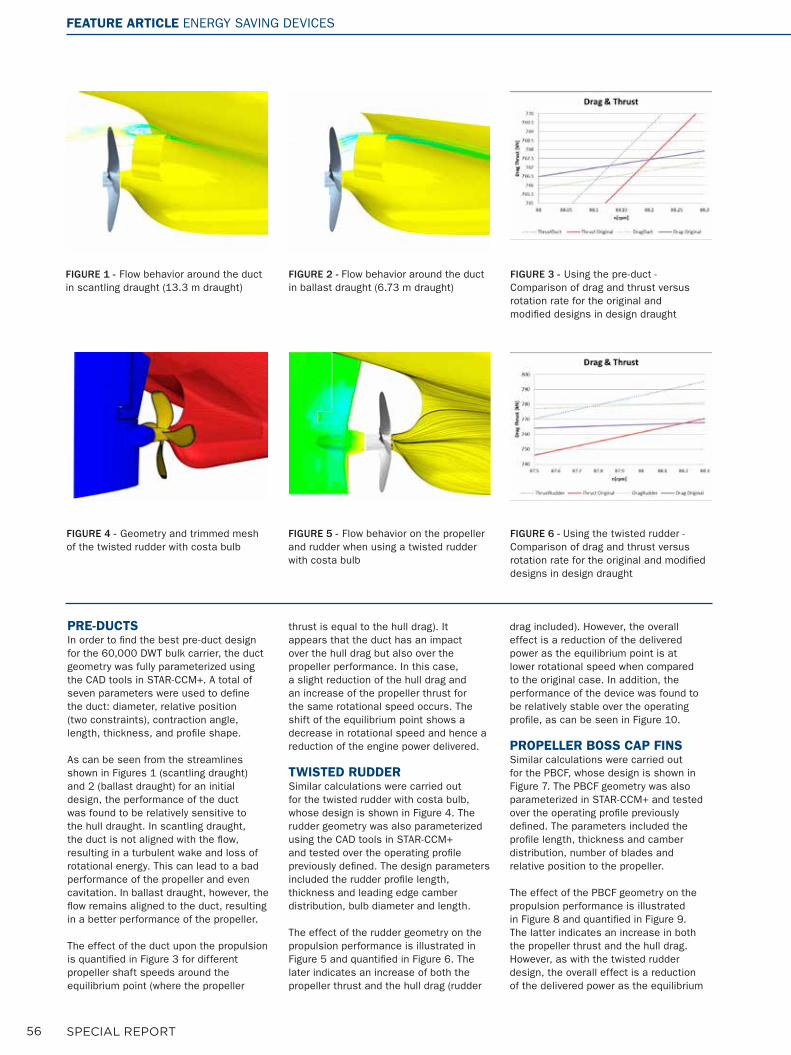
56 SPECIAL REPORT
PRE-DUCTSIn order to find the best pre-duct design for the 60,000 DWT bulk carrier, the duct geometry was fully parameterized using the CAD tools in STAR-CCM+. A total of seven parameters were used to define the duct: diameter, relative position (two constraints), contraction angle, length, thickness, and profile shape.
As can be seen from the streamlines shown in Figures 1 (scantling draught) and 2 (ballast draught) for an initial design, the performance of the duct was found to be relatively sensitive to the hull draught. In scantling draught, the duct is not aligned with the flow, resulting in a turbulent wake and loss of rotational energy. This can lead to a bad performance of the propeller and even cavitation. In ballast draught, however, the flow remains aligned to the duct, resulting in a better performance of the propeller.
The effect of the duct upon the propulsion is quantified in Figure 3 for different propeller shaft speeds around the equilibrium point (where the propeller
thrust is equal to the hull drag). It appears that the duct has an impact over the hull drag but also over the propeller performance. In this case, a slight reduction of the hull drag and an increase of the propeller thrust for the same rotational speed occurs. The shift of the equilibrium point shows a decrease in rotational speed and hence a reduction of the engine power delivered.
TWISTED RUDDERSimilar calculations were carried out for the twisted rudder with costa bulb, whose design is shown in Figure 4. The rudder geometry was also parameterized using the CAD tools in STAR-CCM+ and tested over the operating profile previously defined. The design parameters included the rudder profile length, thickness and leading edge camber distribution, bulb diameter and length.
The effect of the rudder geometry on the propulsion performance is illustrated in Figure 5 and quantified in Figure 6. The later indicates an increase of both the propeller thrust and the hull drag (rudder
drag included). However, the overall effect is a reduction of the delivered power as the equilibrium point is at lower rotational speed when compared to the original case. In addition, the performance of the device was found to be relatively stable over the operating profile, as can be seen in Figure 10.
PROPELLER BOSS CAP FINSSimilar calculations were carried out for the PBCF, whose design is shown in Figure 7. The PBCF geometry was also parameterized in STAR-CCM+ and tested over the operating profile previously defined. The parameters included the profile length, thickness and camber distribution, number of blades and relative position to the propeller.
The effect of the PBCF geometry on the propulsion performance is illustrated in Figure 8 and quantified in Figure 9. The latter indicates an increase in both the propeller thrust and the hull drag. However, as with the twisted rudder design, the overall effect is a reduction of the delivered power as the equilibrium
FIGURE 3 - Using the pre-duct - Comparison of drag and thrust versus rotation rate for the original and modified designs in design draught
FIGURE 4 - Geometry and trimmed mesh of the twisted rudder with costa bulb
FIGURE 5 - Flow behavior on the propeller and rudder when using a twisted rudder with costa bulb
FIGURE 6 - Using the twisted rudder - Comparison of drag and thrust versus rotation rate for the original and modified designs in design draught
FIGURE 1 - Flow behavior around the duct in scantling draught (13.3 m draught)
FIGURE 2 - Flow behavior around the duct in ballast draught (6.73 m draught)
FEATURE ARTICLE ENERGY SAVING DEVICES
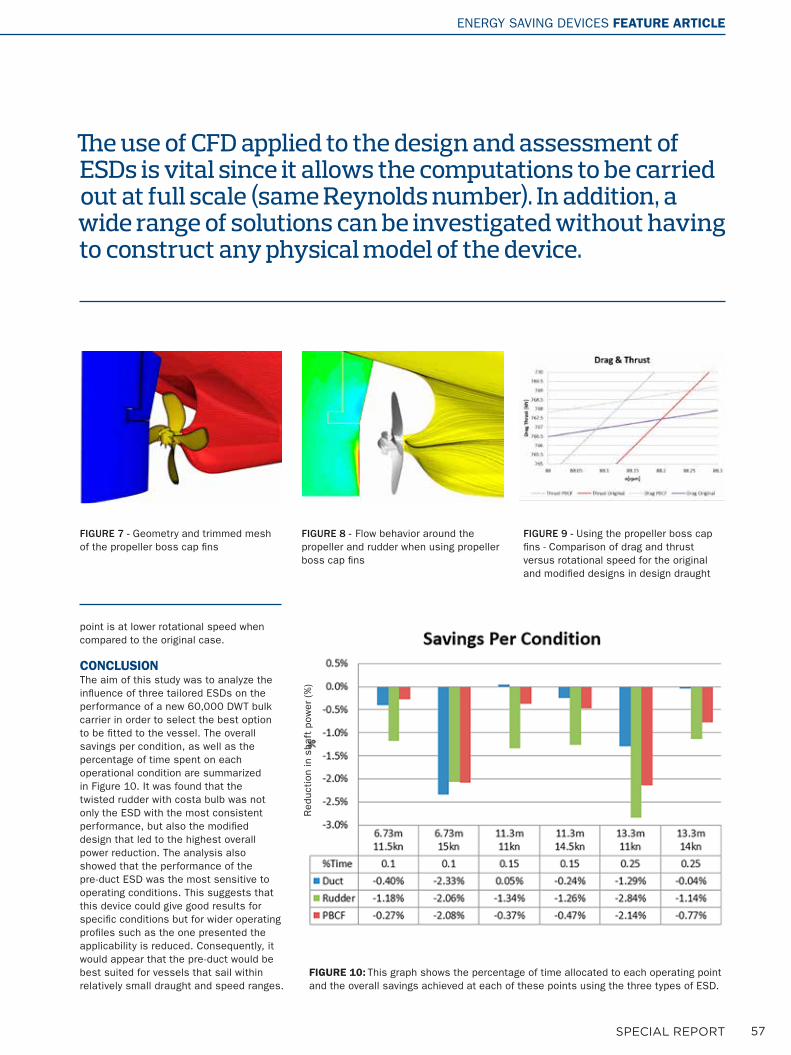
57SPECIAL REPORT
FIGURE 7 - Geometry and trimmed mesh of the propeller boss cap fins
FIGURE 8 - Flow behavior around the propeller and rudder when using propeller boss cap fins
FIGURE 9 - Using the propeller boss cap fins - Comparison of drag and thrust versus rotational speed for the original and modified designs in design draught
FIGURE 10: This graph shows the percentage of time allocated to each operating point and the overall savings achieved at each of these points using the three types of ESD.
point is at lower rotational speed when compared to the original case.
CONCLUSIONThe aim of this study was to analyze the influence of three tailored ESDs on the performance of a new 60,000 DWT bulk carrier in order to select the best option to be fitted to the vessel. The overall savings per condition, as well as the percentage of time spent on each operational condition are summarized in Figure 10. It was found that the twisted rudder with costa bulb was not only the ESD with the most consistent performance, but also the modified design that led to the highest overall power reduction. The analysis also showed that the performance of the pre-duct ESD was the most sensitive to operating conditions. This suggests that this device could give good results for specific conditions but for wider operating profiles such as the one presented the applicability is reduced. Consequently, it would appear that the pre-duct would be best suited for vessels that sail within relatively small draught and speed ranges.
The use of CFD applied to the design and assessment of ESDs is vital since it allows the computations to be carried out at full scale (same Reynolds number). In addition, a wide range of solutions can be investigated without having to construct any physical model of the device.
ENERGY SAVING DEVICES FEATURE ARTICLE
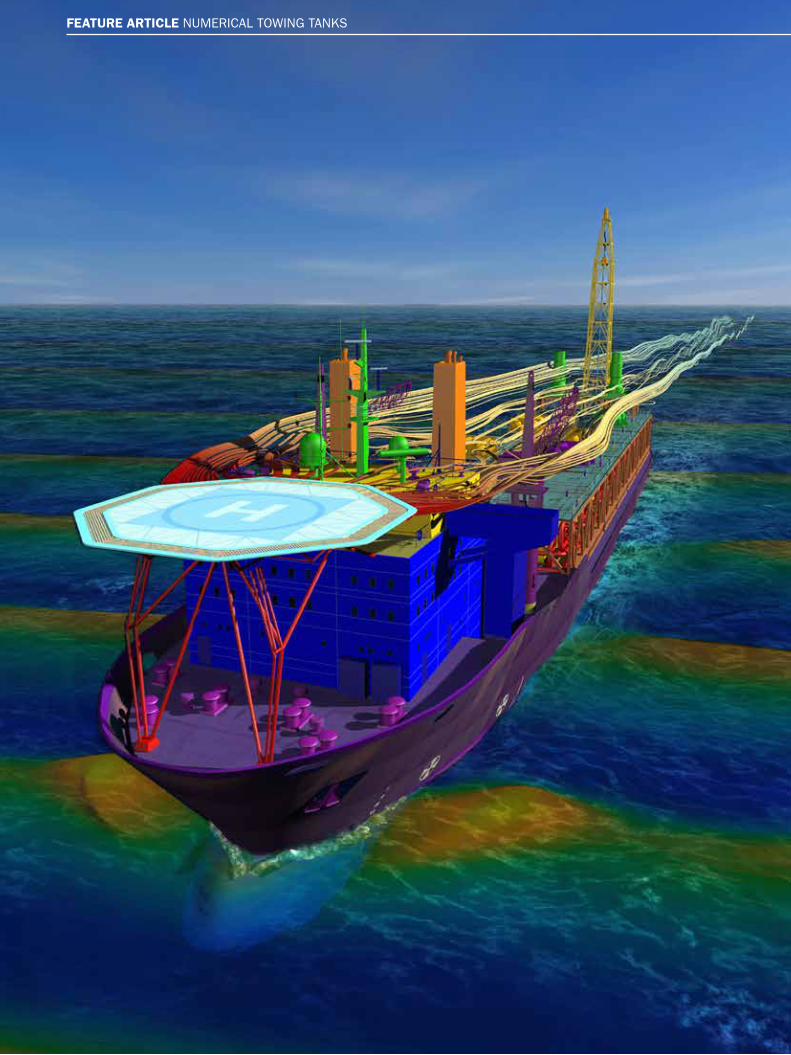
58 SPECIAL REPORT
FEATURE ARTICLE NUMERICAL TOWING TANKS
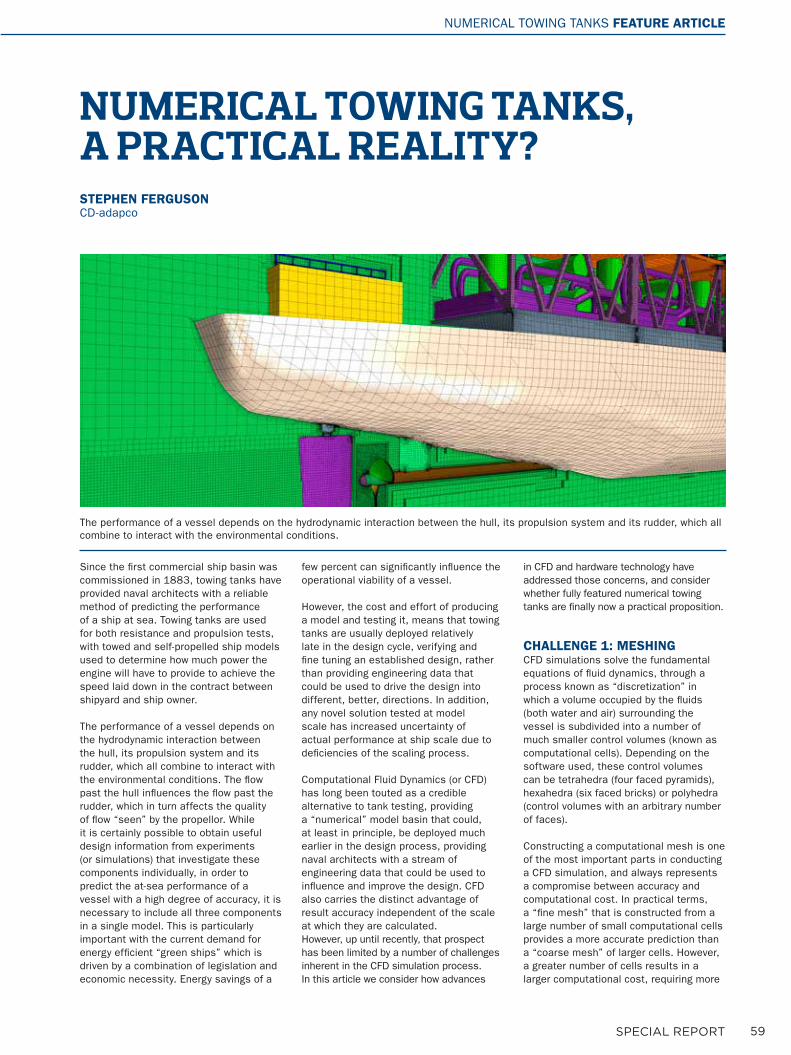
59SPECIAL REPORT
Since the first commercial ship basin was commissioned in 1883, towing tanks have provided naval architects with a reliable method of predicting the performance of a ship at sea. Towing tanks are used for both resistance and propulsion tests, with towed and self-propelled ship models used to determine how much power the engine will have to provide to achieve the speed laid down in the contract between shipyard and ship owner.
The performance of a vessel depends on the hydrodynamic interaction between the hull, its propulsion system and its rudder, which all combine to interact with the environmental conditions. The flow past the hull influences the flow past the rudder, which in turn affects the quality of flow “seen” by the propellor. While it is certainly possible to obtain useful design information from experiments (or simulations) that investigate these components individually, in order to predict the at-sea performance of a vessel with a high degree of accuracy, it is necessary to include all three components in a single model. This is particularly important with the current demand for energy efficient “green ships” which is driven by a combination of legislation and economic necessity. Energy savings of a
few percent can significantly influence the operational viability of a vessel.
However, the cost and effort of producing a model and testing it, means that towing tanks are usually deployed relatively late in the design cycle, verifying and fine tuning an established design, rather than providing engineering data that could be used to drive the design into different, better, directions. In addition, any novel solution tested at model scale has increased uncertainty of actual performance at ship scale due to deficiencies of the scaling process.
Computational Fluid Dynamics (or CFD) has long been touted as a credible alternative to tank testing, providing a “numerical” model basin that could, at least in principle, be deployed much earlier in the design process, providing naval architects with a stream of engineering data that could be used to influence and improve the design. CFD also carries the distinct advantage of result accuracy independent of the scale at which they are calculated.However, up until recently, that prospect has been limited by a number of challenges inherent in the CFD simulation process. In this article we consider how advances
in CFD and hardware technology have addressed those concerns, and consider whether fully featured numerical towing tanks are finally now a practical proposition.
CHALLENGE 1: MESHINGCFD simulations solve the fundamental equations of fluid dynamics, through a process known as “discretization” in which a volume occupied by the fluids (both water and air) surrounding the vessel is subdivided into a number of much smaller control volumes (known as computational cells). Depending on the software used, these control volumes can be tetrahedra (four faced pyramids), hexahedra (six faced bricks) or polyhedra (control volumes with an arbitrary number of faces).
Constructing a computational mesh is one of the most important parts in conducting a CFD simulation, and always represents a compromise between accuracy and computational cost. In practical terms, a “fine mesh” that is constructed from a large number of small computational cells provides a more accurate prediction than a “coarse mesh” of larger cells. However, a greater number of cells results in a larger computational cost, requiring more
STEPHEN FERGUSONCD-adapco
The performance of a vessel depends on the hydrodynamic interaction between the hull, its propulsion system and its rudder, which all combine to interact with the environmental conditions.
NUMERICAL TOWING TANKS, A PRACTICAL REALITY?
NUMERICAL TOWING TANKS FEATURE ARTICLE
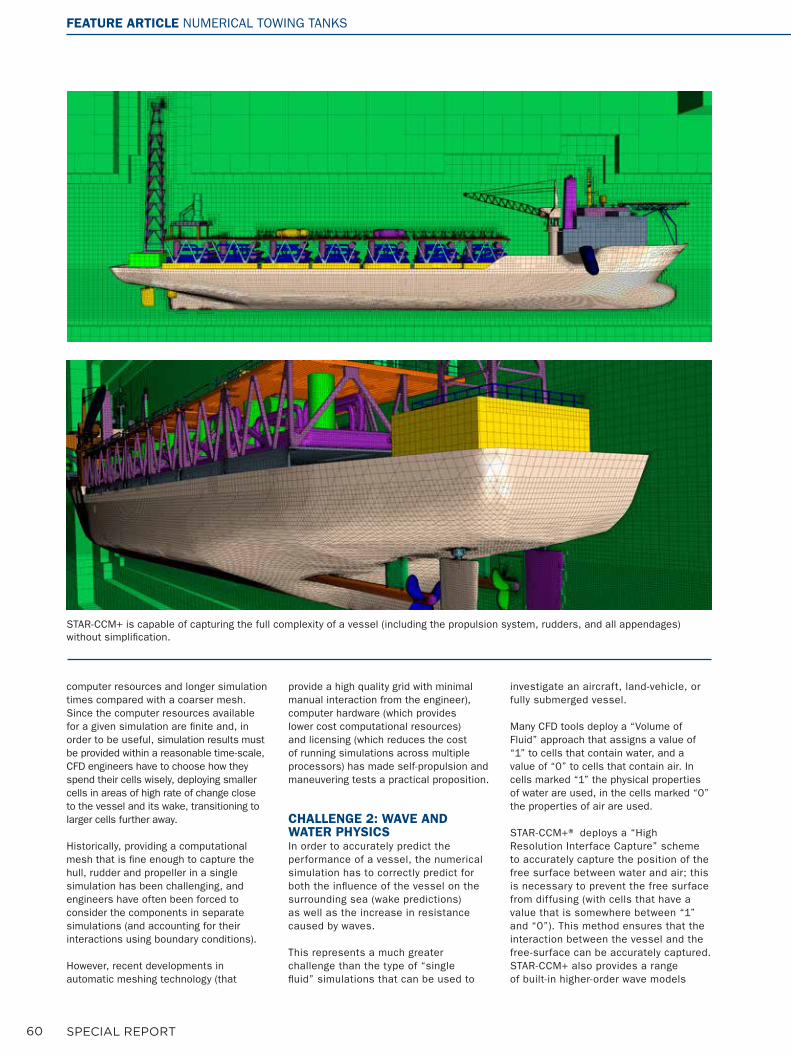
60 SPECIAL REPORT
computer resources and longer simulation times compared with a coarser mesh. Since the computer resources available for a given simulation are finite and, in order to be useful, simulation results must be provided within a reasonable time-scale, CFD engineers have to choose how they spend their cells wisely, deploying smaller cells in areas of high rate of change close to the vessel and its wake, transitioning to larger cells further away.
Historically, providing a computational mesh that is fine enough to capture the hull, rudder and propeller in a single simulation has been challenging, and engineers have often been forced to consider the components in separate simulations (and accounting for their interactions using boundary conditions).
However, recent developments in automatic meshing technology (that
provide a high quality grid with minimal manual interaction from the engineer), computer hardware (which provides lower cost computational resources) and licensing (which reduces the cost of running simulations across multiple processors) has made self-propulsion and maneuvering tests a practical proposition.
CHALLENGE 2: WAVE AND WATER PHYSICSIn order to accurately predict the performance of a vessel, the numerical simulation has to correctly predict for both the influence of the vessel on the surrounding sea (wake predictions) as well as the increase in resistance caused by waves.
This represents a much greater challenge than the type of “single fluid” simulations that can be used to
investigate an aircraft, land-vehicle, or fully submerged vessel.
Many CFD tools deploy a “Volume of Fluid” approach that assigns a value of “1” to cells that contain water, and a value of “0” to cells that contain air. In cells marked “1” the physical properties of water are used, in the cells marked “0” the properties of air are used.
STAR-CCM+® deploys a “High Resolution Interface Capture” scheme to accurately capture the position of the free surface between water and air; this is necessary to prevent the free surface from diffusing (with cells that have a value that is somewhere between “1” and “0”). This method ensures that the interaction between the vessel and the free-surface can be accurately captured. STAR-CCM+ also provides a range of built-in higher-order wave models
STAR-CCM+ is capable of capturing the full complexity of a vessel (including the propulsion system, rudders, and all appendages) without simplification.
FEATURE ARTICLE NUMERICAL TOWING TANKS
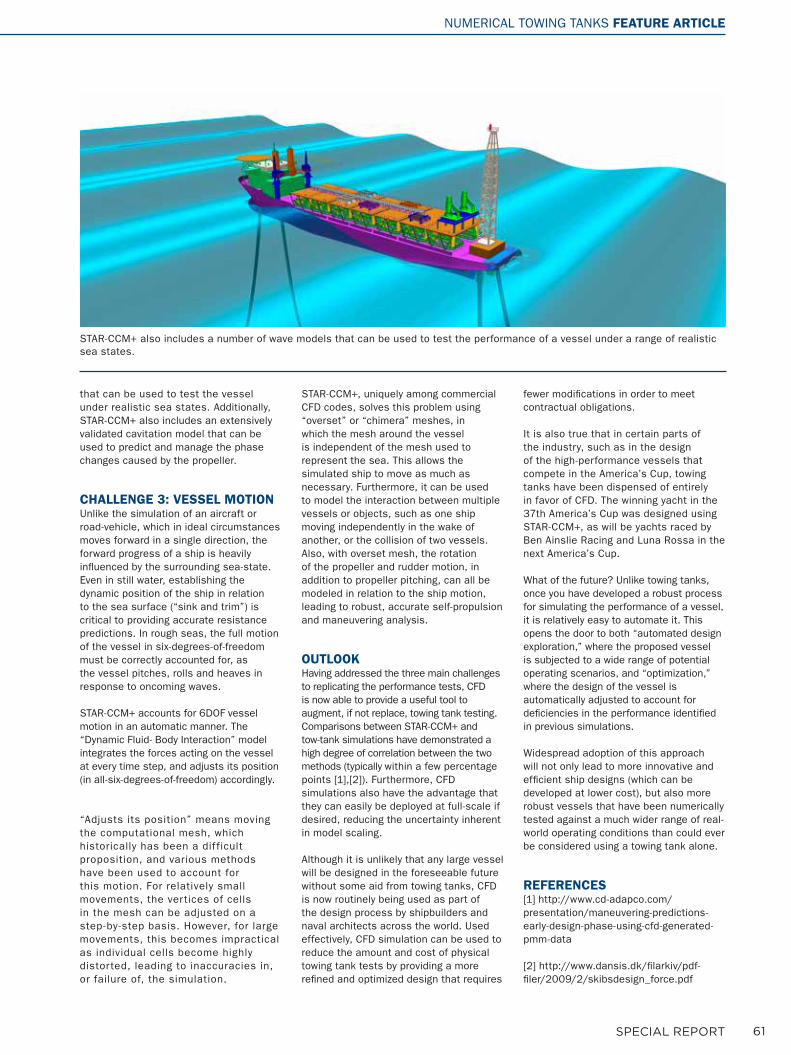
61SPECIAL REPORT
that can be used to test the vessel under realistic sea states. Additionally, STAR-CCM+ also includes an extensively validated cavitation model that can be used to predict and manage the phase changes caused by the propeller.
CHALLENGE 3: VESSEL MOTIONUnlike the simulation of an aircraft or road-vehicle, which in ideal circumstances moves forward in a single direction, the forward progress of a ship is heavily influenced by the surrounding sea-state. Even in still water, establishing the dynamic position of the ship in relation to the sea surface (“sink and trim”) is critical to providing accurate resistance predictions. In rough seas, the full motion of the vessel in six-degrees-of-freedom must be correctly accounted for, as the vessel pitches, rolls and heaves in response to oncoming waves.
STAR-CCM+ accounts for 6DOF vessel motion in an automatic manner. The “Dynamic Fluid- Body Interaction” model integrates the forces acting on the vessel at every time step, and adjusts its position (in all-six-degrees-of-freedom) accordingly.
“Adjusts its position” means moving the computational mesh, which historically has been a dif ficult proposition, and various methods have been used to account for this motion. For relatively small movements, the vertices of cells in the mesh can be adjusted on a step -by-step basis. However, for large movements, this becomes impractical as individual cells become highly distorted, leading to inaccuracies in, or failure of, the simulation.
STAR-CCM+, uniquely among commercial CFD codes, solves this problem using “overset” or “chimera” meshes, in which the mesh around the vessel is independent of the mesh used to represent the sea. This allows the simulated ship to move as much as necessary. Furthermore, it can be used to model the interaction between multiple vessels or objects, such as one ship moving independently in the wake of another, or the collision of two vessels. Also, with overset mesh, the rotation of the propeller and rudder motion, in addition to propeller pitching, can all be modeled in relation to the ship motion, leading to robust, accurate self-propulsion and maneuvering analysis.
OUTLOOKHaving addressed the three main challenges to replicating the performance tests, CFD is now able to provide a useful tool to augment, if not replace, towing tank testing. Comparisons between STAR-CCM+ and tow-tank simulations have demonstrated a high degree of correlation between the two methods (typically within a few percentage points [1],[2]). Furthermore, CFD simulations also have the advantage that they can easily be deployed at full-scale if desired, reducing the uncertainty inherent in model scaling.
Although it is unlikely that any large vessel will be designed in the foreseeable future without some aid from towing tanks, CFD is now routinely being used as part of the design process by shipbuilders and naval architects across the world. Used effectively, CFD simulation can be used to reduce the amount and cost of physical towing tank tests by providing a more refined and optimized design that requires
fewer modifications in order to meet contractual obligations.
It is also true that in certain parts of the industry, such as in the design of the high-performance vessels that compete in the America’s Cup, towing tanks have been dispensed of entirely in favor of CFD. The winning yacht in the 37th America’s Cup was designed using STAR-CCM+, as will be yachts raced by Ben Ainslie Racing and Luna Rossa in the next America’s Cup.
What of the future? Unlike towing tanks, once you have developed a robust process for simulating the performance of a vessel, it is relatively easy to automate it. This opens the door to both “automated design exploration,” where the proposed vessel is subjected to a wide range of potential operating scenarios, and “optimization,” where the design of the vessel is automatically adjusted to account for deficiencies in the performance identified in previous simulations.
Widespread adoption of this approach will not only lead to more innovative and efficient ship designs (which can be developed at lower cost), but also more robust vessels that have been numerically tested against a much wider range of real-world operating conditions than could ever be considered using a towing tank alone.
REFERENCES[1] http://www.cd-adapco.com/presentation/maneuvering-predictions-early-design-phase-using-cfd-generated-pmm-data
[2] http://www.dansis.dk/filarkiv/pdf-filer/2009/2/skibsdesign_force.pdf
STAR-CCM+ also includes a number of wave models that can be used to test the performance of a vessel under a range of realistic sea states.
NUMERICAL TOWING TANKS FEATURE ARTICLE
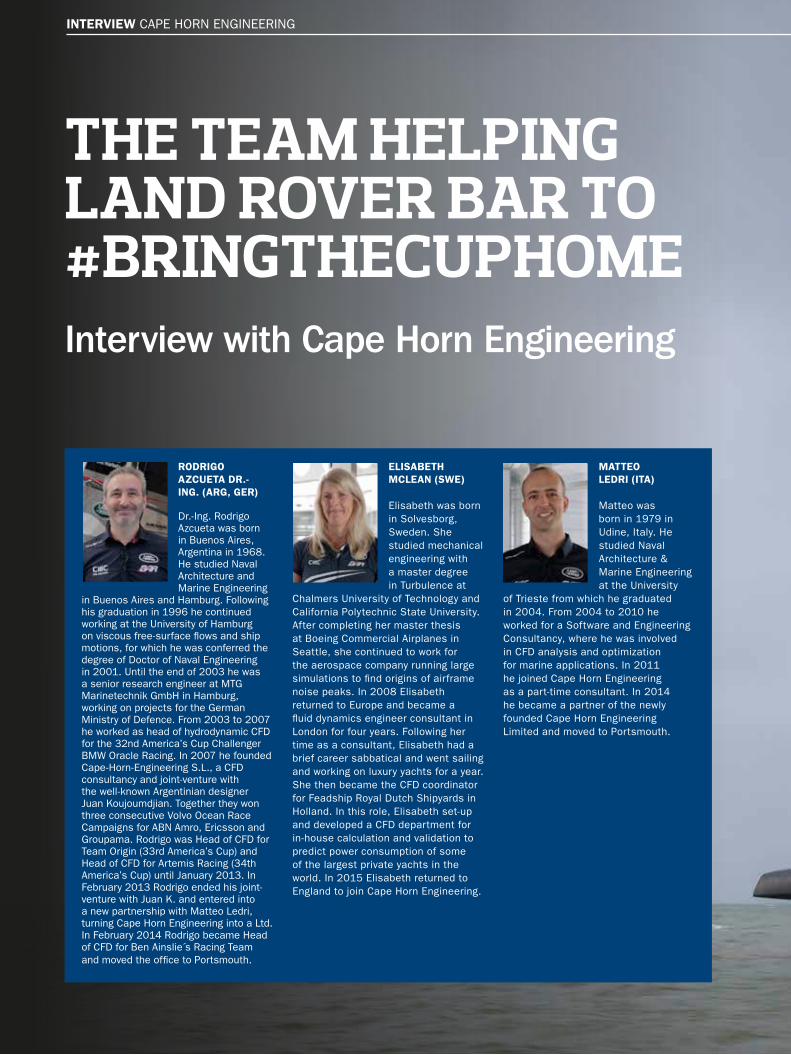
62 SPECIAL REPORT
INTERVIEW CAPE HORN ENGINEERING
THE TEAM HELPING LAND ROVER BAR TO #BRINGTHECUPHOMEInterview with Cape Horn Engineering
RODRIGO AZCUETA DR.-ING. (ARG, GER)
Dr.-Ing. Rodrigo Azcueta was born in Buenos Aires, Argentina in 1968. He studied Naval Architecture and Marine Engineering
in Buenos Aires and Hamburg. Following his graduation in 1996 he continued working at the University of Hamburg on viscous free-surface flows and ship motions, for which he was conferred the degree of Doctor of Naval Engineering in 2001. Until the end of 2003 he was a senior research engineer at MTG Marinetechnik GmbH in Hamburg, working on projects for the German Ministry of Defence. From 2003 to 2007 he worked as head of hydrodynamic CFD for the 32nd America’s Cup Challenger BMW Oracle Racing. In 2007 he founded Cape-Horn-Engineering S.L., a CFD consultancy and joint-venture with the well-known Argentinian designer Juan Koujoumdjian. Together they won three consecutive Volvo Ocean Race Campaigns for ABN Amro, Ericsson and Groupama. Rodrigo was Head of CFD for Team Origin (33rd America’s Cup) and Head of CFD for Artemis Racing (34th America’s Cup) until January 2013. In February 2013 Rodrigo ended his joint-venture with Juan K. and entered into a new partnership with Matteo Ledri, turning Cape Horn Engineering into a Ltd. In February 2014 Rodrigo became Head of CFD for Ben Ainslie s Racing Team and moved the office to Portsmouth.
ELISABETH MCLEAN (SWE)
Elisabeth was born in Solvesborg, Sweden. She studied mechanical engineering with a master degree in Turbulence at
Chalmers University of Technology and California Polytechnic State University. After completing her master thesis at Boeing Commercial Airplanes in Seattle, she continued to work for the aerospace company running large simulations to find origins of airframe noise peaks. In 2008 Elisabeth returned to Europe and became a fluid dynamics engineer consultant in London for four years. Following her time as a consultant, Elisabeth had a brief career sabbatical and went sailing and working on luxury yachts for a year. She then became the CFD coordinator for Feadship Royal Dutch Shipyards in Holland. In this role, Elisabeth set-up and developed a CFD department for in-house calculation and validation to predict power consumption of some of the largest private yachts in the world. In 2015 Elisabeth returned to England to join Cape Horn Engineering.
MATTEO LEDRI (ITA)
Matteo was born in 1979 in Udine, Italy. He studied Naval Architecture & Marine Engineering at the University
of Trieste from which he graduated in 2004. From 2004 to 2010 he worked for a Software and Engineering Consultancy, where he was involved in CFD analysis and optimization for marine applications. In 2011 he joined Cape Horn Engineering as a part-time consultant. In 2014 he became a partner of the newly founded Cape Horn Engineering Limited and moved to Portsmouth.
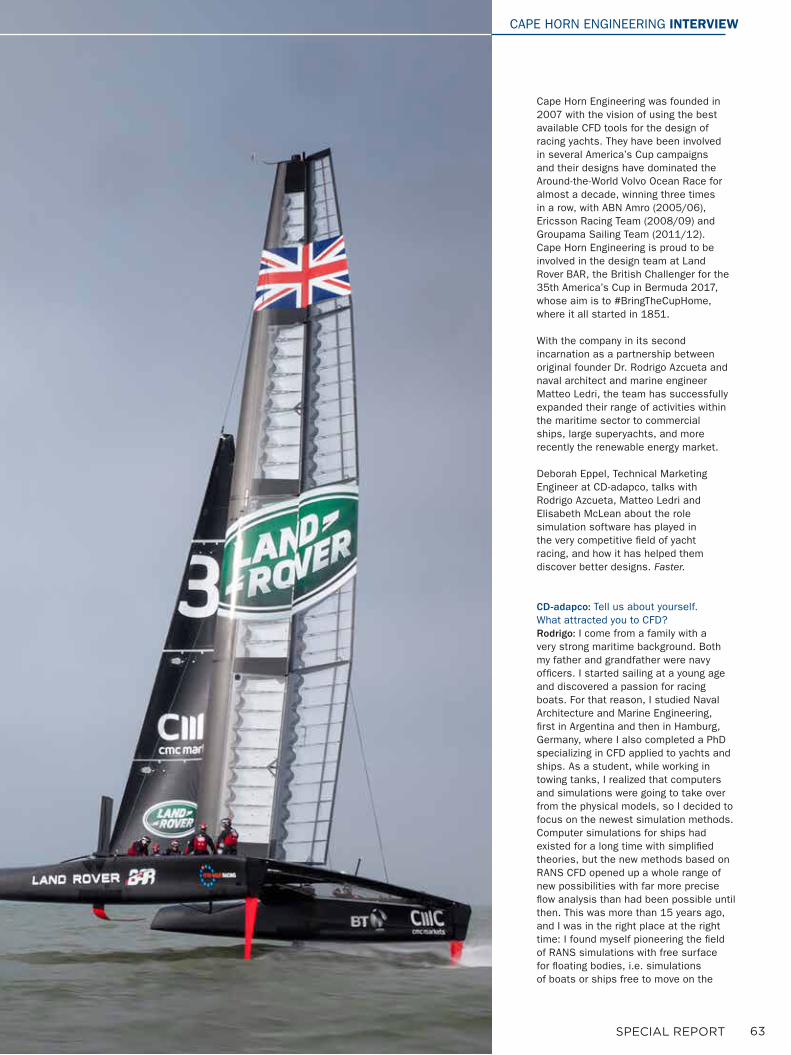
63SPECIAL REPORT
Cape Horn Engineering was founded in 2007 with the vision of using the best available CFD tools for the design of racing yachts. They have been involved in several America’s Cup campaigns and their designs have dominated the Around-the-World Volvo Ocean Race for almost a decade, winning three times in a row, with ABN Amro (2005/06), Ericsson Racing Team (2008/09) and Groupama Sailing Team (2011/12). Cape Horn Engineering is proud to be involved in the design team at Land Rover BAR, the British Challenger for the 35th America’s Cup in Bermuda 2017, whose aim is to #BringTheCupHome, where it all started in 1851.
With the company in its second incarnation as a partnership between original founder Dr. Rodrigo Azcueta and naval architect and marine engineer Matteo Ledri, the team has successfully expanded their range of activities within the maritime sector to commercial ships, large superyachts, and more recently the renewable energy market.
Deborah Eppel, Technical Marketing Engineer at CD-adapco, talks with Rodrigo Azcueta, Matteo Ledri and Elisabeth McLean about the role simulation software has played in the very competitive field of yacht racing, and how it has helped them discover better designs. Faster.
CD-adapco: Tell us about yourself. What attracted you to CFD?Rodrigo: I come from a family with a very strong maritime background. Both my father and grandfather were navy officers. I started sailing at a young age and discovered a passion for racing boats. For that reason, I studied Naval Architecture and Marine Engineering, first in Argentina and then in Hamburg, Germany, where I also completed a PhD specializing in CFD applied to yachts and ships. As a student, while working in towing tanks, I realized that computers and simulations were going to take over from the physical models, so I decided to focus on the newest simulation methods. Computer simulations for ships had existed for a long time with simplified theories, but the new methods based on RANS CFD opened up a whole range of new possibilities with far more precise flow analysis than had been possible until then. This was more than 15 years ago, and I was in the right place at the right time: I found myself pioneering the field of RANS simulations with free surface for floating bodies, i.e. simulations of boats or ships free to move on the
CAPE HORN ENGINEERING INTERVIEW
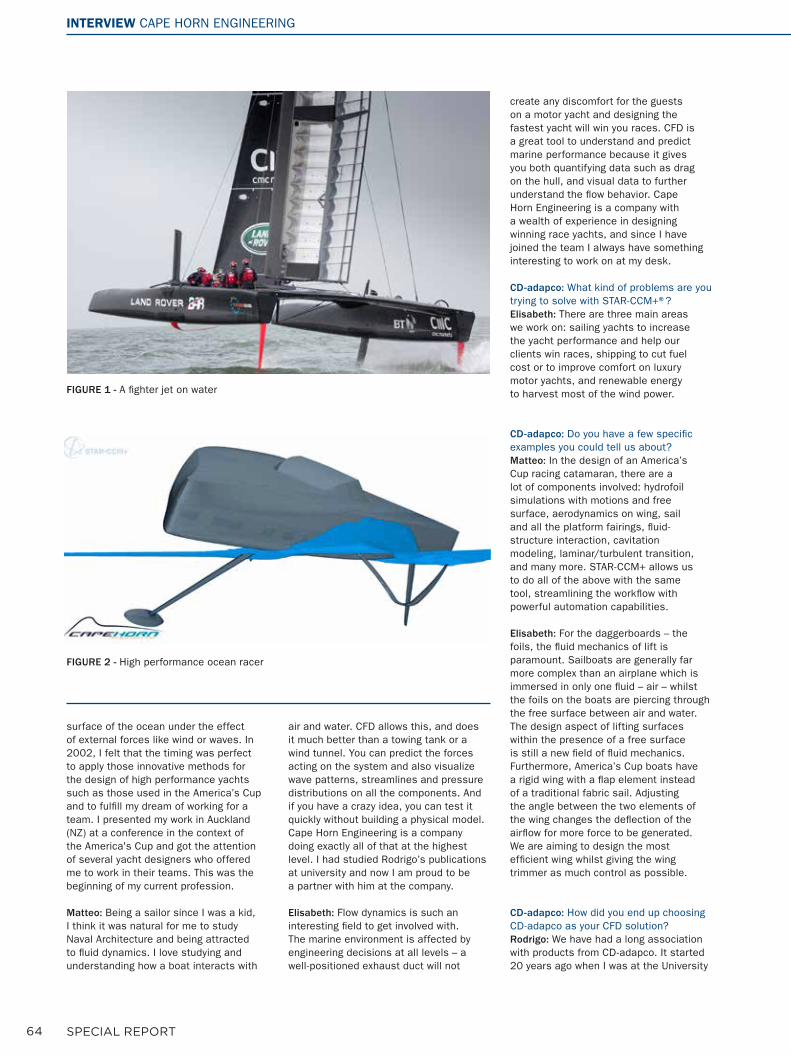
64 SPECIAL REPORT
surface of the ocean under the effect of external forces like wind or waves. In 2002, I felt that the timing was perfect to apply those innovative methods for the design of high performance yachts such as those used in the America’s Cup and to fulfill my dream of working for a team. I presented my work in Auckland (NZ) at a conference in the context of the America's Cup and got the attention of several yacht designers who offered me to work in their teams. This was the beginning of my current profession.
Matteo: Being a sailor since I was a kid, I think it was natural for me to study Naval Architecture and being attracted to fluid dynamics. I love studying and understanding how a boat interacts with
air and water. CFD allows this, and does it much better than a towing tank or a wind tunnel. You can predict the forces acting on the system and also visualize wave patterns, streamlines and pressure distributions on all the components. And if you have a crazy idea, you can test it quickly without building a physical model. Cape Horn Engineering is a company doing exactly all of that at the highest level. I had studied Rodrigo’s publications at university and now I am proud to be a partner with him at the company. Elisabeth: Flow dynamics is such an interesting field to get involved with. The marine environment is affected by engineering decisions at all levels – a well-positioned exhaust duct will not
create any discomfort for the guests on a motor yacht and designing the fastest yacht will win you races. CFD is a great tool to understand and predict marine performance because it gives you both quantifying data such as drag on the hull, and visual data to further understand the flow behavior. Cape Horn Engineering is a company with a wealth of experience in designing winning race yachts, and since I have joined the team I always have something interesting to work on at my desk.
CD-adapco: What kind of problems are you trying to solve with STAR-CCM+®?Elisabeth: There are three main areas we work on: sailing yachts to increase the yacht performance and help our clients win races, shipping to cut fuel cost or to improve comfort on luxury motor yachts, and renewable energy to harvest most of the wind power.
CD-adapco: Do you have a few specific examples you could tell us about?Matteo: In the design of an America’s Cup racing catamaran, there are a lot of components involved: hydrofoil simulations with motions and free surface, aerodynamics on wing, sail and all the platform fairings, fluid-structure interaction, cavitation modeling, laminar/turbulent transition, and many more. STAR-CCM+ allows us to do all of the above with the same tool, streamlining the workflow with powerful automation capabilities. Elisabeth: For the daggerboards – the foils, the fluid mechanics of lift is paramount. Sailboats are generally far more complex than an airplane which is immersed in only one fluid – air – whilst the foils on the boats are piercing through the free surface between air and water. The design aspect of lifting surfaces within the presence of a free surface is still a new field of fluid mechanics. Furthermore, America’s Cup boats have a rigid wing with a flap element instead of a traditional fabric sail. Adjusting the angle between the two elements of the wing changes the deflection of the airflow for more force to be generated. We are aiming to design the most efficient wing whilst giving the wing trimmer as much control as possible.
CD-adapco: How did you end up choosing CD-adapco as your CFD solution?Rodrigo: We have had a long association with products from CD-adapco. It started 20 years ago when I was at the University
FIGURE 1 - A fighter jet on water
FIGURE 2 - High performance ocean racer
INTERVIEW CAPE HORN ENGINEERING
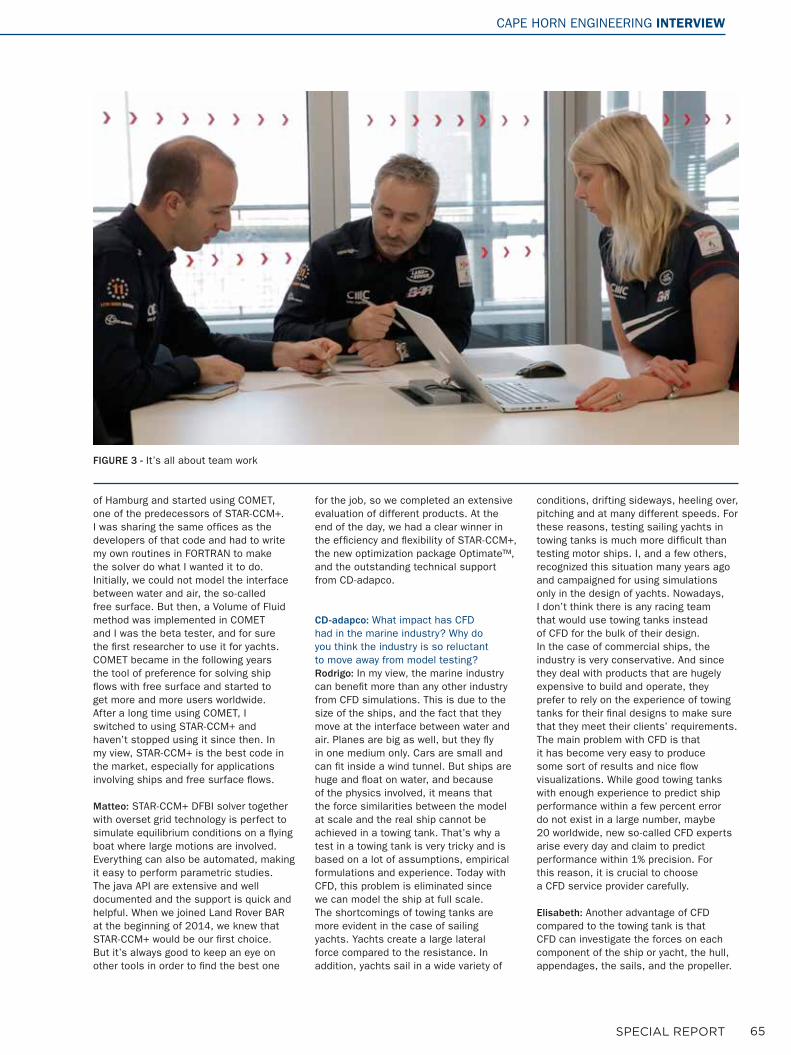
65SPECIAL REPORT
of Hamburg and started using COMET, one of the predecessors of STAR-CCM+. I was sharing the same offices as the developers of that code and had to write my own routines in FORTRAN to make the solver do what I wanted it to do. Initially, we could not model the interface between water and air, the so-called free surface. But then, a Volume of Fluid method was implemented in COMET and I was the beta tester, and for sure the first researcher to use it for yachts. COMET became in the following years the tool of preference for solving ship flows with free surface and started to get more and more users worldwide.After a long time using COMET, I switched to using STAR-CCM+ and haven’t stopped using it since then. In my view, STAR-CCM+ is the best code in the market, especially for applications involving ships and free surface flows. Matteo: STAR-CCM+ DFBI solver together with overset grid technology is perfect to simulate equilibrium conditions on a flying boat where large motions are involved. Everything can also be automated, making it easy to perform parametric studies. The java API are extensive and well documented and the support is quick and helpful. When we joined Land Rover BAR at the beginning of 2014, we knew that STAR-CCM+ would be our first choice. But it’s always good to keep an eye on other tools in order to find the best one
for the job, so we completed an extensive evaluation of different products. At the end of the day, we had a clear winner in the efficiency and flexibility of STAR-CCM+, the new optimization package Optimate™, and the outstanding technical support from CD-adapco.
CD-adapco: What impact has CFD had in the marine industry? Why do you think the industry is so reluctant to move away from model testing?Rodrigo: In my view, the marine industry can benefit more than any other industry from CFD simulations. This is due to the size of the ships, and the fact that they move at the interface between water and air. Planes are big as well, but they fly in one medium only. Cars are small and can fit inside a wind tunnel. But ships are huge and float on water, and because of the physics involved, it means that the force similarities between the model at scale and the real ship cannot be achieved in a towing tank. That’s why a test in a towing tank is very tricky and is based on a lot of assumptions, empirical formulations and experience. Today with CFD, this problem is eliminated since we can model the ship at full scale.The shortcomings of towing tanks are more evident in the case of sailing yachts. Yachts create a large lateral force compared to the resistance. In addition, yachts sail in a wide variety of
conditions, drifting sideways, heeling over, pitching and at many different speeds. For these reasons, testing sailing yachts in towing tanks is much more difficult than testing motor ships. I, and a few others, recognized this situation many years ago and campaigned for using simulations only in the design of yachts. Nowadays, I don’t think there is any racing team that would use towing tanks instead of CFD for the bulk of their design.In the case of commercial ships, the industry is very conservative. And since they deal with products that are hugely expensive to build and operate, they prefer to rely on the experience of towing tanks for their final designs to make sure that they meet their clients’ requirements. The main problem with CFD is that it has become very easy to produce some sort of results and nice flow visualizations. While good towing tanks with enough experience to predict ship performance within a few percent error do not exist in a large number, maybe 20 worldwide, new so-called CFD experts arise every day and claim to predict performance within 1% precision. For this reason, it is crucial to choose a CFD service provider carefully.
Elisabeth: Another advantage of CFD compared to the towing tank is that CFD can investigate the forces on each component of the ship or yacht, the hull, appendages, the sails, and the propeller.
FIGURE 3 - It’s all about team work
CAPE HORN ENGINEERING INTERVIEW
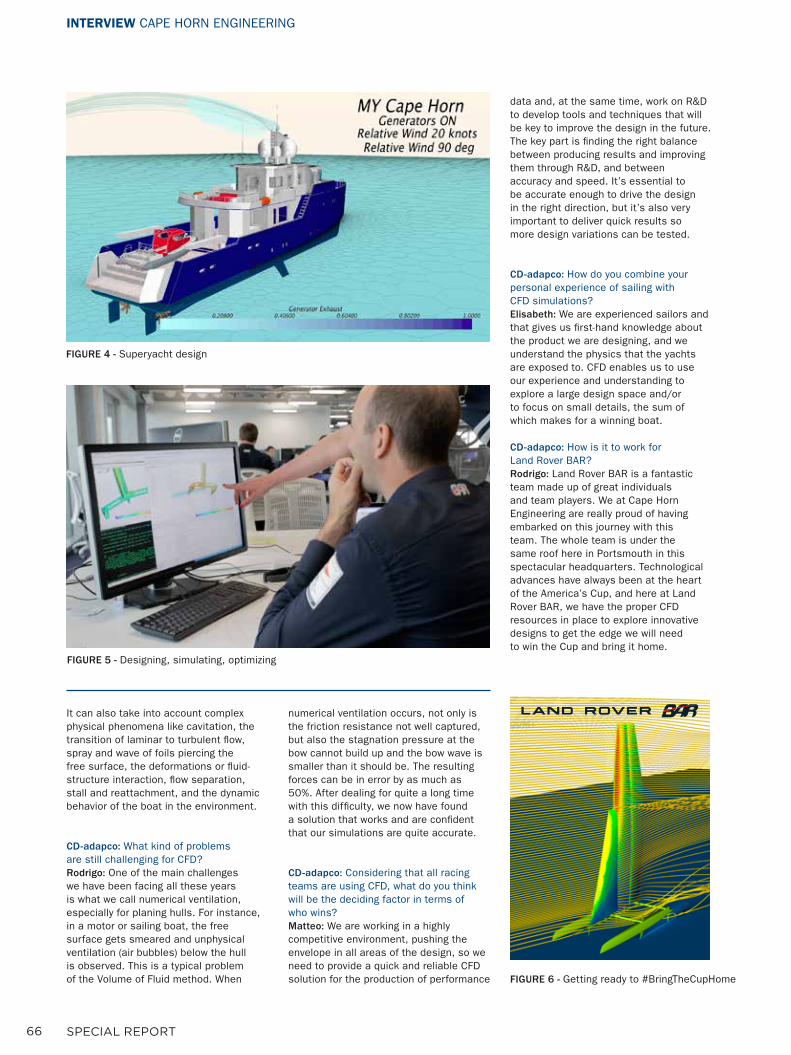
66 SPECIAL REPORT
It can also take into account complex physical phenomena like cavitation, the transition of laminar to turbulent flow, spray and wave of foils piercing the free surface, the deformations or fluid-structure interaction, flow separation, stall and reattachment, and the dynamic behavior of the boat in the environment.
CD-adapco: What kind of problems are still challenging for CFD?Rodrigo: One of the main challenges we have been facing all these years is what we call numerical ventilation, especially for planing hulls. For instance, in a motor or sailing boat, the free surface gets smeared and unphysical ventilation (air bubbles) below the hull is observed. This is a typical problem of the Volume of Fluid method. When
numerical ventilation occurs, not only is the friction resistance not well captured, but also the stagnation pressure at the bow cannot build up and the bow wave is smaller than it should be. The resulting forces can be in error by as much as 50%. After dealing for quite a long time with this difficulty, we now have found a solution that works and are confident that our simulations are quite accurate.
CD-adapco: Considering that all racing teams are using CFD, what do you think will be the deciding factor in terms of who wins?Matteo: We are working in a highly competitive environment, pushing the envelope in all areas of the design, so we need to provide a quick and reliable CFD solution for the production of performance
data and, at the same time, work on R&D to develop tools and techniques that will be key to improve the design in the future. The key part is finding the right balance between producing results and improving them through R&D, and between accuracy and speed. It’s essential to be accurate enough to drive the design in the right direction, but it’s also very important to deliver quick results so more design variations can be tested.
CD-adapco: How do you combine your personal experience of sailing with CFD simulations?Elisabeth: We are experienced sailors and that gives us first-hand knowledge about the product we are designing, and we understand the physics that the yachts are exposed to. CFD enables us to use our experience and understanding to explore a large design space and/or to focus on small details, the sum of which makes for a winning boat.
CD-adapco: How is it to work for Land Rover BAR?Rodrigo: Land Rover BAR is a fantastic team made up of great individuals and team players. We at Cape Horn Engineering are really proud of having embarked on this journey with this team. The whole team is under the same roof here in Portsmouth in this spectacular headquarters. Technological advances have always been at the heart of the America’s Cup, and here at Land Rover BAR, we have the proper CFD resources in place to explore innovative designs to get the edge we will need to win the Cup and bring it home.
FIGURE 4 - Superyacht design
FIGURE 5 - Designing, simulating, optimizing
FIGURE 6 - Getting ready to #BringTheCupHome
INTERVIEW CAPE HORN ENGINEERING

67SPECIAL REPORT
STAR-CCM+: Discover better designs, faster.Improved Product Performance Through Multidisciplinary Design Exploration.Don’t just simulate, innovate! Use multidisciplinary design explo-ration with STAR-CCM+ and HEEDS to improve the real world performance of your product and account for all of the physics that it is likely to experience during its operational life.
siemens.com/mdx
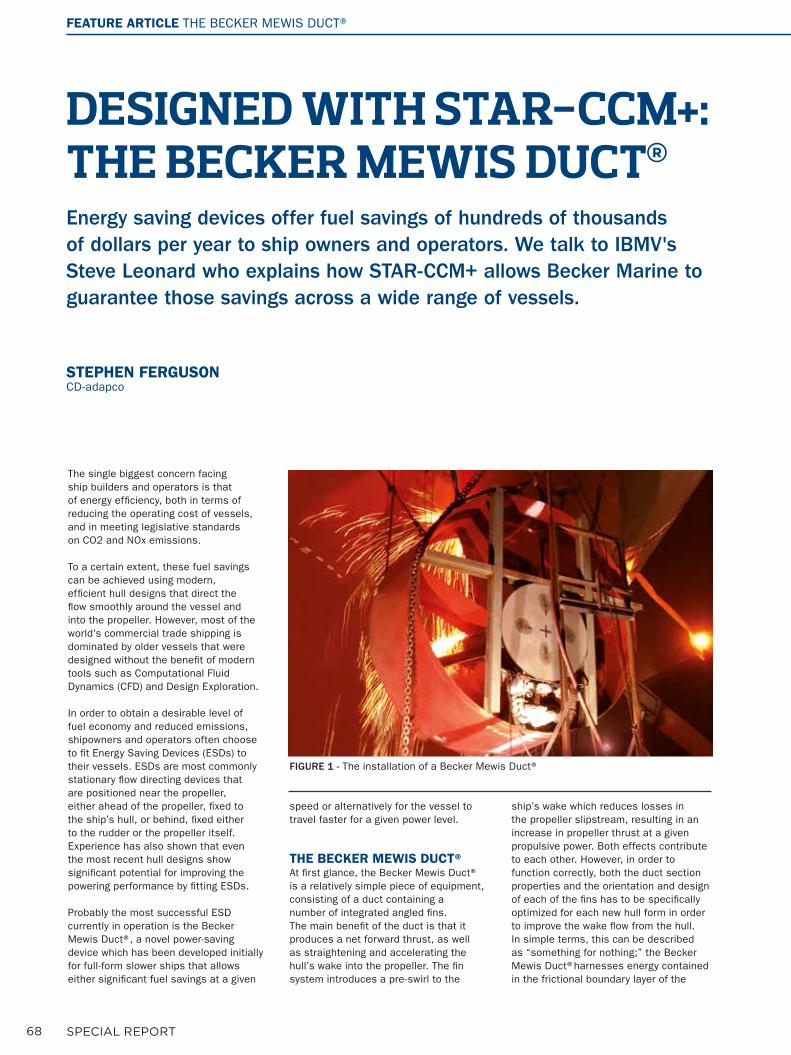
68 SPECIAL REPORT
FEATURE ARTICLE THE BECKER MEWIS DUCT®
The single biggest concern facing ship builders and operators is that of energy efficiency, both in terms of reducing the operating cost of vessels, and in meeting legislative standards on CO2 and NOx emissions.
To a certain extent, these fuel savings can be achieved using modern, efficient hull designs that direct the flow smoothly around the vessel and into the propeller. However, most of the world’s commercial trade shipping is dominated by older vessels that were designed without the benefit of modern tools such as Computational Fluid Dynamics (CFD) and Design Exploration.
In order to obtain a desirable level of fuel economy and reduced emissions, shipowners and operators often choose to fit Energy Saving Devices (ESDs) to their vessels. ESDs are most commonly stationary flow directing devices that are positioned near the propeller, either ahead of the propeller, fixed to the ship’s hull, or behind, fixed either to the rudder or the propeller itself.Experience has also shown that even the most recent hull designs show significant potential for improving the powering performance by fitting ESDs.
Probably the most successful ESD currently in operation is the Becker Mewis Duct®, a novel power-saving device which has been developed initially for full-form slower ships that allows either significant fuel savings at a given
speed or alternatively for the vessel to travel faster for a given power level.
THE BECKER MEWIS DUCT® At first glance, the Becker Mewis Duct® is a relatively simple piece of equipment, consisting of a duct containing a number of integrated angled fins. The main benefit of the duct is that it produces a net forward thrust, as well as straightening and accelerating the hull’s wake into the propeller. The fin system introduces a pre-swirl to the
ship’s wake which reduces losses in the propeller slipstream, resulting in an increase in propeller thrust at a given propulsive power. Both effects contribute to each other. However, in order to function correctly, both the duct section properties and the orientation and design of each of the fins has to be specifically optimized for each new hull form in order to improve the wake flow from the hull. In simple terms, this can be described as “something for nothing;” the Becker Mewis Duct®harnesses energy contained in the frictional boundary layer of the
DESIGNED WITH STAR-CCM+: THE BECKER MEWIS DUCT® Energy saving devices offer fuel savings of hundreds of thousands of dollars per year to ship owners and operators. We talk to IBMV's Steve Leonard who explains how STAR-CCM+ allows Becker Marine to guarantee those savings across a wide range of vessels.
STEPHEN FERGUSONCD-adapco
FIGURE 1 - The installation of a Becker Mewis Duct®
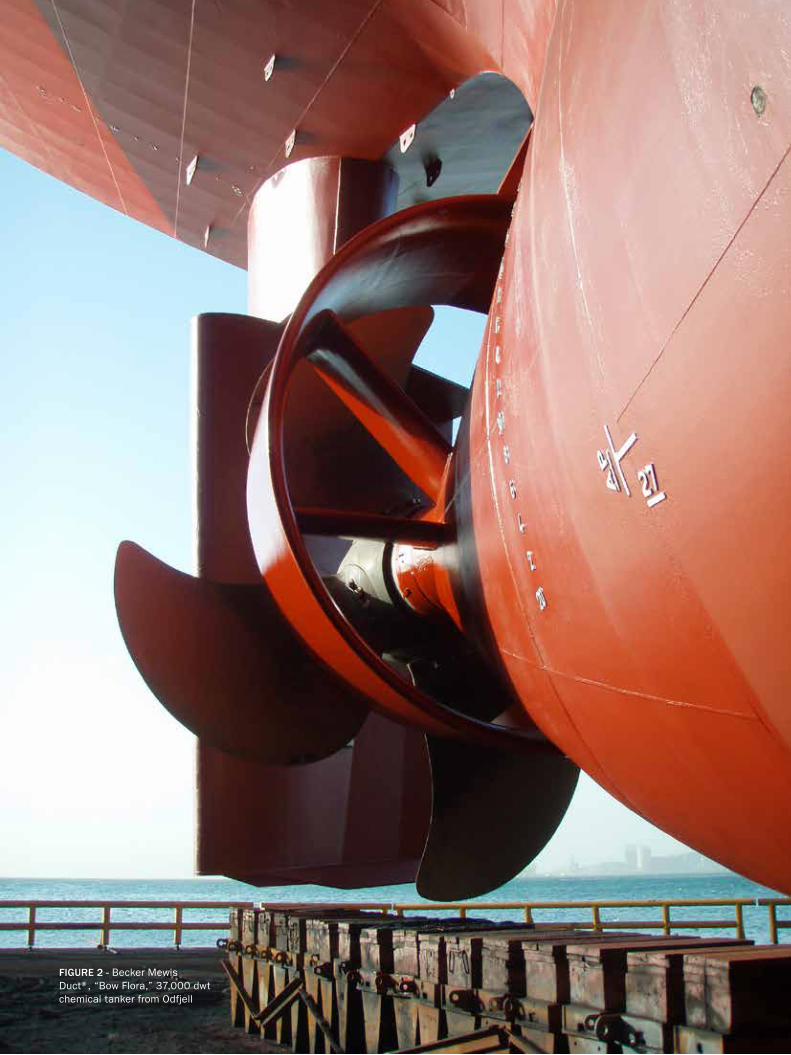
69SPECIAL REPORT
THE BECKER MEWIS DUCT® FEATURE ARTICLETHE BECKER MEWIS DUCT® FEATURE ARTICLE
FIGURE 2 - Becker Mewis Duct®, “Bow Flora,” 37,000 dwt chemical tanker from Odfjell
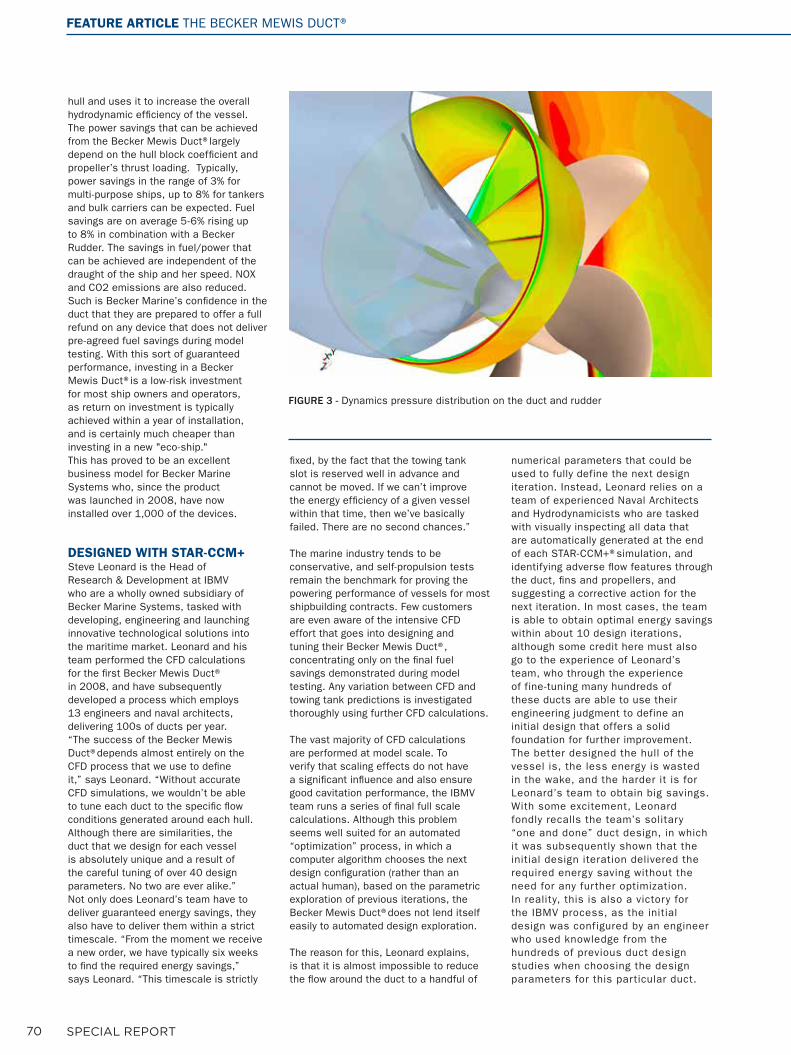
70 SPECIAL REPORT
FIGURE 3 - Dynamics pressure distribution on the duct and rudder
FEATURE ARTICLE THE BECKER MEWIS DUCT®
hull and uses it to increase the overall hydrodynamic efficiency of the vessel. The power savings that can be achieved from the Becker Mewis Duct®largely depend on the hull block coefficient and propeller’s thrust loading. Typically, power savings in the range of 3% for multi-purpose ships, up to 8% for tankers and bulk carriers can be expected. Fuel savings are on average 5-6% rising up to 8% in combination with a Becker Rudder. The savings in fuel/power that can be achieved are independent of the draught of the ship and her speed. NOX and CO2 emissions are also reduced.Such is Becker Marine’s confidence in the duct that they are prepared to offer a full refund on any device that does not deliver pre-agreed fuel savings during model testing. With this sort of guaranteed performance, investing in a Becker Mewis Duct®is a low-risk investment for most ship owners and operators, as return on investment is typically achieved within a year of installation, and is certainly much cheaper than investing in a new "eco-ship."This has proved to be an excellent business model for Becker Marine Systems who, since the product was launched in 2008, have now installed over 1,000 of the devices.
DESIGNED WITH STAR-CCM+Steve Leonard is the Head of Research & Development at IBMV who are a wholly owned subsidiary of Becker Marine Systems, tasked with developing, engineering and launching innovative technological solutions into the maritime market. Leonard and his team performed the CFD calculations for the first Becker Mewis Duct® in 2008, and have subsequently developed a process which employs 13 engineers and naval architects, delivering 100s of ducts per year.“The success of the Becker Mewis Duct®depends almost entirely on the CFD process that we use to define it,” says Leonard. “Without accurate CFD simulations, we wouldn’t be able to tune each duct to the specific flow conditions generated around each hull. Although there are similarities, the duct that we design for each vessel is absolutely unique and a result of the careful tuning of over 40 design parameters. No two are ever alike.”Not only does Leonard’s team have to deliver guaranteed energy savings, they also have to deliver them within a strict timescale. “From the moment we receive a new order, we have typically six weeks to find the required energy savings,” says Leonard. “This timescale is strictly
fixed, by the fact that the towing tank slot is reserved well in advance and cannot be moved. If we can’t improve the energy efficiency of a given vessel within that time, then we’ve basically failed. There are no second chances.”
The marine industry tends to be conservative, and self-propulsion tests remain the benchmark for proving the powering performance of vessels for most shipbuilding contracts. Few customers are even aware of the intensive CFD effort that goes into designing and tuning their Becker Mewis Duct®, concentrating only on the final fuel savings demonstrated during model testing. Any variation between CFD and towing tank predictions is investigated thoroughly using further CFD calculations.
The vast majority of CFD calculations are performed at model scale. To verify that scaling effects do not have a significant influence and also ensure good cavitation performance, the IBMV team runs a series of final full scale calculations. Although this problem seems well suited for an automated “optimization” process, in which a computer algorithm chooses the next design configuration (rather than an actual human), based on the parametric exploration of previous iterations, the Becker Mewis Duct®does not lend itself easily to automated design exploration.
The reason for this, Leonard explains, is that it is almost impossible to reduce the flow around the duct to a handful of
numerical parameters that could be used to fully define the next design iteration. Instead, Leonard relies on a team of experienced Naval Architects and Hydrodynamicists who are tasked with visually inspecting all data that are automatically generated at the end of each STAR-CCM+®simulation, and identifying adverse flow features through the duct, fins and propellers, and suggesting a corrective action for the next iteration. In most cases, the team is able to obtain optimal energy savings within about 10 design iterations, although some credit here must also go to the experience of Leonard’s team, who through the experience of fine-tuning many hundreds of these ducts are able to use their engineering judgment to define an initial design that offers a solid foundation for further improvement. The better designed the hull of the vessel is, the less energy is wasted in the wake, and the harder it is for Leonard’s team to obtain big savings. With some excitement, Leonard fondly recalls the team’s solitary “one and done” duct design, in which it was subsequently shown that the initial design iteration delivered the required energy saving without the need for any fur ther optimization. In reality, this is also a victory for the IBMV process, as the initial design was configured by an engineer who used knowledge from the hundreds of previous duct design studies when choosing the design parameters for this particular duct.
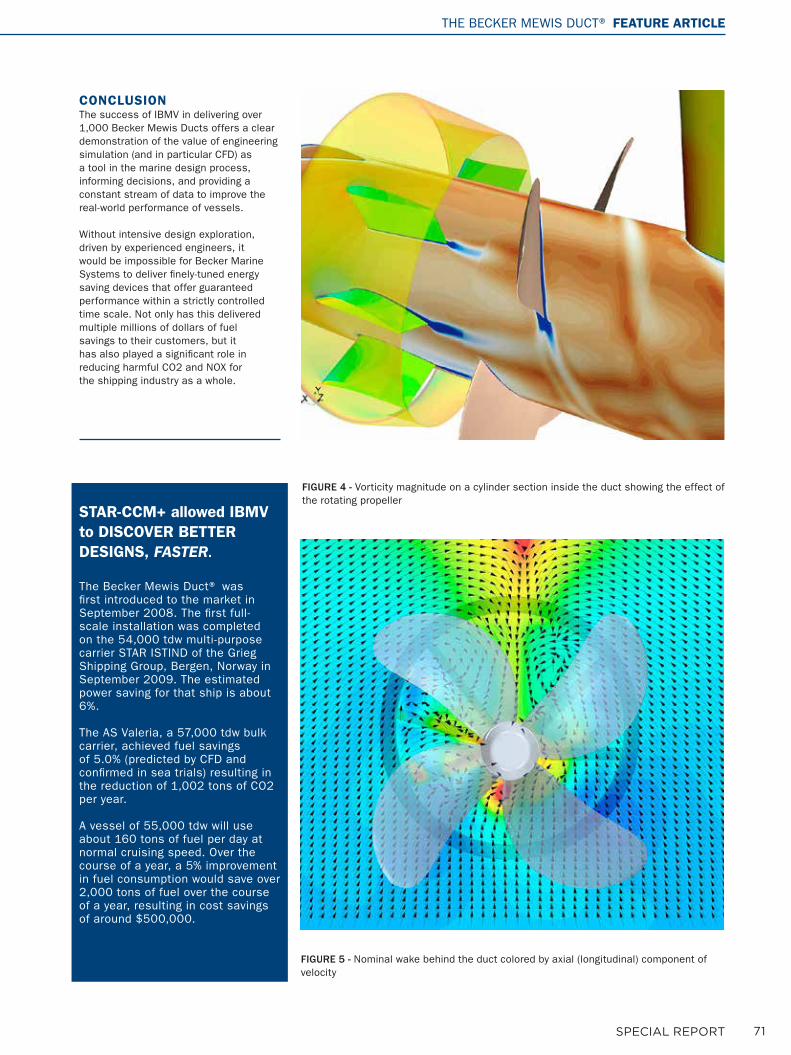
71SPECIAL REPORT
FIGURE 5 - Nominal wake behind the duct colored by axial (longitudinal) component of velocity
FIGURE 4 - Vorticity magnitude on a cylinder section inside the duct showing the effect of the rotating propeller
STAR-CCM+ allowed IBMV to DISCOVER BETTER DESIGNS, FASTER.
The Becker Mewis Duct® was first introduced to the market in September 2008. The first full-scale installation was completed on the 54,000 tdw multi-purpose carrier STAR ISTIND of the Grieg Shipping Group, Bergen, Norway in September 2009. The estimated power saving for that ship is about 6%.
The AS Valeria, a 57,000 tdw bulk carrier, achieved fuel savings of 5.0% (predicted by CFD and confirmed in sea trials) resulting in the reduction of 1,002 tons of CO2 per year.
A vessel of 55,000 tdw will use about 160 tons of fuel per day at normal cruising speed. Over the course of a year, a 5% improvement in fuel consumption would save over 2,000 tons of fuel over the course of a year, resulting in cost savings of around $500,000.
THE BECKER MEWIS DUCT® FEATURE ARTICLE
CONCLUSIONThe success of IBMV in delivering over 1,000 Becker Mewis Ducts offers a clear demonstration of the value of engineering simulation (and in particular CFD) as a tool in the marine design process, informing decisions, and providing a constant stream of data to improve the real-world performance of vessels.
Without intensive design exploration, driven by experienced engineers, it would be impossible for Becker Marine Systems to deliver finely-tuned energy saving devices that offer guaranteed performance within a strictly controlled time scale. Not only has this delivered multiple millions of dollars of fuel savings to their customers, but it has also played a significant role in reducing harmful CO2 and NOX for the shipping industry as a whole.
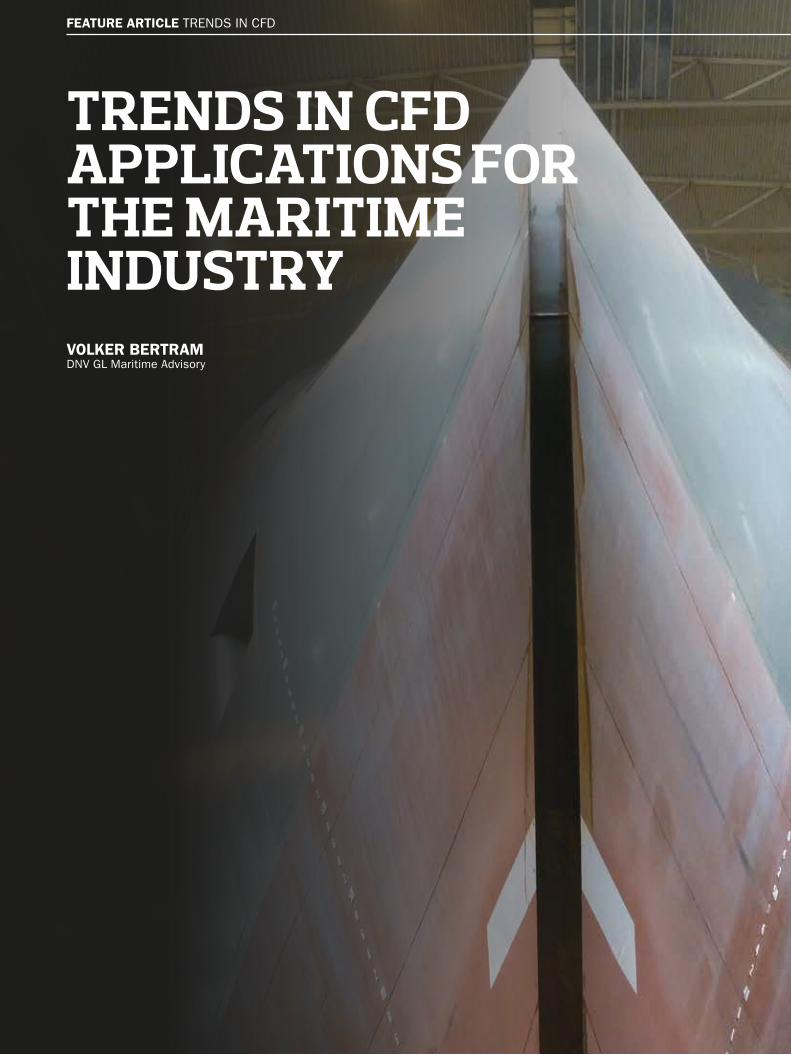
72 SPECIAL REPORT
TRENDS IN CFD APPLICATIONS FOR THE MARITIME INDUSTRYVOLKER BERTRAMDNV GL Maritime Advisory
FEATURE ARTICLE TRENDS IN CFD
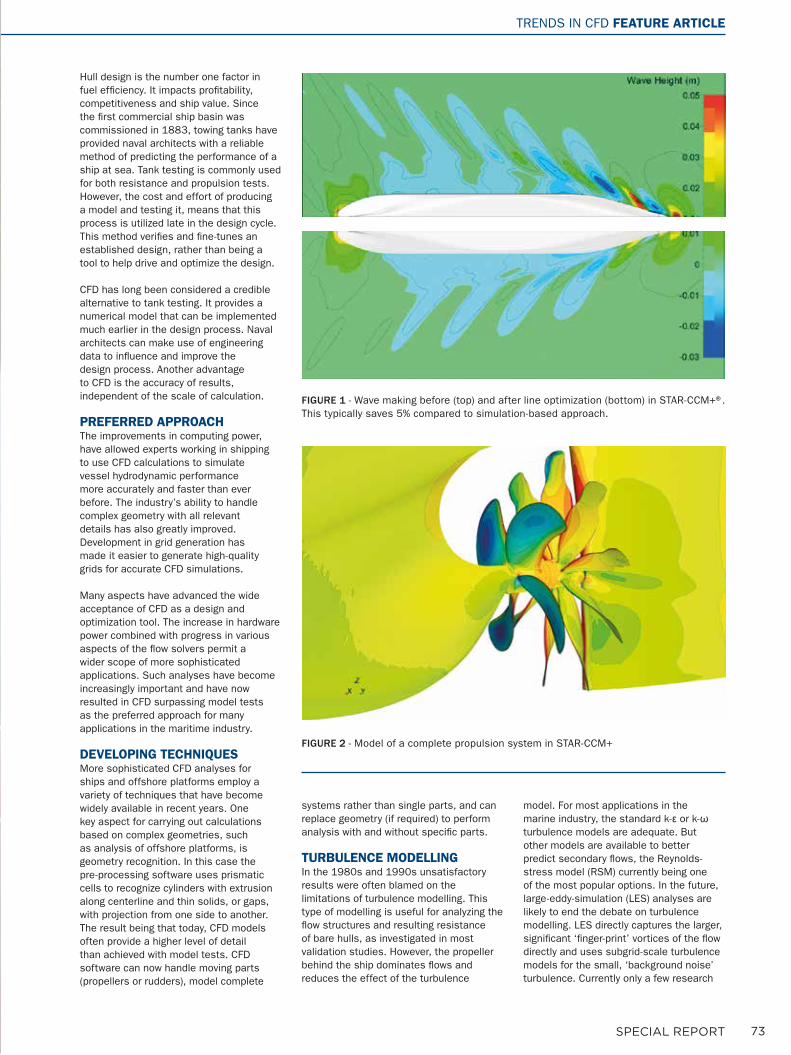
73SPECIAL REPORT
Hull design is the number one factor in fuel efficiency. It impacts profitability, competitiveness and ship value. Since the first commercial ship basin was commissioned in 1883, towing tanks have provided naval architects with a reliable method of predicting the performance of a ship at sea. Tank testing is commonly used for both resistance and propulsion tests. However, the cost and effort of producing a model and testing it, means that this process is utilized late in the design cycle. This method verifies and fine-tunes an established design, rather than being a tool to help drive and optimize the design.
CFD has long been considered a credible alternative to tank testing. It provides a numerical model that can be implemented much earlier in the design process. Naval architects can make use of engineering data to influence and improve the design process. Another advantage to CFD is the accuracy of results, independent of the scale of calculation.
PREFERRED APPROACHThe improvements in computing power, have allowed experts working in shipping to use CFD calculations to simulate vessel hydrodynamic performance more accurately and faster than ever before. The industry’s ability to handle complex geometry with all relevant details has also greatly improved. Development in grid generation has made it easier to generate high-quality grids for accurate CFD simulations.
Many aspects have advanced the wide acceptance of CFD as a design and optimization tool. The increase in hardware power combined with progress in various aspects of the flow solvers permit a wider scope of more sophisticated applications. Such analyses have become increasingly important and have now resulted in CFD surpassing model tests as the preferred approach for many applications in the maritime industry.
DEVELOPING TECHNIQUESMore sophisticated CFD analyses for ships and offshore platforms employ a variety of techniques that have become widely available in recent years. One key aspect for carrying out calculations based on complex geometries, such as analysis of offshore platforms, is geometry recognition. In this case the pre-processing software uses prismatic cells to recognize cylinders with extrusion along centerline and thin solids, or gaps, with projection from one side to another. The result being that today, CFD models often provide a higher level of detail than achieved with model tests. CFD software can now handle moving parts (propellers or rudders), model complete
systems rather than single parts, and can replace geometry (if required) to perform analysis with and without specific parts.
TURBULENCE MODELLING In the 1980s and 1990s unsatisfactory results were often blamed on the limitations of turbulence modelling. This type of modelling is useful for analyzing the flow structures and resulting resistance of bare hulls, as investigated in most validation studies. However, the propeller behind the ship dominates flows and reduces the effect of the turbulence
model. For most applications in the marine industry, the standard k-ε or k-ω turbulence models are adequate. But other models are available to better predict secondary flows, the Reynolds-stress model (RSM) currently being one of the most popular options. In the future, large-eddy-simulation (LES) analyses are likely to end the debate on turbulence modelling. LES directly captures the larger, significant ‘finger-print’ vortices of the flow directly and uses subgrid-scale turbulence models for the small, ‘background noise’ turbulence. Currently only a few research
FIGURE 1 - Wave making before (top) and after line optimization (bottom) in STAR-CCM+®. This typically saves 5% compared to simulation-based approach.
FIGURE 2 - Model of a complete propulsion system in STAR-CCM+
TRENDS IN CFD FEATURE ARTICLE
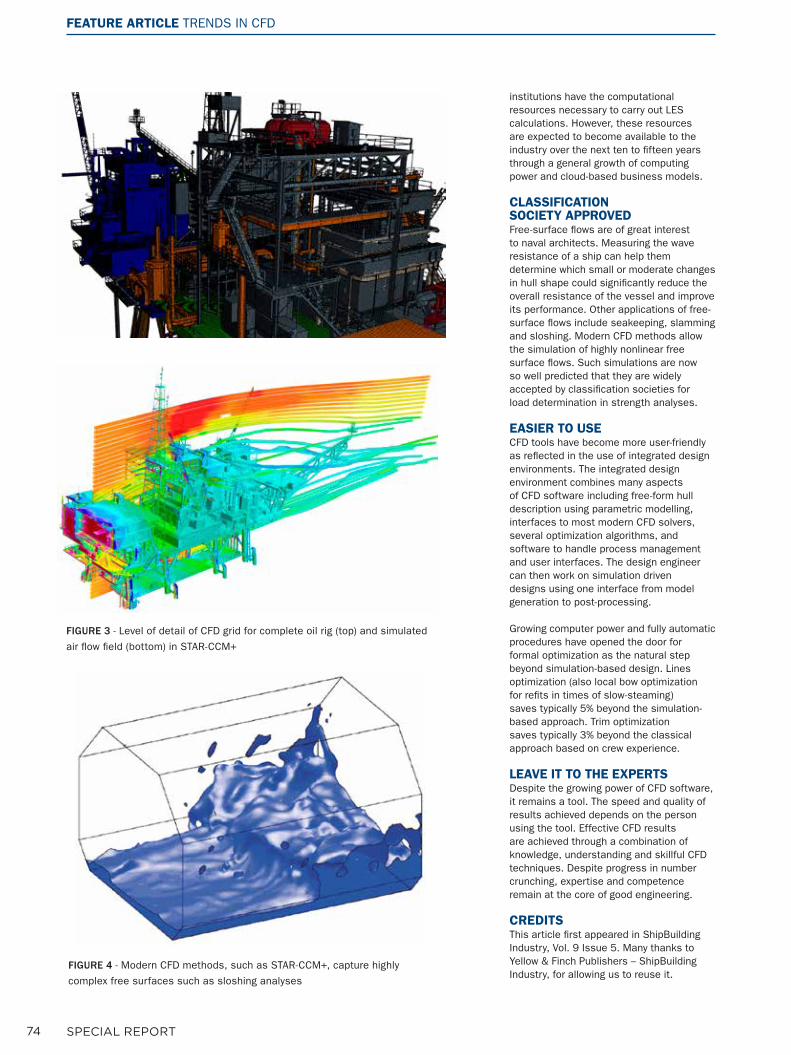
74 SPECIAL REPORT
FEATURE ARTICLE TRENDS IN CFD
FIGURE 3 - Level of detail of CFD grid for complete oil rig (top) and simulated
air flow field (bottom) in STAR-CCM+
FIGURE 4 - Modern CFD methods, such as STAR-CCM+, capture highly
complex free surfaces such as sloshing analyses
institutions have the computational resources necessary to carry out LES calculations. However, these resources are expected to become available to the industry over the next ten to fifteen years through a general growth of computing power and cloud-based business models.
CLASSIFICATION SOCIETY APPROVEDFree-surface flows are of great interest to naval architects. Measuring the wave resistance of a ship can help them determine which small or moderate changes in hull shape could significantly reduce the overall resistance of the vessel and improve its performance. Other applications of free-surface flows include seakeeping, slamming and sloshing. Modern CFD methods allow the simulation of highly nonlinear free surface flows. Such simulations are now so well predicted that they are widely accepted by classification societies for load determination in strength analyses.
EASIER TO USECFD tools have become more user-friendly as reflected in the use of integrated design environments. The integrated design environment combines many aspects of CFD software including free-form hull description using parametric modelling, interfaces to most modern CFD solvers, several optimization algorithms, and software to handle process management and user interfaces. The design engineer can then work on simulation driven designs using one interface from model generation to post-processing.
Growing computer power and fully automatic procedures have opened the door for formal optimization as the natural step beyond simulation-based design. Lines optimization (also local bow optimization for refits in times of slow-steaming) saves typically 5% beyond the simulation-based approach. Trim optimization saves typically 3% beyond the classical approach based on crew experience.
LEAVE IT TO THE EXPERTSDespite the growing power of CFD software, it remains a tool. The speed and quality of results achieved depends on the person using the tool. Effective CFD results are achieved through a combination of knowledge, understanding and skillful CFD techniques. Despite progress in number crunching, expertise and competence remain at the core of good engineering.
CREDITSThis article first appeared in ShipBuilding Industry, Vol. 9 Issue 5. Many thanks to Yellow & Finch Publishers – ShipBuilding Industry, for allowing us to reuse it.

75SPECIAL REPORT
STAR-CCM+ global academic program.Educating tomorrow's engineers today.
siemens.com/mdx
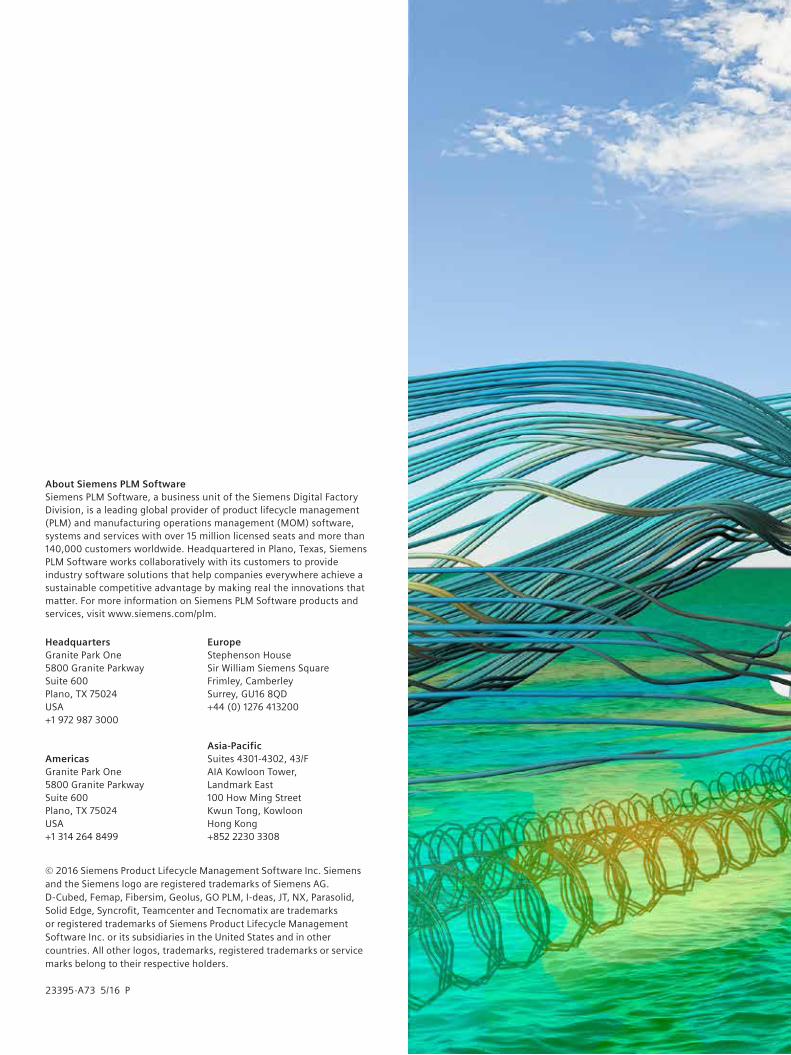
About Siemens PLM Software Siemens PLM Software, a business unit of the Siemens Digital Factory Division, is a leading global provider of product lifecycle management (PLM) and manufacturing operations management (MOM) software, systems and services with over 15 million licensed seats and more than 140,000 customers worldwide. Headquartered in Plano, Texas, Siemens PLM Software works collaboratively with its customers to provide industry software solutions that help companies everywhere achieve a sustainable competitive advantage by making real the innovations that matter. For more information on Siemens PLM Software products and services, visit www.siemens.com/plm.
Headquarters Granite Park One 5800 Granite Parkway Suite 600 Plano, TX 75024 USA +1 972 987 3000
Americas Granite Park One 5800 Granite Parkway Suite 600 Plano, TX 75024 USA +1 314 264 8499
Europe Stephenson House Sir William Siemens Square Frimley, Camberley Surrey, GU16 8QD +44 (0) 1276 413200
Asia-PacificSuites 4301-4302, 43/F AIA Kowloon Tower, Landmark East 100 How Ming Street Kwun Tong, Kowloon Hong Kong +852 2230 3308
© 2016 Siemens Product Lifecycle Management Software Inc. Siemens and the Siemens logo are registered trademarks of Siemens AG. D-Cubed, Femap, Fibersim, Geolus, GO PLM, I-deas, JT, NX, Parasolid, Solid Edge, Syncrofit, Teamcenter and Tecnomatix are trademarks or registered trademarks of Siemens Product Lifecycle Management Software Inc. or its subsidiaries in the United States and in other countries. All other logos, trademarks, registered trademarks or service marks belong to their respective holders.
23395-A73 5/16 P