direct measurements of drag forces on a … · direct measurements of drag forces on a microcrawler...
TRANSCRIPT

DIRECT MEASUREMENTS OF DRAG FORCES
ON A MICROCRAWLER
by
Yegor Rabets
A thesis submitted in conformity with the requirements
for the degree of Master of Applied Science in the
Institute of Biomaterials & Biomedical Engineering
University of Toronto
© Copyright by Yegor Rabets (2014)
ii
Direct Measurements of Drag Forces on a Microcrawler
Yegor Rabets
Master of Applied Science
Institute of Biomaterials & Biomedical Engineering
University of Toronto, 2014
ABSTRACT
In the study of the molecular origins of behaviour, the nematode Caenorhabditis elegans has
emerged as a powerful tractable model. To fully understand an organism’s behaviour, one must
also understand the physics of the surrounding medium. The work discussed in this thesis
focuses on the interactions of C. elegans with the environment it is most frequently observed in –
a viscoelastic agar substrate covered by a thin liquid film.
We have used a micropipette-based force measurement technique to directly measure for the first
time the forces involved in crawling locomotion of a microorganism. We found that substrate
viscoelasticity introduces nonlinearities in the force-velocity relationships, and suggested
physical mechanisms for the origin of these nonlinearities. Furthermore, we applied a
modification of resistive force theory to recordings of nematode body shape and were able to
obtain good agreement with simultaneously recorded lateral forces exerted by a crawling subject.

iii
ACKNOWLEDGMENTS
As is normally the case with scientific endeavours, the number of people who directly or
indirectly supported me in this work is too great for me to acknowledge everyone properly.
However I would like to mention several people whose contributions were most significant.
This work would not have been possible without the astute mentorship of my advisor Prof.
William Ryu. I’m grateful for the barely-bounded freedom in the laboratory, plentiful bits of
advice big and small, and for help with massaging this project into tangible form.
Matilda Backholm has been instrumental in (very efficiently!) endowing me with all the tools
and knowledge necessary to adopt the force measurement technique, and has contributed many
thoughtful comments. Kari Dalnoki-Veress is cordially acknowledged for sharing the technique.
Actual and adopted members of the Ryu lab have been supremely helpful in setting up the
project. Many thank to Donald Fu, who helped refine the main assays and prepare reagents;
Konstantine Palanski, Adriana Reyna and Mia Panlilio who all contributed key pieces of
automation and analysis software; Irwin Adam Eydelnant for the fluids discussions; and Ippei
Kotera for immeasurable great questions and continued inspiration.
Lastly, I’m continually grateful for Rachel Claman’s unwavering support which knows no
conceptual or geographic bounds.
The funding of NSERC, the Norman Stuart Robertson Fellowship and the Frank Howard Award
is appreciatively acknowledged.

iv
TABLE OF CONTENTS
ABSTRACT ................................................................................................................................................................ II
LIST OF FIGURES .................................................................................................................................................... V
CHAPTER 1: INTRODUCTION & BACKGROUND ........................................................................................... 1
1.1 From molecules to behaviour ..................................................................................................................... 1 1.2 The role of environment in behaviour .................................................................................................... 1 1.3 Locomotion theories & previous experimental work ...................................................................... 3
CHAPTER 2: DRAG FORCE MEASUREMENTS ................................................................................................ 7
2.1 Cantilever-based force sensing: an overview ...................................................................................... 7 2.2 Methods ............................................................................................................................................................... 7 2.3 Results ................................................................................................................................................................ 12 2.4 Discussion ......................................................................................................................................................... 14
CHAPTER 3: PHYSICAL FACTORS CONTRIBUTING TO DRAG FORCES............................................... 15
3.1 Evidence for channel formation .............................................................................................................. 15 3.2 Methods: probing channel formation ................................................................................................... 15 3.3 Results: channel formation ........................................................................................................................ 17 3.4 Discussion: channel formation ................................................................................................................. 20 3.5 Channel formation does not explain response of drag forces to agar concentration .............. 22 3.6 Methods: measuring shear gradients .................................................................................................... 23 3.7 Results & discussion: shear gradients .................................................................................................. 24
CHAPTER 4: VALIDATION OF DRAG FORCE MEASUREMENTS IN CRAWLING SUBJECTS ............ 26
4.1 Introduction ..................................................................................................................................................... 26 4.2 Methods ............................................................................................................................................................. 26 4.3 Results & discussion ..................................................................................................................................... 29
CHAPTER 5: CONCLUDING REMARKS ........................................................................................................... 32
5.1 Summary ........................................................................................................................................................... 32 5.2 Outstanding questions & new avenues of research ........................................................................ 33 5.3 Outro ................................................................................................................................................................... 33
REFERENCES .......................................................................................................................................................... 34
APPENDIX A: DERIVATION OF ADHESION FORCE RELATIONSHIP .................................................... 38
APPENDIX B: DERIVATION OF INITIAL SETTLING SPEED DURING CHANNEL FORMATION ..... 40
APPENDIX C: NOTES ON METHOD DEVELOPMENT: AVOIDING PITFALLS ...................................... 42

v
LIST OF FIGURES
Figure 1: Straight pipette calibration. ..........................................................................................................8
Figure 2: Cantilevered pipettes are calibrated against straight pipettes. .....................................................8
Figure 3: System architecture. .....................................................................................................................9
Figure 4: Experimental setup for direct drag force measurements. ..........................................................10
Figure 5: Drag force vs. contact length. ....................................................................................................11
Figure 6: Typical time-series for a drag force measurement. ....................................................................12
Figure 7: Characterization of drag forces on gels with different agar concentrations. .............................13
Figure 8: Worms leave wider grooves after resting on the surface longer. ...............................................15
Figure 9: Sample image of an adhesion force measurement. ....................................................................16
Figure 10: Characterizing the settling of worms into viscoelastic substrates. ..........................................18
Figure 11: Experimental and theoretical estimates of adhesion force acting on crawling nematodes. .....19
Figure 12: Liquid layer depth on the agar surface. ...................................................................................20
Figure 13: Mean lubrication layer thickness decreases with channel formation. ......................................21
Figure 14: Quantifying nonlinearities in drag force curves. .....................................................................22
Figure 15: Tangential drag force depends on liquid layer depth. ..............................................................23
Figure 16: Tracking of flow patterns around crawling worms. .................................................................24
Figure 17: Decomposition of worm segment speeds into normal and tangential components. ................27
Figure 18: Reconstruction of forces exerted by a nematode during crawling. ..........................................29
Figure 19: Optimization of drag coefficients. ...........................................................................................30
Figure 20: Distributions of normal and tangential velocities for freely-crawling and held worms. .........31

1
CHAPTER 1.
INTRODUCTION & BACKGROUND
1.1 From molecules to behaviour
One of the immense challenges in systems biology is connecting permutations of discrete
biochemical events to complex eukaryotic behaviours. Even unicellular organisms can display
robust responses to their environment by moving up nutrient gradients1,2
, entraining to circadian
rhythms3,4
or even exhibiting a primitive form of memory5. When investigating multicellular
animals, however, it becomes extremely difficult to track all the molecular factors contributing to
behaviour.
Pioneered by Sydney Brenner in the 1970s6, the nematode Caenorhabditis elegans emerged as
an attractive model to examine eukaryotic behaviour. It has been rigorously studied in numerous
disciplines including genetics; systems, cellular and molecular biology; neuroscience; and
biophysics. Its well-characterized genome, biochemical pathways and nervous system allow the
connection between molecular events and motor output to be thoroughly documented.
Furthermore, C. elegans is particularly well suited for quantitative studies of locomotion because
its behaviour consists primarily of quasi-sinusoidal undulations propagated down its slender
body and has been shown to be low-dimensional7.
1.2 The role of environment in behaviour
An organism's locomotory pattern is a function of its body shape, motor output and
environmental forces. To optimally adapt to movement in their environment, many animals can
develop morphological modifications over long time scales and behavioral modifications over
shorter time scales. Resistive environmental forces, however, are always compulsory for
transforming bodily movement into net propulsion. Thus to fully understand intended behaviour,
one must also understand the physics of the surrounding medium.

2
Due to C. elegans’ small size, its environment can readily be controlled and modified. The
nematode is most frequently observed on agar plates consisting of a viscoelastic polysaccharide
gel covered by a thin layer of liquid, and thus presents an interesting case of complex
interactions with an inhomogeneous environment. Like many submillimeter-sized organisms, C.
elegans must spend its life interacting with liquid to avoid desiccation and subsequent
physiological demise. Its physical interactions with the vital liquid layer introduce some
interesting physics which are not normally experienced at the human scale.
1.2.1 Life at low Reynolds number
The Reynolds number (where ρ is the fluid density, u is the fluid velocity, is the
characteristic length scale and μ is the fluid's dynamic viscosity) quantifies the ratio of inertial to
viscous forces in a fluid mechanical system. With crawling speeds of roughly 300 µm/s in water
with dynamic viscosity of 0.001 Pa·s, assuming the lubrication layer thickness of 1-10µm under
the worm to be the characteristic length scale, C. elegans is truly a low Reynolds number crawler
with Re~0.01. This number is not as strikingly low as the one inhabited by bacteria (Re~3x10⁻⁵
),
but is still small enough to be described by low Re locomotion dynamics8.
This low ratio tells us that viscous forces dominate inertial forces in the interactions of these
microorganisms with their medium. Inhabiting a liquid environment at a low Reynolds number
means that one will remain motionless unless constantly applying forces to the surroundings.
This is, of course, a stark contrast to being able to glide across a skating rink in the human high
Re world. As summarized brilliantly by Edward Purcell9 (whose famous talk is this section’s
namesake), this implies that microorganisms must move their bodies asymmetrically to
translocate in a directed fashion.
1.2.2 Symmetry breaking for propulsion
Sir James Lighthill, Geoffrey Taylor and G.J. Hancock developed the first mathematical
descriptions of undulatory swimming by solving for fluid flow around entire long thin
filaments10–14
. This work points to the necessary breaking of two symmetries in order for
propulsion to occur:

3
1. Because of the viscous environment, forces to the surrounding fluid are transferred nearly
instantaneously. The speed of movement is thus irrelevant; only the sequence of motions
matters. Hence, the propulsive motion must be non-reversible in time.
2. The propulsive forces acting normally to the body must overpower the drag forces
tangential to the body. Hence, either the body or the environment must be asymmetrical
in the axes normal and tangential to propulsion.
These early hydrodynamic theories assumed that the undulating projections were infinitely long
and slender, an ideal case in which the resistance to normal movement was shown to be exactly
double the resistance to tangential movement14
(i.e. the normal and tangential drag coefficients
are related as C⊥/C∥=2). The other assumption was that bodies produced perfect sine waves
with infinitesimally small amplitudes. This is most appropriate for the modelling of long thin
flagella with aspect ratios of greater than 200.15
The aspect ratio of C. elegans, however, is
approximately 15-17. Thus, we must consider finite bodies if applying these hydrodynamic
theories.
1.3 Locomotion theories & previous experimental work
1.3.1 Resistive force theory
Undulatory propulsion is employed by a diverse array of organisms from nematodes, flagellated
bacteria and spermatozoa to snakes and sandfish lizards14,16–20
. In their original formulation of
resistive force theory17
, Gray and Hancock were the first to break down the undulating organism
into infinitesimal sections and to treat each segment independently. Resistive force theory (RFT)
on the micro-scale makes use of the low Re approximation by linearly relating the forces exerted
on the surrounding viscous fluid to the normal and tangential velocities relative to the fluid:
∥ ∥ ∥ (1)
Initially, RFT had been developed for swimmers in perfectly viscous media and for macroscopic
terrestrial crawlers on solid surfaces15,21–23
. More recently, it has been extended to slender
macroscopic undulators on granular media24,25
, flat surfaces19
and in muds26
. For viscous

4
swimmers, RFT neglected hydrodynamic interactions between segments of the organism, but
this is somewhat paradoxical considering viscous fluids exhibit long-range interactions.
Lighthill extended the theoretical analysis to include these long-range interactions and developed
correction factors for predicting drag coefficients21
. While original formulations of RFT in wet
media were for bodies immersed in infinite homogeneous liquids, the same ideas could
presumably be adapted to lubricated crawling environments.
Gray and Lissman introduced a widely used method for estimating the drag coefficient ratio
C⊥/C∥ based on the amount of slip observed in a crawling organism16
. Mathematically, given an
animal’s translation speed , undulation wave speed , wavelength and amplitude , the
percentage of slip is:
(2)
Qualitatively, Gray and Lissman argued that at , no progress can be made in any direction
and all bodily movement is manifested as slip. For , there is no tangential resistance to be
overcome and therefore there is absolutely no slip. In the interesting case of , there is
more resistance to tangential movement and the animal progresses in the same direction as its
propagated body wave.
1.3.2 Lubrication theories
In nature, thin films are not always a mathematical or physical inconvenience but are often a
practical feature of an animal’s microenvironment. For nematodes, thin films provide vital
lubrication when moving through otherwise solid granular environments such as soil27
and allow
animals to migrate up plant stalks after rainfall in search of nutrients28
.
Several recent studies have focused on microorganism locomotion on thin liquid films29,30
.
Physical theories of movement on liquid films all start with the basic lubrication approximation.
Taking advantage of the disproportionate length scales in the direction of movement and
perpendicular to the plane of lubrication layer, we can treat the fluid flow as being constant in the

5
direction of nematode motion. The generalized Navier-Stokes equations of fluid flow then
reduce to a two-dimensional problem in cross-sectional slices of the nematode. These equations
are then solved for various geometries and boundary conditions:
(3)
The inclusion of substrate effects into these models is difficult. Shen et al. imaged some static
channel properties and imposed a constant groove shape in their calculations29
. Because of the
static substrate and the linearization of lubrication equations, Shen et al. obtained a linear force-
velocity relationship (as in RFT) and estimated tangential drag at a speed of 300 µm/s to be
around 7 µN. Sauvage et al. did not approach this problem at all and were thus unable to predict
drag coefficient ratios greater than two30
. This paper does, however, propose a simple estimate
of the effects of a non-Newtonian fluid. By assuming that the worm actively deforms agar in
both lateral and propulsive directions, the suggestion is that the drag coefficient ratios will
approach the aspect ratio of the worm – typically 15-17.
1.3.3 Prior experimental work
Gray and Lissmann were the first to attempt to empirically quantify normal and tangential drag
coefficients16
. By dropping wire segments with similar dimensions to a nematode into glycerine
and golden syrup and observing the wire trajectories, they indirectly inferred the coefficient
ratios. The ratios were estimated to be C⊥/C∥ 1.4-1.6 for microswimmers.
Half a decade later, Wallace also obtained experimental estimates of drag forces for crawlers by
dragging glass rods across agar surfaces31
. In a clever experiment, he set a cut-out section of
agar from a plate vertically, placed a small glass rod on the flat surface and attached a weight to
the rod with sticky tape. Wallace surmised that forces between 2-7 µN were necessary to move a
nematode-sized object tangentially on gels with agar concentrations between 1-8%. It should be
noted here that the force required to displace a stationary object on agar is likely not the same as
the force required to keep an object which is already in motion moving. (In a purely viscous
infinite swimming medium, it would be, assuming the final velocity is the same; however the
agar might impose additional speed-dependent effects). Nevertheless, this experiment served as

6
the main inspiration for the project described in this thesis. In other work around the same time,
Wallace was the first to report that the thickness of the lubrication layer affects crawling
kinematics27,32
.
Propulsive forces have also previously been inferred from patterns of fluid flow around a
swimming worm33
. Much of the other literature34–36
dealing with crawling locomotion made use
of Gray and Lissman’s drag coefficient ratio approximation described in section 1.3.1. For
instance, Karbowski et al. assigned a single number for the agar’s drag coefficient ratio
C⊥/C∥ 9-14 based on observations of slip34
.
In general, prior work either addresses key physical parameters contributing to locomotion from
a purely theoretical perspective or relies on indirect measures. Hence in the following chapters I
will describe an attempt to quantify drag forces directly with the ability to modulate numerous
parameters independently. To form a complete picture of the forces involved in lubricated
crawling locomotion, I will control the drag speed of the nematode and change environmental
parameters such as agar stiffness.

7
CHAPTER 2.
DRAG FORCE MEASUREMENTS
2.1 Cantilever-based force sensing: an overview
Instruments with a linear response are calibrated more easily and precisely than those with an
arbitrarily-shaped input-output curve. Hence, as cantilevers offer a simple design solution to a
linear force transducer, they are commonly used to accurately measure and apply forces. The
atomic force microscope37
and other piezoresistive microelectromechanical system (MEMS)
probes38,39
are key examples of cantilever-based force sensors. Cantilevers are also readily tuned
by adjusting the probe’s geometry or material properties and thus allow for wide dynamic range.
For interrogating minute drag forces experienced by microscopic creatures, we have
implemented a cantilever-shaped micropipette sensing technique. The particular variant of our
adopted technique was developed in Kari Dalnoki-Veress’ group at McMaster University, and
utilizes water droplets to calibrate the pipette.
2.2 Methods
2.2.1 Micropipette calibration
Micropipettes were manufactured and calibrated according to a protocol developed by Colbert et
al.40
All pipettes were extruded with a Narishige PC-10 micropipette puller, and some also
shaped into cantilevers using a heated platinum-iridium wire. Straight pipettes were calibrated
by squeezing a water droplet out of the tip and by noting tip displacement (Figure 1). Plotting
this displacement against the droplet mass reveals a linear, Hookean spring-like relationship
from which we can extract a spring constant.
(4)

8
Figure 1: Straight pipette calibration. A water droplet squeezed from a micropipette causes deflection proportional to the droplet's force.
Using straight pipettes as a reference, cantilevered pipettes were then calibrated by pushing the
cantilever tips against straight tips. Equating forces, the spring constant is calculated from the
ratio of tip velocities:
(5)
Figure 2: Cantilevered pipettes are calibrated against straight pipettes. Relative speeds yield the stiffness ratio.
Tip widths of the force-measuring cantilever pipettes were approximately 30-50 μm for drag
speeds over 500 μm/s, and 20-40 μm for lower speeds. With cantilever lengths of 15-20 mm, the
measured spring constants were between 60-350 nN/μm.

9
2.2.2 Agar preparation
To ensure the consistency of agar material properties, nematode growth medium (NGM) without
buffers was prepared all at once and stored in aliquots. Each aliquot was reheated reproducibly,
had buffers (25mM KPO4, 1mM CaCl2, 1mM MgSO4) and 5μg/L cholesterol added when
cooled to 55°C, and was poured daily into 5mL plates 3 hours before assaying. Plates were then
allowed to dry for 15 minutes before commencing experiments (please refer to Appendix C for
explanation). During each experiment there was less than 5% loss of water mass. For trials with
modified surface tension, varying dilutions of non-ionic surfactant Tween20 were added to
reheated NGM just prior to buffers.
2.2.3 Motorized stage control
The main user interface was developed in LabVIEW; it provides visual feedback, controls for
starting an experiment and is responsible for acquiring and saving images. Communications
with the 4-axis linear stage controller, however, were established indirectly via embedded
MATLAB scripts. Reverse engineering the stage controller’s serial interface allowed us to
control stages with both an external joystick and customized LabVIEW-generated commands.
Figure 3: System architecture.
2.2.4 Drag measurements
Worms on NGM plates were transiently paralyzed by immersing them in a 0.5μL drop of 3mM
Levamisole hydrochloride. Once the drop absorbed into the agar, animals were captured and
held with light suction by calibrated pipettes filled with M9 buffer (see Figure 4). Each worm
was pre-dragged on clean NGM for at least 30 mm (about 30 body lengths) to wash off residual

10
Levamisole and to reduce the effect of stretching during data collection. The plates were then
translated at fixed speeds while the cantilevers were held stationary. Worms were held by the
tail for tangential drag, and by both head and tail for normal drag experiments. All worms
recovered from paralysis and were motile within 24 hours.
Figure 4: Experimental setup for direct drag force measurements. (A) Light from a cool white quasi-collimated LED is used to trans-illuminate an agar plate, and is collected by a CCD camera. (B,D) Suction applied through
cantilevered micropipettes is used to hold worms by the tail or by both head and tail for tangential and normal drag, respectively. (C,E) Raw video data of the worm before and after initiating stage translation at a fixed velocity.
Displacements of each pipette are used to calculate instantaneous forces.
The tangential force is calculated from the pipette's spring constant , its deflection (Figure
4c), and the length of the worm in contact with the agar surface ( ). The force is then
extrapolated to a 1mm worm:
(6)
Here we assumed, as does resistive force theory, that the measured forces scale linearly with
worm length. The assumption was verified for both normal and tangential drag for this particular
assay (see Figure 5).

11
Figure 5: Drag force vs. contact length. For stationary anaesthetized nematodes, both normal and tangential drag scale linearly with the length of the worm in contact with agar.
When dragged normally, worms bend in the direction of stage motion (Figure 4e) and we must
factor out any contributing tangential drag components. With being the angle between the
worm's tangent and the unstretched worm axis and the worm’s body coordinate, vector
decomposition along the worm body yields:
(7)
Here, and are the left and right pipette stiffnesses, and the pipette
displacements, and is the velocity-dependent tangential drag force measurement.
2.2.5 Interpreting drag force time series
Each measurement essentially consists of 6 trials of worms moving along the agar surface. A
representative time-series of a trial (shown in Figure 6) has four distinct regimes:
I. Stage acceleration and worm stretching: Because the worm must be moved out of the
groove it formed while idling, the initial drag is higher than average.
II. Drag at constant velocity: Once the worm is moving, the drag force approaches a steady-
state value.
III. Stage deceleration and worm relaxation: After the stage stops, the residual restoring
force in the cantilever draws the worm towards equilibrium.

12
IV. Refractory period: The system is allowed to rest for 10 seconds before the next trial.
Figure 6: Typical time-series for a drag force measurement. The particular example shown here was recorded from normal drag with a stage velocity of 750µm/s on standard nematode growth medium (1.7% agar).
Only data from region II is used for calculating the drag force for a given trial.
2.2.6 Image acquisition and processing
Drag experiments were recorded with a custom imaging system consisting of a tele lens with
90mm focal length mounted on a Manta G-125 CCD camera (Allied Vision Technologies
GmbH, Stadtroda, Germany). Drag images captured at 30Hz were processed with custom
MATLAB scripts to extract pipette deflection for each trial.
2.2.7 Worm strains & culture
N2 wild-type worms, acquired from the Caenorhabditis Genetics Center, were cultivated
according to standard methods6 on Escherichia coli (OP50) nematode growth media (NGM)
plates at 20 °C.
2.3 Results
2.3.1 Typical C. elegans locomotion
In laboratory conditions on standard agar plates, young adult C. elegans typically travel at speeds
of roughly 100-300 µm/s. The speed may fluctuate depending on numerous environmental
factors such as the presence of food41
or temperature fluctuations over 5° 42
, and internal factors

13
such as starvation41
or dopamine balance43
. In aqueous systems, speeds of up to several cm/s
(more than ten-fold increases over typical swimming locomotion) have been observed in
artificially structured44
and in particulate45
systems. On agar, however, C. elegans rarely moves
faster than 0.8 mm/s – a speed it can reach during its escape response46
. To cover the entire
physiologically relevant range of the worm, drag speeds of up to 1mm/s were tested.
2.3.2 Important features of drag force trends
There are three notable features of the drag force results summarized in Figure 7. The most
obvious feature is that normal drag for each condition is higher than the tangential drag. This is
as expected for organisms which break spatiotemporal motor symmetry and generate thrust in
the direction opposite to their propagated bodily movement17
.
Figure 7: Characterization of drag forces on gels with different agar concentrations. In identical conditions, normal drag forces are larger than tangential forces. The forces do not scale linearly with velocity, and increase on
gels with higher agar concentrations.
The most important observation, however, is that the force-velocity curves are not linear. Thus
they do not fit with the naïve expectations of fluid drag at low Reynolds number or with
previously proposed forms of resistive force theory. This non-linearity is especially prevalent in
the typical locomotion regime for C. elegans of speeds lower than 300 µm/s. One final feature to
note is that drag increases on gels with higher agar concentration.
Interestingly, the slope ratios of linear sections of normal vs. tangential drag curves for each
condition lie between 1.3-1.6, with a mean around 1.5. This implies that if extrapolated to

14
infinity, the drag coefficient ratios would be constant around 1.5. This is precisely the value
initially suggested by Gray and Lissman16
and confirmed with both extrapolations from
kinematic data33
and direct measurements47
for swimming nematodes.
2.4 Discussion
What causes the observed non-linearities in the drag curves? It has been noted at the outset by
Gray48
and Hancock17
and shown much later theoretically by Lighthill21
that the validity of
resistive force theory is contingent on the animal’s slenderness, the small amplitude of
undulations and the medium’s viscosity. More importantly, constant coefficient resistive force
theory was originally developed for swimmers which inhabit a nearly perfectly viscous medium
and for macroscopic terrestrial crawlers which can be said to slide on a perfect solid. The
medium in our experiments, however, is viscoelastic and cannot be idealized to react
instantaneously to applied forces. Indeed, it appears that at high speeds (when there is little time
for the crawler to interact with substrate) drag force relationships approach those of swimming
worms, whereas at low speeds forces deviate from linearity. Hence it is natural to ask whether
some artefact of viscoelasticity is responsible for this effect.
Additionally, the difference in swimming and crawling gaits in C. elegans has been partially
attributed to the incision of channels in agar during crawling. In the language of resistive force
theory, the indentation of agar and thus the formation of channels effectively makes the worm’s
crawling substrate a non-Newtonian medium and allows the ratios of normal to tangential drag
coefficients to increase above 2. This might then explain the variations in forces at low speeds.

15
CHAPTER 3.
PHYSICAL FACTORS CONTRIBUTING TO DRAG FORCES
3.1 Evidence for channel formation
Channels can be observed by imaging the agar surface behind a worm. The drag experiment
provides a controlled environment for qualitative confirmation of channel formation. Notably,
the marks left behind by stationary animals are significantly wider than those left behind by
moving animals. In the case illustrated in Figure 8, the wider trace on the left-hand side of the
image persists for almost exactly one “contact length” – the length of the worm in contact with
the agar. Traces fade after a patch of agar is vacated, as evidenced by the very faint trace to the
left of the 46 µm groove. Since channels are assumed to affect the physics of locomotion, I
describe the dynamics of channel formation in the following sections.
Figure 8: Worms leave wider grooves after resting on the surface longer. The left portion of the trace was left behind by a worm left at rest on an agar surface for over a minute. The middle (34µm wide) portion of the trace
was left within several seconds of capturing the image by the worm as it is translated to the right.
3.2 Methods: probing channel formation
3.2.1 Worm settling measurements
After paralyzing worms, 10x4 mm sections of agar were cut out of the plate and placed on a
microscope slide for horizontal imaging. Worms were held by a micropipette and dragged into
the field of view. The silhouette was imaged for a minute at 30FPS, and the lowering of the top
of the cuticle was assumed to be indicative of increasing channel depth. The relaxation of agar
due to dehydration was also noted and subtracted from the settling time series.

16
3.2.2 Adhesion force measurements
After paralyzing worms, 10x4 mm sections of agar were cut out of the plate and placed on a
microscope slide for horizontal imaging. Worms were again held by a micropipette and slowly
lifted off the agar until only the anterior 40 µm section – the head tip – was in contact with the
water layer. As the worm pulls off from the surface, the adhesion force can be obtained from the
pipette tip displacement. Each worm was only assayed once due to significant dehydration
effects after each trial, and trials were completed within 5 minutes of cutting out the agar mound.
The adhesion force can then be extrapolated to the wetting perimeter of an entire worm using (8)
for menisci between a spherical and planar surface49
and its variant (9) for a cylinder on a planar
surface (derived in Appendix A).
(8)
(9)
Figure 9: Sample image of an adhesion force measurement. Anaesthetized worms are captured with suction with a micropipette, and lifted off the agar until only the tip of the head is in contact with the agar surface. Force is
recorded by imaging the pipette as it is slowly translated upwards at a constant speed.
In the worm lifting measurement, the air-liquid interface is oriented slightly more vertically and
the meniscus has a slightly larger area per wetting perimeter. This means that both terms in the
square brackets are larger in (8), leaving their difference to be approximately equal to that in (9).
As a result, the adhesion force can be roughly extrapolated using the ratio of wetting perimeters.

17
3.2.3 Liquid layer depth measurements
A cylindrical probe was fabricated with 0.01” (254 µm) diameter copper wire by forming a 3mm
straight segment with a loop at one end. The tip of the probe was smoothed with sandpaper and
a ceramic tile to reduce asperities to less than 5 microns. The probe was then hung on a
calibrated micropipette and slowly lowered onto the agar surface. Once the probe is wetted by
the liquid layer, surface tension pulls this probe in until it touches the agar surface. The depth of
the liquid layer can be inferred from the magnitude of sudden pipette displacement immediately
contact with the liquid.
3.2.4 Image acquisition and processing
Worm settling images and meniscus images for the adhesion force were taken with a Leica
M205 FA stereo microscope at 256x magnification. Forces in the adhesion force experiments
were extracted as previously from images recorded with a Manta G-125 CCD camera with a
90mm focal length tele lens. In behavioral experiments, the worm midline was found with an in-
house Delaunay triangulation algorithm and a cubic spline fit was used to obtain 100 evenly-
spaced body coordinates. Any velocities extracted from the midline were smoothed with a
Gaussian filter with =0.2s and =4% of body length to reduce imaging and skeletonization
noise.
3.2.5 Agar preparation and worm culture
Same as sections 2.2.2 and 2.2.7.
3.3 Results: channel formation
3.3.1 Channel formation occurs on worm movement timescales
From our measurements of worm settling (see Figure 10) we observed that in addition to sinking
to appreciable depths, worms sink slowly on timescales which are comparable to their
locomotive speed. On softer gels, the sinking time constants are ~1-3 seconds, which is similar
to the time a 1mm worm travelling at 0.3mm/s would spend on the same patch of crawling

18
substrate. Thus we note that to understand the channel's effect on local drag forces, it is
imperative to consider the dynamics of channel formation. In contrast, channels have previously
been observed32
and incorporated into models29
only statically. The "slow" evolution of the
channel profile will clearly produce differential effects along the worm's body and at varying
crawling speeds.
Figure 10: Characterizing the settling of worms into viscoelastic substrates. (A) Anaesthetized worms were dragged into the field of view with a micropipette and imaged horizontally. (B) On soft (1.0%) and standard (1.7%) agar gels, worms settle with time constants of several seconds. Dashed lines are fits using the model in (C). (C) To extract time constants, the time series were fitted with a model consisting of Maxwell and Kelvin-Voigt modules in
series.
In these settling experiments, it is reasonable to assume that during channel formation the worm
is deformed negligibly compared to agar. In the circumferential direction the elastic modulus
was estimated to be in the 10MPa range for C. elegans50
, while nanoindentation studies have
approximated E<2.5MPa for high-percentage agar and E<0.7MPa for the 1.7% agar typically
used for nematode culture51
. Some recent work52,53
found much smaller elastic moduli for C.
elegans, but these were measured for transverse bending.
3.3.2 Factors contributing to channel formation
The dynamics of channel formation are governed by adhesion forces pinning the worm to the
surface, worm geometry and the substrate viscosity. The adhesion force, comprised of a
downward-directed surface tension component and an upward-directed capillary component49
, is
experimentally found to increase with increasing agar concentration (Figure 11c). This agrees

19
with the intuition of Wallace27
who suggested that very thin liquid films pin nematodes to the
surface with large force. The trend can be confirmed with simple geometrical arguments (see
Appendix A for full derivation). The total adhesion force depends on the liquid layer depth and
thus the fill angle (see Figure 11a), and can be approximated as follows ( is the surface
tension and is the worm length):
(10)
The fill angle can be found by solving the following relationship, where is the worm radius,
is the channel depth, is the thickness of the liquid layer on the agar surface, and is
the minimum thickness of the lubrication layer under the worm:
(11)
Figure 11: Experimental and theoretical estimates of adhesion force acting on crawling nematodes. (A)
Schematic cross-section of a nematode sliding on a deformable surface. (B) To measure adhesion force, worms were aligned so that only the head tip contacts the liquid layer, and were slowly pulled off the agar while recording force on the lifting pipette. (C) Adhesion force measurements and theoretically estimated values from geometry in (A). (D) The initial sinking speed vs0 can be approximated by considering the adhesion force on the worm and the
substrate viscosity. Perfect estimates lie on the red line.

20
The liquid layer depth used for the fill angle calculations was measured on various agar
conditions, and is plotted below:
Figure 12: Liquid layer depth on the agar surface. A cylindrical probe was lowered onto the agar surface, and was
pulled down to the agar immediately after contact with the liquid layer. The sudden vertical displacement thus
measures liquid layer depth.
We can further validate the adhesion force measurements by calculating a feature of the channel
formation dynamics. Using Hertz contact theory extended to linear viscoelastic materials (see
Appendix B), the initial slope of the sinking curve can be roughly recovered (Figure 11d):
(12)
In the present case, adhesion forces vary over a single order of magnitude (Figure 11c), whereas
1% and 6% agar viscosities differ by about three (estimates in Appendix B). Considering the
form of (12), it then makes sense that in this case the substrate's mechanical behavior is the
dominant factor in channel formation.
3.4 Discussion: channel formation
Based on our observations of channel formation, we expect that as worms crawl slower they will
sink deeper into the agar and incise a larger channel (Figure 10). At slower speeds, the channel
profile should approach the circumference of the worm and thus on average decrease the
lubrication film thickness under the worm (Figure 13). Adopting a simple parallel plate shear

21
analogy used by Shen et al.29
for tangential drag, we can see that drag force between parallel
plates is inversely proportional to separation distance :
is the resulting tangential force per unit length of the worm, is the fluid shear stress on the
worm's cuticle, is the dynamic viscosity,
is the vertical gradient of fluid velocity, is the
tangential speed of an infinitesimal cross-sectional element, and is the height of the fluid layer
between the worm and the agar. According to (13) drag forces should be more affected by
channel formation at slow locomotion speeds (when is generally thinner) than at high speeds.
Figure 13: Mean lubrication layer thickness decreases with channel formation. As the channel forms, its profile approaches the circumference of the worm and thus decreases the lubrication film thickness under the worm.
To quantify the observed nonlinearities, force-velocity curves can be well fitted empirically
( >0.96) by power-law relationships of the form (see Figure 14). This can be
decomposed into a typical RFT-like linear component with slope and a modulation envelope in
which is the envelope normalization factor:
(14)
The envelope exponent can be interpreted as a nonlinearity index. When it is positive the
envelope function is monotonically decreasing and force curves are sublinear (as observed);
when it is negative the envelope is monotonically increasing and the force curves are supralinear;
(13)

22
and when it equals zero the envelope is unity and we recover a purely linear relationship. The
nonlinearity index is small on hard gels and increases for softer gels, and is generally larger for
normal than tangential drag (Table 1). This is consistent with our expectations that channel
formation would most affect normal drag on softer agar.
Figure 14: Quantifying nonlinearities in drag force curves. 1- (where is the scaling exponent) yields the
nonlinearity index for each data series. Thus, data with shallower slopes are less linear. Note that this is identical
to Figure 7 on a log-log scale.
1.0% 1.7% 4.0% 6.0%
Tangential 0.45 0.42 0.23 0.19
Normal 0.73 0.68 0.66 0.62
Agar concentration
Table 1: Summary of nonlinearity indices. An index of 0 would indicate a purely linear relationship. Greater absolute values signify larger deviations from linearity. Positive indices mean that curves are sublinear.
3.5 Channel formation does not explain response of drag forces to agar concentration
Following the parallel plate shear analogy, we would expect that a worm travelling at a given
speed on a softer substrate would sink deeper and thus experience higher drag forces than on a
stiffer substrate. Our measurements, however, show the opposite; clearly there is an element
missing in the parallel plate analysis. Over 50 years ago, Wallace noted that nematodes exhibit
less lateral slip on thinner films and hypothesized that this is due to higher drag forces in these
conditions27
. Considering only the linear portions of the tangential drag curves (recall that the
curves are linear at high velocities) where channel effects are minimal, we note a nearly inverse

23
relationship of observed force with liquid layer depth at each velocity (Figure 15). Note that the
inverse relationship here is with respect to which refers to the entire agar surface and not
which refers to the lubrication layer under the worm. To explore the potential nature of this
trend, we examined the flow patterns around crawling animals.
Figure 15: Tangential drag force depends on liquid layer depth. At each drag speed above 500μm/s, drag forces normalized to the 6% agar case form a nearly inverse relationship with liquid layer depth on the agar surface.
3.6 Methods: measuring shear gradients
3.6.1 Flow pattern tracking
Young adult C. elegans were placed on covered agar plates which were aired out identically to
preparation for drag measurements as described in section 2.2.4. Worms were then immersed in
2 µL of 1:1000 diluted fluorescent polystyrene beads 1 µm in diameter. After most of the drop
absorbed into the agar, worms were able to crawl out of the fluorescent bead patch onto fresh
agar. To minimize the effects of extra fluid in the fluorescent patch on the meniscus around
worms, images were recorded only after worms have crawled outside the patch for at least 1cm.
Images were captured under a Leica M205 FA stereo microscope at 75x magnification.
3.6.2 Agar preparation and worm culture
Same as sections 2.2.2 and 2.2.7.

24
3.7 Results & discussion: shear gradients
The tracking of fluorescent beads around crawling nematodes suggests that fluid is displaced at
longer distances away from the worm in environments where the liquid film is deeper (1% agar
condition in Figure 16). In contrast, on 4% and 6% agar which have very thin liquid layers, fluid
displacement seems to be limited to proximal vicinity around the worm. Particle speed depends
on the local body curvature, but on average the distance from the cuticle
of half-maximal
particle velocity is much higher on thicker fluid films. By allowing plates to evaporate for over
an hour, the flow patterns on 1% agar begin to look more like the 4% condition because of the
thinning liquid layer.
Figure 16: Tracking of flow patterns around crawling worms. On thicker fluid films, bead movement was dispersed along greater distances away from the cuticle. On thin fluid films, bead movement was constrained to
directly beside the worm.
We argue that the parallel plate model described in section 3.4 doesn't capture this effect because
the dissipation of a nematode's propulsive energy extends beyond the lubrication layer directly
below the cuticle. On gels with lower agar concentrations and with deeper liquid layers, fluid is
sheared up to larger distances away from the nematode. Hence, there are smaller shear gradients
in these conditions than on gels with higher agar concentrations and shallower liquid layers. To

25
incorporate the effect of shear gradients, we have to modify (13) to include a shear term arising
from horizontal gradients which was previously neglected:
In the new term above, is the height of the meniscus,
is the velocity gradient in the -
direction and the factor of 2 arises from the assumed lateral symmetry on the left and right sides
of the worm.
(15)

26
CHAPTER 4.
VALIDATION OF DRAG FORCE MEASUREMENTS IN CRAWLING SUBJECTS
4.1 Introduction
In the previous sections I have described measurements of tangential and normal drag forces
acting on a microscopic slender crawler. I showed that the drag coefficients are not constant on
thin film-covered viscoelastic surfaces, and have proposed physical mechanisms for their
variation. Here I will attempt to reconcile observations of C. elegans body shape with forces
recorded during crawling motions. According to resistive force theory, in the viscous regime it
should be possible to reconstruct forces produced by long undulating organisms based on the
movements of their body and drag coefficients of the medium. That is, given the tangential and
normal velocities of each body segment and a mapping of velocities to forces in a particular
medium, the forces should be predicted.
4.2 Methods
4.2.1 Micropipette construction and calibration
Same as section 2.2.1, except that L-shaped micropipettes were now calibrated for stiffness in
two dimensions: both parallel and perpendicular to the long capillary axis. Since the effective
cantilever length is larger for perpendicular displacement, this yielded spring constants which
were between 30-100% larger for parallel displacement. Typical values were around kpar=300-
400 and kperp=150-250 nN/μm.
4.2.2 Crawl force measurements
Unanaesthetized worms on agar plates were captured by the tail and held with constant light
suction by calibrated pipettes filled with M9 buffer. Force recordings were started immediately
after worms were dragged onto a new region of agar, and images were captured with a Manta G-
125 CCD camera with a 90mm focal length tele lens.

27
4.2.3 Reconstruction of forces from morphometry
The worm midline was found with an in-house Delaunay triangulation algorithm and a cubic
spline fit was used to obtain 100 evenly-spaced body segments . A body coordinate was
defined as the proportion of body length away from the head, so that
. Any velocities
extracted from the midline were smoothed with a Gaussian filter with =0.2s and =4% of
body length to reduce imaging and skeletonization noise. The tangential and normal velocities
and of each body coordinate at time were calculated using the segment velocities
and the angle of segment progression with respect to the worm midline tangent (Figure 17):
(16)
The segment velocities and angles were found using segment positions and the
inverse frame rate :
(17)
(18)
Figure 17: Decomposition of worm segment speeds into normal and tangential components.
Using the tangential and normal velocities extracted from recorded images, we reconstructed the
forces expected to act on each body segment using a modification of resistive force theory in

28
which the drag coefficients vary depending on speed. Instead of the constants appearing in (1),
the drag coefficients are now velocity-dependent.
(19)
The drag force-to-velocity mappings were taken from empirical fits for and of drag
force measurement data, as described in Section 3.4. Thus for each body segment, with being
the worm midline tangent.
(20)
(21)
The reconstruction was shifted by an additional phase parameter to account for the phase offset
between undulatory motion and the generated force. This phase lag develops for any system in a
resistive force medium, and depends both on the medium properties and locomotion
parameters54
. We note that this piecewise reconstruction assumes that the thickness of the
lubrication layer under the crawling worm is approximately equal throughout its length of its
body. This essentially averages the sinking depth across the entire worm, disregarding the
deeper settling of sections of the worm which have been on a patch of agar longer.
4.2.4 Reconstruction optimization
To improve the force prediction, reconstruction results were recursively fed into a custom
convex optimization algorithm based on MATLAB’s lsqcurvefit function. The algorithm
adjusted the shapes of force-velocity curves by tuning parameters , , and to minimize
the reconstruction error, defined as:
(22)
4.2.5 Agar preparation and worm culture.
Same as sections 2.2.2 and 2.2.7.

29
4.3 Results & discussion
4.3.1 Force reconstruction
In this section, we attempt to reconstruct the forces exerted by an undulating slender body given
the normal and tangential components of the velocities of each body segment, as well as the
velocity-to-force mapping. Recall that the force-velocity mapping is given by the empirical fits
described in section 3.4, which were of the form . Reconstruction of forces using these
values generally yielded good fits for lateral forces (Figure 18b, top panel). Propulsive force
fits were generally poor and typically underestimated the measured forces (Figure 18b, bottom
panel; note the negative vertical axis labels since force is generated in the direction). This
could make sense in light of the subjects in this assay being held in one spot and being prevented
from translating. By analyzing worm skeleton tracks (Figure 18c), we note that during
unrestricted locomotion, normal movement in the propulsive axis is always directed with the
worm’s wave speed (backwards). When a worm is held by its tail, however, it undulates on the
spot and we can thus expect normal movement to occur in both directions in the propulsive axis.
It is possible that this artifact of normal velocities in the (worm movement) direction causes
the propulsive force to be underestimated by naïve reconstruction.
Figure 18: Reconstruction of forces exerted by a nematode during crawling.(A) Schematic of crawl force
measurement and definition of normal and tangential velocity vectors. Worms were held by the tail, at s=1. (B)
Reconstruction of crawling forces from measured force-velocity relationships; n=1 is shown as an example. (C)
Worm skeleton tracks from freely-crawling worms. When a worm crawls freely, slip in the propulsive axis is
unidirectional. When a worm is held, however, normal movement in the propulsive axis is expected in both
directions.

30
Considering the errors in drag force measurements from Figure 7, we can estimate the expected
error on the reconstructed force. The errors in normal drag are approximately 5 µN in the 50-
100 µm/s range. Assuming that approximately 70% of this force depends on normal drag, we
can estimate 3-3.5 µN errors in the reconstruction. The measured and reconstructed propulsive
force mismatch typically peaks at 7 µN; thus, roughly half of the mismatch might be explained
by errors propagated through reconstruction calculations.
4.3.2 Optimization of drag coefficients to minimize error
To improve the performance of a system, we must typically know what its downfalls are.
However the converse approach can sometimes be helpful: if we can make a system perform
better, the chosen parameters might help elucidate its (dys)function. Hence to try to determine
whether one of the normal or tangential force-velocity mappings might be faulty, we optimized
the force reconstruction performed in the previous section. Assuming that drag force-velocity
curves will still follow a sublinear power-law relationship, we found the shapes of these curves
which yield the best match between estimated and recorded forces. Tangential drag coefficients
in C. elegans’ speed range were very close to measured values (Figure 19), and were most often
slightly underestimated compared to measured values. There was large variation in normal drag
coefficients, especially at speeds below 25 µm/s when they were often overestimated compared
to measured values. Above 100 µm/s, normal drag coefficients were consistently
underestimated, but these lie outside our range of interest because C. elegans segments rarely
move normally at these speeds.
Figure 19: Optimization of drag coefficients. Drag-velocity relationships were optimized to minimize the
discrepancy between observed and reconstructed crawl forces. Three samples of force-velocity relationships which minimized error between observed and estimated crawl forces in three different subjects.

31
Unfortunately, force reconstructions with optimized drag coefficients only improved slightly
over blind reconstruction with measured coefficients (not shown). Examination of the normal
and tangential velocity distributions in freely-crawling worms and worms held by the tail reveals
several potential sources of discrepancy. Compared to an uninhibited worm, the shape of the
tangential velocity distribution does not change considerably when a worm is held (Figure 20).
However, it is drastically shifted and becomes centered near zero which makes sense in a case
with no net translation. The shape of the normal velocity distribution varies considerably
between held and freely-crawling worms. When held in one spot, the distribution develops long
tails at higher normal velocities.
Figure 20: Distributions of normal and tangential velocities for freely-crawling and held worms. The shape of the tangential velocity distribution does not change considerably but is shifted when a worm is held. The normal
velocity distribution significantly spreads out at the tails.
When crawling forwards, a worm generates a somewhat sinusoidal propulsive force which is
never zero – so that the curve’s maximum is below zero (Figure 18b, lower panel). Because of
the oscillating waveform and the continuous restoring force imparted by the pipette cantilever
tip, there are alternating instances of the worm exerting more force on the pipette and the pipette
exerting more force on the worm. The pipette movement is impeded only by its spring constant
and negligible air resistance, so the worm is able to transfer all of its force when it pulls the
pipette. It is possible then that the pipette might not be able to transfer all of its restoring force to
the entire worm – the posterior sections might be affected differently from the anterior ones.
Hence the discrepancy might also be due to the measurement technique.

32
CHAPTER 5.
CONCLUDING REMARKS
5.1 Summary
An enormous number of living organisms are motile, and the limits of their motility are dictated
in large measure by the environment. Thus, the physics of the environment is an important
consideration when analyzing an animal’s behaviour. In the study of the molecular origins of
behaviour, the nematode C. elegans has emerged as a powerful model due its short life cycle and
genetic tractability. The study discussed in this thesis focuses on the interactions of C. elegans
with the environment it is most commonly observed in – the wet and soft stadium of agar plates.
The viscoelasticity of agar poses challenges to the mathematical modelling of the origin of drag
forces in this system. Resistive force theory, the de facto standard for the analysis of undulatory
locomotion, was developed in the 1960s for microscopic slender swimmers and for macroscopic
crawlers on solid surfaces. It predicts constant drag coefficients, meaning that forces are linearly
proportional to velocities of body segments, and has yet to be extended to crawling on soft
substrates. With empirical measurements of forces in the tangential and normal directions with
respect to the nematode axis, we found that viscoelasticity introduces nonlinearities in the force-
velocity relationships.
We also observed that the viscoelastic action of agar takes place slowly, on similar time scales to
worm movement. By analyzing the adhesion force imparted on the worm by the liquid film on
the agar’s surface and the dynamics of channel formation from the worm’s body sinking into the
agar, we have shown that drag coefficients in this system should be velocity-dependent. Channel
formation should increase forces at lower velocities more than at higher velocities, a trend which
was observed in the drag force measurements. To explain the increase of drag forces on gels
with higher agar concentration (when worms form shallower channels), we showed that in these
conditions the fluid film is thinner and there are higher horizontal shear gradients. The higher
shear gradients may account for the force increase seen at high agar concentrations.

33
Finally, we used the experimentally measured drag coefficients to reconstruct the forces exerted
by a crawling nematode. When compared to measurements (taken simultaneously) of forces
generated by the worm, we get excellent agreement for forces in the lateral direction. In the
propulsive direction, the reconstructed estimates underestimate the measured forces. The
reasons for this remain unclear, but potential causes for the discrepancy have been discussed.
5.2 Outstanding questions & new avenues of research
Several aspects of this work could be characterized mire rigorously. Firstly, we have managed to
explain drag force trends with channel formation and shear gradients but this argument is not
mathematically complete. Fluid mechanics-minded physicists are encouraged to incorporate
channel formation dynamics and the effect of surrounding liquid film into a hydrodynamic
theory to reproduce the drag curves experimentally obtained here. It would be immensely
helpful to obtain the dimensions of the lubrication layer under the worm. Unfortunately, since it
is sandwiched between a semi-translucent gel and a cylindrical body, and is on the order of the
diffraction limit of visible light, imaging it will be extremely difficult.
The evolution of channel profiles also needs to be more fully characterized using the adhesion
force and carefully measured substrate properties. It would be interesting to predict the
“nonlinearity index” exponent using mechanical and geometrical parameters of the system, and
this would also be useful for quickly estimating drag coefficients across a range of velocities.
The ultimate goal would be for the merging of the physics of environment, body biomechanics,
signal transduction dynamics and biochemical pathways into a complete bottom-up description
of a complex behaviour in a multicellular organism.
5.3 Outro
This work has shown that the time-dependence of crawling substrate mechanics leads to
velocity-dependent drag coefficients. With this generalization of the drag coefficients, it should
be possible to include viscoelastohydrodynamical systems into the expanding repertoire of
resistive force theories.

34
REFERENCES
1. Adler, J., Hazelbauer, G. L. & Dahl, M. M. Chemotaxis toward sugars in Escherichia coli. J.
Bacteriol. 115, 824–47 (1973).
2. Berg, H. C. Bacterial behaviour. Nature 254, 389–392 (1975).
3. Iwasaki, H. & Kondo, T. Circadian timing mechanism in the prokaryotic clock system of
cyanobacteria. J. Biol. Rhythms 19, 436–44 (2004).
4. Bell-Pedersen, D. et al. Circadian rhythms from multiple oscillators: lessons from diverse
organisms. Nat. Rev. Genet. 6, 544–556 (2005).
5. Saigusa, T., Tero, A., Nakagaki, T. & Kuramoto, Y. Amoebae anticipate periodic events. Phys.
Rev. Lett. 100, 018101 (2008).
6. Brenner, S. The genetics of Caenorhabditis elegans. Genetics 77, 71–94 (1974).
7. Stephens, G. J., Johnson-Kerner, B., Bialek, W. & Ryu, W. S. Dimensionality and dynamics in the
behavior of C. elegans. PLoS Comput. Biol. 4, e1000028 (2008).
8. Berman, R. S., Kenneth, O., Sznitman, J. & Leshansky, A. M. Undulatory locomotion of finite
filaments: lessons from Caenorhabditis elegans. New J. Phys. 15, (2013).
9. Purcell, E. M. Life at low Reynolds number. Am. J. Phys. 45, 3 (1977).
10. Ludwig, W. Zur theorie der flimmerbewegung. Z. Vgl. Physiol. 13, 397–504 (1930).
11. Lighthill, J. M. On the Squirming Motion of Nearly Spherical Defomable Bodies through Liquids
at Very Small Reynolds Numbers. Commun. Pure Appl. Math. 5, 109–118 (1952).
12. Taylor, G. The action of waving cylindrical tails in propelling microscopic organisms. Proc. R.
Soc. London, Ser. A 211, 225–239 (1952).
13. Taylor, G. Analysis of the Swimming of Long and Narrow Animals. Proc. R. Soc. A 214, 158–183
(1952).
14. Hancock, G. J. The self-propulsion of microscopic organisms through liquids. Proc. R. Soc.
London, Ser. A 217, 96–112 (1953).
15. Johnson, R. E. & Brokaw, C. J. Flagellar hydrodynamics: A comparison between resistive-force
theory and slender-body theory. Biophys. J. 25, 113–127 (1979).
16. Gray, J. & Lissmann, H. W. The Locomotion of Nematodes. J. Exp. Biol. 41, 135–54 (1964).
17. Gray, B. Y. J. & Hancock, G. J. The Propulsion of Sea-Urchin Spermatozoa. J. Exp. Biol. 32, 802–
814 (1955).
18. Guo, Z. V & Mahadevan, L. Limbless undulatory propulsion on land. Proc. Natl. Acad. Sci. U. S.
A. 105, 3179–84 (2008).

35
19. Hu, D. L., Nirody, J., Scott, T. & Shelley, M. J. The mechanics of slithering locomotion. Proc.
Natl. Acad. Sci. U. S. A. 106, 10081–5 (2009).
20. Maladen, R. D., Ding, Y., Li, C. & Goldman, D. I. Undulatory swimming in sand: subsurface
locomotion of the sandfish lizard. Science (80-. ). 325, 314–8 (2009).
21. Lighthill, J. Flagellar hydrodynamics. SIAM Rev. 18, 161–230 (1976).
22. Gray, J. The mechanism of locomotion in snakes. J. Exp. Biol. 23, 101–123 (1946).
23. Gray, J. & Lissmann, H. W. The kinetics of the locomotion of the grass-snake. J. Exp. Biol. 26,
354–367 (1950).
24. Li, C., Zhang, T. & Goldman, D. I. A terradynamics of legged locomotion on granular media.
Science (80-. ). 339, 1408–12 (2013).
25. Gravish, N., Umbanhowar, P. B. & Goldman, D. I. Force and flow at the onset of drag in plowed
granular media. Phys. Rev. E 89, 042202 (2014).
26. Dorgan, K. M., Law, C. J. & Rouse, G. W. Meandering worms: mechanics of undulatory
burrowing in muds. Proc. R. Soc. London, Ser. B 280, (2013).
27. Wallace, H. R. Movement of Eelworms: I. The influenece of pore size and moisture content of the
soil on the migration of larvae of the beet eelworm. Ann. Appl. Biol. 46, 74–85 (1958).
28. Wallace, H. R. Movement of Eelworms: V. Observations on Aphelenchoides ritzema-bosi on
florists’ chrysanthemums. Ann. Appl. Biol. 47, 350–360 (1959).
29. Shen, X. N., Sznitman, J., Krajacic, P., Lamitina, T. & Arratia, P. E. Undulatory locomotion of
Caenorhabditis elegans on wet surfaces. Biophys. J. 102, 2772–81 (2012).
30. Sauvage, P. et al. An elasto-hydrodynamical model of friction for the locomotion of
Caenorhabditis elegans. J. Biomech. 44, 1117–22 (2011).
31. Wallace, H. R. Wave formation by infective larvae of the plant parasitic nematode Meloidogyne
javanica. Nematologica 15, 65–75 (1969).
32. Wallace, H. R. The movement of eelworms in water films. Ann. Appl. Biol. 47, 366–370 (1959).
33. Sznitman, J., Shen, X., Sznitman, R. & Arratia, P. E. Propulsive force measurements and flow
behavior of undulatory swimmers at low Reynolds number. Phys. Fluids 22, 121901 (2010).
34. Karbowski, J. et al. Conservation rules, their breakdown, and optimality in Caenorhabditis
sinusoidal locomotion. J. Theor. Biol. 242, 652–69 (2006).
35. Niebur, E. & Erdös, P. Theory of the locomotion of nematodes. Biophys. J. 60, 1132–1146 (1991).
36. Fang-Yen, C. et al. Biomechanical analysis of gait adaptation in the nematode Caenorhabditis
elegans. Proc. Natl. Acad. Sci. U. S. A. 107, 20323–8 (2010).
37. Binnig, G., Quate, C. F. & Gerber, C. Atomic force microscope. Phys. Rev. Lett. 56, 930–934
(1986).

36
38. Pandya, H. J., Kim, H. T., Roy, R. & Desai, J. P. MEMS based low cost piezoresistive
microcantilever force sensor and sensor module. Mater. Sci. Semicond. Process. 19, 163–173
(2014).
39. Petzold, B. C., Park, S.-J., Mazzochette, E. a, Goodman, M. B. & Pruitt, B. L. MEMS-based force-
clamp analysis of the role of body stiffness in C. elegans touch sensation. Integr. Biol. Quant.
Biosci. from Nano to Macro 5, 853–64 (2013).
40. Colbert, M.-J., Brochard-Wyart, F., Fradin, C. & Dalnoki-Veress, K. Squeezing and detachment of
living cells. Biophys. J. 99, 3555–62 (2010).
41. Sawin, E. R., Ranganathan, R. & Horvitz, H. R. C . elegans locomotory rate is modulated by the
environment through a dopaminergic pathway and by experience through a serotonergic pathway.
Neuron 26, 619–631 (2000).
42. Martin, V. M., Johnson, J. R., Haynes, L. P., Barclay, J. W. & Burgoyne, R. D. Identification of
key structural elements for neuronal calcium sensor-1 function in the regulation of the
temperature-dependency of locomotion in C. elegans. Mol. Brain 6, 39 (2013).
43. Omura, D. T., Clark, D. a, Samuel, A. D. T. & Horvitz, H. R. Dopamine signaling is essential for
precise rates of locomotion by C. elegans. PLoS One 7, e38649 (2012).
44. Park, S. et al. Enhanced Caenorhabditis elegans locomotion in a structured microfluidic
environment. PLoS One 3, e2550 (2008).
45. Jung, S. Caenorhabditis elegans swimming in a saturated particulate system. Phys. Fluids 22,
031903 (2010).
46. Mohammadi, A., Byrne Rodgers, J., Kotera, I. & Ryu, W. S. Behavioral response of
Caenorhabditis elegans to localized thermal stimuli. BMC Neurosci. 14, 66 (2013).
47. Schulman, R. D., Backholm, M., Ryu, W. S. & Dalnoki-Veress, K. Dynamic force patterns of a
microswimmer. Prep. (2014).
48. Gray, J. Undulatory Propulsion. Q. J. Microsc. Sci. 94, 551–578 (1953).
49. Orr, F. M., Scriven, L. E. & Rivas, A. P. Pendular rings between solids: meniscus properties and
capillary force. J. Fluid Mech. 67, 723–742 (1975).
50. Petzold, B. C. et al. Caenorhabditis elegans body mechanics are regulated by body wall muscle
tone. Biophys. J. 100, 1977–85 (2011).
51. Nayar, V. T., Weiland, J. D., Nelson, C. S. & Hodge, A. M. Elastic and viscoelastic
characterization of agar. J. Mech. Behav. Bomedical Mater. 7, 60–8 (2012).
52. Backholm, M., Ryu, W. S. & Dalnoki-Veress, K. Viscoelastic properties of the nematode
Caenorhabditis elegans, a self-similar, shear-thinning worm. Proc. Natl. Acad. Sci. U. S. A. 110,
4528–33 (2013).
53. Sznitman, J., Purohit, P. K., Krajacic, P., Lamitina, T. & Arratia, P. E. Material properties of
Caenorhabditis elegans swimming at low Reynolds number. Biophys. J. 98, 617–26 (2010).
37
54. Ding, Y., Sharpe, S. S., Wiesenfeld, K. & Goldman, D. I. Emergence of the advancing
neuromechanical phase in a resistive force dominated medium. Proc. Natl. Acad. Sci. U. S. A. 110,
10123–8 (2013).
55. Johnson, K. L. Contact Mechanics. 184–96 (Cambridge University Press, 1985).
56. Herbert, E. G., Oliver, W. C., Lumsdaine, A. & Pharr, G. M. Measuring the constitutive behavior
of viscoelastic solids in the time and frequency domain using flat punch nanoindentation. J. Mater.
Res. 24, 626–37 (2009).
57. Lee, E. H. & Radok, J. R. M. The contact problem for viscoelastic bodies. J. Appl. Mech. 27, 438–
444 (1960).
58. Padday, J. F., Pitt, A. R. & Pashley, R. M. Menisci at a free liquid surface: surface tension from
the maximum pull on a rod. J. Chem. Soc. Faraday Trans. 1 71, 1919–1931 (1975).

38
APPENDIX A.
DERIVATION OF ADHESION FORCE RELATIONSHIP
The meniscus force pinning the worm to the agar surface is comprised of two parts - the surface
tension force which acts to minimize the surface energy of the worm/liquid/air interface and the
capillary force which acts to minimize meniscus curvature. Note that both forces act through the
wetting perimeter, and the capillary force is directed against surface tension. Surface tension's
vertical contribution for the entire worm is simply given by:
where σ is the liquid's surface tension and 2L the wetting perimeter.
Figure A1: Schematic cross-section of a nematode sliding on a deformable surface.
The capillary force is directed normally to the surface, and thus its vertical components cancel
inside ±xm. Thus, for the vertical contribution per unit length we integrate along the x-axis of the
meniscus and use the substitution . is the meniscus radius, and is the Laplace
pressure for a cylinder.
39
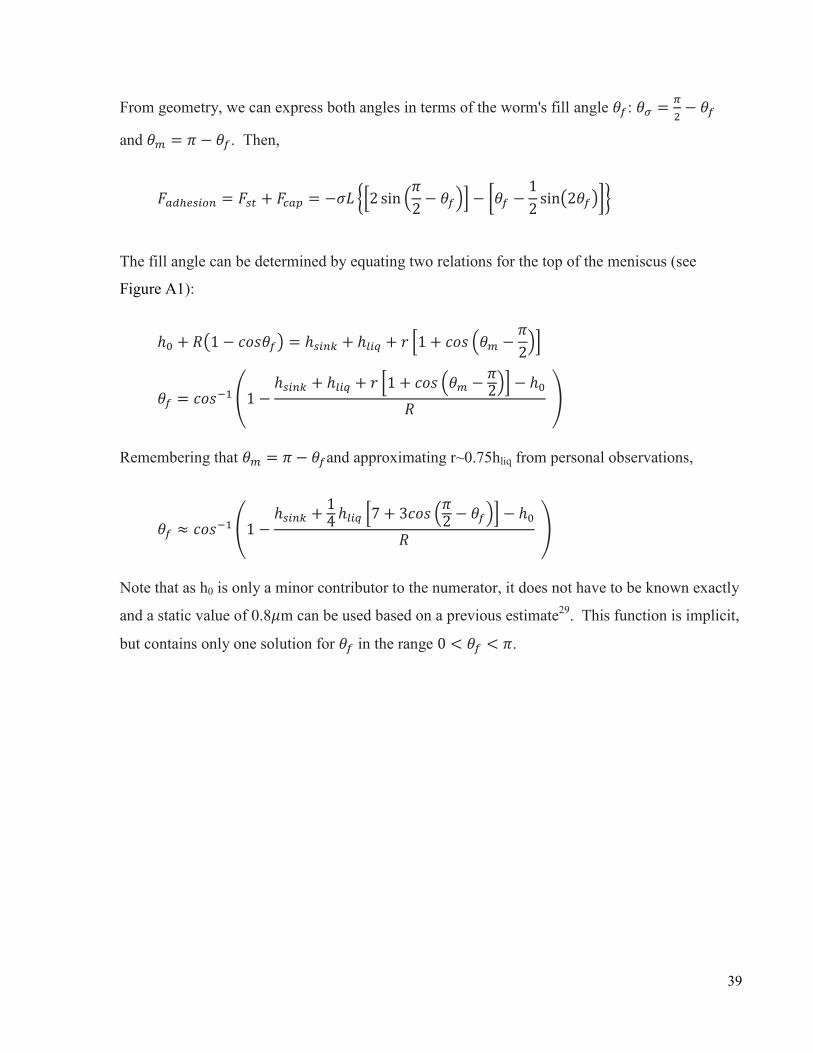
From geometry, we can express both angles in terms of the worm's fill angle :
and . Then,
The fill angle can be determined by equating two relations for the top of the meniscus (see
Figure A1):
Remembering that and approximating r~0.75hliq from personal observations,
Note that as h0 is only a minor contributor to the numerator, it does not have to be known exactly
and a static value of 0.8 m can be used based on a previous estimate29
. This function is implicit,
but contains only one solution for in the range .

40
APPENDIX B.
DERIVATION OF INITIAL SETTLING SPEED DURING CHANNEL FORMATION
Following L.K. Johnson's discussion on indentation of linear viscoelastic materials, we start with
the relationship for the contact radius of a cylindrical body on a purely elastic half-plane55
:
Here, is the composite elastic modulus of the two contacting bodies, F is the initial contact
force per unit length and R is the worm radius. We also assume that the cylindrical body is
perfectly rigid compared to the plane, and the agar half-plane is incompressible as previously
shown56
. The composite modulus is related to the agar's elastic modulus as
. Then,
To apply this relationship to a viscoelastic material, Lee & Radok showed that it is possible to
replace the inverse shear modulus
with an integral creep compliance operator
57. The creep
compliance function for the viscoelastic material model (depicted in Figure B1) fitting our
sinking data is
. and are the agar's storage and loss
moduli, respectively.
Figure B1: Viscoelastic model for agar indentation. This Maxwell model in series with a Kelvin-Voigt model is the minimal representation of a linear viscoelastic material with realistic creep characteristics (no jump discontinuities)
at small strains.

41
Implementing the integral operator,
For congruency with Johnson’s notation, we replace the elastic moduli with their respective
mechanical resistances
and
. Treating the force as constant in the small initial
portion of the sinking curve,
For a cylinder,
. Thus,
In the last equation, we used the relationship
for a spring-damper system. This gives us a
metric which can be used to estimate the initial channel formation dynamics with initial sinking
speed . It should be noted that to theoretically estimate the initial sinking speed, we used
previously published loss modulus values51
and time constants extracted from worm sinking
observations. Clearly, it isn't very useful to need information about channel formation time-
series before calculating its slope, but this calculation can also be carried out if the substrate
viscosity is available.

42
APPENDIX C.
NOTES ON METHOD DEVELOPMENT: AVOIDING PITFALLS
C.1 Agar preparation & plate drying
If experiments are performed with open agar plates, one must be very careful to minimize
evaporation throughout the experiment. As shown in section 3.3.2, the thickness of the water
layer on the agar surface plays a pivotal role in the adhesion forces, channel formation, and thus
ultimately the drag forces experienced by crawling nematodes. Evaporation, as measured by
mass of water loss, is approximately exponential. Hence, as evaporation will be quickest at the
very beginning of a plate's exposure to air, systematically pre-drying a plate will reduce the
evaporation throughout the experiment. In our experiments, we noted the percentage water loss
for each plate and checked that the liquid layer thickness does not change substantially with this
amount of water loss.
C.2 Drag force measurements
When measuring drag forces at constant velocity, one must be certain that the worm is dragged
for at least one body length (to pull it out of any groove which may have formed) before each
measurement. Note also that pipette height needs to be checked manually every centimeter of
drag length to accommodate minute local surface imperfections.
C.3 Surface tension measurements
We attempted to measure surface tension with the cylindrical probe described in section 3.2.3.
This probe was hung on a calibrated micropipette which measured the adhesive force due to
surface tension as the probe was pulled out of a liquid. Theoretically, a significant advantage of
this method over other mechanical probing methods such as Wilhelmy plates and du Noüy rings
is that its measurement is taken when the probe is above the liquid surface; hence, one need not
correct for buoyant force effects58
. Additionally, maximum force is exerted when the meniscus-
probe contact interface is vertical. In this case, calculations reduce dramatically to a simple
relationship ( is the liquid’s surface tension and is the cylindrical probe radius):

43
This method, although accurate to within 2% for bulk liquids, was unfortunately unsuitable for
the agar measurement. It appears that the probe significantly interacts with the gel matrix via the
liquid layer, and measures surface tension values 3-4 times those of water. Imaging the probe-
liquid interface, I was able to confirm that NGM is displaced upon breaking the meniscus around
the probe. The effect is subtle in the image below, but evident nonetheless.
Figure C1: Shortcomings of probing thin liquid layer surface tension with a cylindrical probe. In the du Noüy-Padday method for measuring surface tension, the probe interacts with agar. Immediately before the probe lifts off the agar surface, the agar is seen to stretch vertically (left panel) and relax again after the probe is released.
C.4 Imaging flow patterns around crawling worms
Initially, we attempted to seed an agar plate with fluorescent beads prior to placing a worm on
the plate. The 1μm beads used in the experiment (described in section 3.6.1), however, were
found to settle into the agar and not be mobile when the worm crawls over them. These beads
likely settle rapidly and get trapped in the agar surface unless they are caught in the moving
meniscus around the worm. 0.1 μm beads also settled into the agar, but noticeably slower. The
best images were obtained when a drop of diluted fluorescent beads was placed on top of the
worm. Some beads then settled into the meniscus around the worm and remained around the
worm long enough (several minutes) to image flow patterns once the worm crawled out of the
fluorescent bead drop. Note that flow pattern tracking on gels with high agar concentrations
(>3%) should ideally be done with beads 0.5 μm in diameter or smaller. This will ensure that the
beads move freely in the liquid layer, which should be less than 3 μm thick in these conditions.