dipartimento di scienze chimiche - core · dipartimento di scienze chimiche scuola di dottorato di...
TRANSCRIPT
Sede Amministrativa: Università degli Studi di Padova
Dipartimento di Scienze Chimiche
SCUOLA DI DOTTORATO DI RICERCA IN : Studio e Conservazione dei Beni Archeologici e Architettonici
INDIRIZZO: Scienze e Tecnologie per i Beni Archeologici e
CICLO XXV
Dosimetric dating techniques applied to desert preh istoric pottery
Direttore della Scuola : Ch.mo Prof. Giovanni Leonardi
Coordinatore d’indirizzo: Ch.mo Prof. Giuseppe Salemi
Supervisore : Ch.mo Prof. Renzo Bertoncello
Co-supervisore : Ch.ma Prof.sa Marina Brustolon
Sede Amministrativa: Università degli Studi di Padova
SCUOLA DI DOTTORATO DI RICERCA IN : Studio e Conservazione dei Beni Archeologici e Architettonici
INDIRIZZO: Scienze e Tecnologie per i Beni Archeologici e Architettonici
Dosimetric dating techniques applied to desert preh istoric pottery
Ch.mo Prof. Giovanni Leonardi
Ch.mo Prof. Giuseppe Salemi
: Ch.mo Prof. Renzo Bertoncello
: Ch.ma Prof.sa Marina Brustolon
Dottorand o: Claudia Bortolussi
SCUOLA DI DOTTORATO DI RICERCA IN : Studio e Conservazione dei Beni Archeologici e Architettonici
Dosimetric dating techniques applied to desert preh istoric pottery
o: Claudia Bortolussi

Dosimetric dating techniques applied to desert prehistoric pottery
Claudia Bortolussi Ph.D. Thesis – University of Padova Printed in Padova – January 2013


ContentsSummary (English) 1Summary (Italiano) 2Introdu tion 51 Overview of The Radiation E�e t Dating Te hniques 111.1 Radiation e�e t dating . . . . . . . . . . . . . . . . . . . . . . 131.1.1 Radioa tive de ay: the physi al basis for dating . . . . 131.1.2 Radioa tivity and dating of ar haeologi al �ndings . . 182 Lumines en e and EPR Dating 212.1 Defe ts . . . . . . . . . . . . . . . . . . . . . . . . . . . . . . 222.1.1 Lifetime of defe ts . . . . . . . . . . . . . . . . . . . . 242.2 Age equation . . . . . . . . . . . . . . . . . . . . . . . . . . . 252.3 Pre ision and a ura y . . . . . . . . . . . . . . . . . . . . . . 272.4 Assumptions . . . . . . . . . . . . . . . . . . . . . . . . . . . 282.5 Quartz . . . . . . . . . . . . . . . . . . . . . . . . . . . . . . 292.5.1 TL emission spe tra . . . . . . . . . . . . . . . . . . . 302.5.2 OSL emission spe tra . . . . . . . . . . . . . . . . . . . 322.5.3 EPR spe tra . . . . . . . . . . . . . . . . . . . . . . . . 333 Methods in Lumines en e and EPR dating 373.1 Equivalent dose determination methods . . . . . . . . . . . . . 373.1.1 Multiple Aliquot Additive Dose (MAAD) . . . . . . . 373.1.2 Single Aliquot Regenerative Dose Proto ol (SAR) . . . 383.2 Thermolumines en e (TL) . . . . . . . . . . . . . . . . . . . . 403.2.1 Fine grain and Quartz in lusion te hniques . . . . . . 403.3 Opti ally Stimulated Lumines en e (OSL) . . . . . . . . . . . 41i
ii CONTENTS3.3.1 Prin iples of OSL dating . . . . . . . . . . . . . . . . 413.3.2 OSL of heated materials . . . . . . . . . . . . . . . . . 423.4 Ele tron Paramagneti Resonan e (EPR) . . . . . . . . . . . . 433.4.1 EPR dating . . . . . . . . . . . . . . . . . . . . . . . . 433.4.2 Prin iples of EPR . . . . . . . . . . . . . . . . . . . . . 443.4.3 CWEPR and E ho Dete ted EPR . . . . . . . . . . . . 453.5 Annual dose . . . . . . . . . . . . . . . . . . . . . . . . . . . . 483.5.1 E�e t of moisture . . . . . . . . . . . . . . . . . . . . . 493.5.2 Radioisotopes ontribution . . . . . . . . . . . . . . . . 494 Pottery in ar haeology 514.1 The role of pottery in ar haeology . . . . . . . . . . . . . . . . 514.2 Origin of pottery . . . . . . . . . . . . . . . . . . . . . . . . . 534.3 Dating pottery . . . . . . . . . . . . . . . . . . . . . . . . . . 555 The El Salha Ar haeologi al Proje t: res ue ex avation in entral Sudan 595.1 A tual environment and palaeoenvironment along the WhiteNile . . . . . . . . . . . . . . . . . . . . . . . . . . . . . . . . 625.1.1 El Salha . . . . . . . . . . . . . . . . . . . . . . . . . . 645.2 The ex avation at site 16-D-5, Al Khiday 1 . . . . . . . . . . . 655.2.1 Pottery assemblages at 16-D-5 . . . . . . . . . . . . . . 666 Materials and Methods 696.1 Des ription of the samples . . . . . . . . . . . . . . . . . . . . 696.2 Annual dose determination . . . . . . . . . . . . . . . . . . . . 736.3 Samples preparation . . . . . . . . . . . . . . . . . . . . . . . 736.3.1 Fine grain . . . . . . . . . . . . . . . . . . . . . . . . . 736.3.2 EPR . . . . . . . . . . . . . . . . . . . . . . . . . . . . 736.3.3 Quartz separation . . . . . . . . . . . . . . . . . . . . . 746.4 TL measurements and arti� ial irradiation . . . . . . . . . . . 746.5 OSL measurements . . . . . . . . . . . . . . . . . . . . . . . . 756.6 EPR measurements . . . . . . . . . . . . . . . . . . . . . . . . 766.7 XRF analysis . . . . . . . . . . . . . . . . . . . . . . . . . . . 787 Results and dis ussion 797.1 Annual doses . . . . . . . . . . . . . . . . . . . . . . . . . . . 797.2 TL . . . . . . . . . . . . . . . . . . . . . . . . . . . . . . . . . 797.2.1 TL MAAD . . . . . . . . . . . . . . . . . . . . . . . . 797.2.2 TL SAR . . . . . . . . . . . . . . . . . . . . . . . . . . 807.3 OSL . . . . . . . . . . . . . . . . . . . . . . . . . . . . . . . . 83
CONTENTS iii7.4 Comparison between lumines en e ages . . . . . . . . . . . . . 857.5 Petrographi analysis . . . . . . . . . . . . . . . . . . . . . . . 887.5.1 Opti al Mi ros opy . . . . . . . . . . . . . . . . . . . . 887.5.2 Digital Image Analysis (DIA) . . . . . . . . . . . . . . 967.6 EPR . . . . . . . . . . . . . . . . . . . . . . . . . . . . . . . . 1027.6.1 CWEPR . . . . . . . . . . . . . . . . . . . . . . . . . . 1027.6.2 E ho Dete ted EPR . . . . . . . . . . . . . . . . . . . 1047.7 Comparison between EDEPR spe tra and petrographi analysis1077.8 Quartz extra ted from pottery matrix . . . . . . . . . . . . . . 1108 Con lusions 115

iv CONTENTS
Summary (English)Ar haeologi al sites in arid and semi-arid environments have mostly su�eredfrom strong erosion that results in the removal of the anthropi deposits in- orporating artifa ts produ ed and dis arded by human beings. Artifa ts,after this pro ess, a umulate on the surfa e representing the only witnessof human a tivities. The prin ipal issue for an ar haeologist, in this ontext,is establishing whi h moment in the past these artifa ts had been produ edby human beings to be able, afterwards, to try inferring on more generalaspe ts of the e onomi and so ial sphere. Thermolumines en e has beenused in di�erent o asions in Saharan Afri a for dating fragments of pot-tery found in surfa e ontexts, disturbed ones or where nothing else ouldbe used to apply the more ommon radio arbon dating te hnique. The re-sults have always been highly debated as they usual appeared in ongruentand problems inherent to the thermolumines en e te hnique itself not en-tirely ta kled. It seemed, for this reason, appropriate to resume work on thiste hnique as well as to ompare di�erent proto ols (Multiple Aliquot Ad-ditive Dose, MAAD and Single Aliquot Regenerative dose, SAR) of datingte hniques for the measurement of prehistori pottery oming from a desertenvironment. These methods are based on the a umulation of harges in thedefe ts present in rystals of some minerals, like quartz, as a onsequen e ofthe natural radioa tivity. The number of defe t enters depends on the timeelapsed from the starting moment of the irradiation, thus the radiation doseabsorbed by the materials is dire tly proportional to the age of the potsherd.The te hniques of lumines en e (TL: Thermolumines en e, OSL: Opti allyStimulated Lumines en e) and of EPR spe trometry (Ele tron Paramagneti Resonan e) are methods of dosimetri dating and have been applied in thiswork with di�erent aims. In the ase of lumines en e, the goal was to sele ta proto ol in order to obtain the highest pre ision. In fa t, the dating of pre-histori pottery by lumines en e is generally a�e ted by a substantial error1
2 Summary (English)if ompared to other methods. On the other hand, while the radio arbonte hnique is more pre ise but appli able only to the organi material foundtogether with the potsherd, the lumines en e analyzes the intrinsi har-a teristi s of the material. Moreover, the majority of the potsherds foundin desert environments undergo erosive pro esses that irreparably alter thestratigraphy. In these situations where it is not possible to olle t informa-tion about the relative hronology, the dating by lumines en e allows a �rst hronologi al framework. For this reason the resear h work was fo used onthe optimization of the experimental proto ols to redu e the error asso iatedto the results. In the ase of EPR spe trometry, the goal was to evaluate itspotential as a method for dating re ent materials as pottery. EPR spe trom-etry is in fa t widely used in geology and palaeontology, but its appli ationin ar haeology is still experimental. An important advantage of EPR is therepeatability of the measurements, be ause the spe trum a quisition doesnot reset the signal as o urs in the lumines en e pro edure. The employ ofthe pulsed te hnique (E hoEPR) allowed isolating the signals of the defe tsindu ed by the irradiation that are not visible with the traditional methodof ontinuous wave (CWEPR) due to the strong signal of iron present in allpotsherds. The study is also supported by a petrographi hara terization ofthe materials, with parti ular attention for in lusion grain size, a parameterthat was demonstrated to be ru ial for the dosimetry.The potsherds analyzed for this proje t were sele ted on the basis of theirprovenan e from an undisturbed stratigraphy, as well as for the simple e-rami fabri s. They have a limited typology of in lusions, thus minimizingvariables whi h ould negatively in�uen e dosimetri studies. Samples omefrom the 16D5 site at Al Khiday (Omdurman, entral Sudan), ex avatedby the Italian ar haeologi al mission dire ted by D. Usai and o-dire tedby S. Salvatori (Centro Studi Sudanesi e Sub-Sahariani and Istituto Ital-iano per l'Afri a e l'Oriente). The site presents a rare ase in a semi-desertenvironment of a preserved stratigraphy. The sele ted samples ome fromradio arbon dated stratigraphi units, whose determinations are a ne essaryreferen e for the omparison with the experimental results. Moreover, thehigh quartz ontent hara terizing these potsherds is a suitable feature forapplying dosimetri dating te hniques.The lumines en e dating was performed at the Ar haeometry Laboratoryat the Department of Material S ien es of the University of Milan Bi o a;the study by EPR spe tros opy and the petrographi analysis at the Uni-versity of Padua, at the Departments of Chemi al S ien es and Geos ien esrespe tively.
Summary (Italiano)I siti ar heologi i in ambienti aridi e semi-aridi sono soggetti ad una forteerosione he omporta la rimozione dei depositi antropi i in ui si trovanoi manufatti prodotti e s artati dall'uomo. I reperti si trovano per iò in su-per� ie, privi di stratigra�a, ome uni a testimonianza dell'attività umana.In questo ontesto, la questione prin ipale he un ar heologo deve a�rontareè stabilire in quale momento del passato tali manufatti siano stati prodotti,per poter poi essere in grado di ri avare informazioni generali legate alla sferae onomi a e so iale. In diverse o asioni si è ri orsi alla termolumines enzaper la datazione di materiali provenienti dall'Afri a sahariana. Si tratta di erami a rinvenuta in super� ie, in ontesti disturbati o in assenza di on-dizioni ideali per l'impiego di altre te ni he, ome la più omune datazioneal radio arbonio. I risultati sono sempre stati molto dis ussi e spesso on-siderati in ongruenti, ma le problemati he relative alla te ni a non sono statea�rontate pienamente. Per questo motivo si è onsiderato di primaria im-portanza approfondire le temati he legate a questa te ni a, in parti olare on il onfronto di diversi proto olli di misura (Multiple Aliquot AdditiveDose, MAAD e Single Aliquot Regenerative dose, SAR) on diversi metodidosimetri i �nalizzati alla datazione di erami a preistori a proveniente daambiente deserti o. Questi metodi si basano sull'a umulo di ari he neidifetti presenti nei ristalli di al uni minerali ( ome ad esempio il quarzo)per e�etto della radioattività naturale. Il numero dei entri difettivi dipendedal tempo tras orso dall'inizio dell'irraggiamento, per iò la dose di radiazioneassorbita dai materiali è direttamente proporzionale all'età del reperto era-mi o. Le te ni he di lumines enza (TL: Thermolumines en e, OSL: Opti allyStimulated Lumines en e) e la spettros opia EPR (Ele tron Paramagneti Resonan e) sono metodi di datazione dosimetri a e sono qui impiegati ondiversi s opi. Nel aso della lumines enza, si tratta di individuare un pro-to ollo di misura he onsenta di ottenere la maggiore pre isione possibile.3

4 Summary (Italiano)Infatti, la datazione di materiale erami o preistori o mediante lumines enzaè a�etta in genere da un elevato errore rispetto ad altri metodi. Tuttavia,rispetto alla te ni a del radio arbonio he è più pre isa, ma appli abile solo asostanze organi he trovate in asso iazione al reperto, analizza aratteristi heintrinse he del materiale. Inoltre, i materiali rinvenuti in ambiente deserti osono nella maggior parte a�etti da pro essi erosivi he disturbano irrimedia-bilmente la stratigra�a. In tali situazioni di man anza di aratteri utili alla ostruzione di ronologie relative, la datazione on le te ni he di lumines enzafornis e un primo inquadramento ronologi o. Per questo motivo il lavoro diri er a mira all'ottimizzazione dei proto olli sperimentali per ridurre l'erroreasso iato alle datazioni. Nel aso della spettros opia EPR, inve e, l'obiettivoè quello di valutarne le potenzialità appli ative per la datazione di un ma-teriale re ente ome la erami a. La spettros opia EPR è utilizzata ampia-mente in ampo geologi o e paleontologi o, ma è an ora in fase sperimentalein ar heologia. Un vantaggio notevole dell'EPR è la ripetibilità della misura,poi hè l'a quisizione dello spettro non omporta la an ellazione del segnale, he inve e viene azzerato dalla pro edura di datazione on la lumines enza.L'impiego della te ni a impulsata (E hoEPR) ha permesso di isolare i se-gnali dei difetti indotti da irraggiamento, he on il metodo tradizionalein onda ontinua (CWEPR) non sono visibili a ausa del forte segnale delferro ontenuto in tutte le erami he. Lo studio è an he supportato da una aratterizzazione petrogra� a dei materiali, on parti olare attenzione per lagranulometria degli in lusi, he si è rivelata un parametro importante per lostudio dosimetri o.Le erami he analizzate in questo progetto sono state selezionate perl'appartenenza ad una serie stratigra� a non disturbata, non hè per la sem-pli ità degli impasti. Questi infatti hanno un numero molto limitato di tipolo-gie di in lusi, minimizzando eventuali variabili he in�uis ono negativamentesullo studio dosimetri o. I materiali erami i provengono dal sito 16D5 diAl Khiday (Omdurman, Sudan entrale), s avato dalla missione ar heolog-i a italiana diretta dalla dott.sa D. Usai e o-diretta dal dott. S. Salvatori(Centro Studi Sudanesi e Sub-Sahariani ed Istituto Italiano per l'Afri a el'Oriente). Il sito rappresenta un raro aso di stratigra�a preservata in am-biente deserti o. I materiali qui analizzati provengono da unità stratigra� hedatate al radio arbonio, le ui età rappresentano un ne essario ed assolutoriferimento per il onfronto dei risultati sperimentali. Inoltre, l'elevato on-tenuto in quarzo he aratterizza questi ampioni li rende parti olarmenteadatti per testare le te ni he di datazione dosimetri a.La datazione on le te ni he di lumines enza è stata realizzata pressoil laboratorio di Ar heometria del Dipartimento di S ienze dei Materialidell'Università di Milano Bi o a; lo studio on Risonanza di Spin Elettroni o

5e la aratterizzazione petrogra� a presso l'Università di Padova rispettiva-mente nei dipartimenti di S ienze Chimi he e Geos ienze.

6 Summary (Italiano)
Introdu tionThe �eld of ar haeologi al resear h on erns the knowledge of human pastthrough the study of materials and ultural remains. An ar haeologi al ex- avation should be generally undertaken after surfa e �eld survey and pre-liminary studies of the area that allow for the sele tion of the most promisingsite, being it a settlement, a emetery or lo i intended for spe i� a tivities.For the most part, ar haeologi al sites are made by superimposed layers tes-tifying ea h one a spe i� moment in time with the lower deposited �rstand those overlying in losely related hronologi al relationship. However,either human or natural post-depositional pro esses an mix or a�e t theexpe ted sequen e of stratigraphy. This is a ommon situation in the desert,where the traditional ar haeologi al pra ti es not always an be performed.Regions hara terized by desert lands ape at the present time, underwentstrong limati hanges in the past. The ar haeologi al re ord is now foundin a ontext very di�erent from the one of its formation and environmentalevents as well as animal and anthropi disturban es in�uen e its survival andthe general burial onditions. A good understanding of site formation pro- esses is ne essary in order to lay at deliberate or a idental human a tivitiesor at natural phenomena ea h spe i� ar haeologi al ontext. The strati�- ation whi h in general provides a relative hronologi al sequen e is rare inareas a�e ted by strong wind and water erosion and with in oherent sedi-ments as sand. Detailed surfa e survey and systemati sampling are used todeal with the generally poor preservation of sites due to anthropi or naturaldisturban es. Sampling enables the evaluation of the ar haeologi al potentialof a site but it is di� ult to understand the signi� an e of these artefa tswithout knowing their orrelation to human a tivities and natural eventsand their hronologi al setting. Test tren hes are usually performed in orderto understand hronologi al trends. The ex avation is usually made by testtren hes and pro eed by re ognition of ea h anthropi deposit and if none is7
8 Introdu tionpreserved, by arti� ial uts. In highly disturbed ontexts, verti al and lateralmoving of the materials may be high and resulting in a mix of tools, pottery,bones and in situ �ndings are not so frequent. Furthermore, the absen e ofstru tural remains at prehistori sites due both to the poor preservation ofanthropi deposits and the very light stru tures usually asso iated to highlymobile human groups, makes the ar haeologi al investigation more di� ultwhen dealing with hunter-gatherer so ieties. In prehistori times there wereno written re ords so materials are the only sour e of information to do u-ment the ultures of the past. For all these reasons, the development of anabsolute dating proto ol of �ndings is a viable alternative for the interpre-tation of materials from unstrati�ed deposit. This is of relevan e not onlyfor the Nile Valley ar haeology, but for prehistori ar haeology in any partof the world.Dealing with the terminology used in the present work we have to under-lay that ultural labels like Mesolithi and Neolithi apply the �rst to earlyHolo ene more or less omplex so ieties with a subsisten e e onomy basedon hunting, gathering and �shing, the se ond to middle Holo ene food pro-du ing ommunities. This e onomi ally based meaning of old ultural labelsoriginally based on a restri ted range of material traits like Mesolithi andNeolithi is nowadays generally a epted.The attention of the present work is fo used on pottery. Traditionalmethods of reating relative or absolute hronologies are di� ult to apply to erami found in the desert, in surfa e sites. The ombination of relative andabsolute dating would help in the hronologi al arrangement of potsherdseven if found without their original stratigraphi ontext. New approa hesare here proposed based on the appli ation of di�erent proto ols of mea-surements of traditional lumines en e dating te hnique and the evaluationof the Ele tron Paramagneti Resonan e (EPR) as a possible new datingmethod for pottery. Thermolumines en e (TL) is almost a standard potterydating method but its appli ation on prehistori materials is still a�e ted bylarge errors in age determination. Opti al Stimulated Lumines en e (OSL)has its main use in geology but re ently it has been extended for studyingheated materials. Similarly, the potential of EPR dating is demonstrated fordi�erent materials as sediments and teeth, with the development of spe i� proto ols and the �eld of appli ation has grown to in lude materials from afew thousand years ago to several million years ago. Compared to lumines- en e te hnique, EPR has the big advantage of not erasing the signal duringmeasurements, allowing the use of small fra tion of the obje t that has to bedated. While TL is more reliable for re ent materials, EPR is suitable espe- ially for geologi al hronologies but it is for this reason a fundamental toolfor all the situations in whi h the ages ex eed the radio arbon limit. In the

9majority of ases, a ross- alibration is required, as it will be tested in thisstudy. The possibility of trying to date prehistori desert pottery by meansof all these te hniques that have in ommon the same physi al bases (radi-ation indu ed defe ts) but di�erent experimental requirements and limits isvery hallenging.

10 Introdu tion
Chapter 1Overview of The Radiation E�e tDating Te hniquesIn studying natural and human events, the dating te hniques are useful toanswer the question �when?�. Physi al anthropology, geology and ar haeol-ogy are some of the �elds in whi h the onstru tion of a hronology of thepast events is essential. Dating methods an be divided into two types: rel-ative and absolute. While in the �rst ase it is possible just to establish arelationship between the obje ts or the events to re onstru t their hrono-logi al order/sequen e, the absolute dating is able to assign an age. It isimportant to underline the di�eren e between the terms age and date. Theage is expressed as a number representing the years passed from the momentthat has to be dated and the time of the measurements. This expression issuitable only for very an ient events, sin e the age in reases every year andit is inappropriate for re ent materials in whi h more pre ision is needed.In these ases it is better to use the alendar date, given in years before orafter Christ (BC or AD) sin e it is independent of the time of measurements.An absolute dating te hnique must be based on a physi al or hemi al phe-nomenon with a time dependen e onstant over the period of interest of theevent to be dated. Furthermore, the event and the phenomenon must startat the same time. The radioa tivity is a pro ess suitable for dating purposessin e the radioisotopes de ay has an un hanging rate and it is not a�e ted byexternal fa tors as, for example, environmental onditions. The best-knownmethod exploiting radioa tivity is radio arbon (14C), however other datingte hniques are based on de ay, exploiting its e�e t on matter [1℄. The ioniz-ing radiation arising from the de ay pro ess is responsible for the produ tionof free harges in some minerals in whi h the parti ular rystal stru ture al-lows the trapping of ele trons at latti e defe ts sites. The number of trapped harges ( alled enters) is proportional to the radiation re eived by the sam-11
12 CHAPTER 1. OVERVIEW OF THE DATING TECHNIQUES
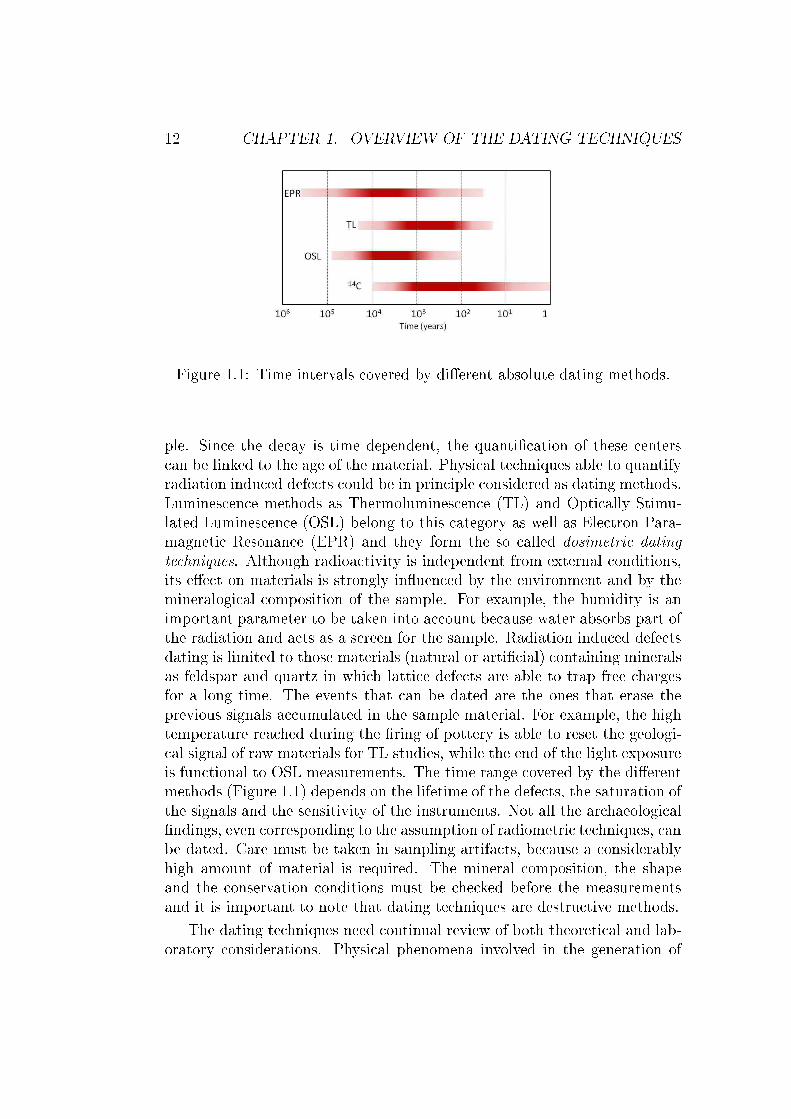
Figure 1.1: Time intervals overed by di�erent absolute dating methods.ple. Sin e the de ay is time dependent, the quanti� ation of these enters an be linked to the age of the material. Physi al te hniques able to quantifyradiation indu ed defe ts ould be in prin iple onsidered as dating methods.Lumines en e methods as Thermolumines en e (TL) and Opti ally Stimu-lated Lumines en e (OSL) belong to this ategory as well as Ele tron Para-magneti Resonan e (EPR) and they form the so alled dosimetri datingte hniques. Although radioa tivity is independent from external onditions,its e�e t on materials is strongly in�uen ed by the environment and by themineralogi al omposition of the sample. For example, the humidity is animportant parameter to be taken into a ount be ause water absorbs part ofthe radiation and a ts as a s reen for the sample. Radiation indu ed defe tsdating is limited to those materials (natural or arti� ial) ontaining mineralsas feldspar and quartz in whi h latti e defe ts are able to trap free hargesfor a long time. The events that an be dated are the ones that erase theprevious signals a umulated in the sample material. For example, the hightemperature rea hed during the �ring of pottery is able to reset the geologi- al signal of raw materials for TL studies, while the end of the light exposureis fun tional to OSL measurements. The time range overed by the di�erentmethods (Figure 1.1) depends on the lifetime of the defe ts, the saturation ofthe signals and the sensitivity of the instruments. Not all the ar haeologi al�ndings, even orresponding to the assumption of radiometri te hniques, anbe dated. Care must be taken in sampling artifa ts, be ause a onsiderablyhigh amount of material is required. The mineral omposition, the shapeand the onservation onditions must be he ked before the measurementsand it is important to note that dating te hniques are destru tive methods.The dating te hniques need ontinual review of both theoreti al and lab-oratory onsiderations. Physi al phenomena involved in the generation of

1.1. RADIATION EFFECT DATING 13signals are not yet fully understood and some limitations in dating appli a-tion still remain unsolved [1℄.1.1 Radiation e�e t datingRadioa tive elements emit alpha and beta parti les and gamma rays pro-du ing atomi or ele troni defe ts in solids. The radiation intera ts withnon- ondu tive solids forming pairs of ele trons and positively harged holes.Ele trons and holes move throughout the rystal, some of them re ombiningrapidly, others being trapped at the defe t latti e sites, as impurities andva an ies. Ele trons an be trapped for millions of years, forming the so alled radiation indu ed enters. Dating materials is possible by observingthe a umulated enters produ ed in rystals as a onsequen e of irradia-tion. Any physi al te hnique able to dete t and quantify radiation indu eddefe t enters an be in prin iple applied as a dating method. Belong to this ategory:• Lumines en e dating (TL, OSL)• Ele tron Paramagneti Resonan e (EPR).In general, in EPR and lumines en e dating of ar haeologi al materialsthe aim is to determine the dose to whi h the sample was exposed over itsburial period. The exposure time and thereby the age, are determined by omparing the a umulated dose to the average annual dose rate. Materialssuitable for dating purpose are insulators whi h exhibit trapped harges witha lifetime onsiderably longer than the time of exposure.1.1.1 Radioa tive de ay: the physi al basis for datingThe physi al phenomena involved in the intera tion between radiation andmatter are brie�y explained in order to understand the prin iples of radio-metri dating. Natural radioa tivity is present everywhere at low doses, dueto the transformation of unstable nu lei (radioa tive isotopes) whi h emitionizing radiation. A neutral atom is hara terized by the atomi number(Z) and by the mass number (A). Z is the number of protons of the nu leuswhile A is the sum of protons and neutrons. The notation is: A
z XIsotopes are nu lides of the same element (=Z) with a di�erent numberof neutrons (6=A), thus they have the same hemi al behavior but di�erentphysi al properties and nu lear stability. Isotopes an be stable or unstable.In the se ond ase, the isotope de ays spontaneously without any external
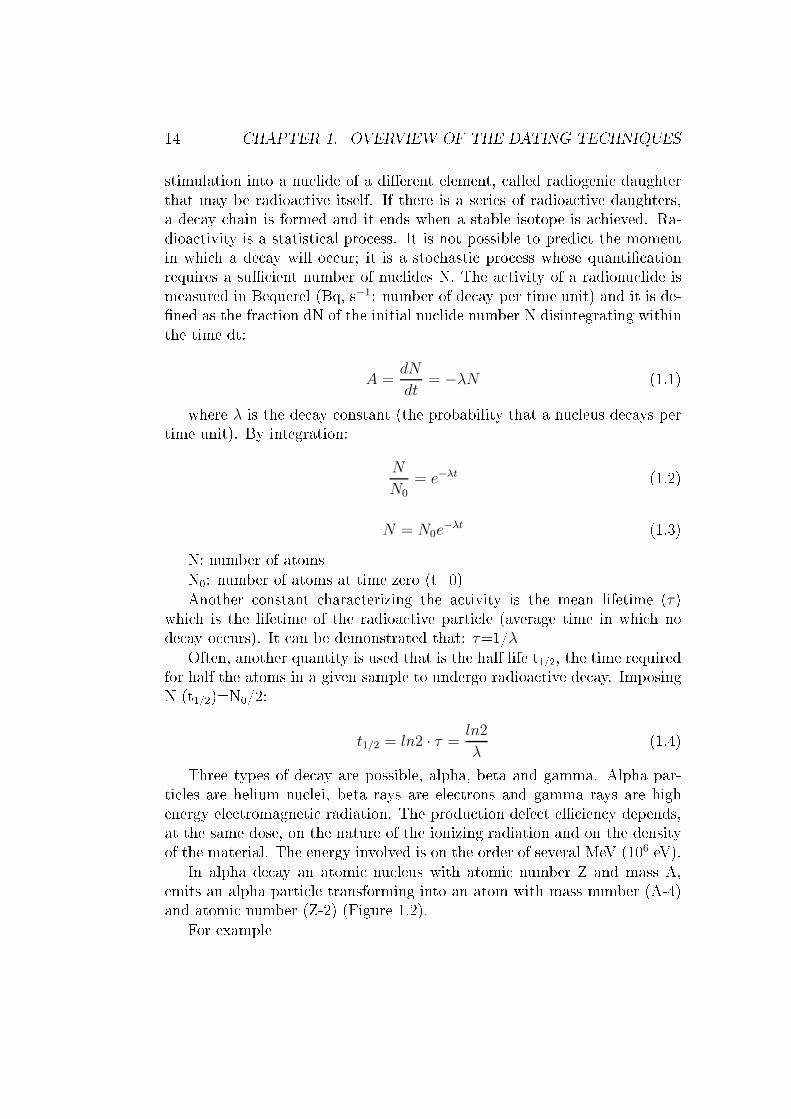
14 CHAPTER 1. OVERVIEW OF THE DATING TECHNIQUESstimulation into a nu lide of a di�erent element, alled radiogeni daughterthat may be radioa tive itself. If there is a series of radioa tive daughters,a de ay hain is formed and it ends when a stable isotope is a hieved. Ra-dioa tivity is a statisti al pro ess. It is not possible to predi t the momentin whi h a de ay will o ur; it is a sto hasti pro ess whose quanti� ationrequires a su� ient number of nu lides N. The a tivity of a radionu lide ismeasured in Bequerel (Bq, s−1: number of de ay per time unit) and it is de-�ned as the fra tion dN of the initial nu lide number N disintegrating withinthe time dt:A =
dN
dt= −λN (1.1)where λ is the de ay onstant (the probability that a nu leus de ays pertime unit). By integration:
N
N0
= e−λt (1.2)N = N0e
−λt (1.3)N: number of atomsN0: number of atoms at time zero (t=0)Another onstant hara terizing the a tivity is the mean lifetime (τ)whi h is the lifetime of the radioa tive parti le (average time in whi h node ay o urs). It an be demonstrated that: τ=1/λOften, another quantity is used that is the half life t1/2, the time requiredfor half the atoms in a given sample to undergo radioa tive de ay. ImposingN (t1/2)=N0/2:t1/2 = ln2 · τ =
ln2
λ(1.4)Three types of de ay are possible, alpha, beta and gamma. Alpha par-ti les are helium nu lei, beta rays are ele trons and gamma rays are highenergy ele tromagneti radiation. The produ tion defe t e� ien y depends,at the same dose, on the nature of the ionizing radiation and on the densityof the material. The energy involved is on the order of several MeV (106 eV).In alpha de ay an atomi nu leus with atomi number Z and mass A,emits an alpha parti le transforming into an atom with mass number (A-4)and atomi number (Z-2) (Figure 1.2).For example
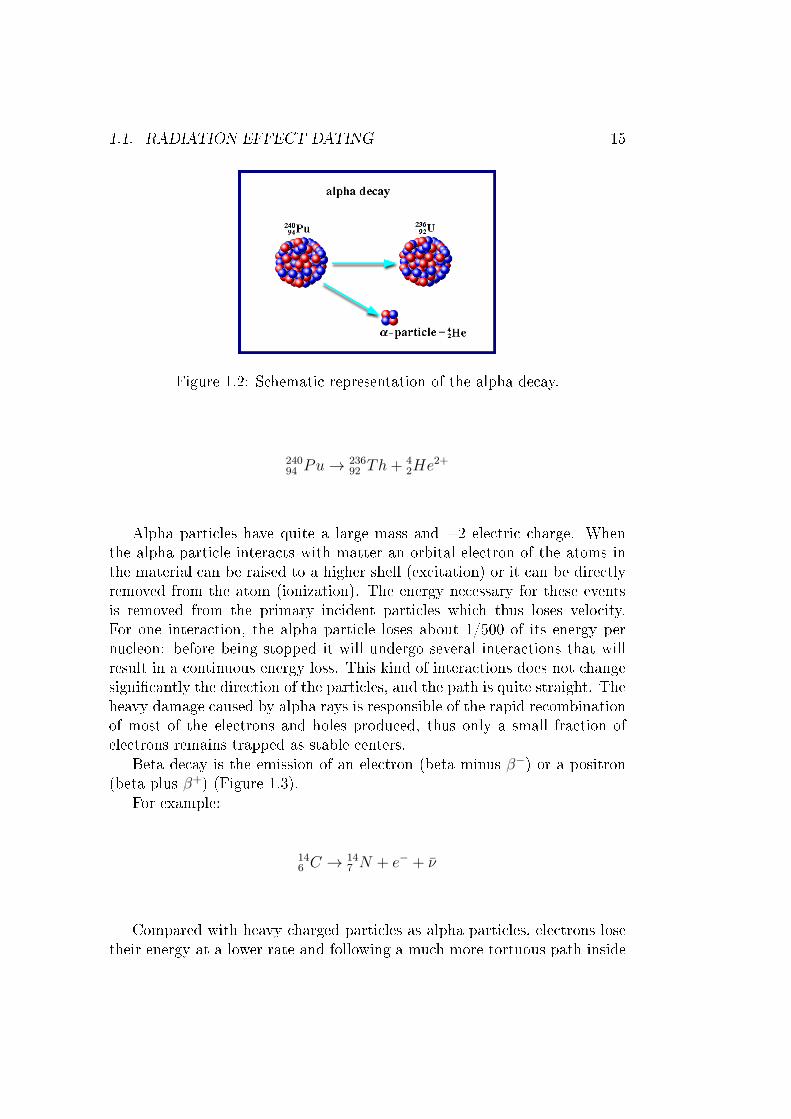
1.1. RADIATION EFFECT DATING 15
Figure 1.2: S hemati representation of the alpha de ay.240
94 Pu → 236
92 Th+ 4
2He2+Alpha parti les have quite a large mass and +2 ele tri harge. Whenthe alpha parti le intera ts with matter an orbital ele tron of the atoms inthe material an be raised to a higher shell (ex itation) or it an be dire tlyremoved from the atom (ionization). The energy ne essary for these eventsis removed from the primary in ident parti les whi h thus loses velo ity.For one intera tion, the alpha parti le loses about 1/500 of its energy pernu leon: before being stopped it will undergo several intera tions that willresult in a ontinuous energy loss. This kind of intera tions does not hangesigni� antly the dire tion of the parti les, and the path is quite straight. Theheavy damage aused by alpha rays is responsible of the rapid re ombinationof most of the ele trons and holes produ ed, thus only a small fra tion ofele trons remains trapped as stable enters.Beta de ay is the emission of an ele tron (beta minus β−) or a positron(beta plus β+) (Figure 1.3).For example:14
6 C → 14
7 N + e− + ν̄Compared with heavy harged parti les as alpha parti les, ele trons losetheir energy at a lower rate and following a mu h more tortuous path inside
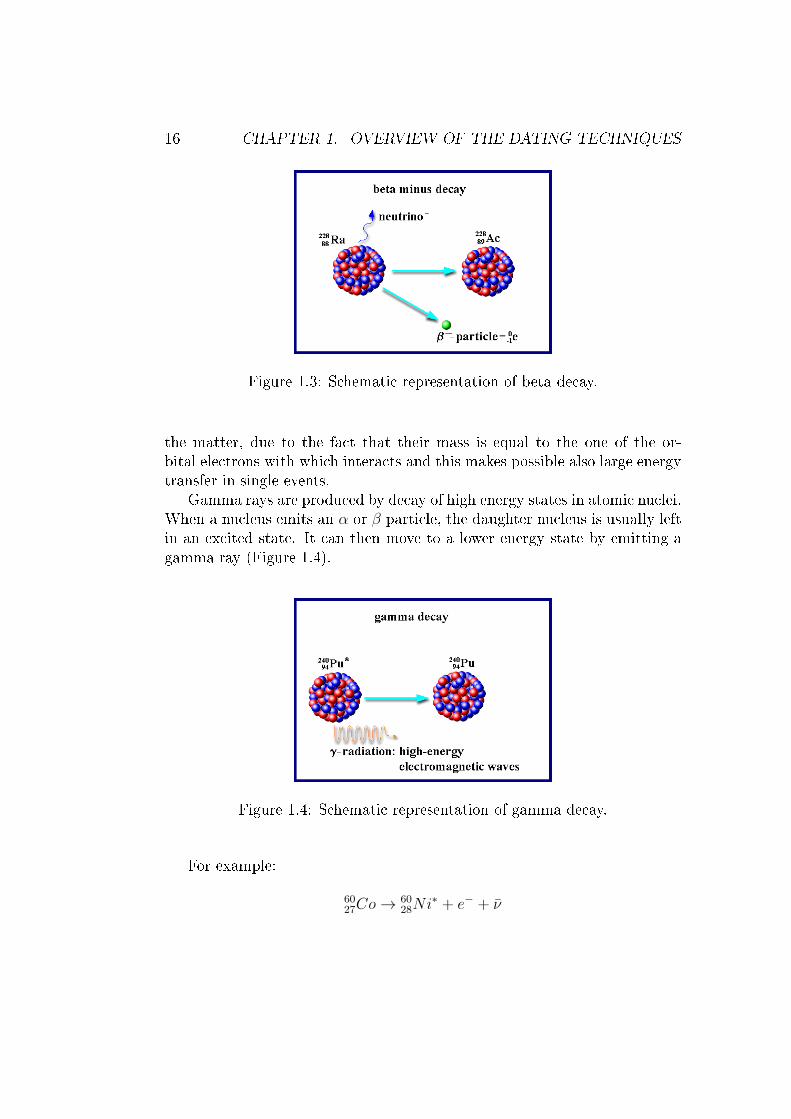
16 CHAPTER 1. OVERVIEW OF THE DATING TECHNIQUES
Figure 1.3: S hemati representation of beta de ay.the matter, due to the fa t that their mass is equal to the one of the or-bital ele trons with whi h intera ts and this makes possible also large energytransfer in single events.Gamma rays are produ ed by de ay of high energy states in atomi nu lei.When a nu leus emits an α or β parti le, the daughter nu leus is usually leftin an ex ited state. It an then move to a lower energy state by emitting agamma ray (Figure 1.4).
Figure 1.4: S hemati representation of gamma de ay.For example:60
27Co → 60
28Ni∗ + e− + ν̄
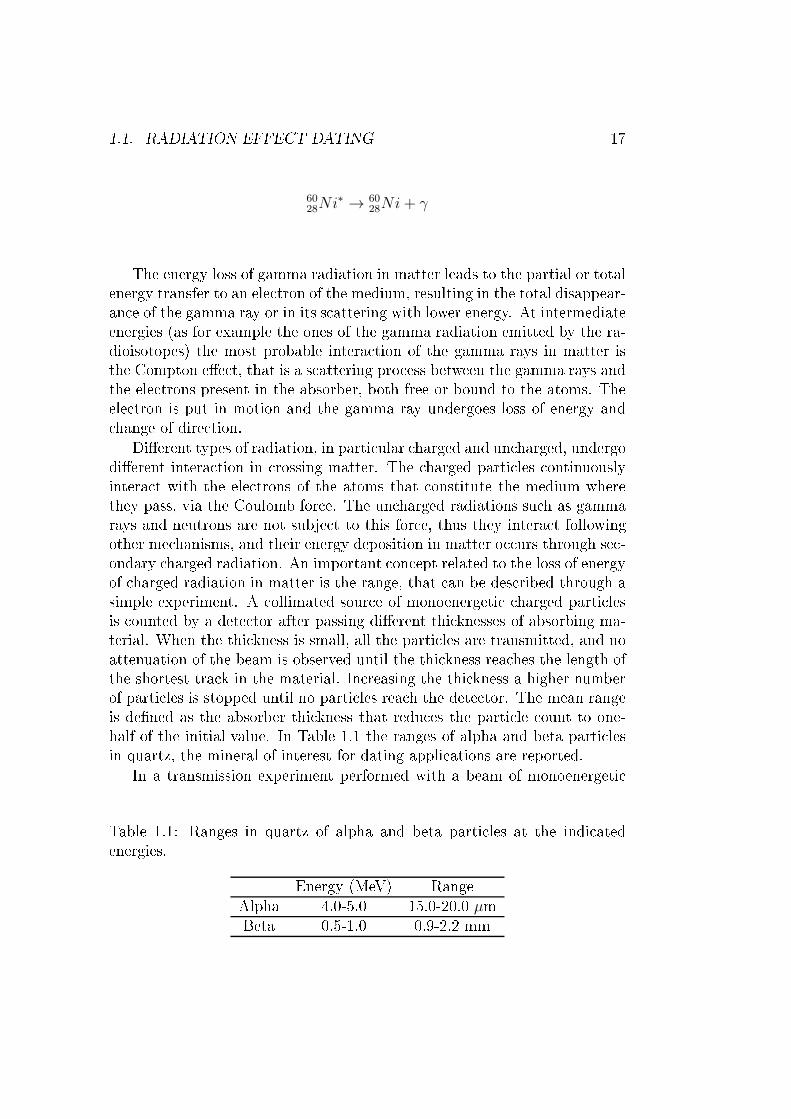
1.1. RADIATION EFFECT DATING 1760
28Ni∗ → 60
28Ni+ γThe energy loss of gamma radiation in matter leads to the partial or totalenergy transfer to an ele tron of the medium, resulting in the total disappear-an e of the gamma ray or in its s attering with lower energy. At intermediateenergies (as for example the ones of the gamma radiation emitted by the ra-dioisotopes) the most probable intera tion of the gamma rays in matter isthe Compton e�e t, that is a s attering pro ess between the gamma rays andthe ele trons present in the absorber, both free or bound to the atoms. Theele tron is put in motion and the gamma ray undergoes loss of energy and hange of dire tion.Di�erent types of radiation, in parti ular harged and un harged, undergodi�erent intera tion in rossing matter. The harged parti les ontinuouslyintera t with the ele trons of the atoms that onstitute the medium wherethey pass, via the Coulomb for e. The un harged radiations su h as gammarays and neutrons are not subje t to this for e, thus they intera t followingother me hanisms, and their energy deposition in matter o urs through se -ondary harged radiation. An important on ept related to the loss of energyof harged radiation in matter is the range, that an be des ribed through asimple experiment. A ollimated sour e of monoenergeti harged parti lesis ounted by a dete tor after passing di�erent thi knesses of absorbing ma-terial. When the thi kness is small, all the parti les are transmitted, and noattenuation of the beam is observed until the thi kness rea hes the length ofthe shortest tra k in the material. In reasing the thi kness a higher numberof parti les is stopped until no parti les rea h the dete tor. The mean rangeis de�ned as the absorber thi kness that redu es the parti le ount to one-half of the initial value. In Table 1.1 the ranges of alpha and beta parti lesin quartz, the mineral of interest for dating appli ations are reported.In a transmission experiment performed with a beam of monoenergeti Table 1.1: Ranges in quartz of alpha and beta parti les at the indi atedenergies. Energy (MeV) RangeAlpha 4.0-5.0 15.0-20.0 µmBeta 0.5-1.0 0.9-2.2 mm
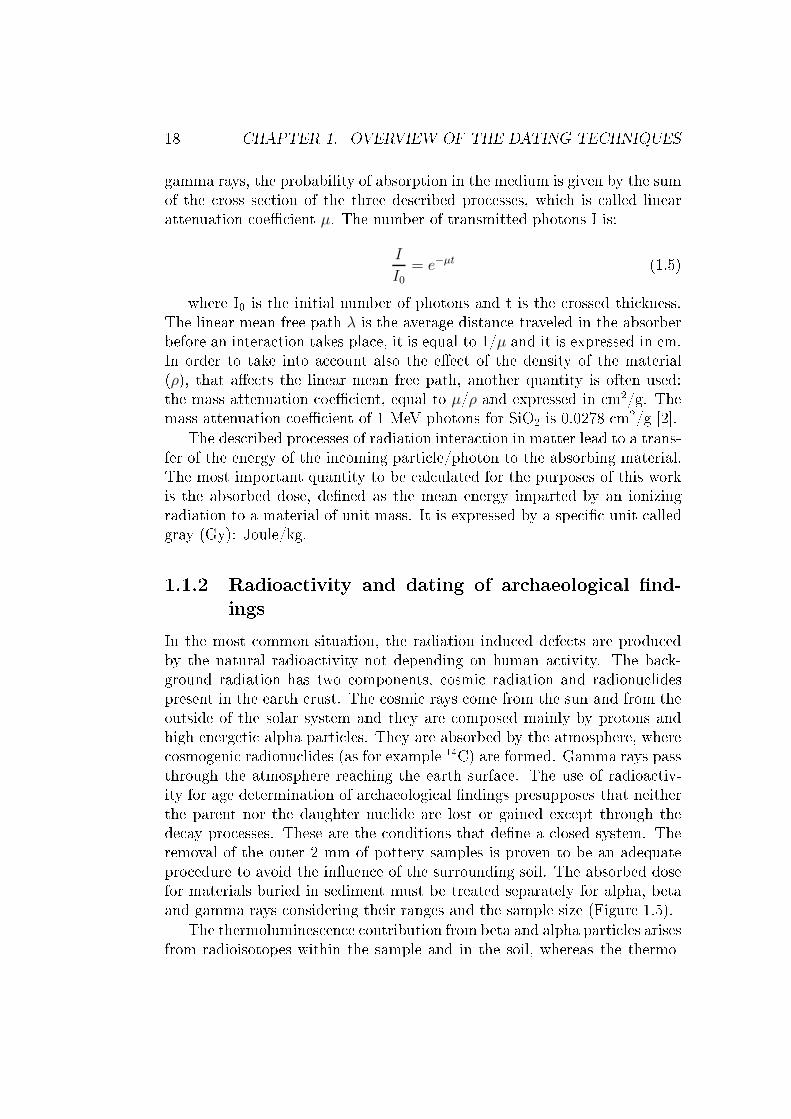
18 CHAPTER 1. OVERVIEW OF THE DATING TECHNIQUESgamma rays, the probability of absorption in the medium is given by the sumof the ross se tion of the three des ribed pro esses, whi h is alled linearattenuation oe� ient µ. The number of transmitted photons I is:I
I0= e−µt (1.5)where I0 is the initial number of photons and t is the rossed thi kness.The linear mean free path λ is the average distan e traveled in the absorberbefore an intera tion takes pla e, it is equal to 1/µ and it is expressed in m.In order to take into a ount also the e�e t of the density of the material(ρ), that a�e ts the linear mean free path, another quantity is often used:the mass attenuation oe� ient, equal to µ/ρ and expressed in m2/g. Themass attenuation oe� ient of 1 MeV photons for SiO2 is 0.0278 m2/g [2℄.The des ribed pro esses of radiation intera tion in matter lead to a trans-fer of the energy of the in oming parti le/photon to the absorbing material.The most important quantity to be al ulated for the purposes of this workis the absorbed dose, de�ned as the mean energy imparted by an ionizingradiation to a material of unit mass. It is expressed by a spe i� unit alledgray (Gy): Joule/kg.1.1.2 Radioa tivity and dating of ar haeologi al �nd-ingsIn the most ommon situation, the radiation indu ed defe ts are produ edby the natural radioa tivity not depending on human a tivity. The ba k-ground radiation has two omponents, osmi radiation and radionu lidespresent in the earth rust. The osmi rays ome from the sun and from theoutside of the solar system and they are omposed mainly by protons andhigh energeti alpha parti les. They are absorbed by the atmosphere, where osmogeni radionu lides (as for example 14C) are formed. Gamma rays passthrough the atmosphere rea hing the earth surfa e. The use of radioa tiv-ity for age determination of ar haeologi al �ndings presupposes that neitherthe parent nor the daughter nu lide are lost or gained ex ept through thede ay pro esses. These are the onditions that de�ne a losed system. Theremoval of the outer 2 mm of pottery samples is proven to be an adequatepro edure to avoid the in�uen e of the surrounding soil. The absorbed dosefor materials buried in sediment must be treated separately for alpha, betaand gamma rays onsidering their ranges and the sample size (Figure 1.5).The thermolumines en e ontribution from beta and alpha parti les arisesfrom radioisotopes within the sample and in the soil, whereas the thermo-
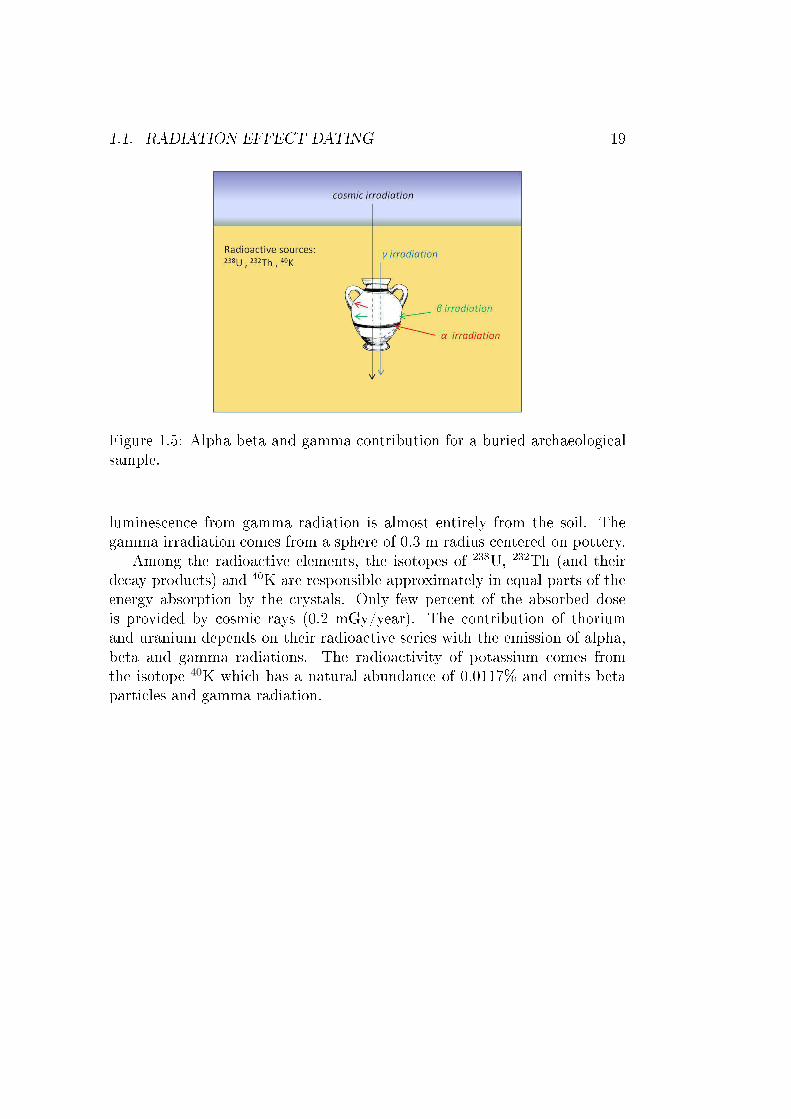
1.1. RADIATION EFFECT DATING 19
Figure 1.5: Alpha beta and gamma ontribution for a buried ar haeologi alsample.lumines en e from gamma radiation is almost entirely from the soil. Thegamma irradiation omes from a sphere of 0.3 m radius entered on pottery.Among the radioa tive elements, the isotopes of 238U, 232Th (and theirde ay produ ts) and 40K are responsible approximately in equal parts of theenergy absorption by the rystals. Only few per ent of the absorbed doseis provided by osmi rays (0.2 mGy/year). The ontribution of thoriumand uranium depends on their radioa tive series with the emission of alpha,beta and gamma radiations. The radioa tivity of potassium omes fromthe isotope 40K whi h has a natural abundan e of 0.0117% and emits betaparti les and gamma radiation.

20 CHAPTER 1. OVERVIEW OF THE DATING TECHNIQUES
Chapter 2Lumines en e and EPR DatingEPR and lumines en e dating methods are based on the e�e ts of ioniz-ing radiation intera ting with rystals. Lumines en e te hniques are ableto determine the time elapsed sin e the last heating (TL) or the last lightexposure (OSL), on the basis of a similar physi al me hanism. It onsists inthe trapping of ele tron harges by some minerals as quartz and feldspar asa onsequen e of the intera tion with ionizing radiation. When samples areheated or illuminated for the measurement, a light emission o urs, due tothe re ombination of the ele trons (set free from their traps) with the holes.The radiation emitted in the de ay of radioa tive nu lides present in thesample and in the lo al external surroundings is responsible of the reationof the defe ts in rystalline latti es. The high energeti radiation produ espositively harged holes and free ele trons in non- ondu tive solids. The free harges move throughout the rystalline latti e and two pro esses may o ur.Most of the negative and positive harges re ombine rapidly, while a feware trapped at latti e defe ts, forming paramagneti enters. Some of these enters are stable over a long period and are useful for dating purpose, sin eit is veri�ed the prin iple: the more trapped harges, the older the materialis. The stability of the radiation indu ed enters ould be of millions of years,but not all the ele trons stay in the traps over a time interval longer thanthe age of the material that must be dated. The lifetime of the enters is�nite and for dating purpose it is ne essary to sele t and quantify only thosetraps for whi h a su� ient stability is proven.The number of radiation indu ed defe ts ould be related to the ageif it was zero for a sample of zero age. For this reason it is required anannealing treatment (blea hing) whi h erases any irradiation memory fromthe dosimetri minerals in the material, thus setting the lo k time to zerofor the event to be dated. For example, the �ring of pottery is an event ableto reset defe ts in raw materials a umulated over a geologi al time. A new21
22 CHAPTER 2. LUMINESCENCE AND EPR DATING
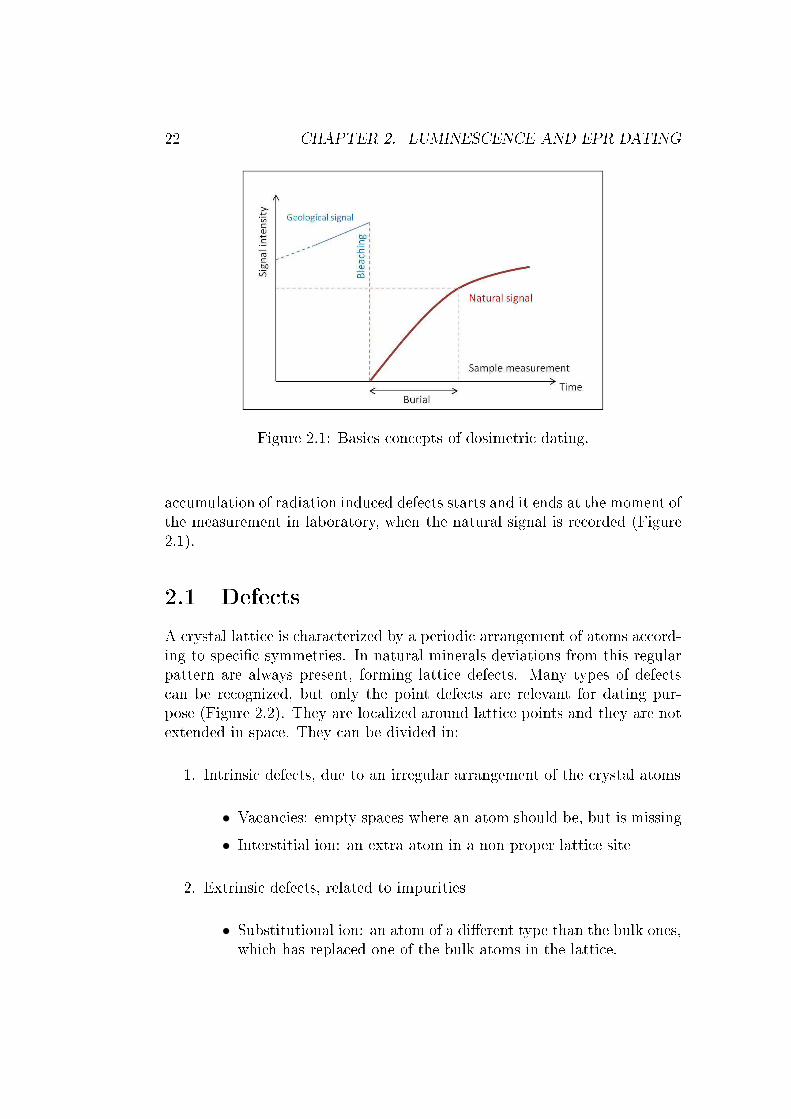
Figure 2.1: Basi s on epts of dosimetri dating.a umulation of radiation indu ed defe ts starts and it ends at the moment ofthe measurement in laboratory, when the natural signal is re orded (Figure2.1).2.1 Defe tsA rystal latti e is hara terized by a periodi arrangement of atoms a ord-ing to spe i� symmetries. In natural minerals deviations from this regularpattern are always present, forming latti e defe ts. Many types of defe ts an be re ognized, but only the point defe ts are relevant for dating pur-pose (Figure 2.2). They are lo alized around latti e points and they are notextended in spa e. They an be divided in:1. Intrinsi defe ts, due to an irregular arrangement of the rystal atoms• Va an ies: empty spa es where an atom should be, but is missing• Interstitial ion: an extra atom in a non proper latti e site2. Extrinsi defe ts, related to impurities• Substitutional ion: an atom of a di�erent type than the bulk ones,whi h has repla ed one of the bulk atoms in the latti e.

2.1. DEFECTS 23
Figure 2.2: Representation of defe ts in the rystalline latti e of an ioni rystal (va an y, interstitial ion, interstitial impurity and substitutional ion).• Interstitial impurity: an atom of a di�erent type than the bulkones �ts into the open spa e between the bulk atoms of the latti estru tureThe lassi� ation of the point defe ts an be based also on their ele -troni on�guration. Defe ts having unpaired ele trons are paramagneti ,the others are diamagneti . This distin tion is important for the dete tion ofpoint defe ts by EPR spe tros opy, whi h is able to re ord just spe ies withunpaired ele trons.A representation explaining the trapping of the ele trons and the lumi-nes en e produ tion is the so alled energy band model (Figure 2.3). Ininsulating minerals there are two energy levels at whi h ele trons may stay.The lower energy level is the valen e band, where ele trons are found at theequilibrium state. The valen e band is separated from the higher energy level( ondu tion band) by a forbidden zone (band gap).In an ideal rystal, within the energeti gap there are no levels at whi hele trons may be found. In real rystals, the presen e of latti e defe ts al-lows metastable energy levels in the forbidden region whi h are able to trapele trons moving through the rystal. At the starting point, as after a reset-ting event, all the ele trons are in the ground state. The ionizing radiation oming from the radioa tive de ay of unstable isotopes auses the transitionof the ele trons from the valen e band to the ondu tion band. Then, inreturning to the equilibrium state, they an re ombine or get trapped atlatti e defe ts. If the traps are thermally and/or opti ally stable, ele tronsare not released until external energy stimulation is given to the mineral.The ionization reates also negative harge de� it ( alled hole) a ting as a
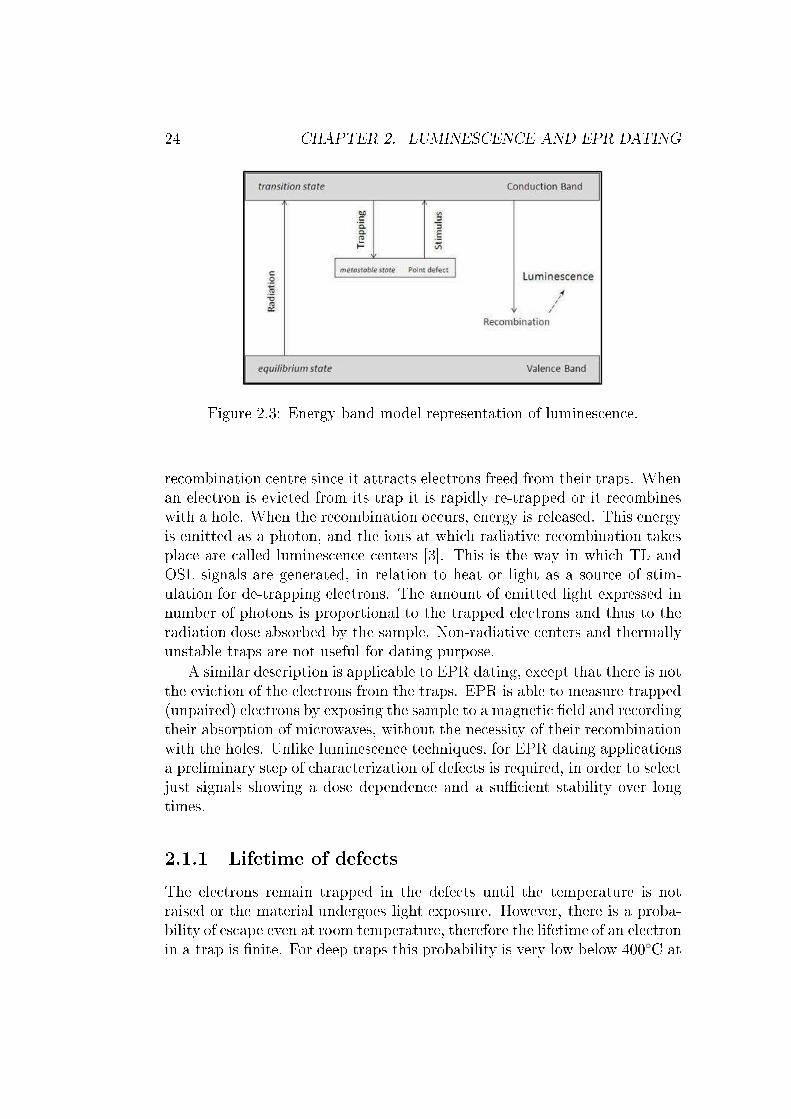
24 CHAPTER 2. LUMINESCENCE AND EPR DATING
Figure 2.3: Energy band model representation of lumines en e.re ombination entre sin e it attra ts ele trons freed from their traps. Whenan ele tron is evi ted from its trap it is rapidly re-trapped or it re ombineswith a hole. When the re ombination o urs, energy is released. This energyis emitted as a photon, and the ions at whi h radiative re ombination takespla e are alled lumines en e enters [3℄. This is the way in whi h TL andOSL signals are generated, in relation to heat or light as a sour e of stim-ulation for de-trapping ele trons. The amount of emitted light expressed innumber of photons is proportional to the trapped ele trons and thus to theradiation dose absorbed by the sample. Non-radiative enters and thermallyunstable traps are not useful for dating purpose.A similar des ription is appli able to EPR dating, ex ept that there is notthe evi tion of the ele trons from the traps. EPR is able to measure trapped(unpaired) ele trons by exposing the sample to a magneti �eld and re ordingtheir absorption of mi rowaves, without the ne essity of their re ombinationwith the holes. Unlike lumines en e te hniques, for EPR dating appli ationsa preliminary step of hara terization of defe ts is required, in order to sele tjust signals showing a dose dependen e and a su� ient stability over longtimes.2.1.1 Lifetime of defe tsThe ele trons remain trapped in the defe ts until the temperature is notraised or the material undergoes light exposure. However, there is a proba-bility of es ape even at room temperature, therefore the lifetime of an ele tronin a trap is �nite. For deep traps this probability is very low below 400◦C at
2.2. AGE EQUATION 25whi h evi tion o urs, but it rises very rapidly with in reasing temperature.It is important to note that in any rystal there are di�erent types of trapswith di�erent hara teristi temperatures of evi tion. For very shallow trapslifetime ould be of few hours. In dating pro edure is fundamental to sele tonly enters having lifetimes of tens of thousands of years. Lifetime (τ) isrelated to the trap depth de�ned as the energy di�eren e (E, eV) betweenthe ondu tion band and the trap level:τ =
1
se−
E
kT (2.1)where s is the frequen y fa tor representing the attempts to es ape perse ond of the ele tron from the trap (1010-1012 s-1) and it depends on latti evibrations, and k is the Boltzmann's onstant: (8.52·10−5 eV/K).2.2 Age equationIn radiometri dating the age is al ulated a ording to the equation:age =
palaeodose(Gy)
annualdose(Gy/year)(2.2)The palaeodose is the radiation dose to whi h the sample has been ex-posed, due to the presen e of naturally o urring radionu lides within thepottery and the surrounding sediments sin e the event of zeroing. The an-nual dose is the radiation dose re eived by the sample per year.The palaeodose, or ar haeologi al dose, is also alled equivalent dose be- ause it is the amount of radiation in terms of absorbed dose required toprodu e a lumines en e signal orresponding to the natural one measuredon the sample. Typi al values of absorbed dose in erami range between afew Gy and a few tents of Gy. The annual dose is not a dire tly measurablequantity but has to be estimated. The dose rate is generated from an in-ternal omponent oming from the sample and an external omponent fromthe environment, both onstituted by short ranged alpha and beta radiation,long ranged gamma rays and osmi radiation. The annual dose rate rangesfrom 1 mGy/y to 10 mGy/y in pottery. This estimation not only dependson the dire t intera tion between radiation and minerals, but also on fa -tors as the spatial distribution of radioa tivity and the presen e of water.Humidity absorbs part of the radiation whi h does not arrive to the samplethus a�e ting the e�e tive annual dose rate. In order to quantify the doserate during the burial period, measurements of radioa tivity in situ at the
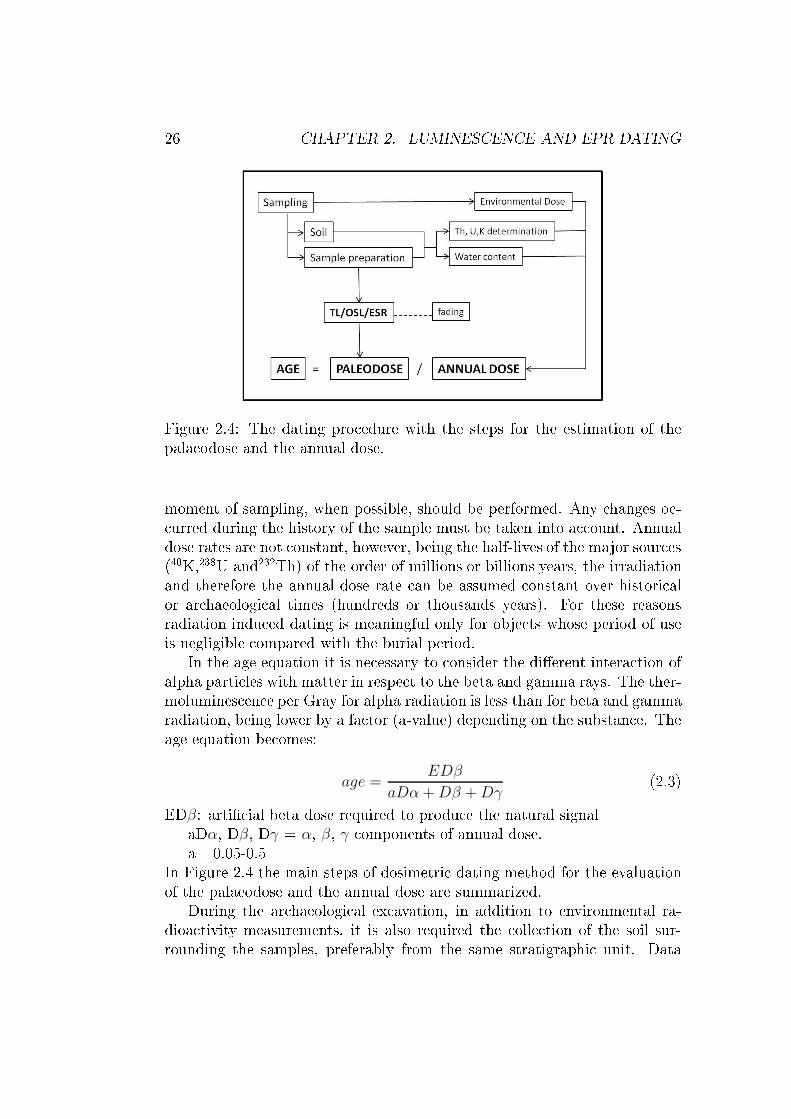
26 CHAPTER 2. LUMINESCENCE AND EPR DATING
Figure 2.4: The dating pro edure with the steps for the estimation of thepalaeodose and the annual dose.moment of sampling, when possible, should be performed. Any hanges o - urred during the history of the sample must be taken into a ount. Annualdose rates are not onstant, however, being the half-lives of the major sour es(40K,238U and232Th) of the order of millions or billions years, the irradiationand therefore the annual dose rate an be assumed onstant over histori alor ar haeologi al times (hundreds or thousands years). For these reasonsradiation indu ed dating is meaningful only for obje ts whose period of useis negligible ompared with the burial period.In the age equation it is ne essary to onsider the di�erent intera tion ofalpha parti les with matter in respe t to the beta and gamma rays. The ther-molumines en e per Gray for alpha radiation is less than for beta and gammaradiation, being lower by a fa tor (a-value) depending on the substan e. Theage equation be omes:age =
EDβ
aDα+Dβ +Dγ(2.3)EDβ: arti� ial beta dose required to produ e the natural signalaDα, Dβ, Dγ = α, β, γ omponents of annual dose.a= 0.05-0.5In Figure 2.4 the main steps of dosimetri dating method for the evaluationof the palaeodose and the annual dose are summarized.During the ar haeologi al ex avation, in addition to environmental ra-dioa tivity measurements, it is also required the olle tion of the soil sur-rounding the samples, preferably from the same stratigraphi unit. Data
2.3. PRECISION AND ACCURACY 27from radioa tivity of soils and environment are dire ted to the al ulation ofthe external dose. The internal ontribution is obtained by measuring the ra-dioa tivity of the sample matrix. The water ontent of the sample ompletesthe data useful for annual dose estimation. The palaeodose is a hieved fromTL, OSL and EPR signals, with the possibility of applying di�erent proto olsand experimental settings.2.3 Pre ision and a ura yThe ages obtained by the experimental dating pro edure, must be reportedwith their un ertainty. The typi al error limit of a single measurement is 10%but the value ould de rease to 5% by dating groups of supposed oeval sam-ples. Un ertainties are proportional to the age of the sample, thus limitingfor dating very an ient materials. Systemati and random errors a�e t thedating pro edure [4℄. The systemati un ertainty omes from the alibrationof the radiation sour es and from the measurements pro edures. Errors a�e tall the samples measurements redu ing the a ura y of the results. The terma ura y indi ates the loseness of a measurement with the true value of thequantity under measurement. Random errors are di�erent from sample tosample (for example aused by non homogeneities of the material) and anbe redu ed by averaging the results for a number of ontemporary samples.This type of error determines the pre ision of the measurement, whi h refersto its reprodu ibility.In dosimetri dating, many parameters are needed to al ulate the equiv-alent dose and the annual dose rates, introdu ing several un ertainties. Thepre ision that an be a hieved depends primarily on the sampling ontextand on the sample features. The best ondition is a hieved when a homo-geneous soil surround the samples within a 30 m radius, be ause this isthe approximate penetration limit of gamma rays in soil. Unfortunately, thevariability is relevant from region to region and sometimes also from site tosite. The al ulation of the annual dose rate requires in situ and laboratorymeasurements but they are both based on present day onditions. In orderto redu e errors in age estimation, it is ne essary to re onstru t the historyof deposition and take into a ount possible relevant events o urred duringthe burial period. The in�uen e of water ontent is of parti ular on ern indating pro edure. For this reason, limate and environmental hanges mustbe onsidered in annual dose rate estimation. Furthermore, less pre ision af-fe ts the dating of samples removed from their burial ontext for long times,for whi h it is not possible to ondu t in situ dosimetry measurements. Twomethods have been re ently tested to estimate the external dose in su h on-
28 CHAPTER 2. LUMINESCENCE AND EPR DATINGditions. The �rst is based on average data of natural dosimetry olle tedthroughout the world, the se ond on geo hemi al studies of environments omparable with those of the provenan e of the materials. The latter startsfrom the assumption that the soil is identi al to the pottery lay matrix andthus it is appli able only when the sample and the environment are verysimilar [5℄. The attainable a ura y does not always satisfy hronologi aldemands of ar haeology, but the lumines en e method o�ers meaningful andadvantageous solutions despite the low pre ision.2.4 AssumptionsIn radiation indu ed defe t methods, some requirements must be satis�ed inorder to obtain meaningful ages. First of all, it is possible to date only thematerials ontaining rystalline in lusions a ting as a dosimeter. Quartz andfeldspars are the main natural dosimeters and they are at the base of lumi-nes en e dating. Pottery almost always ontains in its matrix these minerals(deliberately added or naturally present in lay used as a row material) thusin general it is a suitable material for dosimetri dating appli ations. Quartzis also well hara terized by EPR spe tros opy and di�erent paramagneti enters are indu ed by ionizing radiation.EPR signals and lumines en e emissions useful to re onstru t the hronol-ogy, should be zero at the time of the event to be dated. It is ne essarya omplete zeroing pro ess, whi h evi ts all the ele tron trapped until theevent of interest, for example the �ring pro ess in dating of pottery. Partialblea hing of the signal may prevent the age determination of the sample.Another ondition on erns the irradiation. Arti� ial doses must be ad-ministrated to the sample in order to determine the equivalent dose andto alibrate the signal. The natural signal is the result of a mixture of al-pha, beta and gamma irradiation and it is essential that arti� ial dose trulymimi s the natural pro esses. Laboratory irradiation an introdu e unstablesignals, whi h need to be removed before measuring the absorbed dose bypreheating the sample.Also the lifetime of the defe ts is important, to ensure that the signal hasnot faded during the burial period. Spe i� tests must be performed if thereis the suspe t that this phenomenon is a�e ting the sample. Signals must bestable over the period of interest, in ar haeologi al time s ale for pottery orgeologi al time s ale for sediments. For this reason a so alled plateau test isperformed. At low temperatures, the ratio of the natural signal divided bythe arti� ial irradiated signal is very small. As the temperature in reases,so too does this ratio, until above some temperature, typi ally 300◦C, a
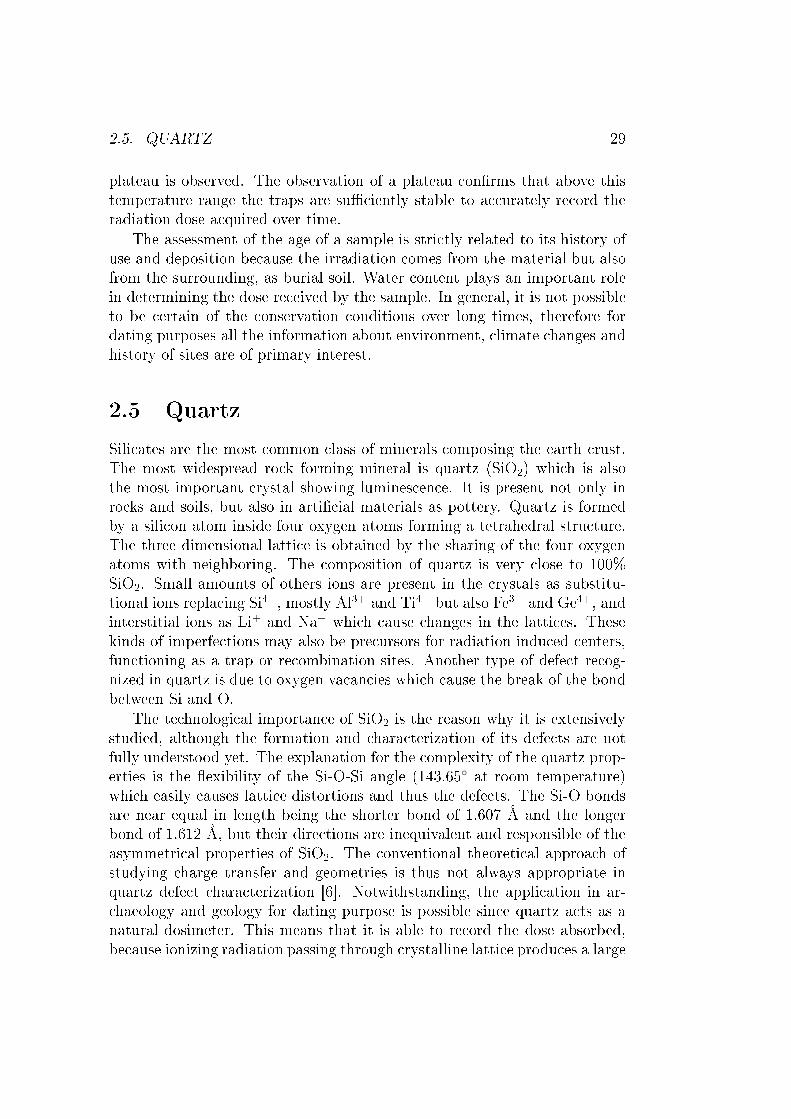
2.5. QUARTZ 29plateau is observed. The observation of a plateau on�rms that above thistemperature range the traps are su� iently stable to a urately re ord theradiation dose a quired over time.The assessment of the age of a sample is stri tly related to its history ofuse and deposition be ause the irradiation omes from the material but alsofrom the surrounding, as burial soil. Water ontent plays an important rolein determining the dose re eived by the sample. In general, it is not possibleto be ertain of the onservation onditions over long times, therefore fordating purposes all the information about environment, limate hanges andhistory of sites are of primary interest.2.5 QuartzSili ates are the most ommon lass of minerals omposing the earth rust.The most widespread ro k forming mineral is quartz (SiO2) whi h is alsothe most important rystal showing lumines en e. It is present not only inro ks and soils, but also in arti� ial materials as pottery. Quartz is formedby a sili on atom inside four oxygen atoms forming a tetrahedral stru ture.The three dimensional latti e is obtained by the sharing of the four oxygenatoms with neighboring. The omposition of quartz is very lose to 100%SiO2. Small amounts of others ions are present in the rystals as substitu-tional ions repla ing Si4+, mostly Al3+ and Ti4+ but also Fe3+ and Ge4+, andinterstitial ions as Li+ and Na+ whi h ause hanges in the latti es. Thesekinds of imperfe tions may also be pre ursors for radiation indu ed enters,fun tioning as a trap or re ombination sites. Another type of defe t re og-nized in quartz is due to oxygen va an ies whi h ause the break of the bondbetween Si and O.The te hnologi al importan e of SiO2 is the reason why it is extensivelystudied, although the formation and hara terization of its defe ts are notfully understood yet. The explanation for the omplexity of the quartz prop-erties is the �exibility of the Si-O-Si angle (143.65◦ at room temperature)whi h easily auses latti e distortions and thus the defe ts. The Si-O bondsare near equal in length being the shorter bond of 1.607 Å and the longerbond of 1.612 Å, but their dire tions are inequivalent and responsible of theasymmetri al properties of SiO2. The onventional theoreti al approa h ofstudying harge transfer and geometries is thus not always appropriate inquartz defe t hara terization [6℄. Notwithstanding, the appli ation in ar- haeology and geology for dating purpose is possible sin e quartz a ts as anatural dosimeter. This means that it is able to re ord the dose absorbed,be ause ionizing radiation passing through rystalline latti e produ es a large
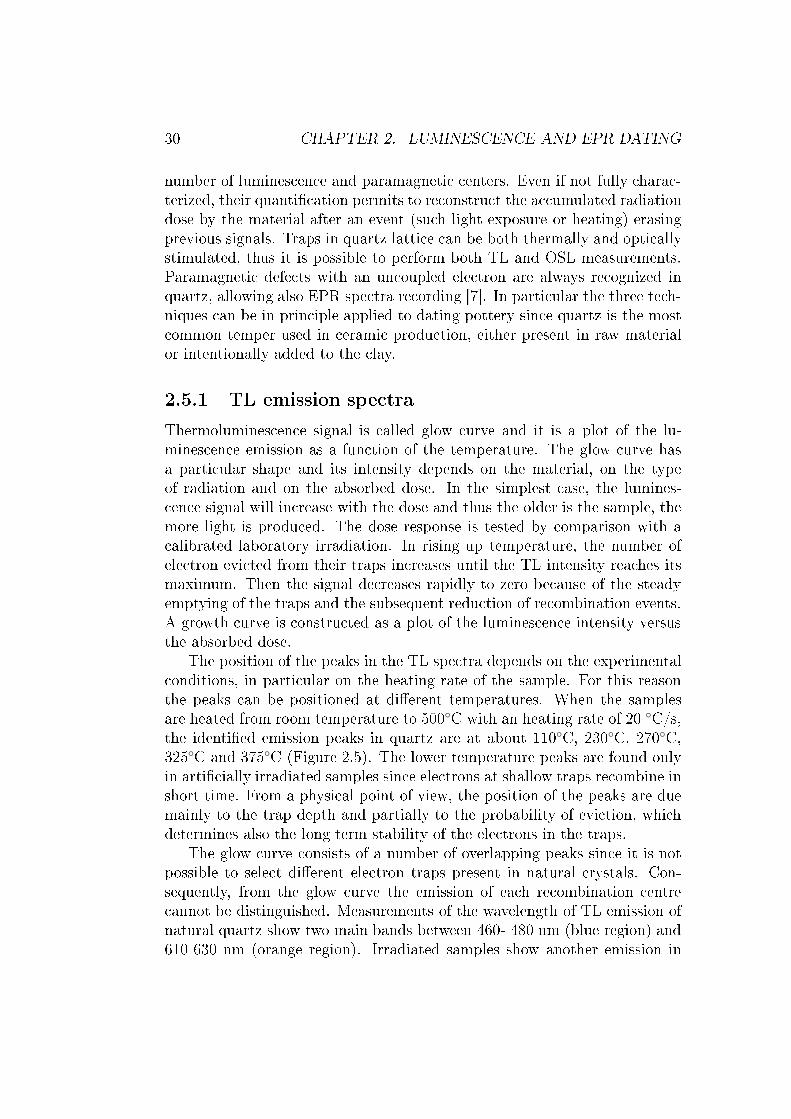
30 CHAPTER 2. LUMINESCENCE AND EPR DATINGnumber of lumines en e and paramagneti enters. Even if not fully hara -terized, their quanti� ation permits to re onstru t the a umulated radiationdose by the material after an event (su h light exposure or heating) erasingprevious signals. Traps in quartz latti e an be both thermally and opti allystimulated, thus it is possible to perform both TL and OSL measurements.Paramagneti defe ts with an un oupled ele tron are always re ognized inquartz, allowing also EPR spe tra re ording [7℄. In parti ular the three te h-niques an be in prin iple applied to dating pottery sin e quartz is the most ommon temper used in erami produ tion, either present in raw materialor intentionally added to the lay.2.5.1 TL emission spe traThermolumines en e signal is alled glow urve and it is a plot of the lu-mines en e emission as a fun tion of the temperature. The glow urve hasa parti ular shape and its intensity depends on the material, on the typeof radiation and on the absorbed dose. In the simplest ase, the lumines- en e signal will in rease with the dose and thus the older is the sample, themore light is produ ed. The dose response is tested by omparison with a alibrated laboratory irradiation. In rising up temperature, the number ofele tron evi ted from their traps in reases until the TL intensity rea hes itsmaximum. Then the signal de reases rapidly to zero be ause of the steadyemptying of the traps and the subsequent redu tion of re ombination events.A growth urve is onstru ted as a plot of the lumines en e intensity versusthe absorbed dose.The position of the peaks in the TL spe tra depends on the experimental onditions, in parti ular on the heating rate of the sample. For this reasonthe peaks an be positioned at di�erent temperatures. When the samplesare heated from room temperature to 500◦C with an heating rate of 20 ◦C/s,the identi�ed emission peaks in quartz are at about 110◦C, 230◦C, 270◦C,325◦C and 375◦C (Figure 2.5). The lower temperature peaks are found onlyin arti� ially irradiated samples sin e ele trons at shallow traps re ombine inshort time. From a physi al point of view, the position of the peaks are duemainly to the trap depth and partially to the probability of evi tion, whi hdetermines also the long term stability of the ele trons in the traps.The glow urve onsists of a number of overlapping peaks sin e it is notpossible to sele t di�erent ele tron traps present in natural rystals. Con-sequently, from the glow urve the emission of ea h re ombination entre annot be distinguished. Measurements of the wavelength of TL emission ofnatural quartz show two main bands between 460- 480 nm (blue region) and610-630 nm (orange region). Irradiated samples show another emission in
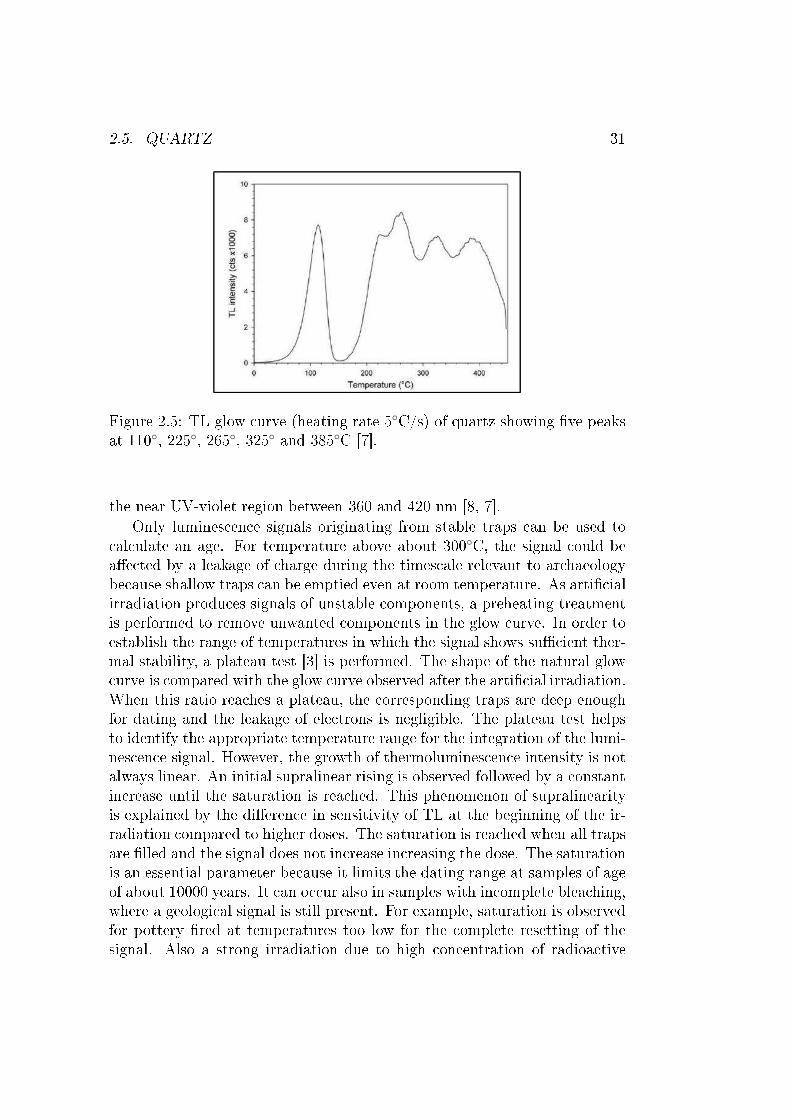
2.5. QUARTZ 31
Figure 2.5: TL glow urve (heating rate 5◦C/s) of quartz showing �ve peaksat 110◦, 225◦, 265◦, 325◦ and 385◦C [7℄.the near UV-violet region between 360 and 420 nm [8, 7℄.Only lumines en e signals originating from stable traps an be used to al ulate an age. For temperature above about 300◦C, the signal ould bea�e ted by a leakage of harge during the times ale relevant to ar haeologybe ause shallow traps an be emptied even at room temperature. As arti� ialirradiation produ es signals of unstable omponents, a preheating treatmentis performed to remove unwanted omponents in the glow urve. In order toestablish the range of temperatures in whi h the signal shows su� ient ther-mal stability, a plateau test [3℄ is performed. The shape of the natural glow urve is ompared with the glow urve observed after the arti� ial irradiation.When this ratio rea hes a plateau, the orresponding traps are deep enoughfor dating and the leakage of ele trons is negligible. The plateau test helpsto identify the appropriate temperature range for the integration of the lumi-nes en e signal. However, the growth of thermolumines en e intensity is notalways linear. An initial supralinear rising is observed followed by a onstantin rease until the saturation is rea hed. This phenomenon of supralinearityis explained by the di�eren e in sensitivity of TL at the beginning of the ir-radiation ompared to higher doses. The saturation is rea hed when all trapsare �lled and the signal does not in rease in reasing the dose. The saturationis an essential parameter be ause it limits the dating range at samples of ageof about 10000 years. It an o ur also in samples with in omplete blea hing,where a geologi al signal is still present. For example, saturation is observedfor pottery �red at temperatures too low for the omplete resetting of thesignal. Also a strong irradiation due to high on entration of radioa tive
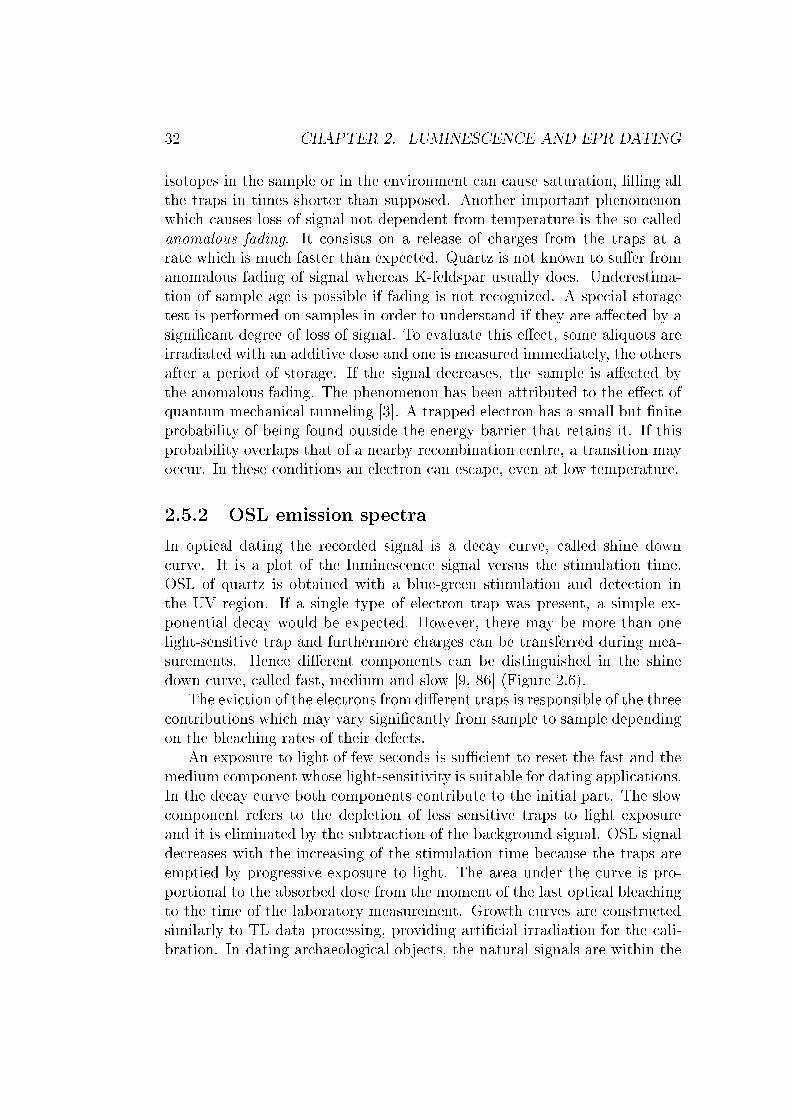
32 CHAPTER 2. LUMINESCENCE AND EPR DATINGisotopes in the sample or in the environment an ause saturation, �lling allthe traps in times shorter than supposed. Another important phenomenonwhi h auses loss of signal not dependent from temperature is the so alledanomalous fading. It onsists on a release of harges from the traps at arate whi h is mu h faster than expe ted. Quartz is not known to su�er fromanomalous fading of signal whereas K-feldspar usually does. Underestima-tion of sample age is possible if fading is not re ognized. A spe ial storagetest is performed on samples in order to understand if they are a�e ted by asigni� ant degree of loss of signal. To evaluate this e�e t, some aliquots areirradiated with an additive dose and one is measured immediately, the othersafter a period of storage. If the signal de reases, the sample is a�e ted bythe anomalous fading. The phenomenon has been attributed to the e�e t ofquantum me hani al tunneling [3℄. A trapped ele tron has a small but �niteprobability of being found outside the energy barrier that retains it. If thisprobability overlaps that of a nearby re ombination entre, a transition mayo ur. In these onditions an ele tron an es ape, even at low temperature.2.5.2 OSL emission spe traIn opti al dating the re orded signal is a de ay urve, alled shine down urve. It is a plot of the lumines en e signal versus the stimulation time.OSL of quartz is obtained with a blue-green stimulation and dete tion inthe UV region. If a single type of ele tron trap was present, a simple ex-ponential de ay would be expe ted. However, there may be more than onelight-sensitive trap and furthermore harges an be transferred during mea-surements. Hen e di�erent omponents an be distinguished in the shinedown urve, alled fast, medium and slow [9, 86℄ (Figure 2.6).The evi tion of the ele trons from di�erent traps is responsible of the three ontributions whi h may vary signi� antly from sample to sample dependingon the blea hing rates of their defe ts.An exposure to light of few se onds is su� ient to reset the fast and themedium omponent whose light-sensitivity is suitable for dating appli ations.In the de ay urve both omponents ontribute to the initial part. The slow omponent refers to the depletion of less sensitive traps to light exposureand it is eliminated by the subtra tion of the ba kground signal. OSL signalde reases with the in reasing of the stimulation time be ause the traps areemptied by progressive exposure to light. The area under the urve is pro-portional to the absorbed dose from the moment of the last opti al blea hingto the time of the laboratory measurement. Growth urves are onstru tedsimilarly to TL data pro essing, providing arti� ial irradiation for the ali-bration. In dating ar haeologi al obje ts, the natural signals are within the

2.5. QUARTZ 33
Figure 2.6: OSL shine down urve and its omponent.linear range of the growth urves be ause they are relatively young in om-parison with sediments. Thermally unstable omponents are eliminated bypreheating the samples before the light stimulation. As for TL urves, fromthe OSL emission spe tra is not possible the identi� ation of ele tron trapsand re ombination enters.2.5.3 EPR spe traThe EPR spe trum is the plot of the mi rowave absorption as a fun tionof the magneti �eld intensity. The spe trum may onsist of one or moreabsorption lines whi h are hara terized by some parameters. First of all,the magneti �eld at whi h the absorption o urs de�nes the position of thesignal. Line width and shape give information about the stru ture of thesample. When many lines are present, their number, separation and rela-tive intensity give information about the spin system. Sin e spe tra an bere orded at di�erent frequen ies, a parameter independent from the measure-ment onditions is needed for the identi� ation of the spe ies in the samples.The g fa tor is used for the distin tion of the di�erent lines in a spe trumbe ause its value is determined only by the lo al environment within thematerial. The g fa tor for a free ele tron is 2.0023. Deviations from thisvalue are due mainly to spin-orbit oupling between the ground state andex ited states. The orientation of the mole ular orbitals is responsible ofthe anisotropy of the g fa tor. In a rystal stru ture, the g fa tor hangesrotating the sample in the spe trometer. In disordered samples, the orienta-tion with respe t to the external magneti �eld is randomly distributed and
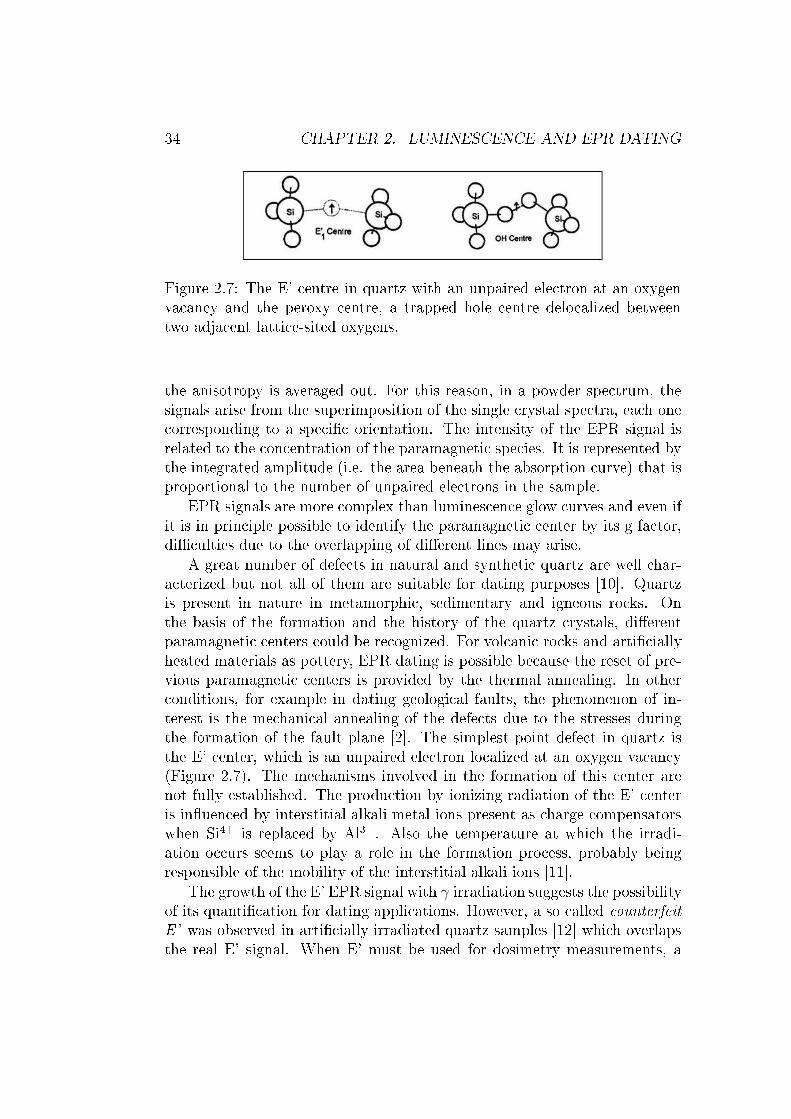
34 CHAPTER 2. LUMINESCENCE AND EPR DATINGFigure 2.7: The E' entre in quartz with an unpaired ele tron at an oxygenva an y and the peroxy entre, a trapped hole entre delo alized betweentwo adja ent latti e-sited oxygens.the anisotropy is averaged out. For this reason, in a powder spe trum, thesignals arise from the superimposition of the single rystal spe tra, ea h one orresponding to a spe i� orientation. The intensity of the EPR signal isrelated to the on entration of the paramagneti spe ies. It is represented bythe integrated amplitude (i.e. the area beneath the absorption urve) that isproportional to the number of unpaired ele trons in the sample.EPR signals are more omplex than lumines en e glow urves and even ifit is in prin iple possible to identify the paramagneti enter by its g fa tor,di� ulties due to the overlapping of di�erent lines may arise.A great number of defe ts in natural and syntheti quartz are well har-a terized but not all of them are suitable for dating purposes [10℄. Quartzis present in nature in metamorphi , sedimentary and igneous ro ks. Onthe basis of the formation and the history of the quartz rystals, di�erentparamagneti enters ould be re ognized. For vol ani ro ks and arti� iallyheated materials as pottery, EPR dating is possible be ause the reset of pre-vious paramagneti enters is provided by the thermal annealing. In other onditions, for example in dating geologi al faults, the phenomenon of in-terest is the me hani al annealing of the defe ts due to the stresses duringthe formation of the fault plane [2℄. The simplest point defe t in quartz isthe E' enter, whi h is an unpaired ele tron lo alized at an oxygen va an y(Figure 2.7). The me hanisms involved in the formation of this enter arenot fully established. The produ tion by ionizing radiation of the E' enteris in�uen ed by interstitial alkali metal ions present as harge ompensatorswhen Si4+ is repla ed by Al3+. Also the temperature at whi h the irradi-ation o urs seems to play a role in the formation pro ess, probably beingresponsible of the mobility of the interstitial alkali ions [11℄.The growth of the E' EPR signal with γ irradiation suggests the possibilityof its quanti� ation for dating appli ations. However, a so alled ounterfeitE' was observed in arti� ially irradiated quartz samples [12℄ whi h overlapsthe real E' signal. When E' must be used for dosimetry measurements, a
2.5. QUARTZ 35
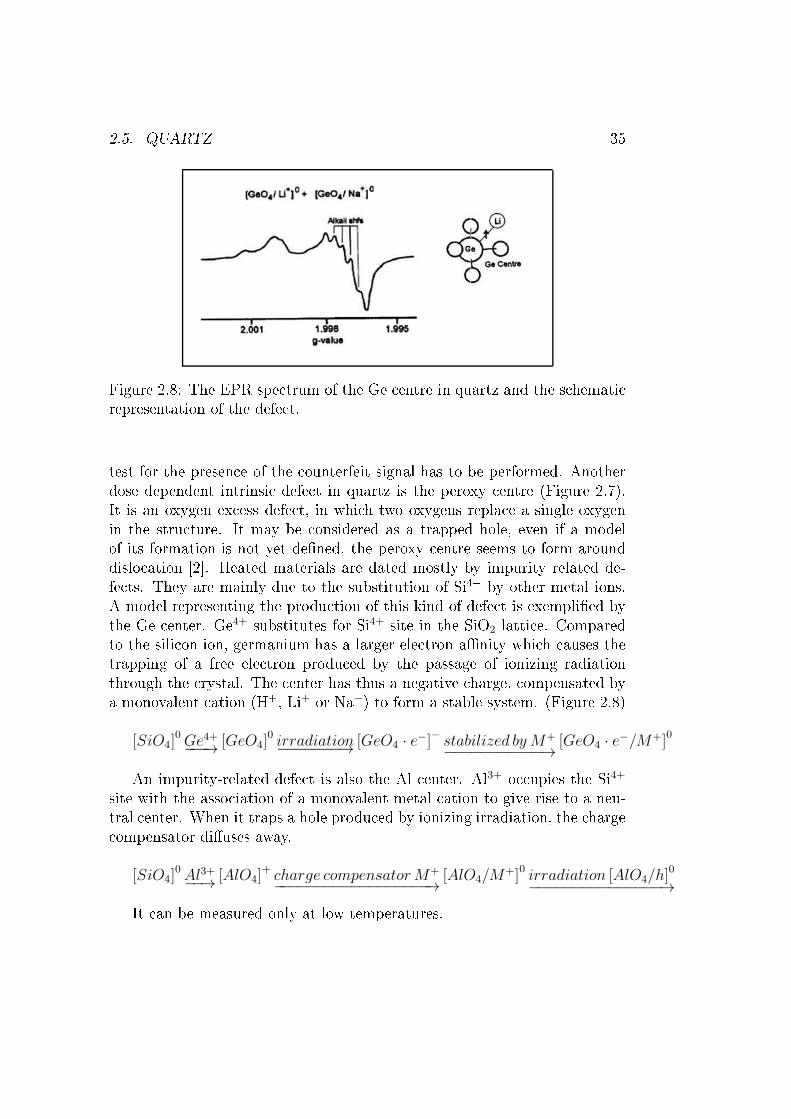
Figure 2.8: The EPR spe trum of the Ge entre in quartz and the s hemati representation of the defe t.test for the presen e of the ounterfeit signal has to be performed. Anotherdose dependent intrinsi defe t in quartz is the peroxy entre (Figure 2.7).It is an oxygen ex ess defe t, in whi h two oxygens repla e a single oxygenin the stru ture. It may be onsidered as a trapped hole, even if a modelof its formation is not yet de�ned, the peroxy entre seems to form arounddislo ation [2℄. Heated materials are dated mostly by impurity related de-fe ts. They are mainly due to the substitution of Si4+ by other metal ions.A model representing the produ tion of this kind of defe t is exempli�ed bythe Ge enter. Ge4+ substitutes for Si4+ site in the SiO2 latti e. Comparedto the sili on ion, germanium has a larger ele tron a�nity whi h auses thetrapping of a free ele tron produ ed by the passage of ionizing radiationthrough the rystal. The enter has thus a negative harge, ompensated bya monovalent ation (H+, Li+ or Na+) to form a stable system. (Figure 2.8)[SiO4]
0Ge4+−−−→
[GeO4]0 irradiation−−−−−−−→
[GeO4 · e−]
−
stabilized by M+
−−−−−−−−−−−→[GeO4 · e
−/M+]0An impurity-related defe t is also the Al enter. Al3+ o upies the Si4+site with the asso iation of a monovalent metal ation to give rise to a neu-tral enter. When it traps a hole produ ed by ionizing irradiation, the harge ompensator di�uses away.
[SiO4]0Al3+−−→
[AlO4]+ charge compensatorM+
−−−−−−−−−−−−−−−−−−→[AlO4/M
+]0irradiation [AlO4/h]
0
−−−−−−−−−−−−−−−→It an be measured only at low temperatures.

36 CHAPTER 2. LUMINESCENCE AND EPR DATING
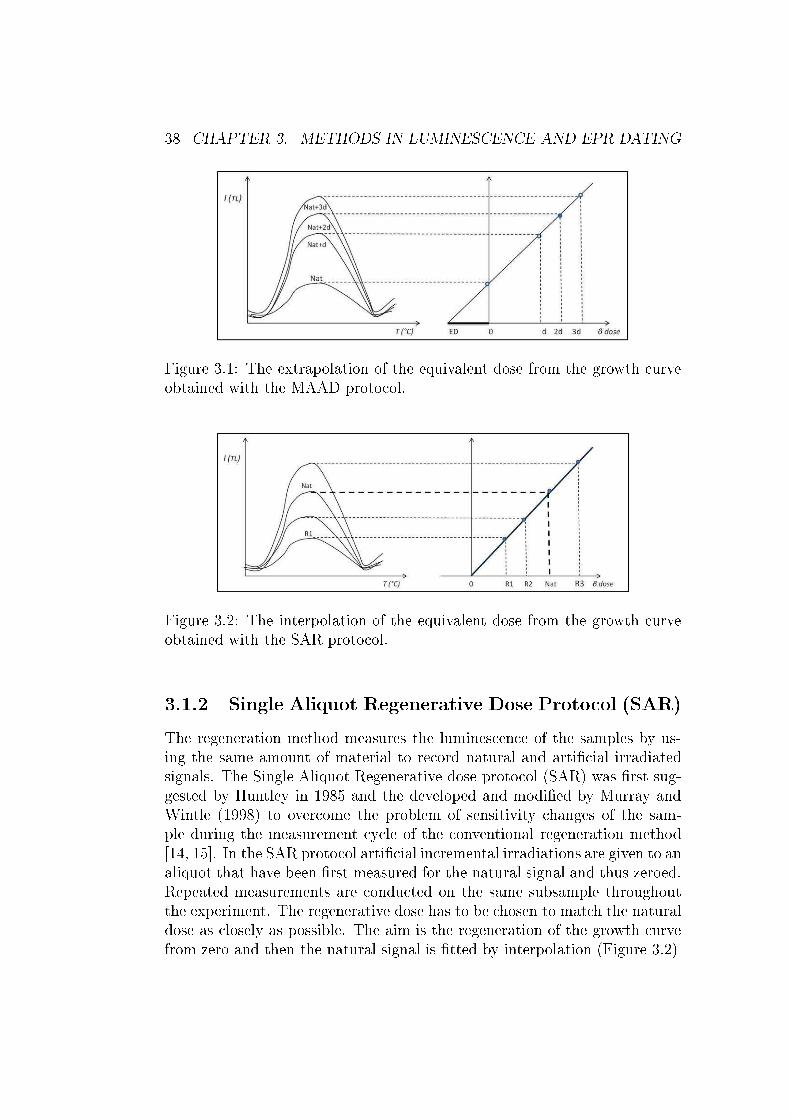
Chapter 3Methods in Lumines en e andEPR dating3.1 Equivalent dose determination methods3.1.1 Multiple Aliquot Additive Dose (MAAD)The additive dose method is the proto ol usually adopted in the TL dating ofpottery. Many aliquots of the sample are used in order to obtain the growth urve, but ea h of them an only be measured on e. The total radiation dosethat has been deposited on the sample an be determined by omparing thesignal from the sample in the natural state with that indu ed by exposureto an arti� ial sour e of irradiation. Natural TL is measured for 4 di�er-ent aliquots while other subsamples are given di�erent arti� ial alibrateddoses whi h adds up to the natural signal. A growth urve is onstru tedby plotting the lumines en e signals as a fun tion of the delivered dose. Thenatural signal is the lowest point on this urve, whi h is then extrapolatedba k to zero to estimate the equivalent dose (ED in Figure 3.1).This methodis based on the assumption that all the aliquots have the same lumines en eresponse. If the reprodu ibility is low, a large error a�e ts the equivalent doseestimation. The strength of the pro edure is that the response to laboratorydose is not altered by any zeroing pro edure. The equivalent dose is obtainedindependently from the experimental data set and depends upon the math-emati al expression used [13, 8℄. EPR dating employs the same proto ol ofTL, but several measurements an be performed on the same aliquot sin ethe signal is not erased by the experimental pro edure.37
38 CHAPTER 3. METHODS IN LUMINESCENCE AND EPR DATING
Figure 3.1: The extrapolation of the equivalent dose from the growth urveobtained with the MAAD proto ol.
Figure 3.2: The interpolation of the equivalent dose from the growth urveobtained with the SAR proto ol.3.1.2 Single Aliquot Regenerative Dose Proto ol (SAR)The regeneration method measures the lumines en e of the samples by us-ing the same amount of material to re ord natural and arti� ial irradiatedsignals. The Single Aliquot Regenerative dose proto ol (SAR) was �rst sug-gested by Huntley in 1985 and the developed and modi�ed by Murray andWintle (1998) to over ome the problem of sensitivity hanges of the sam-ple during the measurement y le of the onventional regeneration method[14, 15℄. In the SAR proto ol arti� ial in remental irradiations are given to analiquot that have been �rst measured for the natural signal and thus zeroed.Repeated measurements are ondu ted on the same subsample throughoutthe experiment. The regenerative dose has to be hosen to mat h the naturaldose as losely as possible. The aim is the regeneration of the growth urvefrom zero and then the natural signal is �tted by interpolation (Figure 3.2)
3.1. EQUIVALENT DOSE DETERMINATION METHODS 39The steps of the SAR proto ol are:1. Preheat2. OSL (TL): L03. Test Dose4. Preheat5. OSL (TL): T06. Dose Di7. Preheat8. OSL (TL): Li9. Test Dose10. Preheat11. OSL (TL):Ti12. Repeat steps 6-11 with di�erent DiThe preheat treatment is able to remove the harge in the shallow traps.However, the subsequent heating after ea h irradiation of the sample hangesthe lumines en e sensitivity. This means that di�erent doses of arti� ial ir-radiation are needed to produ e the same amount of lumines en e. Therate of trap �lling ould hange the lumines en e e� ien y and subsequentsignals from the arti� ial irradiation are not omparable. To over ome theproblem of sensitivity hanges asso iated with repeated irradiations, preheatand stimulation, a orre tion is al ulated on the basis of the test dose. It onsists on a small irradiation (about 10% of the assumed natural signal), onstant during all the sequen e of the experiment, delivered to the sampleafter ea h lumines en e measurement. The signal of the test dose has thesame sensitivity as the pre eding signal and thus it an be used as a or-re tion to equalize the sensitivity of the natural and subsequent regeneratedsignal. The urves of the natural and irradiated signals are integrated in anappropriate time interval. In this way the L0 value for the natural signaland the Li values for the irradiation are al ulated. Similarly the T0 andthe Ti values for the test dose are assessed. The ratio Li/Ti is plotted as afun tion of the dose to onstru t the growth urve. The interpolation of theL0/T0 allows obtaining the equivalent dose. The so alled Re uperation Test
40 CHAPTER 3. METHODS IN LUMINESCENCE AND EPR DATINGis the measurement of a zero dose to he k the presen e of unwanted signalsthat the irradiation and the heating treatments ould have produ ed. Themeasurements should give zero signals but transfer of harge from deepertraps an o ur be ause of previous irradiation and stimulation. If a signalis re orded, it should not ex eed 5% of the equivalent dose to be onsid-ered negligible. At the end of the y le the �rst regeneration dose after thenatural signal measurement is repeated to verify if the same urve is repro-du ed. This is alled Re y ling Ratio Test. Usually the �rst dose deliveredto the aliquot is hosen be ause the sensitivity hanges progressively. Thusthe �rst and last measurements will give the maximum spread in sensitivity hange. The ratio of the sensitivity orre ted data (Li/Ti)/(L1/T1) should beunity but the range of a eptability ranges from 0.90 to 1.10 for experimentaldata [16℄. Over the traditional multiple aliquot method, the normalizationbetween measurements is not ne essary be ause using only one aliquot ofsample there are not variations in weight or mineralogy. The experiment isrepeated over several aliquots of ea h sample, resulting in di�erent equiva-lent dose estimations whi h are averaged. However, the number of aliquotsrequired for SAR proto ol is smaller than the one employed for the MAADmethod. This is important in working on ar haeologi al materials or whensmall-sized samples are available. Furthermore, less e�ort is needed for theminerals separation, if required. A great advantage of SAR proto ol is alsothe elimination of the ompli ation related to aliquot dependent variations inlumines en e hara teristi s [8, 16℄. The SAR proto ol is usually applied inOSL dating of unheated material. The advantages of this approa h over thetraditional MAAD te hnique for potteries suggested the attempt to apply italso to heated materials. To date, few appli ations of SAR TL of potteryhave been published [17, 18, 19℄ but the results are in agreement with thoseobtained by MAAD proto ol. For EPR dating, SAR proto ol an be appliedonly if an annealing treatment an be performed before the regenerative ir-radiation. In quartz dosimetri studies, arti� ial heating has proven to bethe most e� ient zeroing pro edure [20℄.3.2 Thermolumines en e (TL)3.2.1 Fine grain and Quartz in lusion te hniquesIn lumines en e dating, samples are divided in several aliquots for the mea-surement of the natural and arti� ially generated signal. There are two basi te hniques for dating pottery, di�ering in sample preparation and mineralsused for re ording thermolumines en e. In the so alled �ne grain te hnique,
3.3. OPTICALLY STIMULATED LUMINESCENCE (OSL) 41all the material is used without any mineralogi al separation. The externallayer is removed to avoid any ontamination and then the inner portion isdrilled. A grain size separation in a etone suspension is needed to olle tthe useful fra tion of 4-11 mi rons. This grain size re eives the full alphadose sin e the diameter is smaller than the average alpha parti le range insili ates (∼- 20µm). In the quartz in lusion te hnique both physi al and hemi al treatments of the sample are required in order to extra t the sand-sized ( oarse) grains of quartz from the pottery matrix. The grain size isbetween 80 and 150 mi rons thus only the outer part of the grains re eivesthe alpha dose from the environment. It is therefore ne essary the al ula-tion of its ontribution or its deletion by removing the external skin witha hemi al et hing. This is a hievable be ause neither quartz nor feldsparhas internal sour es of alpha irradiation, thus all the alpha dose omes en-tirely from the surrounding soil. Coarse grain has the advantage of involvingonly one mineral with known lumines en e properties. However, the oarsegrain fra tion in ar haeology ould be di� ult to be exploited, sin e potterynot always presents abundant in lusions of the right size. Otherwise, forthe mineral separation a quite large amount of erami is needed and thisrequirement is often not satis�ed when working on ar haeologi al �ndings.3.3 Opti ally Stimulated Lumines en e (OSL)3.3.1 Prin iples of OSL datingMany features of TL and OSL dating are very similar be ause the underlyingprin iples of the two te hniques are the same. The major di�eren e is theenergy used to empty the ele tron traps during the measurements. In OSLthe stimulation is performed by light, for this reason the method is also alledopti al dating. The re ombination between ele trons evi ted from the trapswith holes emits a lumines en e that an be olle ted and quanti�ed. Theresetting of the OSL signal is alled blea hing: to avoid this phenomenonbefore measurement, the sampling and the preparation of the material areperformed in subdued red light. OSL is suitable for dating purpose be auseit is possible to orrelate the intensity of the re ombination emission to theelapsed time sin e the last exposure to light. If the duration of the exposureis insu� ient for full resetting (partial blea hing), the measured signal willnot be an indi ation of the event to be dated. Unlike TL, it is not possibleto distinguish shallow and deeper traps. A sour e of light of appropriatewavelength and intensity is hosen on the basis of the minerals present inthe sample to indu e the transition of the ele trons from the traps to the

42 CHAPTER 3. METHODS IN LUMINESCENCE AND EPR DATING ondu tion band. The emission related to the re ombination of ele tronsand holes is monitored as a fun tion of the stimulation time. The integral ofthe lumines en e signal is a measure of the radiation dose absorbed by thesample sin e it was last exposed to light. OSL in ludes stimulation not onlyfrom the visible region of the ele tromagneti spe trum but also from IR andUV radiation. The rate of emptying of the traps is dependent from the rateof in ident photons (lighting power). Unlike TL, it is possible to observethe lumines en e from quartz and from feldspars separately be ause of theirdi�erent range of emission. Quartz emits between 360 to 420 nm (near UV-Violet), while feldspars emit lumines en e at 390-440 nm (Violet to Blue).As for TL, also in OSL measurements the phenomenon of anomalous fadinghas to be taken into a ount. The proto ols to measure and orre t the ob-tained ages are based on the omparison of lumines en e intensities measuredshortly after the irradiation with those measured after some time delay [21℄.The approa h adopted for OSL measurements is the SAR proto ol (subse -tion 3.1.2), applied mainly to sediment dating, the �eld of the developmentof this method. Some re ent studies have demonstrated that OSL SAR issuitable also for dating ar haeologi al heated materials as pottery.3.3.2 OSL of heated materialsOSL is a well established method for age estimation of sediments. Even ifthere are not onventional pro edures for pottery dating by OSL, there aresome examples of omparison of ages al ulated with traditional MAAD andSAR proto ols, both with TL and OSL. The quartz in lusion te hnique andSAR proto ol (OSL and TL) were applied to late medieval bri ks, whose al ulated ages are in agreement with the ar hite tural ontext [17, 22℄. At-tempts of opti al dating of ar haeologi al pottery by quartz in lusion weresu essfully made also by Barnett [23℄. Fine grain samples were dated byLeung [24℄ and Oke [25℄. In general the use of TL has been often supple-mented by opti al dating methods and in parti ular SAR OSL is a pro eduremore pra ti able when the TL sensitivity of the quartz grains is poor and theavailability of datable material is limited [26℄. In applying OSL for datingof pottery it is important to be sure of the omplete blea hing of the signalduring the manufa turing steps in order to avoid overestimation of the ages.
3.4. ELECTRON PARAMAGNETIC RESONANCE (EPR) 433.4 Ele tron Paramagneti Resonan e (EPR)3.4.1 EPR datingEPR is be oming an important tool in radiation s ien e, an interdis iplinary�eld in orporating appli ations in medi al physi s, radiation dosimetry, geo- hronology and ar haeology. Ele tron Spin Resonan e (ESR) or Ele tronParamagneti Resonan e (EPR) is a magneti spe tros opy able to dete tthe absorption of mi rowaves by unpaired ele trons under the e�e t of astrong magneti �eld. Unpaired ele trons are present in free radi als, in rystalline latti e defe ts and in transition metals ions: these spe ies are inprin iple dete table by means of EPR. Dating through EPR like the lumines- en e te hnique belongs to the ategory of radiation indu ed defe t datingsin e it quanti�es the radiation e�e ts a umulated in time. Radiation dose an be determined from the EPR signal intensity of radiation indu ed param-agneti defe ts whi h is proportional to the number of latti e defe ts housingunpaired ele trons. In many materials the traps are metastable, be ause,although the release of trapped harges is energeti ally favored, the a tiva-tion energy is too high for a spontaneous release, resulting in the very longlifetime of defe t entres. EPR spe tros opy is a non-interfering method al-lowing the measurement of the total dose absorbed by the sample. Di�erentlyfrom lumines en e te hniques, EPR is a magneti spe tros opy dealing withthe spin transitions between ele tron states of di�erent energies. EPR mea-sures dire tly the on entration of trapped harges in a spe i� trap, withoutthe re ombination of the ele trons with the holes during measurements. EPRdating is possible sin e the signal intensity is proportional to the total dose towhi h the sample was exposed. The time elapsed from the last zeroing of thetrapped harges an be al ulated by dividing the total dose absorbed by thesample with the estimated annual dose. For radiation exposures onsiderablyshorter than the lifetime of the trapped harges, the harge on entration inthese traps will be dire tly related to the a umulated dose. Not all thesignals satisfy the previous statements so the �rst step of EPR dating is theidenti� ation of the appropriate signal on the basis of its lifetime and itsdependen e on the radiation dose for the spe i� material. Sin e the signalis not erased by the measurements, the proto ol usually applied for dating isthe Multiple Aliquot Additive Dose (subse tion 3.1.1) with the onstru tionof a growth urve from whi h the total absorbed dose an be extrapolated.The time range overed by EPR dating depends on the sensitivity of thespe trometer and on the presen e of interfering ba kground signals. Trapempting (blea hing - annealing) is less riti al in EPR than in TL and OSL.EPR an rarely provide ages with un ertainties <10%. The dated material
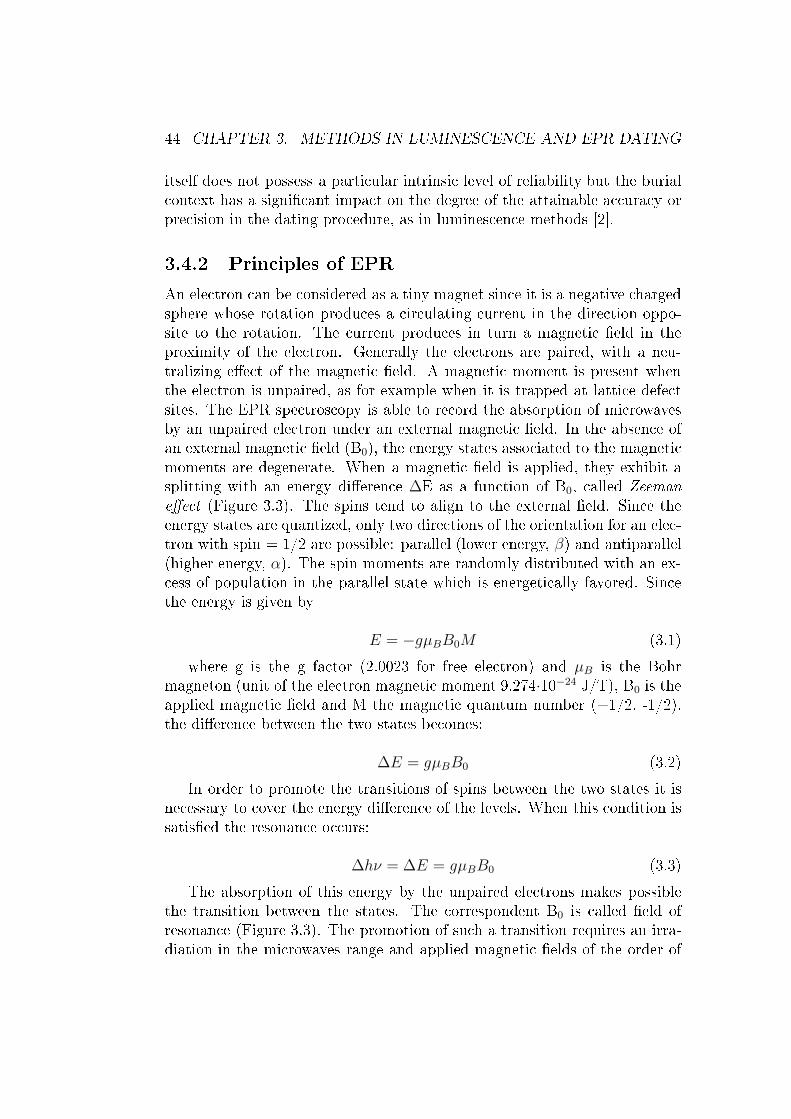
44 CHAPTER 3. METHODS IN LUMINESCENCE AND EPR DATINGitself does not possess a parti ular intrinsi level of reliability but the burial ontext has a signi� ant impa t on the degree of the attainable a ura y orpre ision in the dating pro edure, as in lumines en e methods [2℄.3.4.2 Prin iples of EPRAn ele tron an be onsidered as a tiny magnet sin e it is a negative hargedsphere whose rotation produ es a ir ulating urrent in the dire tion oppo-site to the rotation. The urrent produ es in turn a magneti �eld in theproximity of the ele tron. Generally the ele trons are paired, with a neu-tralizing e�e t of the magneti �eld. A magneti moment is present whenthe ele tron is unpaired, as for example when it is trapped at latti e defe tsites. The EPR spe tros opy is able to re ord the absorption of mi rowavesby an unpaired ele tron under an external magneti �eld. In the absen e ofan external magneti �eld (B0), the energy states asso iated to the magneti moments are degenerate. When a magneti �eld is applied, they exhibit asplitting with an energy di�eren e ∆E as a fun tion of B0, alled Zeemane�e t (Figure 3.3). The spins tend to align to the external �eld. Sin e theenergy states are quantized, only two dire tions of the orientation for an ele -tron with spin = 1/2 are possible: parallel (lower energy, β) and antiparallel(higher energy, α). The spin moments are randomly distributed with an ex- ess of population in the parallel state whi h is energeti ally favored. Sin ethe energy is given byE = −gµBB0M (3.1)where g is the g fa tor (2.0023 for free ele tron) and µB is the Bohrmagneton (unit of the ele tron magneti moment 9.274·10−24 J/T), B0 is theapplied magneti �eld and M the magneti quantum number (+1/2, -1/2),the di�eren e between the two states be omes:∆E = gµBB0 (3.2)In order to promote the transitions of spins between the two states it isne essary to over the energy di�eren e of the levels. When this ondition issatis�ed the resonan e o urs:
∆hν = ∆E = gµBB0 (3.3)The absorption of this energy by the unpaired ele trons makes possiblethe transition between the states. The orrespondent B0 is alled �eld ofresonan e (Figure 3.3). The promotion of su h a transition requires an irra-diation in the mi rowaves range and applied magneti �elds of the order of
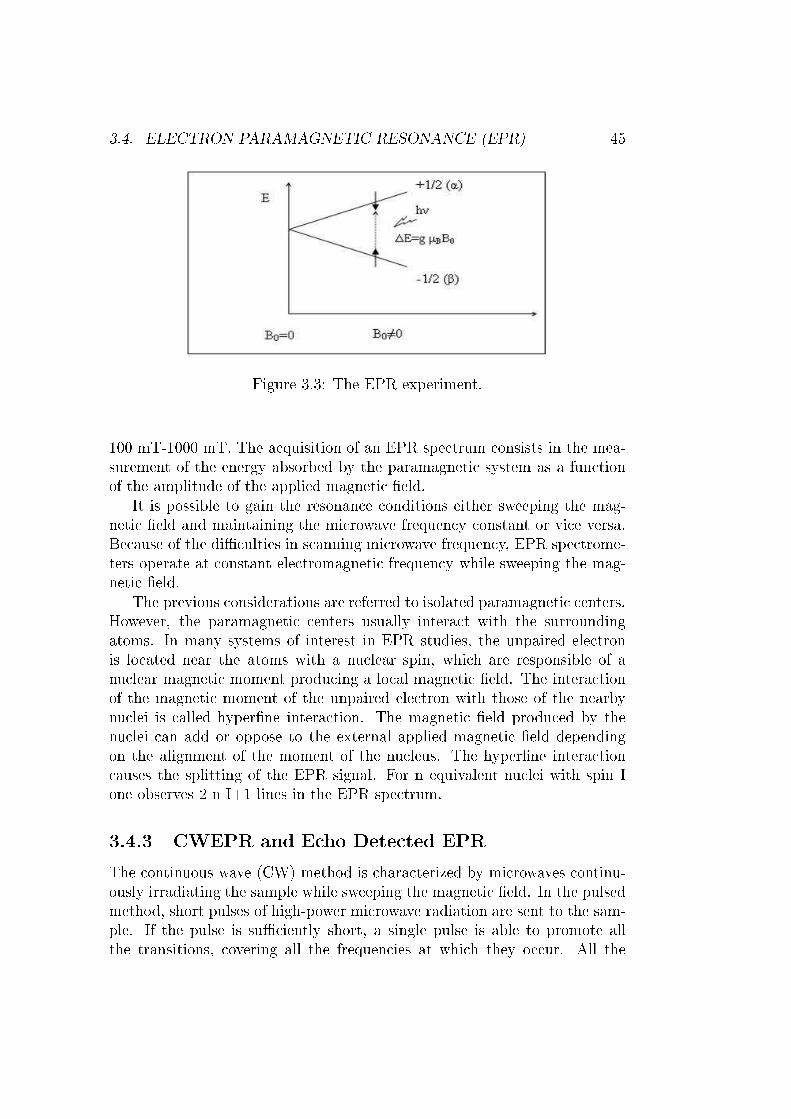
3.4. ELECTRON PARAMAGNETIC RESONANCE (EPR) 45
Figure 3.3: The EPR experiment.100 mT-1000 mT. The a quisition of an EPR spe trum onsists in the mea-surement of the energy absorbed by the paramagneti system as a fun tionof the amplitude of the applied magneti �eld.It is possible to gain the resonan e onditions either sweeping the mag-neti �eld and maintaining the mi rowave frequen y onstant or vi e versa.Be ause of the di� ulties in s anning mi rowave frequen y, EPR spe trome-ters operate at onstant ele tromagneti frequen y while sweeping the mag-neti �eld.The previous onsiderations are referred to isolated paramagneti enters.However, the paramagneti enters usually intera t with the surroundingatoms. In many systems of interest in EPR studies, the unpaired ele tronis lo ated near the atoms with a nu lear spin, whi h are responsible of anu lear magneti moment produ ing a lo al magneti �eld. The intera tionof the magneti moment of the unpaired ele tron with those of the nearbynu lei is alled hyper�ne intera tion. The magneti �eld produ ed by thenu lei an add or oppose to the external applied magneti �eld dependingon the alignment of the moment of the nu leus. The hyper�ne intera tion auses the splitting of the EPR signal. For n equivalent nu lei with spin Ione observes 2 n I+1 lines in the EPR spe trum.3.4.3 CWEPR and E ho Dete ted EPRThe ontinuous wave (CW) method is hara terized by mi rowaves ontinu-ously irradiating the sample while sweeping the magneti �eld. In the pulsedmethod, short pulses of high-power mi rowave radiation are sent to the sam-ple. If the pulse is su� iently short, a single pulse is able to promote allthe transitions, overing all the frequen ies at whi h they o ur. All the
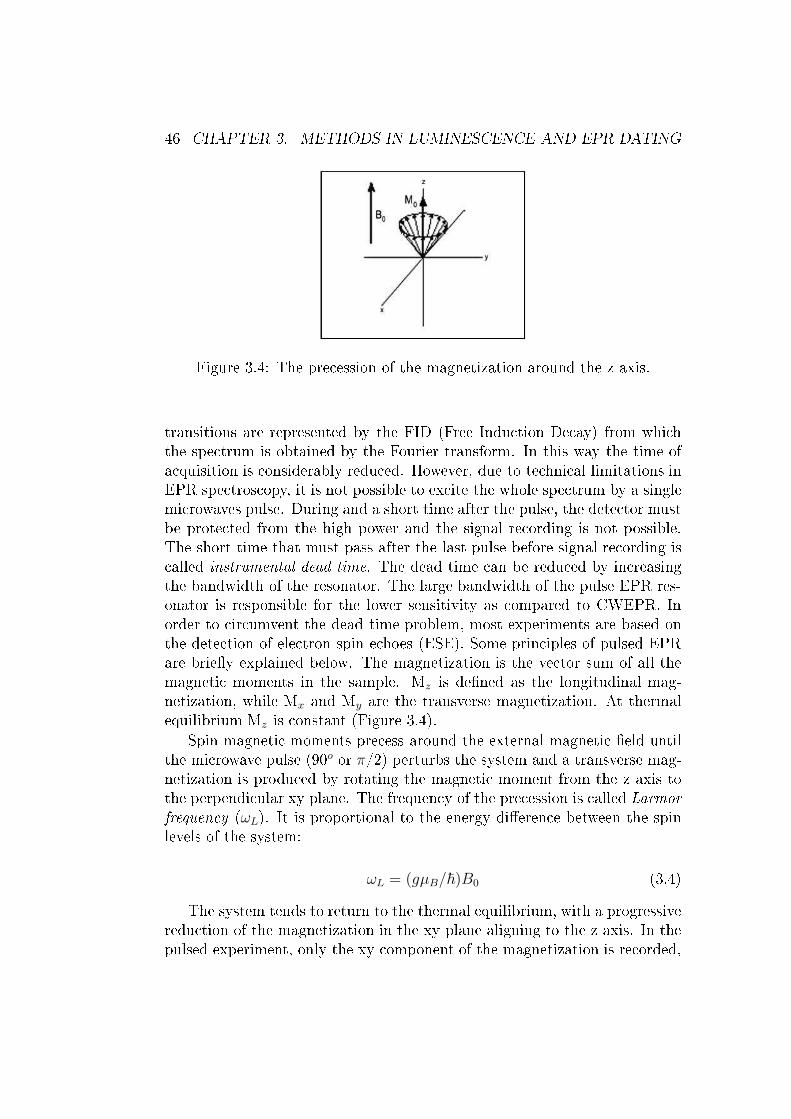
46 CHAPTER 3. METHODS IN LUMINESCENCE AND EPR DATING
Figure 3.4: The pre ession of the magnetization around the z axis.transitions are represented by the FID (Free Indu tion De ay) from whi hthe spe trum is obtained by the Fourier transform. In this way the time ofa quisition is onsiderably redu ed. However, due to te hni al limitations inEPR spe tros opy, it is not possible to ex ite the whole spe trum by a singlemi rowaves pulse. During and a short time after the pulse, the dete tor mustbe prote ted from the high power and the signal re ording is not possible.The short time that must pass after the last pulse before signal re ording is alled instrumental dead time. The dead time an be redu ed by in reasingthe bandwidth of the resonator. The large bandwidth of the pulse EPR res-onator is responsible for the lower sensitivity as ompared to CWEPR. Inorder to ir umvent the dead time problem, most experiments are based onthe dete tion of ele tron spin e hoes (ESE). Some prin iples of pulsed EPRare brie�y explained below. The magnetization is the ve tor sum of all themagneti moments in the sample. Mz is de�ned as the longitudinal mag-netization, while Mx and My are the transverse magnetization. At thermalequilibrium Mz is onstant (Figure 3.4).Spin magneti moments pre ess around the external magneti �eld untilthe mi rowave pulse (90o or π/2) perturbs the system and a transverse mag-netization is produ ed by rotating the magneti moment from the z axis tothe perpendi ular xy plane. The frequen y of the pre ession is alled Larmorfrequen y (ωL). It is proportional to the energy di�eren e between the spinlevels of the system:ωL = (gµB/~)B0 (3.4)The system tends to return to the thermal equilibrium, with a progressiveredu tion of the magnetization in the xy plane aligning to the z axis. In thepulsed experiment, only the xy omponent of the magnetization is re orded,
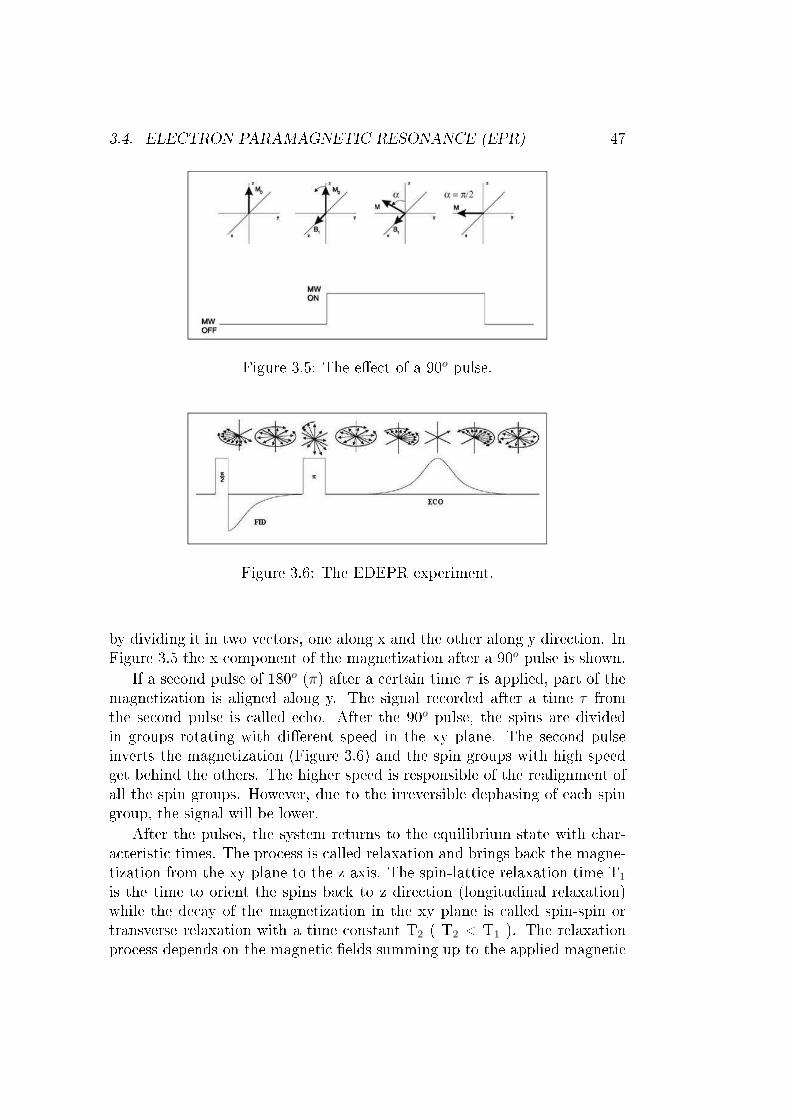
3.4. ELECTRON PARAMAGNETIC RESONANCE (EPR) 47
Figure 3.5: The e�e t of a 90o pulse.
Figure 3.6: The EDEPR experiment.by dividing it in two ve tors, one along x and the other along y dire tion. InFigure 3.5 the x omponent of the magnetization after a 90o pulse is shown.If a se ond pulse of 180o (π) after a ertain time τ is applied, part of themagnetization is aligned along y. The signal re orded after a time τ fromthe se ond pulse is alled e ho. After the 90o pulse, the spins are dividedin groups rotating with di�erent speed in the xy plane. The se ond pulseinverts the magnetization (Figure 3.6) and the spin groups with high speedget behind the others. The higher speed is responsible of the realignment ofall the spin groups. However, due to the irreversible dephasing of ea h spingroup, the signal will be lower.After the pulses, the system returns to the equilibrium state with har-a teristi times. The pro ess is alled relaxation and brings ba k the magne-tization from the xy plane to the z axis. The spin-latti e relaxation time T1is the time to orient the spins ba k to z dire tion (longitudinal relaxation)while the de ay of the magnetization in the xy plane is alled spin-spin ortransverse relaxation with a time onstant T2 ( T2 < T1 ). The relaxationpro ess depends on the magneti �elds summing up to the applied magneti
48 CHAPTER 3. METHODS IN LUMINESCENCE AND EPR DATING�eld. They are generated by nu lear magneti moments nearby the spins.When they have omponents rotating at the Larmor frequen y, they indu espin transitions responsible for the longitudinal relaxation. The omponentsof lower frequen y are responsible for the dephasing of the magnetizationon the xy plane thus in�uen ing the transverse relaxation. The relaxationtimes provide information about the stru ture of the sample, being hara -teristi parameters of the spin system. The E ho Dete ted EPR (EDEPR)experiment onsists in applying a pulse sequen e while sweeping the mag-neti �eld. The e ho intensity is re orded for ea h value of the magneti �eld. The e ho represents the transverse magnetization, therefore, in the ab-sen e of relaxation pro esses, its intensity as a fun tion of the magneti �eldshould represent the magnetization along z in the same interval. However,the relaxations are responsible for the de ay of the transverse magnetizationwhi h is thus lower than the thermal equilibrium magnetization. In su h onditions the EDEPR spe trum is the same re orded by CWEPR but withlower intensity1. The relaxation is di�erent at di�erent values of the magneti �eld and the EDEPR spe trum is therefore di�erent from the orrespondingCW spe trum. This is due to the di�eren e in relaxation times. For spe ies hara terized by very short relaxation times, the magnetization ould be ompletely de ayed during the pulse sequen e and no ontribution to thespin e ho is re orded. This is a limiting fa tor be ause not all the spe ies an be studied by EDEPR spe tros opy, but it ould also be a powerful toolto separate overlapping signals a ording to their relaxation times.3.5 Annual doseThe annual dose is the energy absorbed per mass unit by the sample fromthe environment and from the material itself in a year. The annual dose is anestimation be ause it is al ulated on the basis of present data and it does nottake into a ount possible variations o urred during the burial period. Theenvironmental ontribution to the annual dose an be determined dire tly,using thermolumines en e dosimeters whi h should be exposed in situ for atleast one year to onsider seasonal variations.When this approa h is not feasible, the on entration of the naturallyo urring radionu lides in soil is evaluated. The annual dose is provided in1It is to note, however, that the EDEPR spe trum is re orded without a Lo k-in systemand no modulating �eld is applied (see se tion 6.6), and therefore looks like a normalabsorption spe trum after the a quisition. In order to have a meaningful omparisonbetween CW and ED EPR spe tra one should therefore either digitally integrate theCWEPR spe tra or digitally derive the EDEPR spe tra.
3.5. ANNUAL DOSE 49roughly equal parts by potassium, thorium and uranium and for a few per entby osmi rays. In general, the emission by radionu lides and the absorptionof energy by the material are not equal. However, in dating of pottery it ispossible to use the so alled in�nite matrix assumption whi h simpli�es thedetermination of annual doses. When the volume is greater than the ranges ofradiations, the rates of energy emission and absorption are the same. This isveri�ed assuming that the matrix is uniform in radioa tivity and absorption oe� ients. For pottery this is a good approximation sin e its omponents(quartz, feldspars and lay minerals) have similar atomi weights and atomi numbers.3.5.1 E�e t of moistureBe ause of its porous stru ture, whi h may vary from 5% for ompa t fabri to 25%, pottery absorbs water from the environment. Water a ts as a s reenbe ause the energy produ ing lumines en e does not entirely arrive to thematerial. The water absorption oe� ient ompared to minerals in potteryis 50% higher for alpha radiation, 25% for beta and 14% for gamma. It isne essary to take into a ount the e�e t of the moisture, introdu ing thesaturation parameter in the annual dose estimation. The weight of a potterysample is measured as it is, after drying and in saturation ondition. Thesaturation level sets an upper limit to the e�e t of water on the al ulatedage.3.5.2 Radioisotopes ontributionIn order to determine the uranium and thorium ontent in samples and soils,an alpha ounter an be used. The material is redu ed to powder and a thi klayer is pla ed on the top of a s intillation s reen of zin sulphide whi h isviewed from beneath by a photomultiplier, both held in a dark box to avoidexternal light interferen e. When an alpha parti le from the sample strikesthe s reen, s intillation is produ ed. Photoele trons from the photo athodeof the photomultiplier are onverted after ampli� ation in one ele tri al pulsefor ea h s intillation. A voltage threshold reje ts pulses orresponding to betaparti les and gamma rays and the suitable ones are read by a ounter. Countsare re orded at regular intervals, for example every minute. With this methodall the alpha emission from the sample is olle ted without distinguishing thesingle radioisotope emitting the parti le. The on entration of radioisotopesin the sample is then al ulated on the basis of thorium to uranium ratio(equal to 3.16 for erami s). The on entration of radioisotopes has to be onverted in the alpha, beta and gamma dose ontribution [3℄.
50 CHAPTER 3. METHODS IN LUMINESCENCE AND EPR DATINGThe ontribution to the annual dose of 40K is dedu ed from the total on entration of K determined by means of �ame photometry. This is anatomi emission te hnique whi h allows the dire t measurement of alkaliand alkaline earth metals as sodium and potassium. 500 mg of powderedsample is et hed with hydro�uori a id and per hlori a id in order to dissolvesili ates and arbonates. The resultant solution is aspirated into the �ame,where the evaporation of the matrix o urs followed by its atomization. Thetemperature of the �ame is able to ex ite the atoms whi h emit radiation inreturning to the ground state. These emissions have a de�nite wavelengthdepending on the energy level from whi h ea h atom drops. A spe i� �lteris used in order to sele t the emission of the atom to be quanti�ed. Theintensity of the emission is then related to the on entration of the atom inthe sample. The quantitative determination of potassium in the solutionsis obtained by omparing the emission intensity of the sample with thatof a standard solution with on entration overing the regions around theexpe ted signals.
Chapter 4Pottery in ar haeology4.1 The role of pottery in ar haeologyCerami is a rystalline arti� ial solid material obtained by thermal treat-ment of lays. Clays are formed by weathering of ro ks and omposed bythe so alled lay minerals. These are sili ates of the phyllosili ate group, hara terized by parallel sheets of sili ate tetrahedra. This parti ular stru -ture is responsible for the plasti ity, one of the most important propertiesfor whi h lay is used in manufa turing of pottery. It is due to the waterabsorbed between mineral sheets and bonded to the surfa es of the rystals.This is possible sin e lay minerals exhibit a very large surfa e area per unitweight. The plasti ity allows pottery being shaped at room temperature.During the heating treatment the loss of water auses the hardening of thepottery whi h maintains its form. At about 600oC lay minerals undergo therelease of the hemi ally bonded water and the hanges in the stru ture areirreversible. After the �ring, the material a quires some hara teristi s thatmay vary on the basis of raw materials and manufa turing pro ess.Cerami s an be hard, water resistant, brittle, insulating and hemi allystable. All these properties explain why pottery is often the most abundantmaterial found in ar haeologi al ex avations. Cerami s are almost inert andso they are easily preserved in quantity at the ar haeologi al sites. Cerami is suitable for many di�erent appli ations su h tools, vessels, ornaments andbuilding material and it was exploited sin e prehistori times. It is so di�usedthat the ar haeologi al interpretation of a site is often based on the studyof erami �ndings. The study of an ient pottery is both ar haeologi al andte hni al, with the support of ar haeometri analysis. Di�erent information ould be dedu ed from the material, not only of produ tion, use and hemi al-physi al features but also related to people involved [27℄.Pottery produ tion needs the knowledge of hoosing and manipulating51
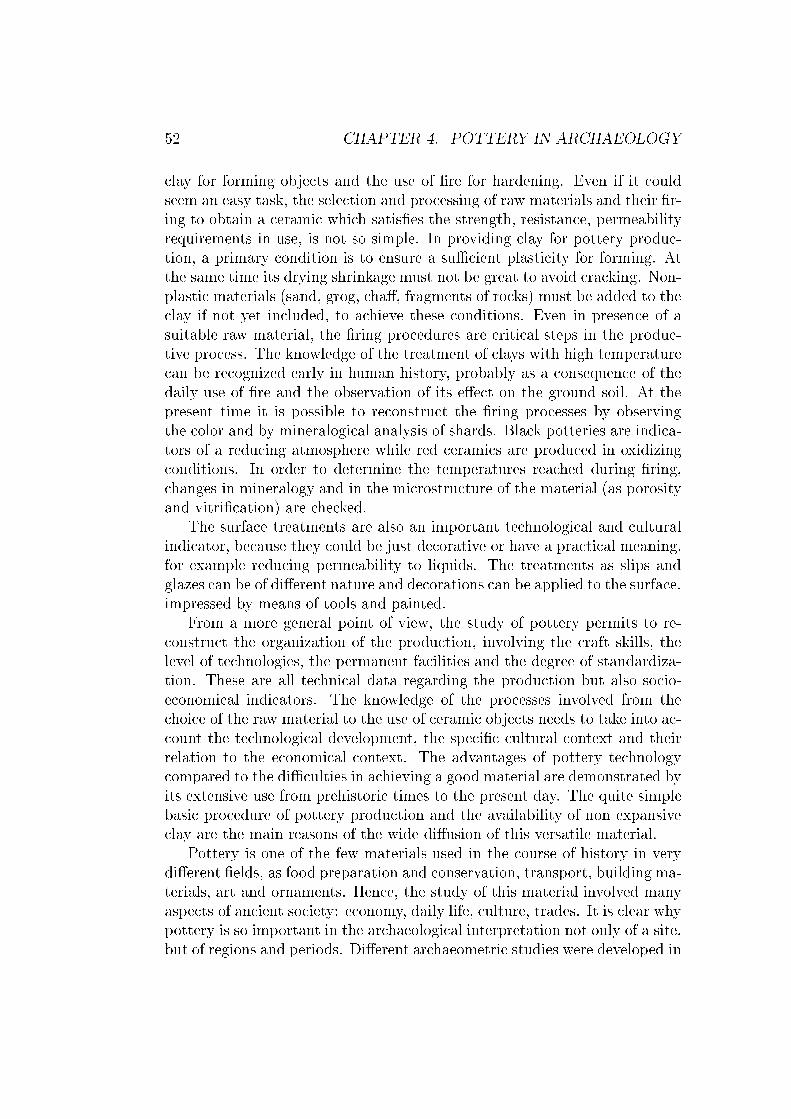
52 CHAPTER 4. POTTERY IN ARCHAEOLOGY lay for forming obje ts and the use of �re for hardening. Even if it ouldseem an easy task, the sele tion and pro essing of raw materials and their �r-ing to obtain a erami whi h satis�es the strength, resistan e, permeabilityrequirements in use, is not so simple. In providing lay for pottery produ -tion, a primary ondition is to ensure a su� ient plasti ity for forming. Atthe same time its drying shrinkage must not be great to avoid ra king. Non-plasti materials (sand, grog, ha�, fragments of ro ks) must be added to the lay if not yet in luded, to a hieve these onditions. Even in presen e of asuitable raw material, the �ring pro edures are riti al steps in the produ -tive pro ess. The knowledge of the treatment of lays with high temperature an be re ognized early in human history, probably as a onsequen e of thedaily use of �re and the observation of its e�e t on the ground soil. At thepresent time it is possible to re onstru t the �ring pro esses by observingthe olor and by mineralogi al analysis of shards. Bla k potteries are indi a-tors of a redu ing atmosphere while red erami s are produ ed in oxidizing onditions. In order to determine the temperatures rea hed during �ring, hanges in mineralogy and in the mi rostru ture of the material (as porosityand vitri� ation) are he ked.The surfa e treatments are also an important te hnologi al and ulturalindi ator, be ause they ould be just de orative or have a pra ti al meaning,for example redu ing permeability to liquids. The treatments as slips andglazes an be of di�erent nature and de orations an be applied to the surfa e,impressed by means of tools and painted.From a more general point of view, the study of pottery permits to re- onstru t the organization of the produ tion, involving the raft skills, thelevel of te hnologies, the permanent fa ilities and the degree of standardiza-tion. These are all te hni al data regarding the produ tion but also so io-e onomi al indi ators. The knowledge of the pro esses involved from the hoi e of the raw material to the use of erami obje ts needs to take into a - ount the te hnologi al development, the spe i� ultural ontext and theirrelation to the e onomi al ontext. The advantages of pottery te hnology ompared to the di� ulties in a hieving a good material are demonstrated byits extensive use from prehistori times to the present day. The quite simplebasi pro edure of pottery produ tion and the availability of non expansive lay are the main reasons of the wide di�usion of this versatile material.Pottery is one of the few materials used in the ourse of history in verydi�erent �elds, as food preparation and onservation, transport, building ma-terials, art and ornaments. Hen e, the study of this material involved manyaspe ts of an ient so iety: e onomy, daily life, ulture, trades. It is lear whypottery is so important in the ar haeologi al interpretation not only of a site,but of regions and periods. Di�erent ar haeometri studies were developed in
4.2. ORIGIN OF POTTERY 53order to understand the produ tion te hnology (raw materials, surfa e treat-ments, �ring onditions), the provenan e (lo ally produ ed or imported),the age and the di�erent uses (storage, food preparation, tools, and ritual).Improvements in pottery manufa turing are indi ator of the te hnologi aldevelopment of mankind. In many ases pottery ontains also an artisti ex-pression and it is the produ t of the reativity, not only of the ability of the raftsmen. Te hnologi al aspe ts, ar haeologi al interpretation, fun tionaldetails must be integrated in view of a omplete ar haeologi al interpreta-tion of �nding as well as dating. In summary, pottery is so important inar haeology be ause it is the only material at the same time frequent, dated,with fun tional values and thus able to re onstru t lo al history. Cerami allows also establishing omparisons between di�erent periods and geograph-i al areas.4.2 Origin of potteryCerami is the �rst syntheti material and it is among the oldest and mostsigni� ant te hnologi al innovation in the history of human a hievement.The omplexity of the pro esses ne essary for a good pottery produ tionindi ates that many experimentations and errors have been made during aquite long period of development. Criti al analysis on the origin of pottery isnot the purpose of this work but it is interesting to point out some aspe ts,be ause Afri an desert erami plays an important role in de iphering thistheme. At the beginning of XIX entury, pottery was onsidered in Europeanprehistori studies, as the sign of the passage from Paleolithi to Neolithi , orresponding to the transition to farming. At the present time it is possibleto a�rm that it was a simpli�ed interpretation of the ar haeologi al �ndings,whi h is not true in all the ultures. A distin tion between pottery with sym-boli signi� an e and pottery with utilitarian fun tions must be made. Thisis important sin e the ir umstan es of pottery manufa ture are not always lear. The �rst pottery produ tion is found to be linked to ritual and so- ial spheres and not to e onomi or subsisten e dynami s. Moreover, theoldest vessels o ur before the introdu tion of agri ultural pra ti es, prov-ing that pottery ontainers were produ ed among hunter-gatherer groups[28℄. The most an ient erami �ndings in Europe (site of Dolnì Vestoniçi,Cze hoslovakia, Figure 4.1), dating to about 26,000 BP are anthropomorphi and zoomorphi �gurines [29℄. These materials suggest that the �red layte hnology was applied with a symboli meaning and may have had a ritualfun tion not related to the daily life fun tional use of obje ts.In Asia, �red lay ontainers were found in Japan dating ba k to a
54 CHAPTER 4. POTTERY IN ARCHAEOLOGY
Figure 4.1: Anthropomorphi and zoomorphi erami �gurines from theUpper Palaeolithi Pavlovian sites Dolnì Vestoni e, Pavlov and Predmosti(from [30℄).12,700-10,000 BP. They belong to the so alled Jomon pottery. A potteryprodu tion of about 20,000 years ago was found in China. It is asso iatedto hunter-gatherers population using this te hnology for very long times be-fore they be ame sedentary and began ultivating plants [31℄. These re entstudies of East Asian erami refute the idea that the beginning of potteryprodu tion was asso iated in that area with the transition to agri ulture.In the Afri an ontinent, the produ tion of the �rst pottery is probablyto be pla ed between North Afri a and the middle Nile Valley about 10,000years BP [42℄. The Sahara region at that time was not a desert and the NileValley was a ri h habitat. Sites at whi h pottery was found are asso iatedto semi-sedentary groups living on use of riverine resour es. The erami found in this region is the so alled Khartoum Mesolithi pottery. It is ingeneral well formed and �red at high temperatures. Shards of this periodare a very ommon �nding in the Nile valley and it is lear that there was adi�use use of pottery te hnology. It is thus reasonable to think about a morean ient �red lay material as the �rst step in the development of shapes,de oration and in general of te hnology of pottery produ tion. No orrela-tion with food produ tion of shards belonging to hunter-gatherer populationwith seasonally o upation of riverine settlements has been re ognized. Fur-
4.3. DATING POTTERY 55thermore, onsidering that the �rst Neolithi settlements in the Levant andUpper Mesopotamia (Pre-Pottery Neolithi A, B, C: 8,500-5,500 BC) bearno eviden e of pottery produ tion the Neolithi revolution is not su� ient toexplain the reasons of the origin of pottery. The Neolithi revolution is thusnot su� ient to explain the reasons of the origin of pottery. The inventionof erami is a te hnologi al advan ement for many ultures. It helped no-madi so ieties for a more sedentary lifestyle allowing the storage of food forlong periods. But it is also true that pottery making would have requiredlong time to permit the �nding and the sele tion of suitable lay and possi-ble tempers to obtain appropriate re ipes and to improve the manufa turingpro ess. From this point of view the pottery produ tion seems to be possibleonly in sedentary so ieties. The te hnologi al hoi es are in�uen ed by thenatural environment for the availability of raw materials and by the skillsin produ ing and using tools and ontrolling �ring onditions. Moreover thete hnologi al developments must be onsidered as a long-term pro ess, dur-ing whi h the te hni al improvements are adapted to e onomi al and ultural hanges. For all these reasons it is not appropriate to think about potteryprodu tion as the result of systemati experiments sin e the te hnologi al hoi es ome from a mix of environmental, e onomi , ideologi al fa tors.It is instead reasonable to think about an invention of pottery in di�erentpla es independently and adopted for di�erent fun tions [32℄. Last of all, itis important to point out that it was not possible until now to re onstru ta full sequen e of the development of pottery manufa ture. On the basis ofthe �ndings available at the present time it is possible to a�rm that earlypottery appeared in environments ri h in food resour es and water, whi h donot require food produ tion. It is reasonable that the new material was �rstused as a so ial distin tion in ommunal feast before a use in ooking or instorage food [28℄.4.3 Dating potteryAs des ribed in the previous paragraphs, pottery is an important materialin ar haeology due to its ability in providing information on many aspe tsof the past, in luding hronology. The plasti ity of lay enables to reate agreat variety of shapes with a wide range of surfa e treatments and de o-rations using di�erent ombinations of paste and temper. The shapes andthe de oration of pottery and the lay mix omposition are subje ted tomany variation in time, thus hronologi al frameworks often rest on the de-velopment of these features. The stylisti examination of shapes, surfa etreatments and de orations, is the �rst and the oldest method employed for
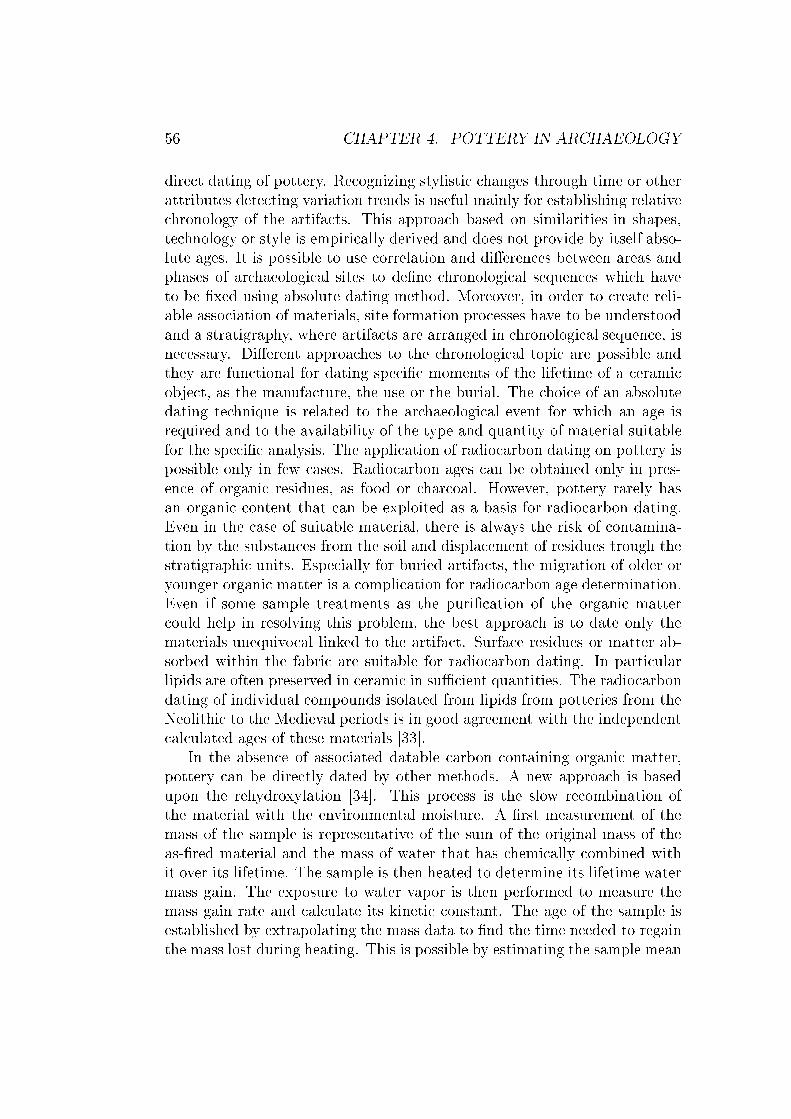
56 CHAPTER 4. POTTERY IN ARCHAEOLOGYdire t dating of pottery. Re ognizing stylisti hanges through time or otherattributes dete ting variation trends is useful mainly for establishing relative hronology of the artifa ts. This approa h based on similarities in shapes,te hnology or style is empiri ally derived and does not provide by itself abso-lute ages. It is possible to use orrelation and di�eren es between areas andphases of ar haeologi al sites to de�ne hronologi al sequen es whi h haveto be �xed using absolute dating method. Moreover, in order to reate reli-able asso iation of materials, site formation pro esses have to be understoodand a stratigraphy, where artifa ts are arranged in hronologi al sequen e, isne essary. Di�erent approa hes to the hronologi al topi are possible andthey are fun tional for dating spe i� moments of the lifetime of a erami obje t, as the manufa ture, the use or the burial. The hoi e of an absolutedating te hnique is related to the ar haeologi al event for whi h an age isrequired and to the availability of the type and quantity of material suitablefor the spe i� analysis. The appli ation of radio arbon dating on pottery ispossible only in few ases. Radio arbon ages an be obtained only in pres-en e of organi residues, as food or har oal. However, pottery rarely hasan organi ontent that an be exploited as a basis for radio arbon dating.Even in the ase of suitable material, there is always the risk of ontamina-tion by the substan es from the soil and displa ement of residues trough thestratigraphi units. Espe ially for buried artifa ts, the migration of older oryounger organi matter is a ompli ation for radio arbon age determination.Even if some sample treatments as the puri� ation of the organi matter ould help in resolving this problem, the best approa h is to date only thematerials unequivo al linked to the artifa t. Surfa e residues or matter ab-sorbed within the fabri are suitable for radio arbon dating. In parti ularlipids are often preserved in erami in su� ient quantities. The radio arbondating of individual ompounds isolated from lipids from potteries from theNeolithi to the Medieval periods is in good agreement with the independent al ulated ages of these materials [33℄.In the absen e of asso iated datable arbon ontaining organi matter,pottery an be dire tly dated by other methods. A new approa h is basedupon the rehydroxylation [34℄. This pro ess is the slow re ombination ofthe material with the environmental moisture. A �rst measurement of themass of the sample is representative of the sum of the original mass of theas-�red material and the mass of water that has hemi ally ombined withit over its lifetime. The sample is then heated to determine its lifetime watermass gain. The exposure to water vapor is then performed to measure themass gain rate and al ulate its kineti onstant. The age of the sample isestablished by extrapolating the mass data to �nd the time needed to regainthe mass lost during heating. This is possible by estimating the sample mean
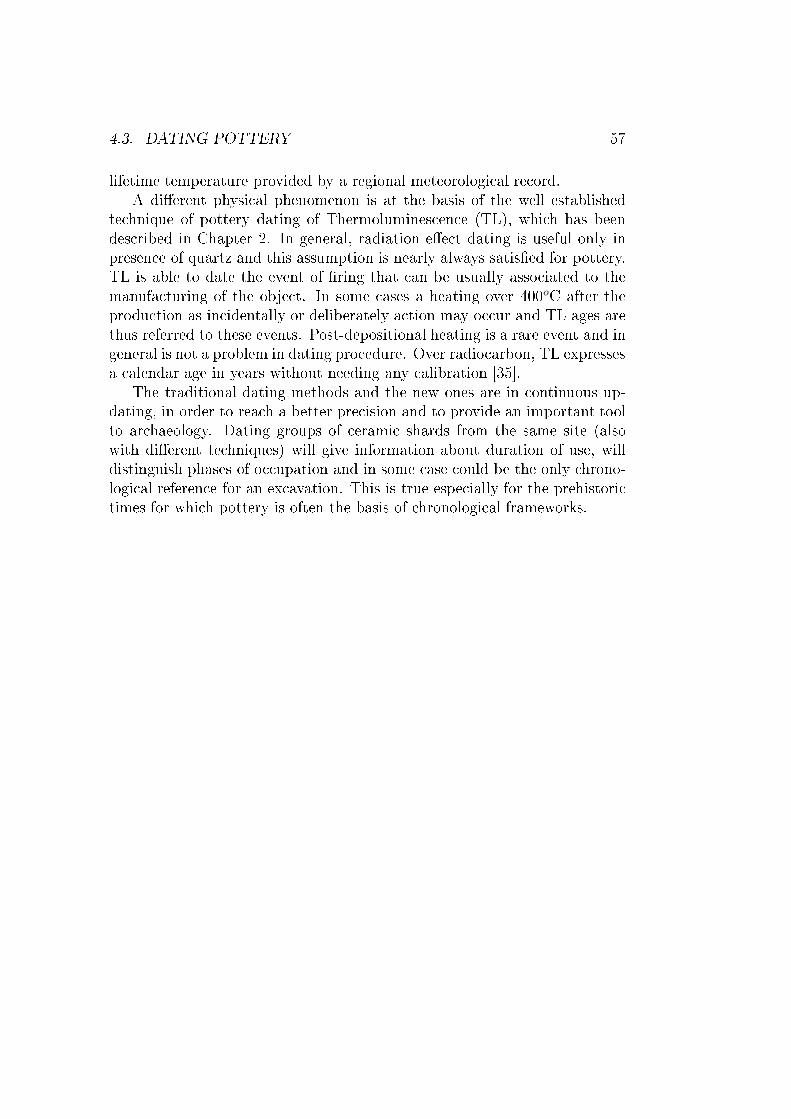
4.3. DATING POTTERY 57lifetime temperature provided by a regional meteorologi al re ord.A di�erent physi al phenomenon is at the basis of the well establishedte hnique of pottery dating of Thermolumines en e (TL), whi h has beendes ribed in Chapter 2. In general, radiation e�e t dating is useful only inpresen e of quartz and this assumption is nearly always satis�ed for pottery.TL is able to date the event of �ring that an be usually asso iated to themanufa turing of the obje t. In some ases a heating over 400oC after theprodu tion as in identally or deliberately a tion may o ur and TL ages arethus referred to these events. Post-depositional heating is a rare event and ingeneral is not a problem in dating pro edure. Over radio arbon, TL expressesa alendar age in years without needing any alibration [35℄.The traditional dating methods and the new ones are in ontinuous up-dating, in order to rea h a better pre ision and to provide an important toolto ar haeology. Dating groups of erami shards from the same site (alsowith di�erent te hniques) will give information about duration of use, willdistinguish phases of o upation and in some ase ould be the only hrono-logi al referen e for an ex avation. This is true espe ially for the prehistori times for whi h pottery is often the basis of hronologi al frameworks.

58 CHAPTER 4. POTTERY IN ARCHAEOLOGY
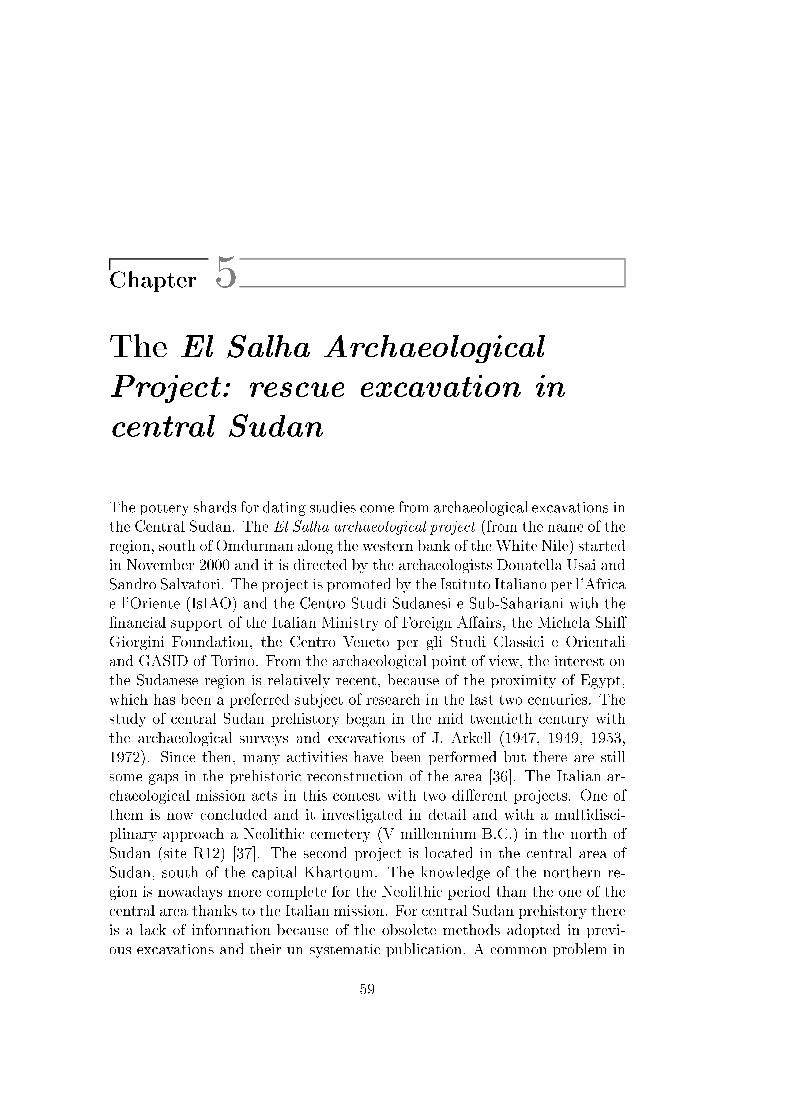
Chapter 5The El Salha Ar haeologi alProje t: res ue ex avation in entral SudanThe pottery shards for dating studies ome from ar haeologi al ex avations inthe Central Sudan. The El Salha ar haeologi al proje t (from the name of theregion, south of Omdurman along the western bank of the White Nile) startedin November 2000 and it is dire ted by the ar haeologists Donatella Usai andSandro Salvatori. The proje t is promoted by the Istituto Italiano per l'Afri ae l'Oriente (IsIAO) and the Centro Studi Sudanesi e Sub-Sahariani with the�nan ial support of the Italian Ministry of Foreign A�airs, the Mi hela Shi�Giorgini Foundation, the Centro Veneto per gli Studi Classi i e Orientaliand GASID of Torino. From the ar haeologi al point of view, the interest onthe Sudanese region is relatively re ent, be ause of the proximity of Egypt,whi h has been a preferred subje t of resear h in the last two enturies. Thestudy of entral Sudan prehistory began in the mid twentieth entury withthe ar haeologi al surveys and ex avations of J. Arkell (1947, 1949, 1953,1972). Sin e then, many a tivities have been performed but there are stillsome gaps in the prehistori re onstru tion of the area [36℄. The Italian ar- haeologi al mission a ts in this ontest with two di�erent proje ts. One ofthem is now on luded and it investigated in detail and with a multidis i-plinary approa h a Neolithi emetery (V millennium B.C.) in the north ofSudan (site R12) [37℄. The se ond proje t is lo ated in the entral area ofSudan, south of the apital Khartoum. The knowledge of the northern re-gion is nowadays more omplete for the Neolithi period than the one of the entral area thanks to the Italian mission. For entral Sudan prehistory thereis a la k of information be ause of the obsolete methods adopted in previ-ous ex avations and their un-systemati publi ation. A ommon problem in59

60 CHAPTER 5. THE EL SALHA PROJECTstudying this area is the age determination of sites of un ertain attribution.Even if hronologi al data are available for some ar haeologi al ex avations,they do not over the entire ultural sequen e of interest. The spe i� s i-enti� topi of the Italian proje t is primarily the transition from Mesolithi hunter-gatherer-�shers to Neolithi pastoral and agri ultural so ieties, a keystage in human history of Sudan [38℄. The main feature of the Mesolithi of Sudan is its pottery produ tion, usually more typi al of Neolithi so i-eties [38℄. Clay workmanship in some ontexts dates ba k to 26.000 yearsago (Gravettian) but just for human and animal �gurines [29℄. However,�rst attempts of vessels produ tion o urred in hunter-gatherer ultures inEurasia during the Late Pleisto ene/Holo ene transition (e.g., [39℄). Duringthe Early Holo ene there are two ultures of hunters, gatherers and �shersimportant for their pottery produ tion: Early Jomon ulture in the north ofJapan [40, 41℄ and the Mesolithi in the Nile valley/Saharan regions [42, 43℄.Pottery te hnology implies e�e ts on e onomy, resour e management, mobil-ity and organization of hunter-gatherer populations. The study of Sudanesepottery highlights that at the beginning of the seventh millennium B.C. thete hnology of produ tion was already developed and it is thus reasonable toexpe t that there was a previous long lasted phase of testing. At the momentthere are not �rm ar haeologi al eviden es of su h a stage in the area of on- ern. The antiquity of pottery produ tion along the Nile Valley and in theSahara region has been a re urring theme of resear h in the last years but itis not fully understood yet [42, 43℄. The Italian mission made headways instudying the Khartoum Mesolithi , espe ially thanks to the lo ation and ex- avation of the site alled Al Khiday 1, at about 25 km south of Omdurman[36, 44, 45, 46, 38, 47, 48, 49, 50, 51℄.The �rst stru tural remains, mud stru tures of Mesolithi period havebeen found there together with big �repla es and pits, never attested before.In this ontext, the �rst stratigraphi sequen es of the Khartoum Mesolithi emerge from ex avation that allow following the evolutionary pro ess of pot-tery and other materials produ tion te hnology along two millennia (VIIand VI millennium B.C.). It is very di� ult to �nd su h ondition in sitesalong the Nile be ause of a strong erosion, that a�e ts all arid environments,and of the a tion of anthropi and animal post-depositional events typi al ofthe Sudanese Nile Valley. Nile �oods, wind and water erosion, and humanand natural disturban es altered the matrix of the soil in powdered depositswithout ohesion in whi h ar haeologi al �nds an be more easily displa ed.For this reason the original ontext of deposition is often lost. The mainanthropi post-depositional disturban e is due to Post-Meroiti emeteriesbuilt along the Nile. Even if it is usually possible to partially re onstru tthe ultural sequen e of sites that were reused for di�erent purposes along
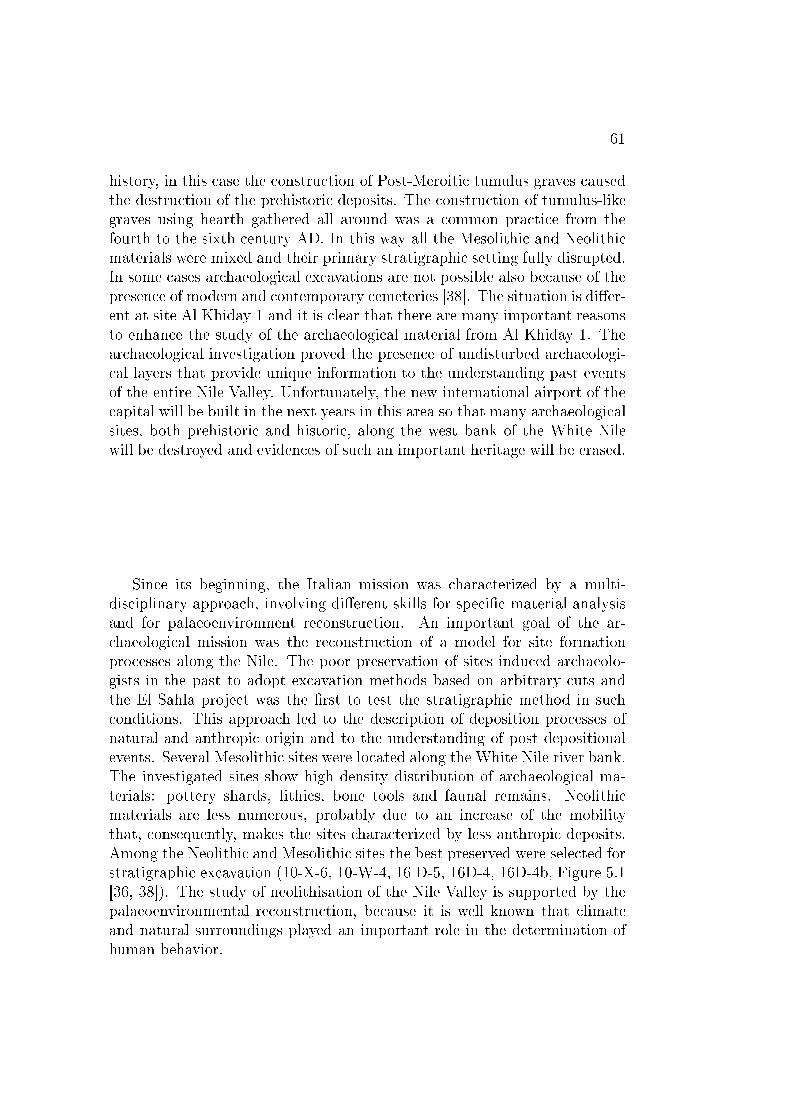
61history, in this ase the onstru tion of Post-Meroiti tumulus graves ausedthe destru tion of the prehistori deposits. The onstru tion of tumulus-likegraves using hearth gathered all around was a ommon pra ti e from thefourth to the sixth entury AD. In this way all the Mesolithi and Neolithi materials were mixed and their primary stratigraphi setting fully disrupted.In some ases ar haeologi al ex avations are not possible also be ause of thepresen e of modern and ontemporary emeteries [38℄. The situation is di�er-ent at site Al Khiday 1 and it is lear that there are many important reasonsto enhan e the study of the ar haeologi al material from Al Khiday 1. Thear haeologi al investigation proved the presen e of undisturbed ar haeologi- al layers that provide unique information to the understanding past eventsof the entire Nile Valley. Unfortunately, the new international airport of the apital will be built in the next years in this area so that many ar haeologi alsites, both prehistori and histori , along the west bank of the White Nilewill be destroyed and eviden es of su h an important heritage will be erased.Sin e its beginning, the Italian mission was hara terized by a multi-dis iplinary approa h, involving di�erent skills for spe i� material analysisand for palaeoenvironment re onstru tion. An important goal of the ar- haeologi al mission was the re onstru tion of a model for site formationpro esses along the Nile. The poor preservation of sites indu ed ar haeolo-gists in the past to adopt ex avation methods based on arbitrary uts andthe El Sahla proje t was the �rst to test the stratigraphi method in su h onditions. This approa h led to the des ription of deposition pro esses ofnatural and anthropi origin and to the understanding of post depositionalevents. Several Mesolithi sites were lo ated along the White Nile river bank.The investigated sites show high density distribution of ar haeologi al ma-terials: pottery shards, lithi s, bone tools and faunal remains. Neolithi materials are less numerous, probably due to an in rease of the mobilitythat, onsequently, makes the sites hara terized by less anthropi deposits.Among the Neolithi and Mesolithi sites the best preserved were sele ted forstratigraphi ex avation (10-X-6, 10-W-4, 16 D-5, 16D-4, 16D-4b, Figure 5.1[36, 38℄). The study of neolithisation of the Nile Valley is supported by thepalaeoenvironmental re onstru tion, be ause it is well known that limateand natural surroundings played an important role in the determination ofhuman behavior.
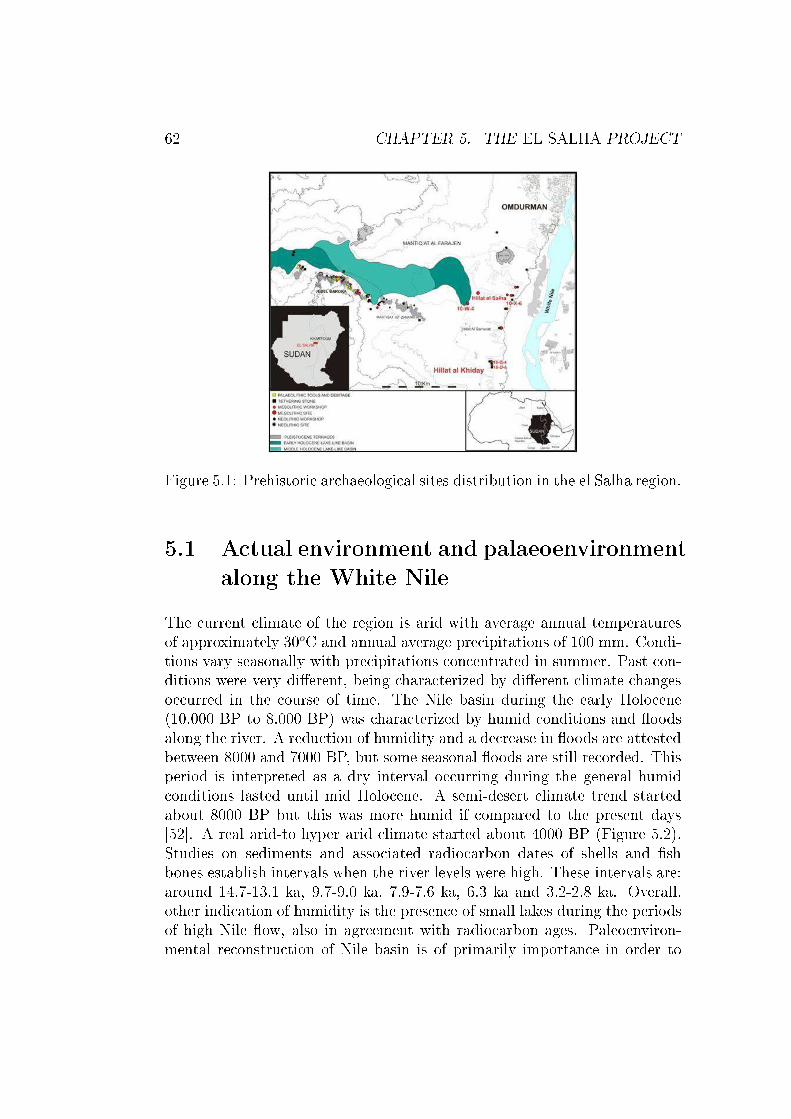
62 CHAPTER 5. THE EL SALHA PROJECT
Figure 5.1: Prehistori ar haeologi al sites distribution in the el Salha region.5.1 A tual environment and palaeoenvironmentalong the White NileThe urrent limate of the region is arid with average annual temperaturesof approximately 30oC and annual average pre ipitations of 100 mm. Condi-tions vary seasonally with pre ipitations on entrated in summer. Past on-ditions were very di�erent, being hara terized by di�erent limate hangeso urred in the ourse of time. The Nile basin during the early Holo ene(10.000 BP to 8.000 BP) was hara terized by humid onditions and �oodsalong the river. A redu tion of humidity and a de rease in �oods are attestedbetween 8000 and 7000 BP, but some seasonal �oods are still re orded. Thisperiod is interpreted as a dry interval o urring during the general humid onditions lasted until mid Holo ene. A semi-desert limate trend startedabout 8000 BP but this was more humid if ompared to the present days[52℄. A real arid-to hyper arid limate started about 4000 BP (Figure 5.2).Studies on sediments and asso iated radio arbon dates of shells and �shbones establish intervals when the river levels were high. These intervals are:around 14.7-13.1 ka, 9.7-9.0 ka, 7.9-7.6 ka, 6.3 ka and 3.2-2.8 ka. Overall,other indi ation of humidity is the presen e of small lakes during the periodsof high Nile �ow, also in agreement with radio arbon ages. Paleoenviron-mental re onstru tion of Nile basin is of primarily importan e in order to
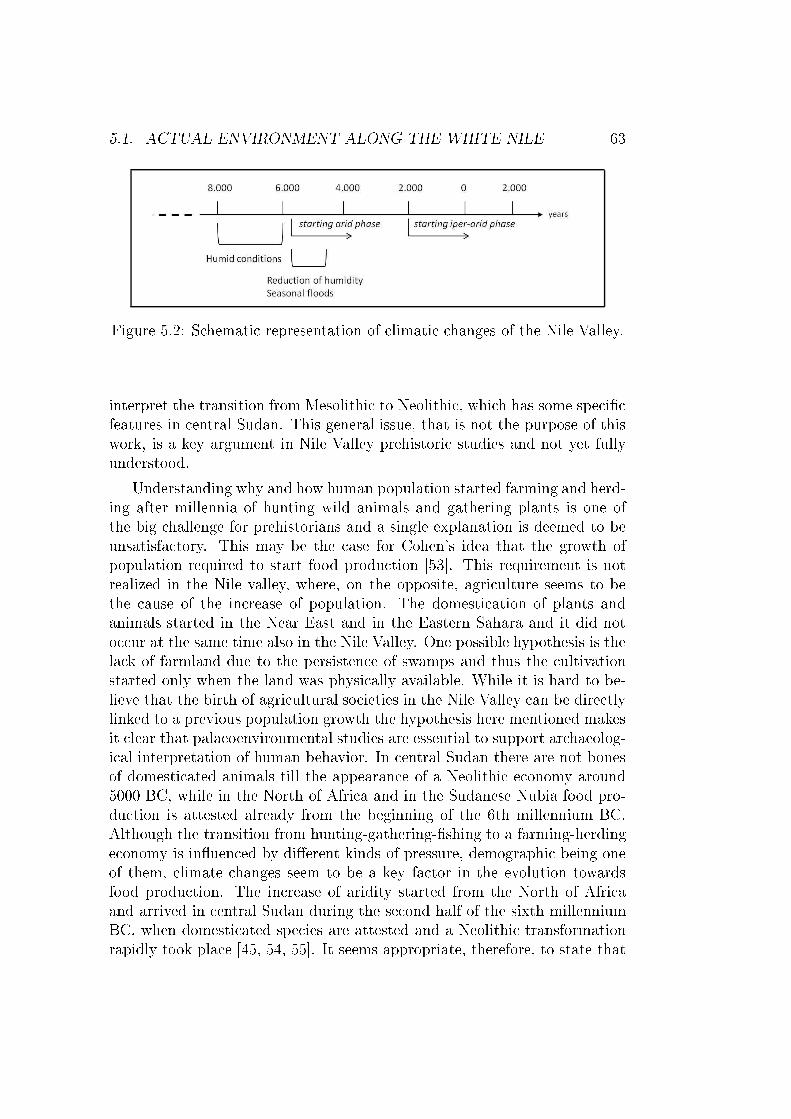
5.1. ACTUAL ENVIRONMENT ALONG THE WHITE NILE 63Figure 5.2: S hemati representation of limati hanges of the Nile Valley.interpret the transition from Mesolithi to Neolithi , whi h has some spe i� features in entral Sudan. This general issue, that is not the purpose of thiswork, is a key argument in Nile Valley prehistori studies and not yet fullyunderstood.Understanding why and how human population started farming and herd-ing after millennia of hunting wild animals and gathering plants is one ofthe big hallenge for prehistorians and a single explanation is deemed to beunsatisfa tory. This may be the ase for Cohen's idea that the growth ofpopulation required to start food produ tion [53℄. This requirement is notrealized in the Nile valley, where, on the opposite, agri ulture seems to bethe ause of the in rease of population. The domesti ation of plants andanimals started in the Near East and in the Eastern Sahara and it did noto ur at the same time also in the Nile Valley. One possible hypothesis is thela k of farmland due to the persisten e of swamps and thus the ultivationstarted only when the land was physi ally available. While it is hard to be-lieve that the birth of agri ultural so ieties in the Nile Valley an be dire tlylinked to a previous population growth the hypothesis here mentioned makesit lear that palaeoenvironmental studies are essential to support ar haeolog-i al interpretation of human behavior. In entral Sudan there are not bonesof domesti ated animals till the appearan e of a Neolithi e onomy around5000 BC, while in the North of Afri a and in the Sudanese Nubia food pro-du tion is attested already from the beginning of the 6th millennium BC.Although the transition from hunting-gathering-�shing to a farming-herdinge onomy is in�uen ed by di�erent kinds of pressure, demographi being oneof them, limate hanges seem to be a key fa tor in the evolution towardsfood produ tion. The in rease of aridity started from the North of Afri aand arrived in entral Sudan during the se ond half of the sixth millenniumBC, when domesti ated spe ies are attested and a Neolithi transformationrapidly took pla e [45, 54, 55℄. It seems appropriate, therefore, to state that
64 CHAPTER 5. THE EL SALHA PROJECTwhile food produ ing e onomies were already developing in Upper Nubia andin Eastern and Western Egyptian desert, Central Sudan prehistori so ietieswere still having a hunter-gatherer-�sher way of life. Moreover, while in theNorth a food produ tion e onomy was a hieved through a long period ofanimal ontrol pra ti es, no eviden es of systemati e�ort to domesti ateanimals have been found in Central Sudan [56, 57, 58℄.5.1.1 El SalhaSites of ar haeologi al interest are lo ated in the western bank of the WhiteNile. Most of the sites lo ated in the area surveyed by the Italian proje trevealed a total absen e of strati�ed deposits and stru tures than only fewsites with a better state of preservation were sele ted for ex avation. Theyare lo ated on the top of hillo ks, pla ed in elevated position as observed ingeneral for prehistori settlements and emeteries in Sudanese territory. Sitesare roughly parallel to the river ourse at a distan e between 2.5 and 4 kmfrom the present ourse of the Nile. Their distribution at the western limit ofa dark belt orresponds to the limit of alluvial silt deposited by the �oodingof the White Nile. The pla e where the prehistori sites are lo ated orre-sponds to the older �uvial terra e as eviden ed by palaeo hannels attestingthe higher level of the river in the past [59, 60, 61, 62℄. The ridges wherethe ar haeologi al materials are found are hara terized by sandy layers withlenses of gravel. On the other hand, the river terra e onsists of sand ri hin organi matter with al ium arbonate ement. It is di� ult to re ognizea urately their limits be ause of the strong erosion a�e ting this environ-ment. Sediments found in the surveyed area are typi al of a limate withalternating wet and arid seasons. During the wet one, the �ooding of theNile enri hes the soil in organi matter. The subsequent arid season auses ahigh and rapid loss of the water as attested by the stru ture of the sediments:polyedri aggregates, blo ky mi rostru ture, desi ation ra ks are the on-sequen e of strong evaporation, dissolution and re rystallization of al ite.Related to seasons are also the swamps, an important feature of the territoryduring prehistori times be ause they are strongly onne ted to human ex-ploitation of natural resour es. It is known that during the period between7800-5900 BC there was a high availability of water in orresponden e tohigh �ood level. In general, large Mesolithi possibly permanent settlementsare lo ated along the banks of the Nile and seasonal spe ialized and oppor-tunisti settlements are attested, for example along the inner lagoons, alwaysrelated to river dynami s [51℄.
5.2. THE EXCAVATION AT SITE 16-D-5, AL KHIDAY 1 655.2 The ex avation at site 16-D-5, Al Khiday 1The site 16-D-5 is lo ated in the west bank of the Nile; it is a 3.5 m highmound of about 2 he tares. From a more general point of view it is pos-sible to pla e 16-D-5 in the group of settlements and emeteries lo atedalong an old Nile bank whi h is higher than the a tual Nile �ood plain. Amodern emetery is present not far from the 16-D-5 site but fortunately itdoes not insist on the prehistori sites under investigation. When dis ov-ered, Mesolithi and Neolithi materials were found all over the mound sitesurfa e. In 2004, a test tren h was opened on the north-western slope be- ause the domed morphology of the top of the mound was surely indi ativeof post Meroiti earthen tumuli. The surfa e leaning attested the presen eof in onsistent soil as found in other similar situation (10-X-6 site; [50℄). Atabout 50 m under the surfa e, the top of a pit �lled with a mix of potteryshards, grinding stones and pestles were found. This turned to be the �ll ofa post Meroiti pit-grave ex avated into the olluvial deposit from a post-Meroiti tumulus responsible of the destru tion of the prehistori deposits.Nevertheless, below the post Meroiti pit grave, shells, lithi s and potterywere found, dated 7050-6820 al. BC. In leaning the layer a �repla e wasidenti�ed, the �rst Mesolithi one re ognized in entral Sudan with potterytypes never attested before. It produ ed also a pebble with the representa-tion of a boat [63℄. After this important result, during the following �eldseason, the olluvial deposit was removed ex avating it by arti� ial uts andthen the stratigraphi method was applied. The eviden e of mud stru tures,identi�ed as the remnants of low walls made with a light brown lay, pro-vided the eviden e of a well stru tured Mesolithi ompound (Figure 5.3).The distribution of anthropi materials allowed distinguishing di�erent areas,probably diversi�ed on the basis of spe ial fun tions. The interpretation ofthe ar haeologi al data is supported by geoar haeologi al analysis aiming atunderstanding the stratigraphi lo al ontext, but also at studying the dis-tribution of settlements in the past in relation to the limate and lands ape hanges. The geoar haeologi al approa h has on�rmed the ar haeologi alinterpretation of the stratigraphy [51℄. Mud stru tures are lo ated in theeastern side and are made of light brown lay while the soil is hara terizedby a gray silty deposit. A number of materials were found asso iated to the�repla es. In the western side the soil is dark gray and it is interpreted asan open spa e between the stru tures and the hump at the western limit ofthe site [36℄.
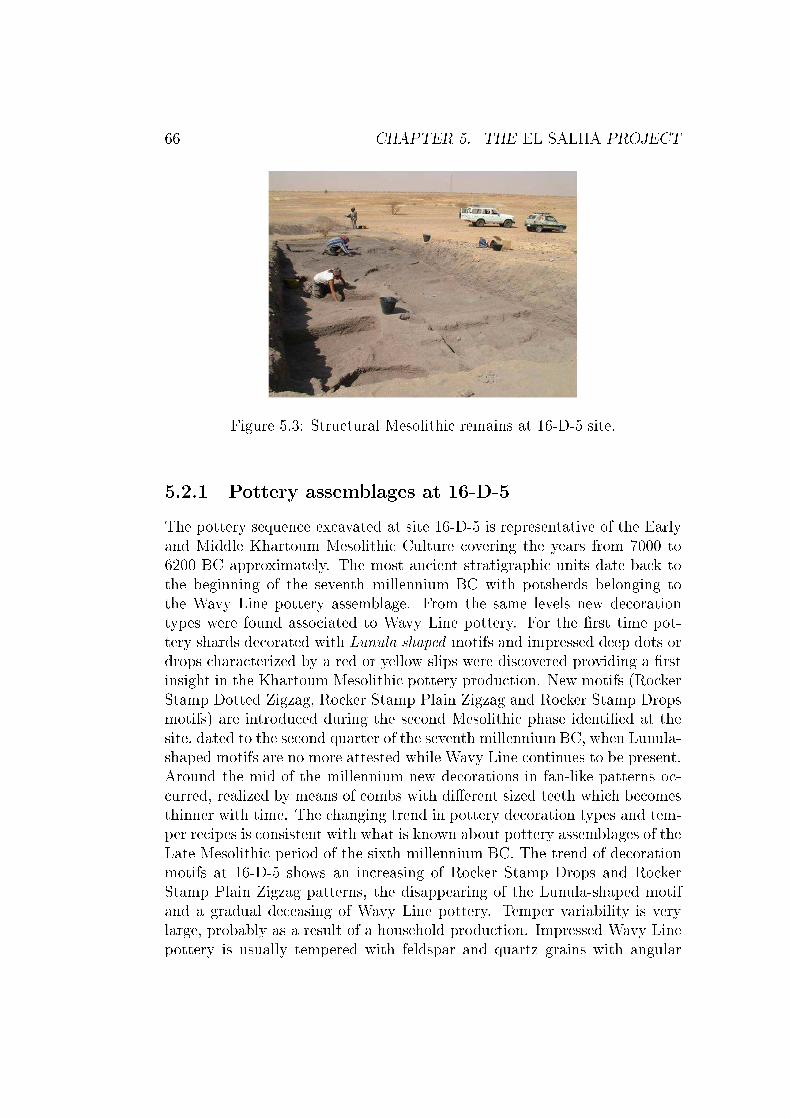
66 CHAPTER 5. THE EL SALHA PROJECT
Figure 5.3: Stru tural Mesolithi remains at 16-D-5 site.5.2.1 Pottery assemblages at 16-D-5The pottery sequen e ex avated at site 16-D-5 is representative of the Earlyand Middle Khartoum Mesolithi Culture overing the years from 7000 to6200 BC approximately. The most an ient stratigraphi units date ba k tothe beginning of the seventh millennium BC with potsherds belonging tothe Wavy Line pottery assemblage. From the same levels new de orationtypes were found asso iated to Wavy Line pottery. For the �rst time pot-tery shards de orated with Lunula shaped motifs and impressed deep dots ordrops hara terized by a red or yellow slips were dis overed providing a �rstinsight in the Khartoum Mesolithi pottery produ tion. New motifs (Ro kerStamp Dotted Zigzag, Ro ker Stamp Plain Zigzag and Ro ker Stamp Dropsmotifs) are introdu ed during the se ond Mesolithi phase identi�ed at thesite, dated to the se ond quarter of the seventh millenniumBC, when Lunula-shaped motifs are no more attested while Wavy Line ontinues to be present.Around the mid of the millennium new de orations in fan-like patterns o - urred, realized by means of ombs with di�erent sized teeth whi h be omesthinner with time. The hanging trend in pottery de oration types and tem-per re ipes is onsistent with what is known about pottery assemblages of theLate Mesolithi period of the sixth millennium BC. The trend of de orationmotifs at 16-D-5 shows an in reasing of Ro ker Stamp Drops and Ro kerStamp Plain Zigzag patterns, the disappearing of the Lunula-shaped motifand a gradual de easing of Wavy Line pottery. Temper variability is verylarge, probably as a result of a household produ tion. Impressed Wavy Linepottery is usually tempered with feldspar and quartz grains with angular
5.2. THE EXCAVATION AT SITE 16-D-5, AL KHIDAY 1 67edges (>2 mm), while in the se ond phase of the sequen e it is more oftentempered with �ne feldspar and quartz grains with angular edges (<1 mm).A similar trend is present in the temper variability of pottery de orated witha ro ker stamp dotted zigzag motif. Lunula-type de oration, ro ker stampdrops, ro ker stamp plain zigzag and s raped potsherds are mostly hara -terized by sandy tempers in various admixtures with o hre, al areous grainsand vegetal elements. Dotted Wavy Line sherds are mainly tempered withsandy re ipes (73.34 %) and to a lesser extent with feldspars and quartzgrains with angular edges (26.66 %) [36℄.

68 CHAPTER 5. THE EL SALHA PROJECT

Chapter 6Materials and MethodsLumines en e methods have proven to be a suitable tool for dating ar hae-ologi al pottery but some limitations are still present, espe ially for veryan ient materials for whi h the natural signal ould be lose to saturation.For this reason, di�erent te hniques (TL and OSL) are applied, testing dif-ferent proto ols in order to assess the better approa h to date prehistori pottery. On the other hand, ar haeologi al pottery is a re ent material forEPR dating ompared to ro ks and sediments for whi h the method is welldeveloped. The appli ation of EPR for the dating of pottery is quite a hal-lenging due to the low amount of paramagneti radiation indu ed signals perunit of absorbed dose. Furthermore, a strong iron ba kground in Contin-uous Wave (CW) EPR spe tra hides the signal of radiation indu ed defe t enters. E ho Dete ted EPR was here applied instead of the ContinuousWave method to ir umvent this problem. OSL, TL and EDEPR measure-ments on di�erent pottery shards were inter ompared to verify their potentialappli ation to measurements of radiation indu ed defe ts. A hronologi alframework of materials was provided by radio arbon dating of the ar hae-ologi al stratigraphi unit of provenan e and by stylisti features of surfa ede orations.6.1 Des ription of the samplesTwelve pottery shards from Al Khiday 1, 16-D-5 site were sele ted on thebasis of the dimension and the presumed quartz grain temper (Table 6.1). Fordosimetri dating, samples have to be thi k enough to permit the extra tionof the inner portion of material and the amount has to be su� ient not onlyfor the equivalent dose determination but also for the annual dose assessment.In the spe i� ase, a onsiderable amount of pottery was required be ause ofthe appli ation of di�erent te hniques (TL, OSL and EPR) and approa hes69
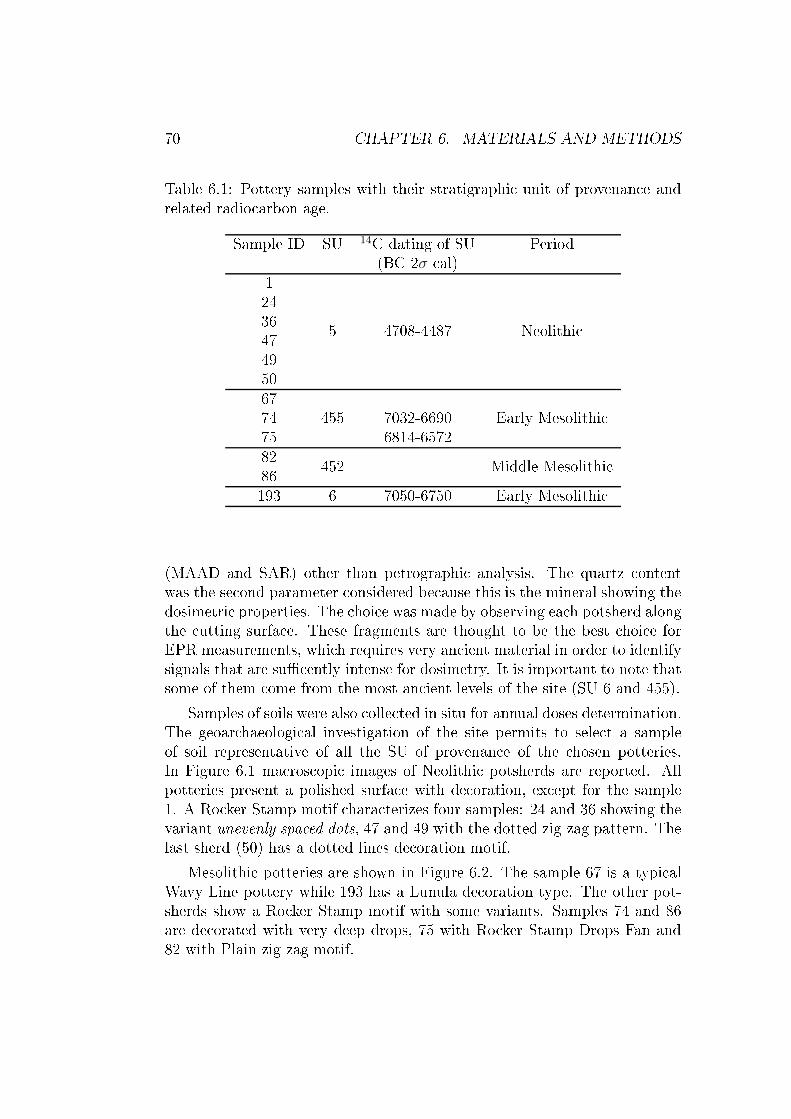
70 CHAPTER 6. MATERIALS AND METHODSTable 6.1: Pottery samples with their stratigraphi unit of provenan e andrelated radio arbon age.Sample ID SU 14C dating of SU Period(BC 2σ al)1 5 4708-4487 Neolithi 243647495067 455 7032-6690 Early Mesolithi 74 6814-65727582 452 Middle Mesolithi 86193 6 7050-6750 Early Mesolithi (MAAD and SAR) other than petrographi analysis. The quartz ontentwas the se ond parameter onsidered be ause this is the mineral showing thedosimetri properties. The hoi e was made by observing ea h potsherd alongthe utting surfa e. These fragments are thought to be the best hoi e forEPR measurements, whi h requires very an ient material in order to identifysignals that are su� ently intense for dosimetry. It is important to note thatsome of them ome from the most an ient levels of the site (SU 6 and 455).Samples of soils were also olle ted in situ for annual doses determination.The geoar haeologi al investigation of the site permits to sele t a sampleof soil representative of all the SU of provenan e of the hosen potteries.In Figure 6.1 ma ros opi images of Neolithi potsherds are reported. Allpotteries present a polished surfa e with de oration, ex ept for the sample1. A Ro ker Stamp motif hara terizes four samples: 24 and 36 showing thevariant unevenly spa ed dots, 47 and 49 with the dotted zig-zag pattern. Thelast sherd (50) has a dotted lines de oration motif.Mesolithi potteries are shown in Figure 6.2. The sample 67 is a typi alWavy Line pottery while 193 has a Lunula de oration type. The other pot-sherds show a Ro ker Stamp motif with some variants. Samples 74 and 86are de orated with very deep drops, 75 with Ro ker Stamp Drops Fan and82 with Plain zig-zag motif.
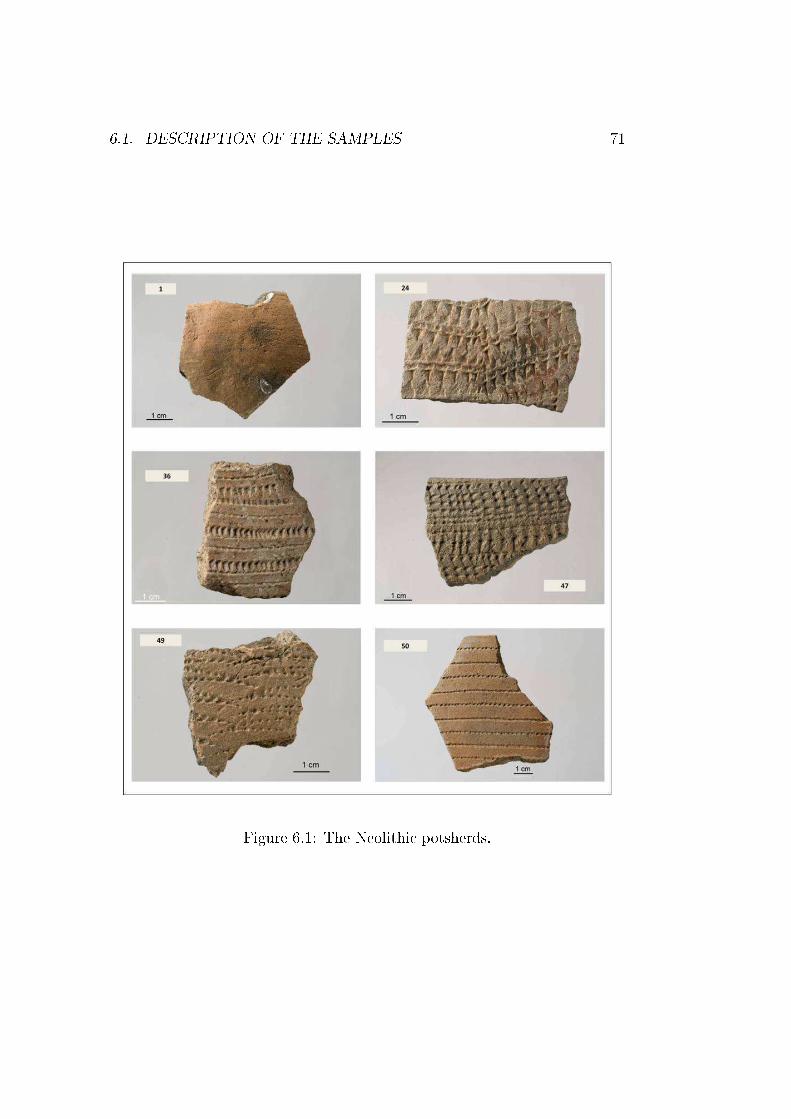
6.1. DESCRIPTION OF THE SAMPLES 71
Figure 6.1: The Neolithi potsherds.
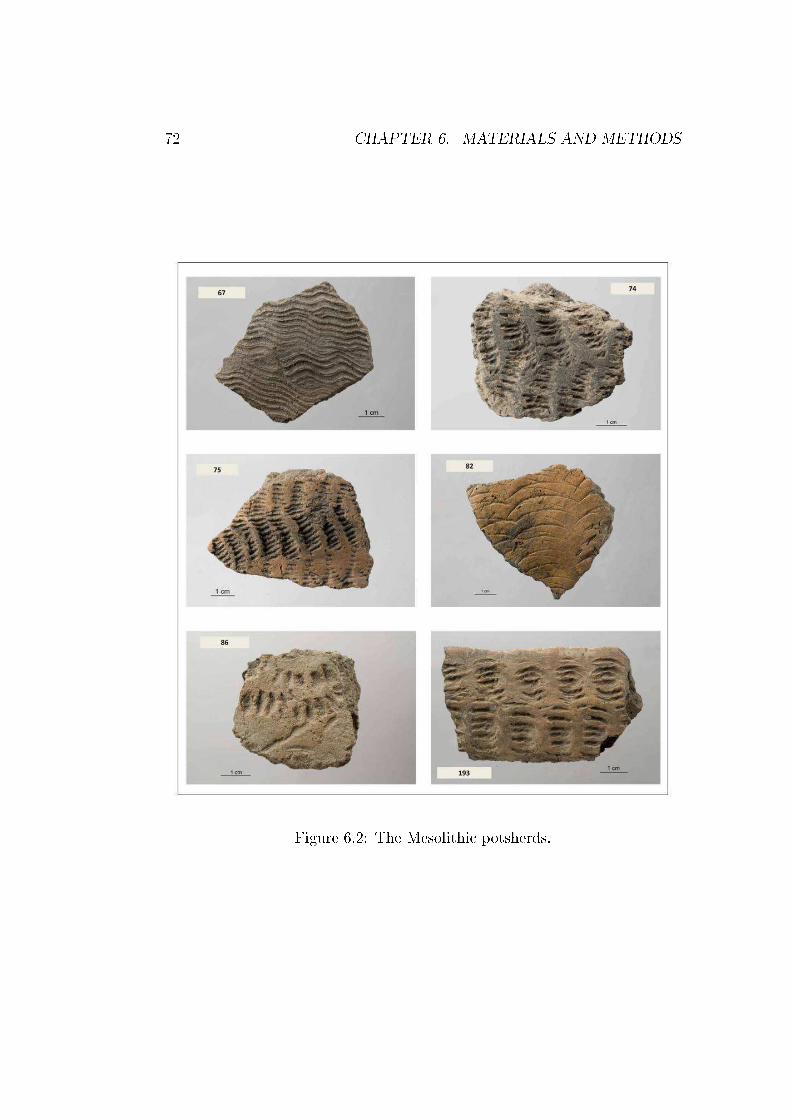
72 CHAPTER 6. MATERIALS AND METHODS
Figure 6.2: The Mesolithi potsherds.
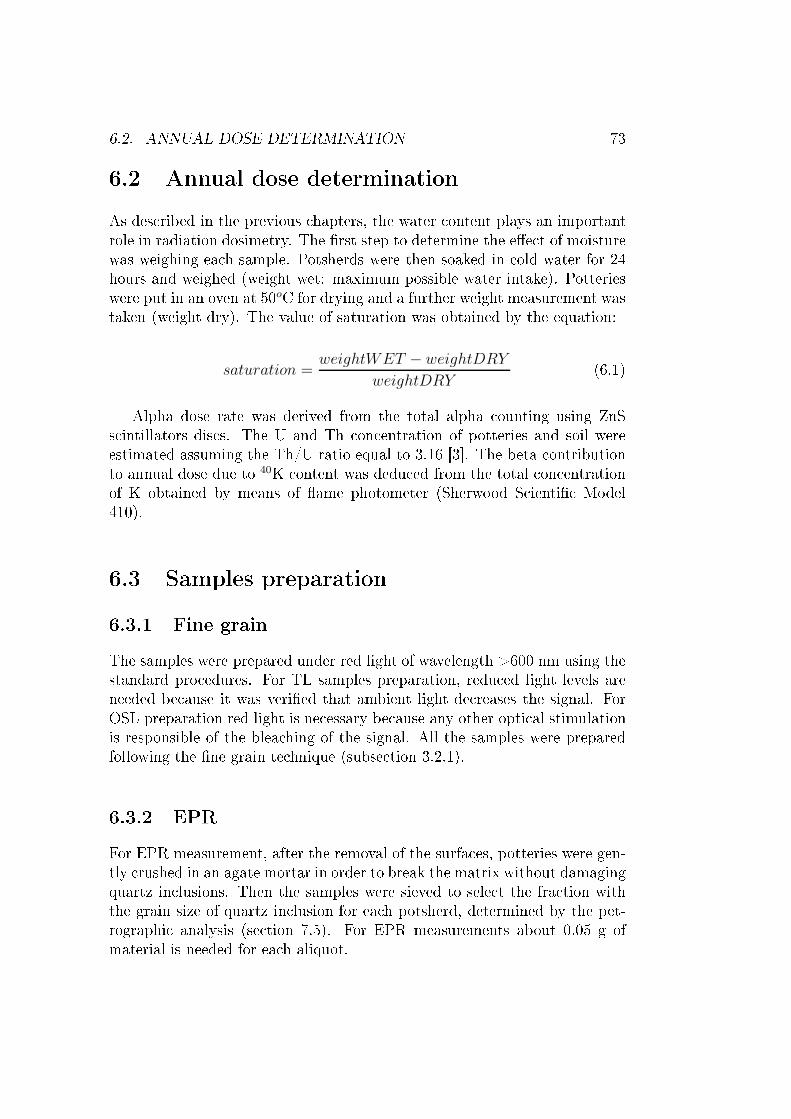
6.2. ANNUAL DOSE DETERMINATION 736.2 Annual dose determinationAs des ribed in the previous hapters, the water ontent plays an importantrole in radiation dosimetry. The �rst step to determine the e�e t of moisturewas weighing ea h sample. Potsherds were then soaked in old water for 24hours and weighed (weight wet: maximum possible water intake). Potterieswere put in an oven at 50oC for drying and a further weight measurement wastaken (weight dry). The value of saturation was obtained by the equation:saturation =
weightWET − weightDRY
weightDRY(6.1)Alpha dose rate was derived from the total alpha ounting using ZnSs intillators dis s. The U and Th on entration of potteries and soil wereestimated assuming the Th/U ratio equal to 3.16 [3℄. The beta ontributionto annual dose due to 40K ontent was dedu ed from the total on entrationof K obtained by means of �ame photometer (Sherwood S ienti� Model410).6.3 Samples preparation6.3.1 Fine grainThe samples were prepared under red light of wavelength >600 nm using thestandard pro edures. For TL samples preparation, redu ed light levels areneeded be ause it was veri�ed that ambient light de reases the signal. ForOSL preparation red light is ne essary be ause any other opti al stimulationis responsible of the blea hing of the signal. All the samples were preparedfollowing the �ne grain te hnique (subse tion 3.2.1).6.3.2 EPRFor EPR measurement, after the removal of the surfa es, potteries were gen-tly rushed in an agate mortar in order to break the matrix without damagingquartz in lusions. Then the samples were sieved to sele t the fra tion withthe grain size of quartz in lusion for ea h potsherd, determined by the pet-rographi analysis (se tion 7.5). For EPR measurements about 0.05 g ofmaterial is needed for ea h aliquot.
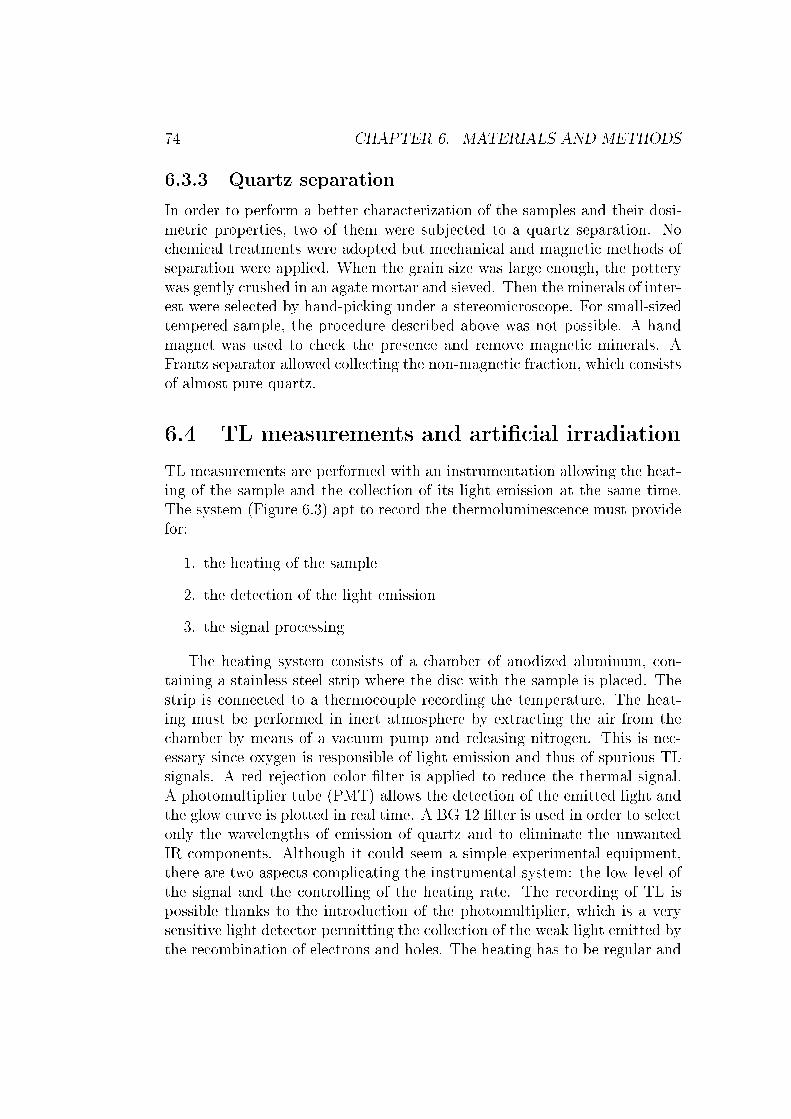
74 CHAPTER 6. MATERIALS AND METHODS6.3.3 Quartz separationIn order to perform a better hara terization of the samples and their dosi-metri properties, two of them were subje ted to a quartz separation. No hemi al treatments were adopted but me hani al and magneti methods ofseparation were applied. When the grain size was large enough, the potterywas gently rushed in an agate mortar and sieved. Then the minerals of inter-est were sele ted by hand-pi king under a stereomi ros ope. For small-sizedtempered sample, the pro edure des ribed above was not possible. A handmagnet was used to he k the presen e and remove magneti minerals. AFrantz separator allowed olle ting the non-magneti fra tion, whi h onsistsof almost pure quartz.6.4 TL measurements and arti� ial irradiationTL measurements are performed with an instrumentation allowing the heat-ing of the sample and the olle tion of its light emission at the same time.The system (Figure 6.3) apt to re ord the thermolumines en e must providefor:1. the heating of the sample2. the dete tion of the light emission3. the signal pro essingThe heating system onsists of a hamber of anodized aluminum, on-taining a stainless steel strip where the dis with the sample is pla ed. Thestrip is onne ted to a thermo ouple re ording the temperature. The heat-ing must be performed in inert atmosphere by extra ting the air from the hamber by means of a va uum pump and releasing nitrogen. This is ne -essary sin e oxygen is responsible of light emission and thus of spurious TLsignals. A red reje tion olor �lter is applied to redu e the thermal signal.A photomultiplier tube (PMT) allows the dete tion of the emitted light andthe glow urve is plotted in real time. A BG 12 �lter is used in order to sele tonly the wavelengths of emission of quartz and to eliminate the unwantedIR omponents. Although it ould seem a simple experimental equipment,there are two aspe ts ompli ating the instrumental system: the low level ofthe signal and the ontrolling of the heating rate. The re ording of TL ispossible thanks to the introdu tion of the photomultiplier, whi h is a verysensitive light dete tor permitting the olle tion of the weak light emitted bythe re ombination of ele trons and holes. The heating has to be regular and
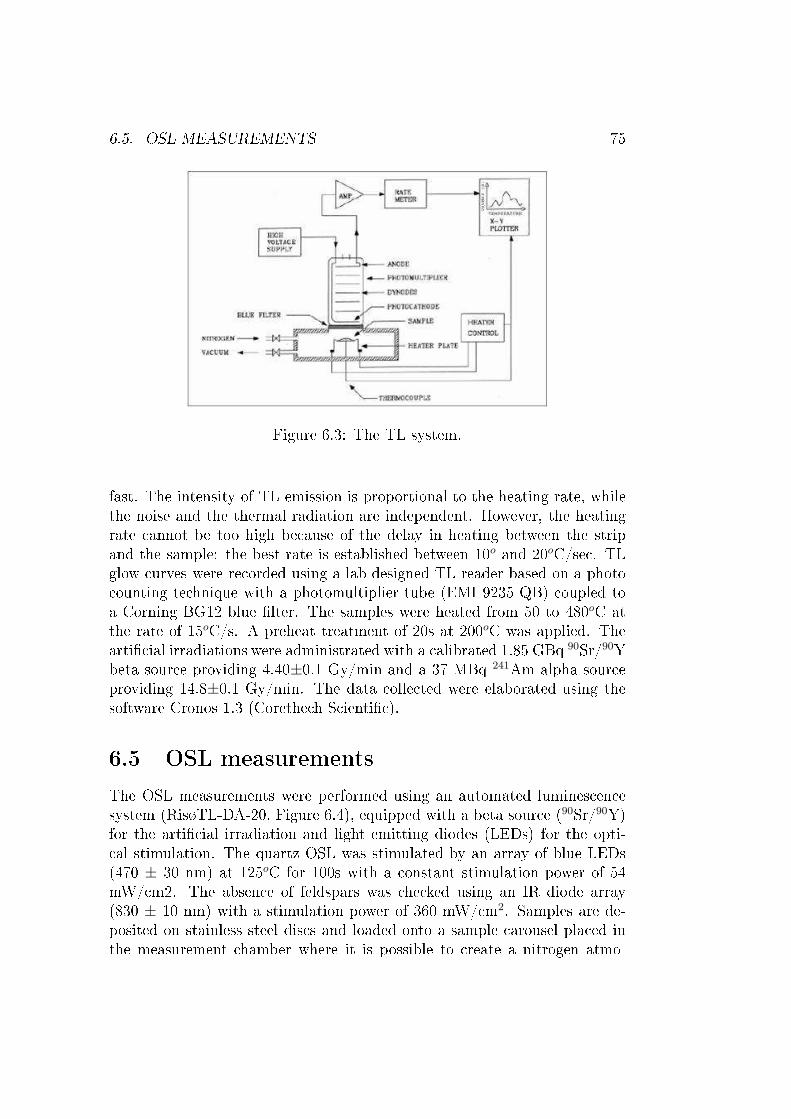
6.5. OSL MEASUREMENTS 75
Figure 6.3: The TL system.fast. The intensity of TL emission is proportional to the heating rate, whilethe noise and the thermal radiation are independent. However, the heatingrate annot be too high be ause of the delay in heating between the stripand the sample: the best rate is established between 10o and 20oC/se . TLglow urves were re orded using a lab designed TL reader based on a photo ounting te hnique with a photomultiplier tube (EMI 9235 QB) oupled toa Corning BG12 blue �lter. The samples were heated from 50 to 480oC atthe rate of 15oC/s. A preheat treatment of 20s at 200oC was applied. Thearti� ial irradiations were administrated with a alibrated 1.85 GBq 90Sr/90Ybeta sour e providing 4.40±0.1 Gy/min and a 37 MBq 241Am alpha sour eproviding 14.8±0.1 Gy/min. The data olle ted were elaborated using thesoftware Cronos 1.3 (Corethe h S ienti� ).6.5 OSL measurementsThe OSL measurements were performed using an automated lumines en esystem (RisøTL-DA-20, Figure 6.4), equipped with a beta sour e (90Sr/90Y)for the arti� ial irradiation and light emitting diodes (LEDs) for the opti- al stimulation. The quartz OSL was stimulated by an array of blue LEDs(470 ± 30 nm) at 125oC for 100s with a onstant stimulation power of 54mW/ m2. The absen e of feldspars was he ked using an IR diode array(830 ± 10 nm) with a stimulation power of 360 mW/ m2. Samples are de-posited on stainless steel dis s and loaded onto a sample arousel pla ed inthe measurement hamber where it is possible to reate a nitrogen atmo-
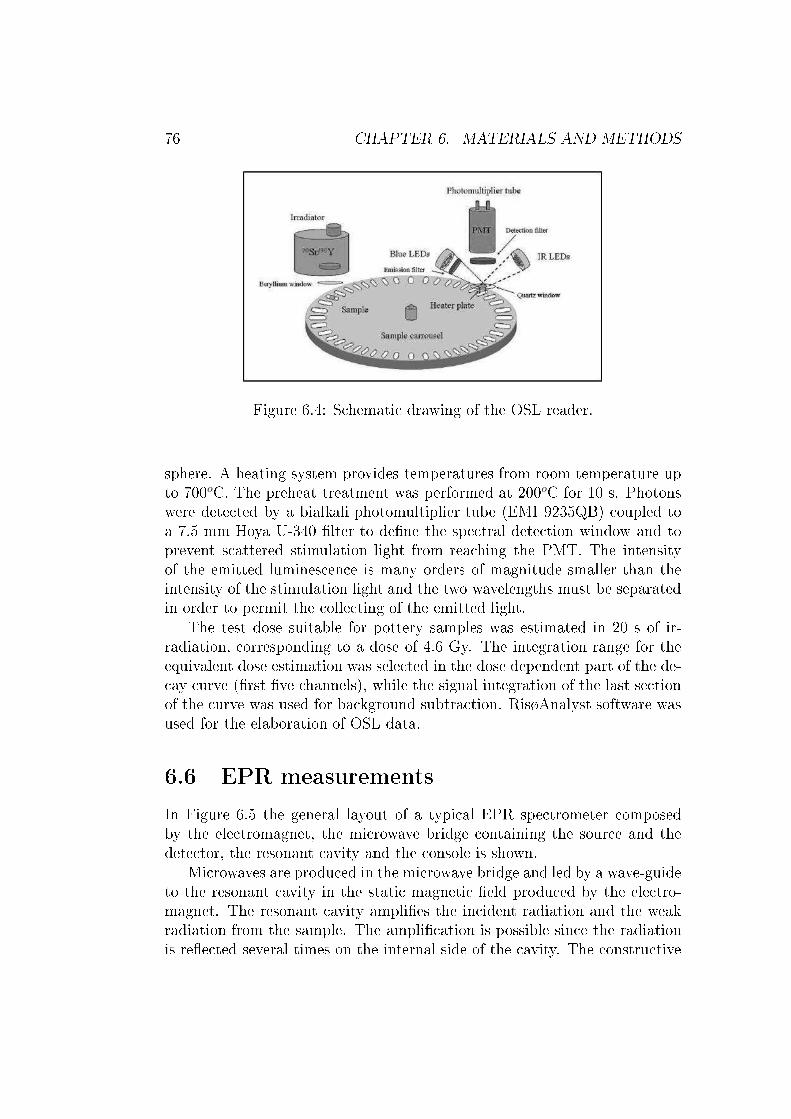
76 CHAPTER 6. MATERIALS AND METHODS
Figure 6.4: S hemati drawing of the OSL reader.sphere. A heating system provides temperatures from room temperature upto 700oC. The preheat treatment was performed at 200oC for 10 s. Photonswere dete ted by a bialkali photomultiplier tube (EMI 9235QB) oupled toa 7.5 mm Hoya U-340 �lter to de�ne the spe tral dete tion window and toprevent s attered stimulation light from rea hing the PMT. The intensityof the emitted lumines en e is many orders of magnitude smaller than theintensity of the stimulation light and the two wavelengths must be separatedin order to permit the olle ting of the emitted light.The test dose suitable for pottery samples was estimated in 20 s of ir-radiation, orresponding to a dose of 4.6 Gy. The integration range for theequivalent dose estimation was sele ted in the dose dependent part of the de- ay urve (�rst �ve hannels), while the signal integration of the last se tionof the urve was used for ba kground subtra tion. RisøAnalyst software wasused for the elaboration of OSL data.6.6 EPR measurementsIn Figure 6.5 the general layout of a typi al EPR spe trometer omposedby the ele tromagnet, the mi rowave bridge ontaining the sour e and thedete tor, the resonant avity and the onsole is shown.Mi rowaves are produ ed in the mi rowave bridge and led by a wave-guideto the resonant avity in the stati magneti �eld produ ed by the ele tro-magnet. The resonant avity ampli�es the in ident radiation and the weakradiation from the sample. The ampli� ation is possible sin e the radiationis re�e ted several times on the internal side of the avity. The onstru tive
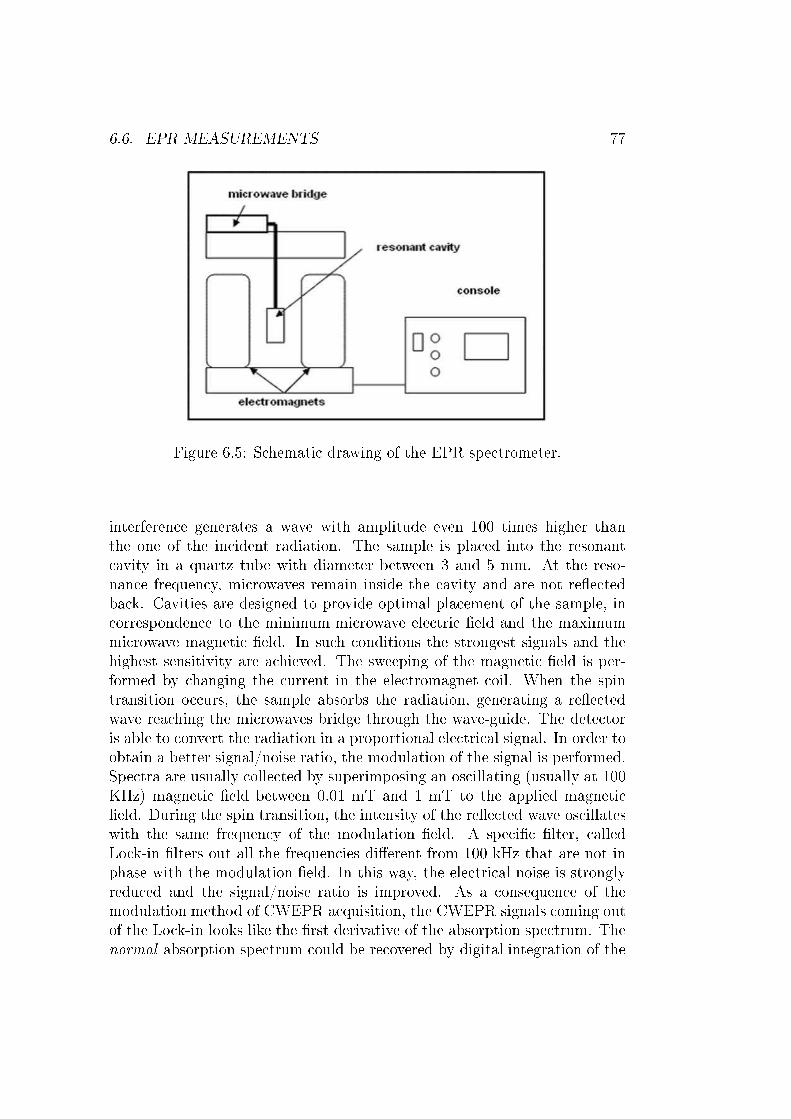
6.6. EPR MEASUREMENTS 77
Figure 6.5: S hemati drawing of the EPR spe trometer.interferen e generates a wave with amplitude even 100 times higher thanthe one of the in ident radiation. The sample is pla ed into the resonant avity in a quartz tube with diameter between 3 and 5 mm. At the reso-nan e frequen y, mi rowaves remain inside the avity and are not re�e tedba k. Cavities are designed to provide optimal pla ement of the sample, in orresponden e to the minimum mi rowave ele tri �eld and the maximummi rowave magneti �eld. In su h onditions the strongest signals and thehighest sensitivity are a hieved. The sweeping of the magneti �eld is per-formed by hanging the urrent in the ele tromagnet oil. When the spintransition o urs, the sample absorbs the radiation, generating a re�e tedwave rea hing the mi rowaves bridge through the wave-guide. The dete toris able to onvert the radiation in a proportional ele tri al signal. In order toobtain a better signal/noise ratio, the modulation of the signal is performed.Spe tra are usually olle ted by superimposing an os illating (usually at 100KHz) magneti �eld between 0.01 mT and 1 mT to the applied magneti �eld. During the spin transition, the intensity of the re�e ted wave os illateswith the same frequen y of the modulation �eld. A spe i� �lter, alledLo k-in �lters out all the frequen ies di�erent from 100 kHz that are not inphase with the modulation �eld. In this way, the ele tri al noise is stronglyredu ed and the signal/noise ratio is improved. As a onsequen e of themodulation method of CWEPR a quisition, the CWEPR signals oming outof the Lo k-in looks like the �rst derivative of the absorption spe trum. Thenormal absorption spe trum ould be re overed by digital integration of the
78 CHAPTER 6. MATERIALS AND METHODSLo k-In CWEPR spe trum, but it is praxis in the EPR ommunity to showthe CWEPR spe trum as it results experimentally. The onsole ontainssignal pro essing, ontrol ele troni s and a omputer. The omputer is usedfor analyzing data as well as oordinating all the units for a quiring a spe -trum. Both CW and Pulsed EPR measurements were made on an ELEXYSBruker spe trometer equipped with a diele tri resonator and Oxford CF 935�ow ryostat. The E ho dete ted spe tra are obtained by the a quisition ofthe two pulse Ele tron Spin E ho while sweeping the magneti �eld. Thee ho intensity is re orded as a fun tion of the magneti �eld. The typi alHahn sequen e (π/2-τ -π-τ -e ho) was used. The arti� ial irradiations wereadministrated with a alibrated 90Sr/90Y beta sour e (dose rate 0.14 Gy/s).6.7 XRF analysisThe bulk hemistry of the samples was determined by X Ray Fluores en espe tros opy [64, 65℄. The external surfa e of ea h shard was leaned frompossible alteration with a mi ro-drill and then ground in powder in an agatemortar. A known amount of powders (nearly 1.5 g) was heated in a fur-na e at 860oC for about 20 minutes and then at 980oC for about 2 hoursfor the determination of loss on ignition (L.O.I.). The L.O.I. an be a�e tedby the volatile elements present: hydrogen, oxygen and arbon that are notdetermined by XRF and are related to the organi matter and the water ofprimary phases or anions, su h as CO3, originally present. Samples was thenprepared as glass beads mixing 0.65 g of the al ined powder and the �uxdi-lithium tetraborate Li2B4O7 with a dilution ratio of 1:10 and melted witha �uxer Claisse Fluxy ( 1150oC). The samples analysis were arried out ona WDS sequential Philips PW2400 spe trometer, operating under va uum onditions equipped with an 3kW Rh tube, �ve analyzing rystals (LiF220,LiF200, Ge, PE, TlAP), two dete tors (�ow ounter and s intillator), three ollimators (150 µm, 300 µm and 700 µm) and four �lters (Al 200 µm, Brass100 µm, Pb 1000 µm and Brass 300 µm). The quantitative and qualitativeanalyses were performed with the software pa kage SuperQ, the on entra-tion of the major and minor elements expressed as per entage of their oxides(SiO2, TiO2, Al2O3, Fe2O3, MnO, MgO, CaO, Na2O, K2O, P2O5) and oftra e elements expressed in ppm (S , V, Cr, Co, Ni, Cu, Zn, Ga, Rb, Sr,Y, Zr, Nb, Ba, La, Ce, Nd, Pb, Th, and U) were dete ted with a pre isionwithin 0.6% relative for major and minor elements, and within 3% relativefor tra e elements. The on entrations were obtained using a alibration lineperformed with International geologi al standards [66℄.
Chapter 7Results and dis ussion7.1 Annual dosesIn Table 7.1 the parameters used for dose rate al ulation of pottery samplesand surrounding soil are summarized.In the light of the available information on the humidity of the site, thepottery was assumed to have been in saturation for 50% of the time. Itshould be noted that all the annual doses al ulated are in the range of thetypi al values observed in pottery with the ex eption of the sample 67. Forthis sherd, a high dose rate is obtained due to the high potassium ontent.The petrographi analysis of the sample revealed a onsiderable amount ofK-feldspar in the temper (unlike the other sherds ontaining only quartz)responsible of the high value of internal dose rate. 40K is on entrated infeldspar grains where it forms part of the latti e stru ture while in quartzis present only as an impurity. The a-value, whi h takes into a ount thedi�erent e� ien y of alpha parti les in indu ing TL, was al ulated for ea hsample. It varies between 0.098 and 0.34 and it is in a ordan e with reporteda-value for polymineral �ne grain pottery samples, being the range from 0.05to 0.5.7.2 TL7.2.1 TL MAADThe MAAD glow urves in Figure 7.1 are representative of the behavior ofall the samples. Di�erent aliquots were used for measuring the natural signaland the arti� ial irradiation indu ed signal (di�erent from sample to sample).Low temperature peaks are not present sin e aliquots were preheated for 10s to 200oC. Both natural and irradiated aliquots show a broad peak entered79
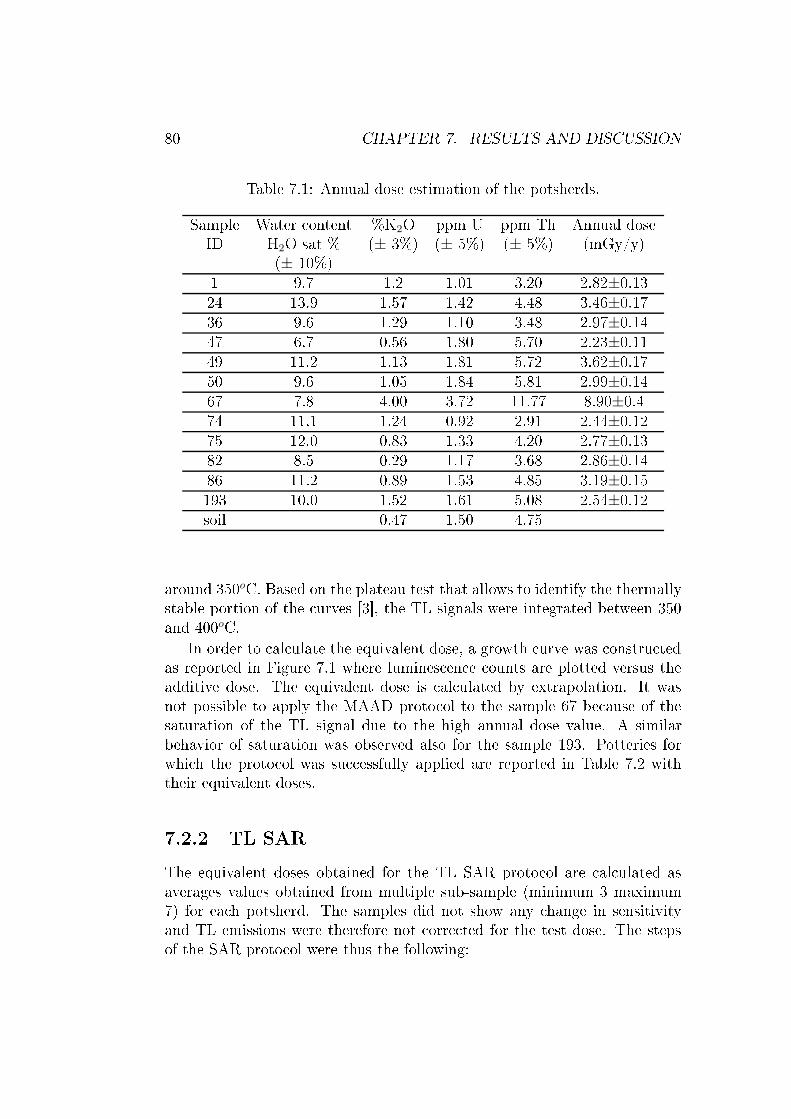
80 CHAPTER 7. RESULTS AND DISCUSSIONTable 7.1: Annual dose estimation of the potsherds.Sample Water ontent %K2O ppm U ppm Th Annual doseID H2O sat % (± 3%) (± 5%) (± 5%) (mGy/y)(± 10%)1 9.7 1.2 1.01 3.20 2.82±0.1324 13.9 1.57 1.42 4.48 3.46±0.1736 9.6 1.29 1.10 3.48 2.97±0.1447 6.7 0.56 1.80 5.70 2.23±0.1149 11.2 1.13 1.81 5.72 3.62±0.1750 9.6 1.05 1.84 5.81 2.99±0.1467 7.8 4.00 3.72 11.77 8.90±0.474 11.1 1.24 0.92 2.91 2.44±0.1275 12.0 0.83 1.33 4.20 2.77±0.1382 8.5 0.29 1.17 3.68 2.86±0.1486 11.2 0.89 1.53 4.85 3.19±0.15193 10.0 1.52 1.61 5.08 2.54±0.12soil 0.47 1.50 4.75around 350oC. Based on the plateau test that allows to identify the thermallystable portion of the urves [3℄, the TL signals were integrated between 350and 400oC.In order to al ulate the equivalent dose, a growth urve was onstru tedas reported in Figure 7.1 where lumines en e ounts are plotted versus theadditive dose. The equivalent dose is al ulated by extrapolation. It wasnot possible to apply the MAAD proto ol to the sample 67 be ause of thesaturation of the TL signal due to the high annual dose value. A similarbehavior of saturation was observed also for the sample 193. Potteries forwhi h the proto ol was su essfully applied are reported in Table 7.2 withtheir equivalent doses.7.2.2 TL SARThe equivalent doses obtained for the TL SAR proto ol are al ulated asaverages values obtained from multiple sub-sample (minimum 3 maximum7) for ea h potsherd. The samples did not show any hange in sensitivityand TL emissions were therefore not orre ted for the test dose. The stepsof the SAR proto ol were thus the following:
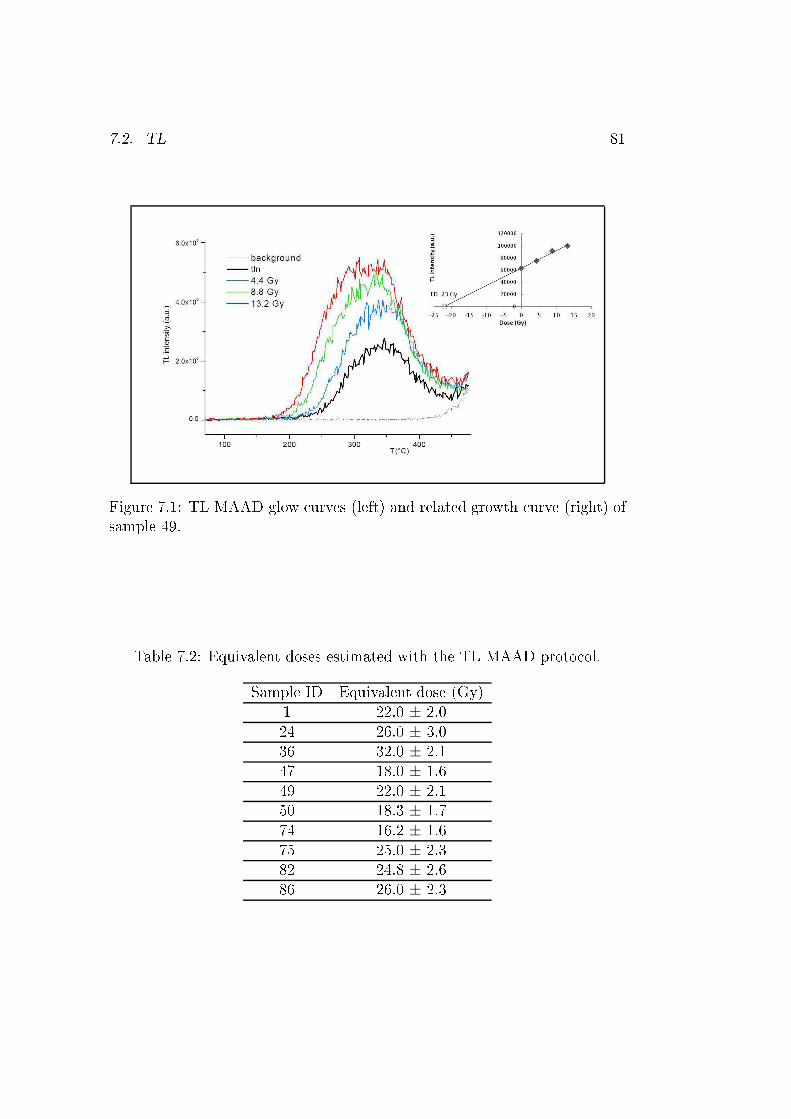
7.2. TL 81
Figure 7.1: TL MAAD glow urves (left) and related growth urve (right) ofsample 49.Table 7.2: Equivalent doses estimated with the TL MAAD proto ol.Sample ID Equivalent dose (Gy)1 22.0 ± 2.024 26.0 ± 3.036 32.0 ± 2.147 18.0 ± 1.649 22.0 ± 2.150 18.3 ± 1.774 16.2 ± 1.675 25.0 ± 2.382 24.8 ± 2.686 26.0 ± 2.3
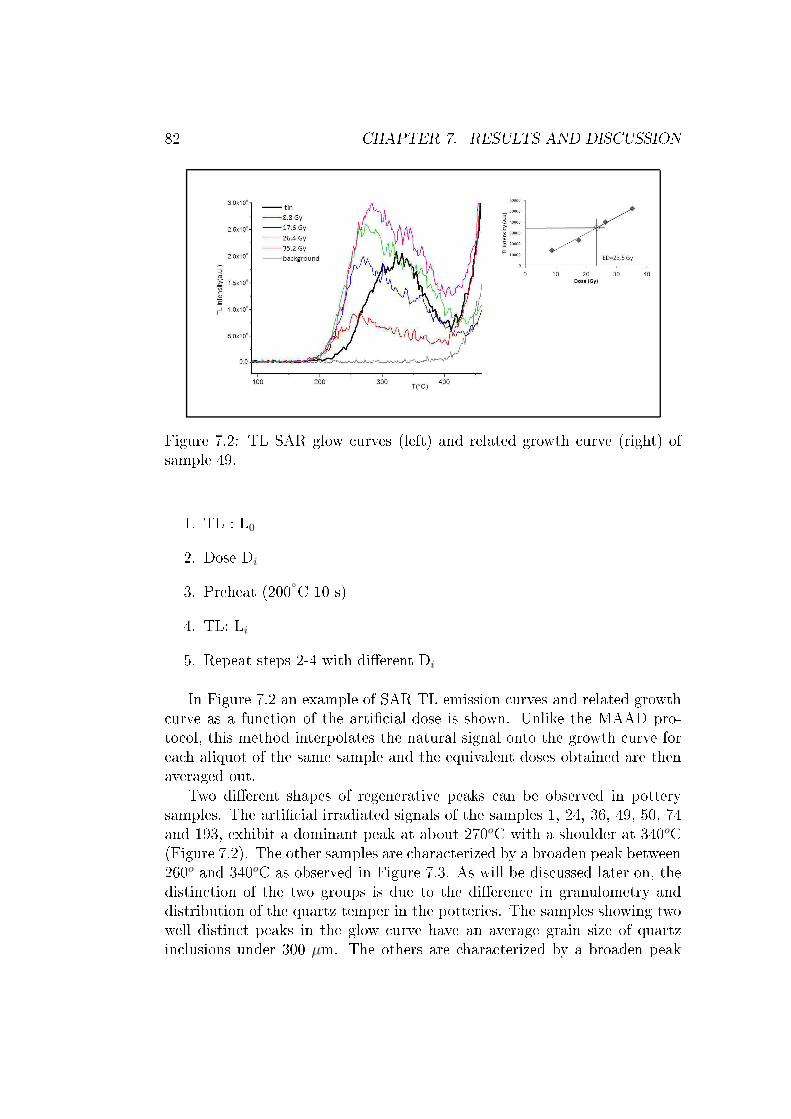
82 CHAPTER 7. RESULTS AND DISCUSSION
Figure 7.2: TL SAR glow urves (left) and related growth urve (right) ofsample 49.1. TL : L02. Dose Di3. Preheat (200◦C 10 s)4. TL: Li5. Repeat steps 2-4 with di�erent DiIn Figure 7.2 an example of SAR TL emission urves and related growth urve as a fun tion of the arti� ial dose is shown. Unlike the MAAD pro-to ol, this method interpolates the natural signal onto the growth urve forea h aliquot of the same sample and the equivalent doses obtained are thenaveraged out.Two di�erent shapes of regenerative peaks an be observed in potterysamples. The arti� ial irradiated signals of the samples 1, 24, 36, 49, 50, 74and 193, exhibit a dominant peak at about 270oC with a shoulder at 340oC(Figure 7.2). The other samples are hara terized by a broaden peak between260o and 340oC as observed in Figure 7.3. As will be dis ussed later on, thedistin tion of the two groups is due to the di�eren e in granulometry anddistribution of the quartz temper in the potteries. The samples showing twowell distin t peaks in the glow urve have an average grain size of quartzin lusions under 300 µm. The others are hara terized by a broaden peak
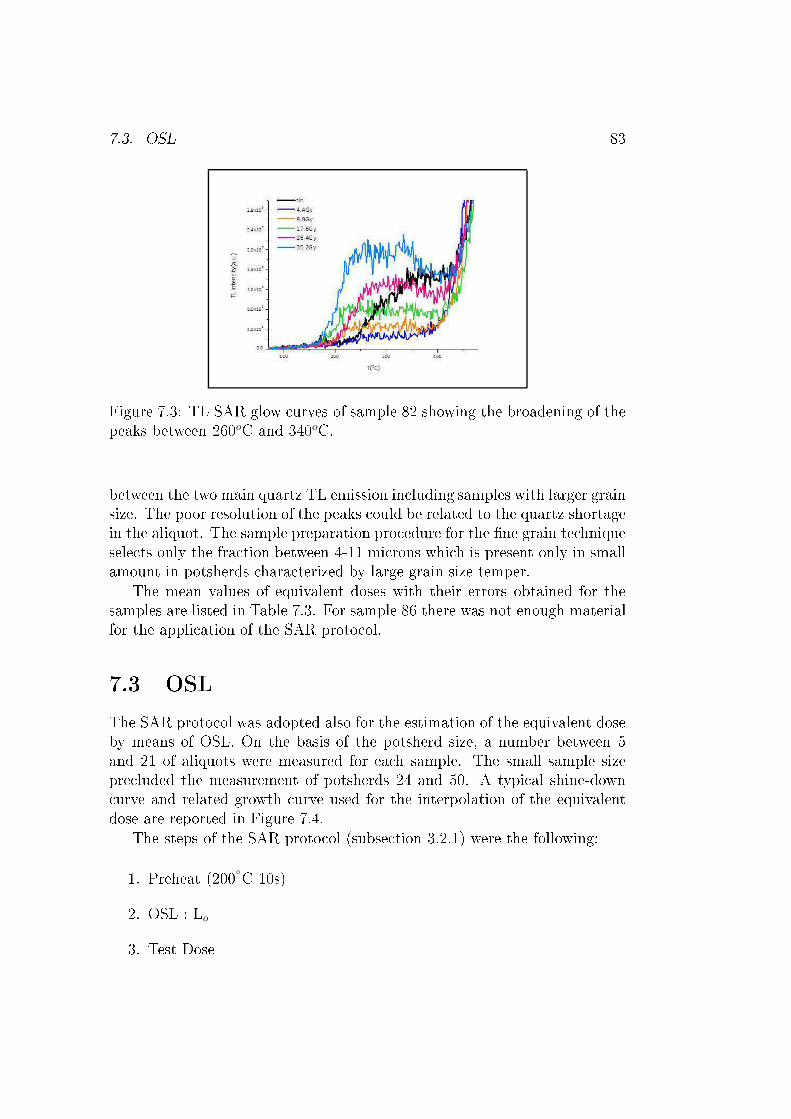
7.3. OSL 83
Figure 7.3: TL SAR glow urves of sample 82 showing the broadening of thepeaks between 260oC and 340oC.between the two main quartz TL emission in luding samples with larger grainsize. The poor resolution of the peaks ould be related to the quartz shortagein the aliquot. The sample preparation pro edure for the �ne grain te hniquesele ts only the fra tion between 4-11 mi rons whi h is present only in smallamount in potsherds hara terized by large grain size temper.The mean values of equivalent doses with their errors obtained for thesamples are listed in Table 7.3. For sample 86 there was not enough materialfor the appli ation of the SAR proto ol.7.3 OSLThe SAR proto ol was adopted also for the estimation of the equivalent doseby means of OSL. On the basis of the potsherd size, a number between 5and 21 of aliquots were measured for ea h sample. The small sample sizepre luded the measurement of potsherds 24 and 50. A typi al shine-down urve and related growth urve used for the interpolation of the equivalentdose are reported in Figure 7.4.The steps of the SAR proto ol (subse tion 3.2.1) were the following:1. Preheat (200◦C 10s)2. OSL : Lo3. Test Dose
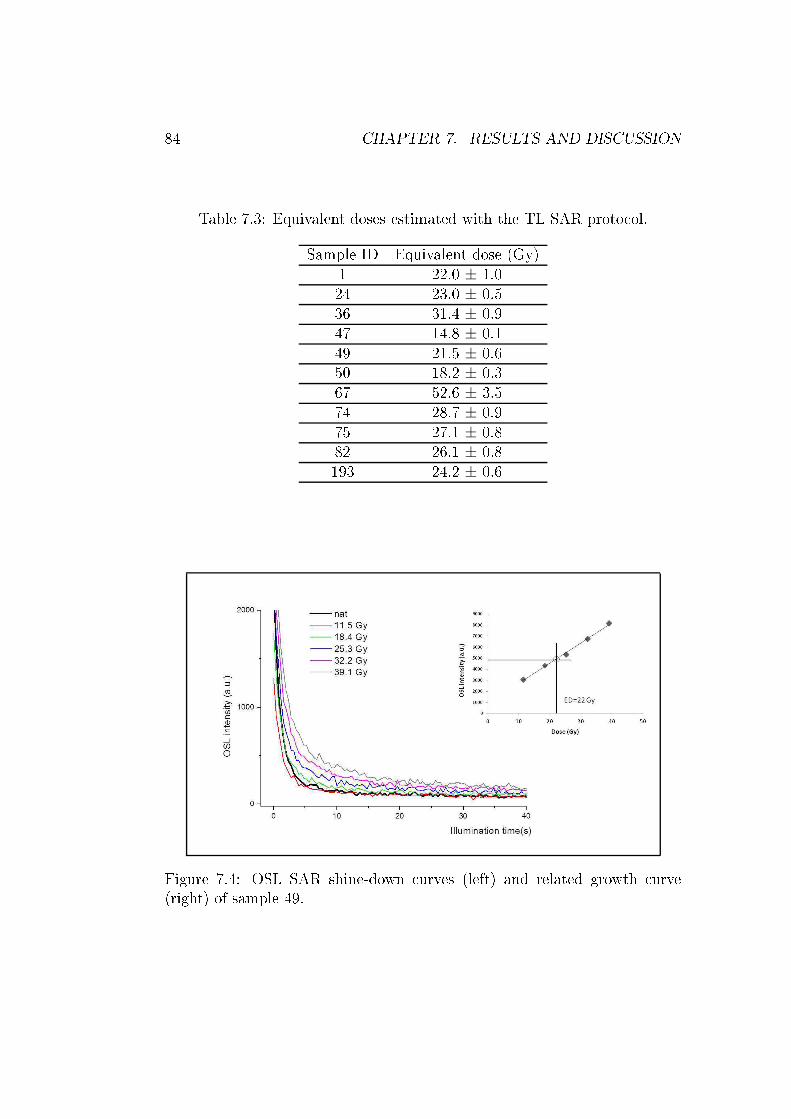
84 CHAPTER 7. RESULTS AND DISCUSSIONTable 7.3: Equivalent doses estimated with the TL SAR proto ol.Sample ID Equivalent dose (Gy)1 22.0 ± 1.024 23.0 ± 0.536 31.4 ± 0.947 14.8 ± 0.149 21.5 ± 0.650 18.2 ± 0.367 52.6 ± 3.574 28.7 ± 0.975 27.1 ± 0.882 26.1 ± 0.8193 24.2 ± 0.6
Figure 7.4: OSL SAR shine-down urves (left) and related growth urve(right) of sample 49.

7.4. COMPARISON BETWEEN LUMINESCENCE AGES 854. Preheat (180◦C 10s)5. OSL: T06. Dose Di7. Preheat8. OSL: Li9. Test Dose10. Preheat11. OSL: Ti12. Repeat steps 6-11 with di�erent DiThe integration range used to obtain the OSL growth urves dose wassele ted in the �rst part of the urves (the �rst �ve hannels orrespondingto the �rst 1.6 t se onds of a quisition were onsidered). The last se tion ofthe urve is onsidered to be independent from the dose and used as ba k-ground (last 20 s of a quisition). Quartz and feldspars rea t di�erently to thewavelength of light stimulation. Pottery sele ted for dating are hara terizedby quartz in lusion but at the end of the SAR sequen e an irradiation inthe IR range was performed in order to verify any ontribution by feldsparto the OSL signal of the mixed minerals aliquots of the samples. An IRSL ontribution was re orded for samples 49, 67, 74, and 193. The re y lingratios and the re uperation tests results indi ate that the OSL SAR is suit-able for dating these samples. The fading rate (rate of lumines en e loss inabsen e of a sour e of stimulation) was measured for all the samples [21℄.The equivalent doses were al ulated taking into a ount the e�e t of fading,however a general underestimation a�e ts the results. Fading is riti al forthe OSL emission of sample 67. As previously des ribed, this sample has atemper hara terized by a onsiderable amount of feldspar, a mineral a�e tedmore than quartz by the anomalous fading. The SAR OSL mean values ofequivalent doses are listed in Table 7.4.7.4 Comparison between lumines en e agesThe ages obtained with ea h pro edure of lumines en e dating (TL MAAD,TL SAR and OSL SAR) are shown in Table 7.5. The ages express the yearspassed sin e the �ring of the potteries and are obtained by dividing the
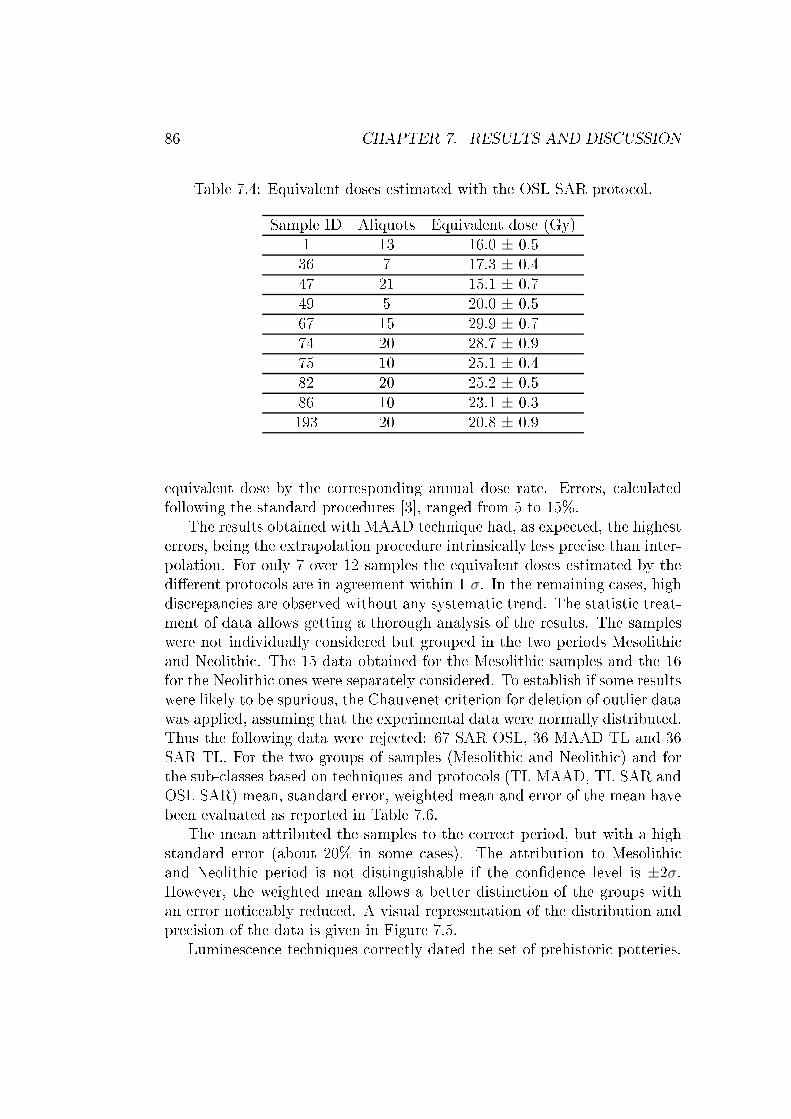
86 CHAPTER 7. RESULTS AND DISCUSSIONTable 7.4: Equivalent doses estimated with the OSL SAR proto ol.Sample ID Aliquots Equivalent dose (Gy)1 13 16.0 ± 0.536 7 17.3 ± 0.447 21 15.1 ± 0.749 5 20.0 ± 0.567 15 29.9 ± 0.774 20 28.7 ± 0.975 10 25.1 ± 0.482 20 25.2 ± 0.586 10 23.1 ± 0.3193 20 20.8 ± 0.9equivalent dose by the orresponding annual dose rate. Errors, al ulatedfollowing the standard pro edures [3℄, ranged from 5 to 15%.The results obtained with MAAD te hnique had, as expe ted, the highesterrors, being the extrapolation pro edure intrinsi ally less pre ise than inter-polation. For only 7 over 12 samples the equivalent doses estimated by thedi�erent proto ols are in agreement within 1 σ. In the remaining ases, highdis repan ies are observed without any systemati trend. The statisti treat-ment of data allows getting a thorough analysis of the results. The sampleswere not individually onsidered but grouped in the two periods Mesolithi and Neolithi . The 15 data obtained for the Mesolithi samples and the 16for the Neolithi ones were separately onsidered. To establish if some resultswere likely to be spurious, the Chauvenet riterion for deletion of outlier datawas applied, assuming that the experimental data were normally distributed.Thus the following data were reje ted: 67 SAR OSL, 36 MAAD TL and 36SAR TL. For the two groups of samples (Mesolithi and Neolithi ) and forthe sub- lasses based on te hniques and proto ols (TL MAAD, TL SAR andOSL SAR) mean, standard error, weighted mean and error of the mean havebeen evaluated as reported in Table 7.6.The mean attributed the samples to the orre t period, but with a highstandard error (about 20% in some ases). The attribution to Mesolithi and Neolithi period is not distinguishable if the on�den e level is ±2σ.However, the weighted mean allows a better distin tion of the groups withan error noti eably redu ed. A visual representation of the distribution andpre ision of the data is given in Figure 7.5.Lumines en e te hniques orre tly dated the set of prehistori potteries.

7.4. COMPARISON BETWEEN LUMINESCENCE AGES 87Table 7.5: Ages of pottery samples obtained with the lumines en e te h-niques expressed in years BP. The �rst group (samples 1-50) omes fromNeolithi layers, US radio arbon dating 6240-6460 BP al 2σ; the se ondgroup (samples 67-193) from Mesolithi layers, US radio arbon dating 8510-9060 BP al 2σ.Sample ID TL MAAD TL SAR OSL SAR1 7810±790 7800±500 5680±31024 7510±940 6640±35036 10760±870 10560±580 5830±30047 8070±820 6640±330 6760±46049 6070±620 5940±320 5520±29050 6120±630 6080±30067 5930±480 4760±17074 6650±730 11770±690 10280±53075 9030±930 9780±540 7730±39082 8680±1000 9140±530 8830±46086 8160±810 7240±350193 9510±500 8160±520Table 7.6: Statisti al treatment of the ages divided for periods (Mesolithi ,�rst group; Neolithi , se ond group) and methods (TL MAAD, TL SAR andOSL SAR). # Mean St. Weighted Weighted Error Errorage dev. mean alendar (1σ) (%)age age (BC)All 14 8630 1510 8600 6590 220 2.6MAAD 4 8130 1050 7900 5890 360 4.6SAR TL 5 9230 1770 9150 7140 240 2.6SAR OSL 5 8450 1180 8050 6040 200 2.5All 14 6600 860 6100 4090 100 1.6MAAD 5 7710 1720 7350 5340 620 8.2SAR TL 5 7280 1740 6550 4540 1060 2.4SAR OSL 4 5950 560 5750 3740 160 2.8
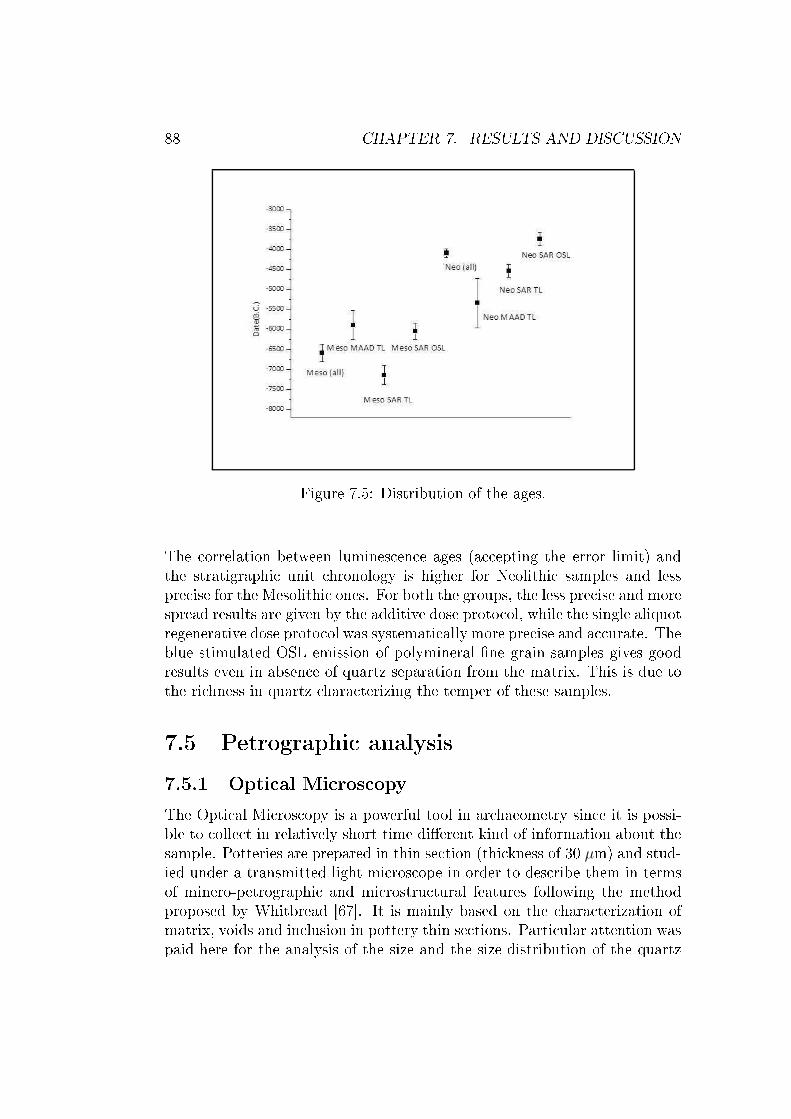
88 CHAPTER 7. RESULTS AND DISCUSSION
Figure 7.5: Distribution of the ages.The orrelation between lumines en e ages (a epting the error limit) andthe stratigraphi unit hronology is higher for Neolithi samples and lesspre ise for the Mesolithi ones. For both the groups, the less pre ise and morespread results are given by the additive dose proto ol, while the single aliquotregenerative dose proto ol was systemati ally more pre ise and a urate. Theblue stimulated OSL emission of polymineral �ne grain samples gives goodresults even in absen e of quartz separation from the matrix. This is due tothe ri hness in quartz hara terizing the temper of these samples.7.5 Petrographi analysis7.5.1 Opti al Mi ros opyThe Opti al Mi ros opy is a powerful tool in ar haeometry sin e it is possi-ble to olle t in relatively short time di�erent kind of information about thesample. Potteries are prepared in thin se tion (thi kness of 30 µm) and stud-ied under a transmitted light mi ros ope in order to des ribe them in termsof minero-petrographi and mi rostru tural features following the methodproposed by Whitbread [67℄. It is mainly based on the hara terization ofmatrix, voids and in lusion in pottery thin se tions. Parti ular attention waspaid here for the analysis of the size and the size-distribution of the quartz
7.5. PETROGRAPHIC ANALYSIS 89in lusions.MatrixThe pottery matrix is de�ned as the �ne-grained groundmass of the lay min-erals, �ne silt and possible glassy material formed during the �ring pro ess.The parti les size is less than 10 µm. The matrix is des ribed in terms ofhomogeneity, orientation and opti al state. The homogeneity onsiders thespatial distribution of textural elements of the erami body; heterogeneitiesmay o ur with respe t of the types of the voids and their distributions, thenature of in lusions and their on entration. The orientation refers to thearrangement in a preferential dire tion of mi as, lay minerals and pores;matrix an be oriented or isotropi . The opti al state is the opti al a tiv-ity observed upon rotation of the thin se tion under rossed polars. In thegroundmass, lay minerals an be parallel aligned forming units alled do-mains. If they display interferen e olors and extin tion, the groundmass isopti ally a tive. Otherwise, if no hanges in rotating the thin se tion areobserved, the matrix is opti ally ina tive. The opti al a tivity depends onthe �ring temperature, as well as on the grain-size of the lay minerals �akesand aplasti in lusions forming the matrix, on the quantity of the organi matter and opaque minerals.VoidsThe voids in the erami body are lassi�ed as primary and se ondary. The�rst term is referred to pores formed during the pro essing of raw materials aused for example by an ex essive speed in working the lay. Se ondaryvoids are instead due to the shrinkage of the lay and the de ompositionof lay minerals, arbonate phases and organi remains during the �ringpro ess. The amount of pores is estimated as a per entage, by omparingthe �eld of view at the mi ros ope with the hart reported in Figure 7.6.The voids shape des ription is based on the lassi� ation of the pores infour di�erent types (Figure 7.7):• planar voids: they are linear in thin se tion but planar in three dimen-sions, width is variable, frequent and sub-angular hanges in dire tionmay be noted• hannels: they may be linear in thin se tion, they are ylindri al in thethree dimensions• vughs: they are relatively large and irregular voids• vesi les: they are regular in shape with smooth surfa es
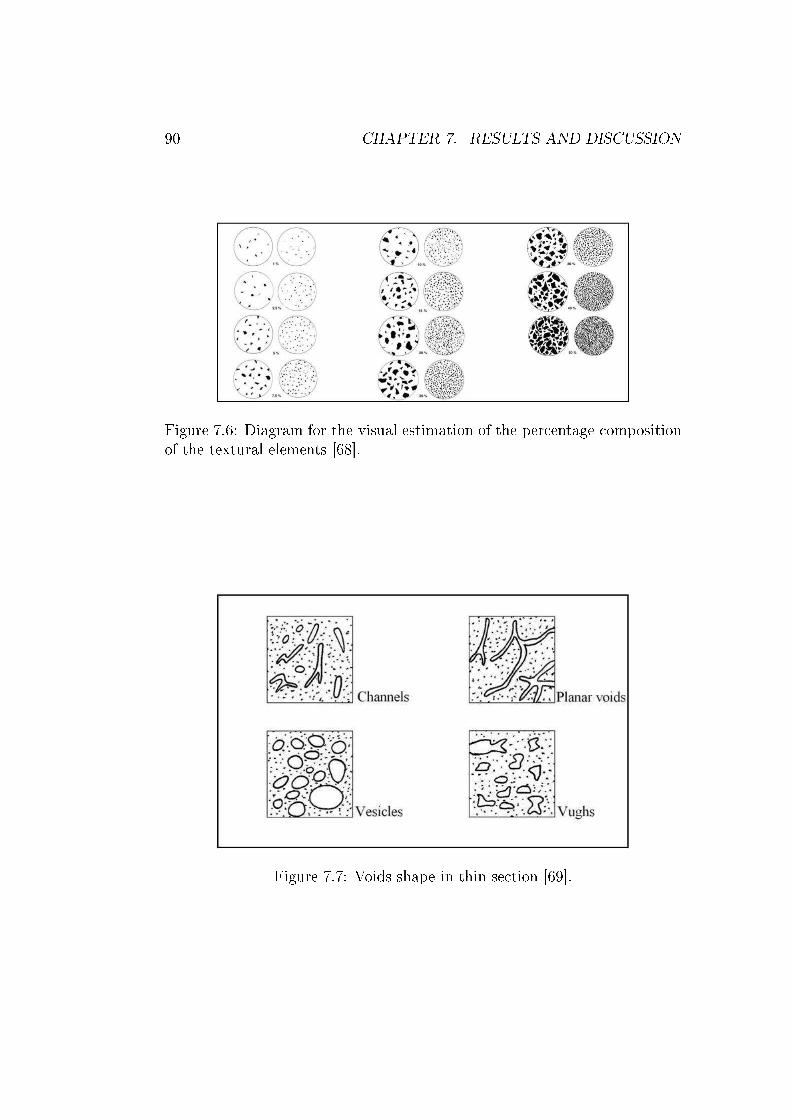
90 CHAPTER 7. RESULTS AND DISCUSSION
Figure 7.6: Diagram for the visual estimation of the per entage ompositionof the textural elements [68℄.
Figure 7.7: Voids shape in thin se tion [69℄.
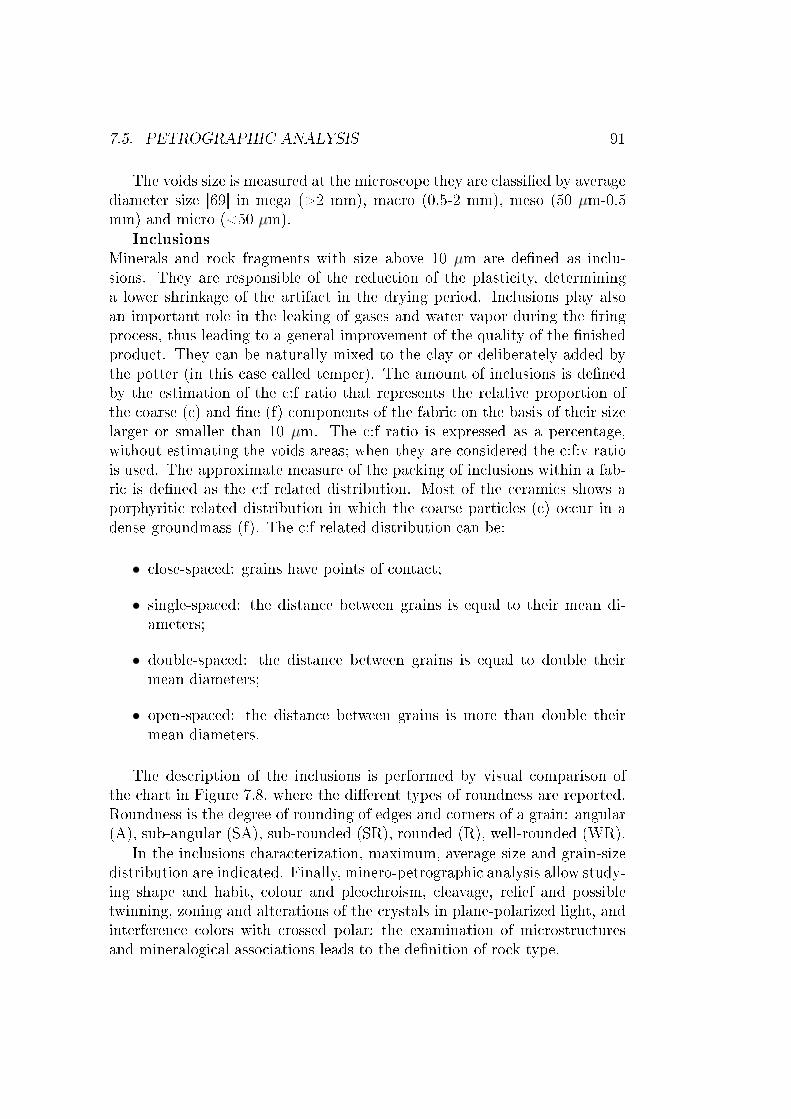
7.5. PETROGRAPHIC ANALYSIS 91The voids size is measured at the mi ros ope they are lassi�ed by averagediameter size [69℄ in mega (>2 mm), ma ro (0.5-2 mm), meso (50 µm-0.5mm) and mi ro (<50 µm).In lusionsMinerals and ro k fragments with size above 10 µm are de�ned as in lu-sions. They are responsible of the redu tion of the plasti ity, determininga lower shrinkage of the artifa t in the drying period. In lusions play alsoan important role in the leaking of gases and water vapor during the �ringpro ess, thus leading to a general improvement of the quality of the �nishedprodu t. They an be naturally mixed to the lay or deliberately added bythe potter (in this ase alled temper). The amount of in lusions is de�nedby the estimation of the :f ratio that represents the relative proportion ofthe oarse ( ) and �ne (f) omponents of the fabri on the basis of their sizelarger or smaller than 10 µm. The :f ratio is expressed as a per entage,without estimating the voids areas; when they are onsidered the :f:v ratiois used. The approximate measure of the pa king of in lusions within a fab-ri is de�ned as the :f related distribution. Most of the erami s shows aporphyriti related distribution in whi h the oarse parti les ( ) o ur in adense groundmass (f). The :f related distribution an be:• lose-spa ed: grains have points of onta t;• single-spa ed: the distan e between grains is equal to their mean di-ameters;• double-spa ed: the distan e between grains is equal to double theirmean diameters;• open-spa ed: the distan e between grains is more than double theirmean diameters.The des ription of the in lusions is performed by visual omparison ofthe hart in Figure 7.8, where the di�erent types of roundness are reported.Roundness is the degree of rounding of edges and orners of a grain: angular(A), sub-angular (SA), sub-rounded (SR), rounded (R), well-rounded (WR).In the in lusions hara terization, maximum, average size and grain-sizedistribution are indi ated. Finally, minero-petrographi analysis allow study-ing shape and habit, olour and pleo hroism, leavage, relief and possibletwinning, zoning and alterations of the rystals in plane-polarized light, andinterferen e olors with rossed polar; the examination of mi rostru turesand mineralogi al asso iations leads to the de�nition of ro k-type.
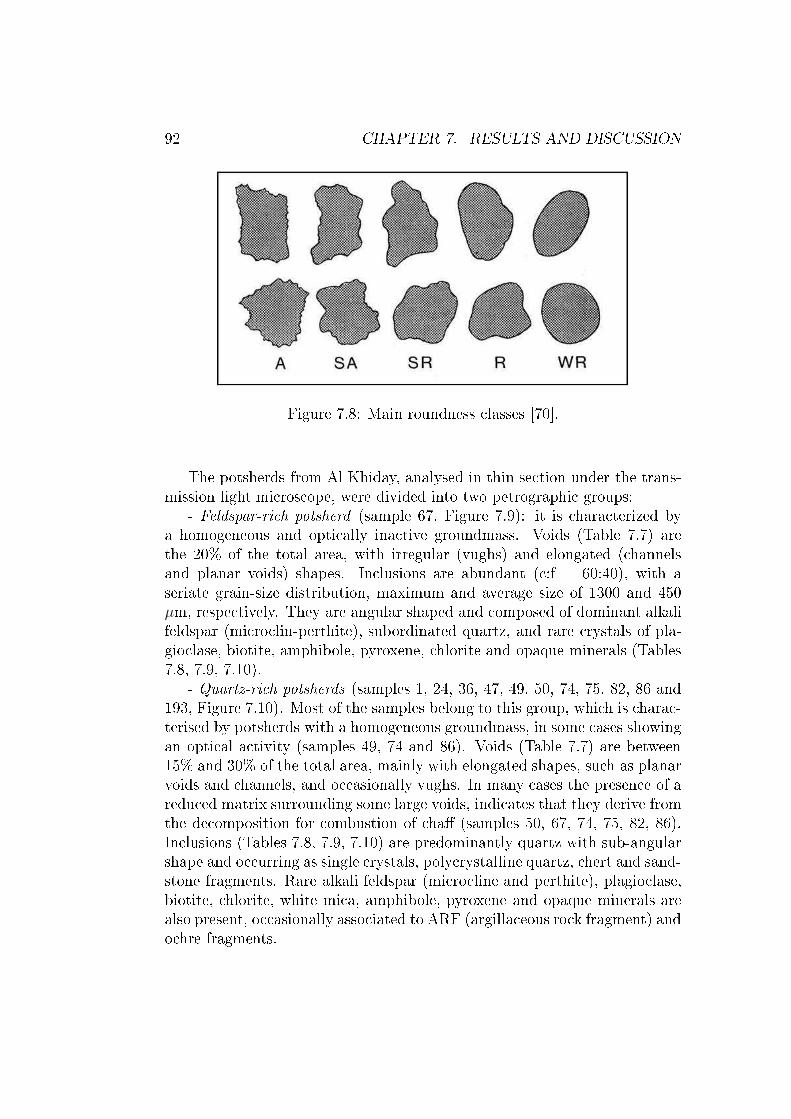
92 CHAPTER 7. RESULTS AND DISCUSSION
Figure 7.8: Main roundness lasses [70℄.The potsherds from Al Khiday, analysed in thin se tion under the trans-mission light mi ros ope, were divided into two petrographi groups:- Feldspar-ri h potsherd (sample 67, Figure 7.9): it is hara terized bya homogeneous and opti ally ina tive groundmass. Voids (Table 7.7) arethe 20% of the total area, with irregular (vughs) and elongated ( hannelsand planar voids) shapes. In lusions are abundant ( :f = 60:40), with aseriate grain-size distribution, maximum and average size of 1300 and 450µm, respe tively. They are angular shaped and omposed of dominant alkalifeldspar (mi ro lin-perthite), subordinated quartz, and rare rystals of pla-gio lase, biotite, amphibole, pyroxene, hlorite and opaque minerals (Tables7.8, 7.9, 7.10).- Quartz-ri h potsherds (samples 1, 24, 36, 47, 49, 50, 74, 75, 82, 86 and193, Figure 7.10). Most of the samples belong to this group, whi h is hara -terised by potsherds with a homogeneous groundmass, in some ases showingan opti al a tivity (samples 49, 74 and 86). Voids (Table 7.7) are between15% and 30% of the total area, mainly with elongated shapes, su h as planarvoids and hannels, and o asionally vughs. In many ases the presen e of aredu ed matrix surrounding some large voids, indi ates that they derive fromthe de omposition for ombustion of ha� (samples 50, 67, 74, 75, 82, 86).In lusions (Tables 7.8, 7.9, 7.10) are predominantly quartz with sub-angularshape and o urring as single rystals, poly rystalline quartz, hert and sand-stone fragments. Rare alkali feldspar (mi ro line and perthite), plagio lase,biotite, hlorite, white mi a, amphibole, pyroxene and opaque minerals arealso present, o asionally asso iated to ARF (argilla eous ro k fragment) ando hre fragments.
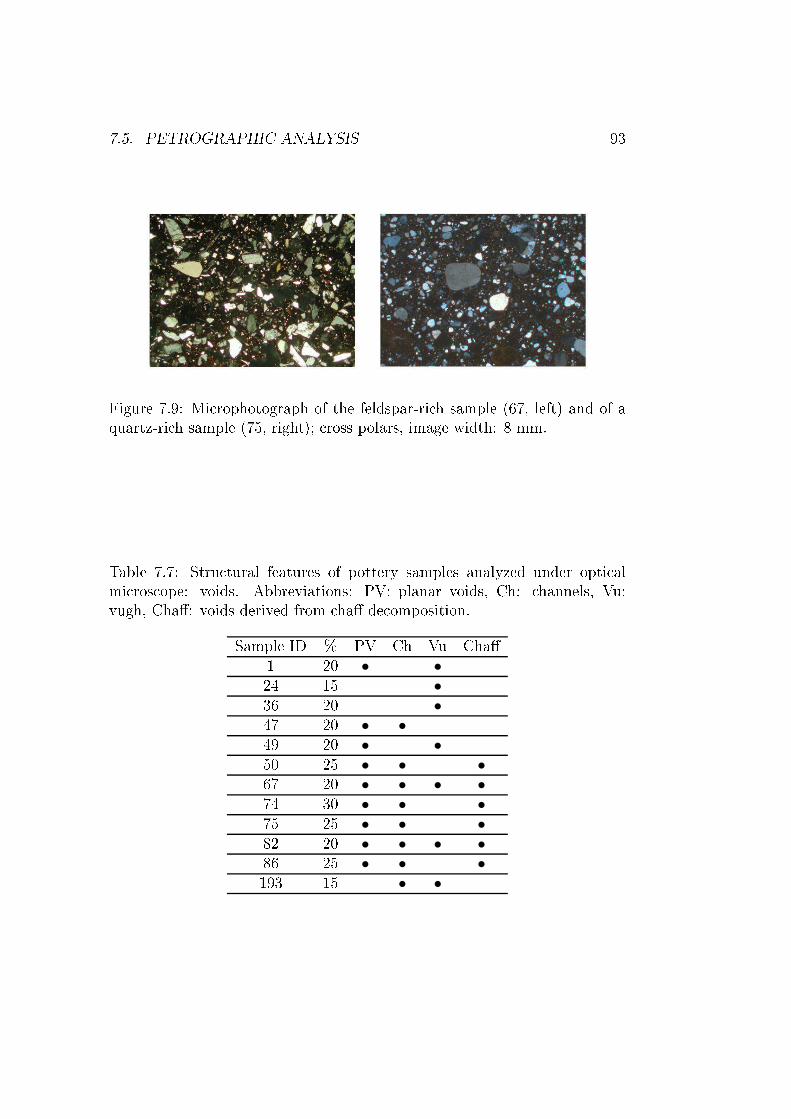
7.5. PETROGRAPHIC ANALYSIS 93
Figure 7.9: Mi rophotograph of the feldspar-ri h sample (67, left) and of aquartz-ri h sample (75, right); ross polars, image width: 8 mm.Table 7.7: Stru tural features of pottery samples analyzed under opti almi ros ope: voids. Abbreviations: PV: planar voids, Ch: hannels, Vu:vugh, Cha�: voids derived from ha� de omposition.Sample ID % PV Ch Vu Cha�1 20 • •24 15 •36 20 •47 20 • •49 20 • •50 25 • • •67 20 • • • •74 30 • • •75 25 • • •82 20 • • • •86 25 • • •193 15 • •
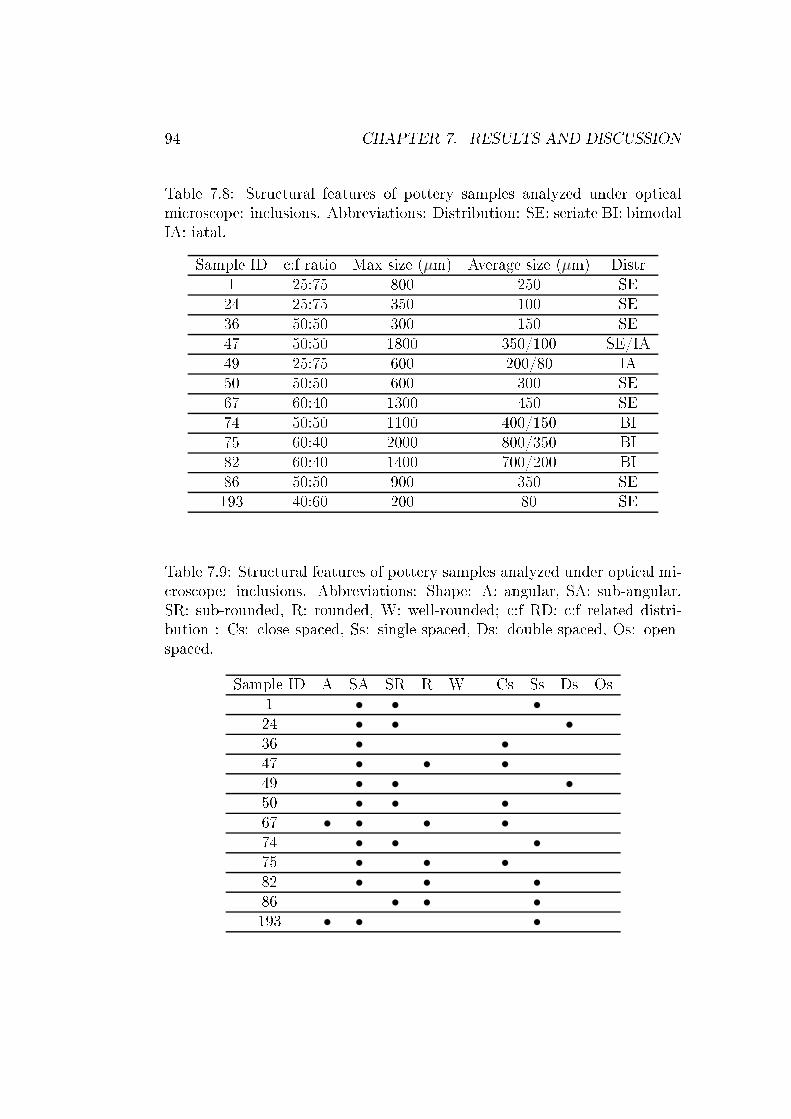
94 CHAPTER 7. RESULTS AND DISCUSSIONTable 7.8: Stru tural features of pottery samples analyzed under opti almi ros ope: in lusions. Abbreviations: Distribution: SE: seriate BI: bimodalIA: iatal.Sample ID :f ratio Max size (µm) Average size (µm) Distr1 25:75 800 250 SE24 25:75 350 100 SE36 50:50 300 150 SE47 50:50 1800 350/100 SE/IA49 25:75 600 200/80 IA50 50:50 600 300 SE67 60:40 1300 450 SE74 50:50 1100 400/150 BI75 60:40 2000 800/350 BI82 60:40 1400 700/200 BI86 50:50 900 350 SE193 40:60 200 80 SETable 7.9: Stru tural features of pottery samples analyzed under opti al mi- ros ope: in lusions. Abbreviations: Shape: A: angular, SA: sub-angular,SR: sub-rounded, R: rounded, W: well-rounded; :f RD: :f related distri-bution : Cs: lose spa ed, Ss: single-spa ed, Ds: double-spa ed, Os: open-spa ed. Sample ID A SA SR R W Cs Ss Ds Os1 • • •24 • • •36 • •47 • • •49 • • •50 • • •67 • • • •74 • • •75 • • •82 • • •86 • • •193 • • •
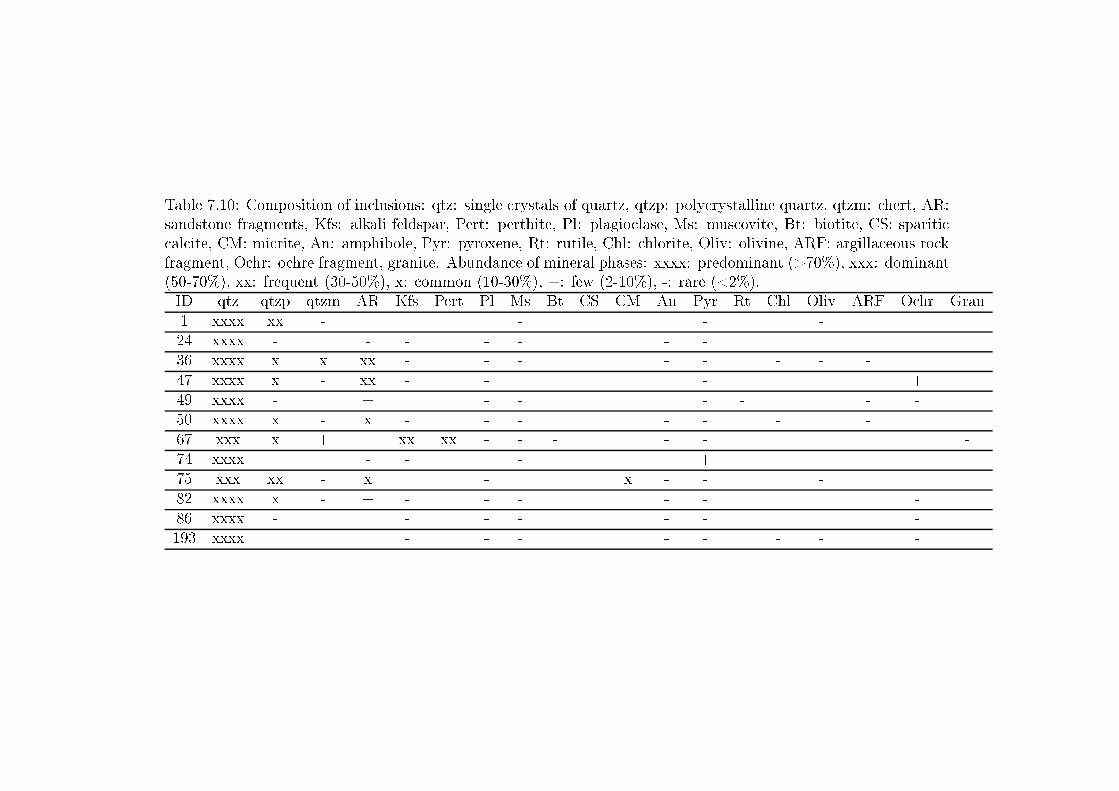
Table 7.10: Composition of in lusions: qtz: single rystals of quartz, qtzp: poly rystalline quartz, qtzm: hert, AR:sandstone fragments, Kfs: alkali feldspar, Pert: perthite, Pl: plagio lase, Ms: mus ovite, Bt: biotite, CS: spariti al ite, CM: mi rite, An: amphibole, Pyr: pyroxene, Rt: rutile, Chl: hlorite, Oliv: olivine, ARF: argilla eous ro kfragment, O hr: o hre fragment, granite. Abundan e of mineral phases: xxxx: predominant (>70%), xxx: dominant(50-70%), xx: frequent (30-50%), x: ommon (10-30%), +: few (2-10%), -: rare (<2%).ID qtz qtzp qtzm AR Kfs Pert Pl Ms Bt CS CM An Pyr Rt Chl Oliv ARF O hr Gran1 xxxx xx - - - -24 xxxx - - - - - - -36 xxxx x x xx - - - - - - - -47 xxxx x - xx - - - +49 xxxx - + - - - - - -50 xxxx x - x - - - - - - -67 xxx x + + xx xx - - - - - -74 xxxx - - + - + +75 xxx xx - x - x - - -82 xxxx x - + - - - - - -86 xxxx - + - - - - - -193 xxxx - - - - - - - -
96 CHAPTER 7. RESULTS AND DISCUSSIONAbundan e and grain-size distribution of in lusions is very variable, anddi�erent situations an be de�ned. More in detail, :f ratio are: 25:75 (sam-ples: 1, 24, 49), 40:60 (sample 193), 50:50 (samples 36, 47, 50, 74, 86), 60:40(samples 75, 82). Two di�erent grain-size distributions an be observed inthe samples: seriate unimodal (samples 1, 24, 36, 50, 86, 193) and bimodal(samples 47, 49, 74, 75, 82). The in lusions di�erent from quartz were on-sidered negligible for dating purpose due to their rarity. The a tive matrixobserved for three samples ould be an indi ation of low �ring temperatures.Even not very high, the temperature rea hed during �ring was su� ient toreset the geologi al signal of the raw materials. As attested by TL glow urves, the emissions are not a�e ted by partial blea hing of the signal, aphenomenon observed when a residual lumines en e is present.7.5.2 Digital Image Analysis (DIA)Sin e quartz-ri h samples are highly dissimilar in terms of grain-size dis-tribution (Table 7.8), it is not possible to distinguish homogeneous groups.Therefore, in order to des ribe properly the grain-size distribution, a quanti-tative approa h had to be arried out trhought digital image analysis (DIA).DIA was traditionally gained by visual estimation, a method relatively fastbut with low a ura y and reprodu ibility, or by point ounting, a methodthat has higher a ura y but very time onsuming ([71, 72, 73, 74℄). Here, omputerized analysis of digital images was performed representing a on-siderable saving in time and in reasing the pre ision and reprodu ibility ofthe work. The following proto ol was adopted for DIA of quartz-ri h pot-sherds. A set of about 5-6 images, overing all the sample se tion, were takenfor ea h sample under opti al mi ros ope at ross polars. The images werethen pro essed using the graphi al software pa kage ImageJ (1.44p NationalInstitute of Health, USA). Ea h image was onverted into 8-bit grey-s ale,and a series of pre-pro essing steps were done to improve the quality of theimage before being segmented. In parti ular, the brightness and ontrastwere enhan ed and the noises were redu ed and smoothed with a median�lter. The noise redu tion was performed removing the outliers through analgorithm whi h repla es a pixel by the median of the pixels in the surround-ing, if it deviates from the median by more than a ertain value ( hosen bythe operator). This pro edure was also useful to orre t faulty pixels. The�les was saved as TIFF type (Tagged Image File Format), an un ompressed�le format that prevent the loss of image quality. Then, the segmentationwas arried out through an unsupervised lassi� ation mode, using Multi-Spe (version 3.3, Purdue Resear h Foundation). The image segmentationis the pro ess of partitioning a digital image into several segments, or sets
7.5. PETROGRAPHIC ANALYSIS 97of pixels, in order simplify its representation in a se ond image that is moremeaningful and easier to analyze. Partition usually de�nes homogeneousregions whi h over the entire image, without interse tions. Every pixel isassigned to one segment. In the unsupervised lassi� ation ( lustering), thegrey tones were assigned to a set of 25 arbitrary lasses, overing all therange of grey values of the image (from bla k to white, 0-255). Di�erentmineral phases or textural features may not orrespond to a single lass, but ould be des ribed by more lasses. In this ase study, sin e the DIA wasperformed on images obtained under the opti al mi ros opy in ross polars,quartz in lusions display a variable interferen e olour. This is due to theorientation of the opti al axes of the minerals with respe t to the polars,showing all the grey tones from the white (maximum birefringen e whenparallel to the opti al axes) to the bla k (perpendi ular to the opti al axesor in extin tion position). Quartz in lusions were assigned by the operator,grouping su essive lasses (between 10 and 12) using ImageJ, and onvertedto a binary image. This method allows obtaining a segmented representativeimage (binary image), in whi h the sele ted quartz grains do not su�er ofproblems onne ted with extin tion. An ongoing resear h (Maritan, personal ommuni ation) on the degree of similarity between the parti les distribu-tion of a sample as dete ted using di�erent a quisition methods ( ross polarsopti al mi ros opy, ba k-s attered s anning ele tron mi ros opy SEM-BSE,and mi ro hemi al mapping under s anning ele tron mi ros opy) indi atesthat the results a hieved by the approa h here adopted are reliable. Afterthe segmentation, further manual treatment of binary images is required inorder to redu e disturban es and obtain a more orre t representation of theanalysed phase. Parti le analysis on the binary images allowed extra tingthe Minimum Feret diameter (MinFeret) of quartz grains. Min Feret is de-�ned as the shortest distan e between any two points along the sele ted grainboundary, whi h orresponds to the minimum size of quartz in lusion. Theuse of MinFeret diameter to des ribe the parti les size was hosen for theirsimilarity with parameters used in sedimentology resear hes, in parti ularto grain size obtained by sieving method (the most used method to de�negrain-size urve in sedimentology). More in detail, grain-size distributionswere des ribed by means of frequen y distribution diagrams of the MinFeretvs. the parti le per entage area, using Statgraphi s Centurion XVI. The sizedistribution of the quartz in lusions of the pottery samples were expressedin the form of box plot whi h is a graphi al des ription of the distribution ofa variable through �ve-number summaries (Figure 7.10):• Q0: the smallest observation (sample minimum);• Q1: lower quartile: 25% of the umulative frequen y;
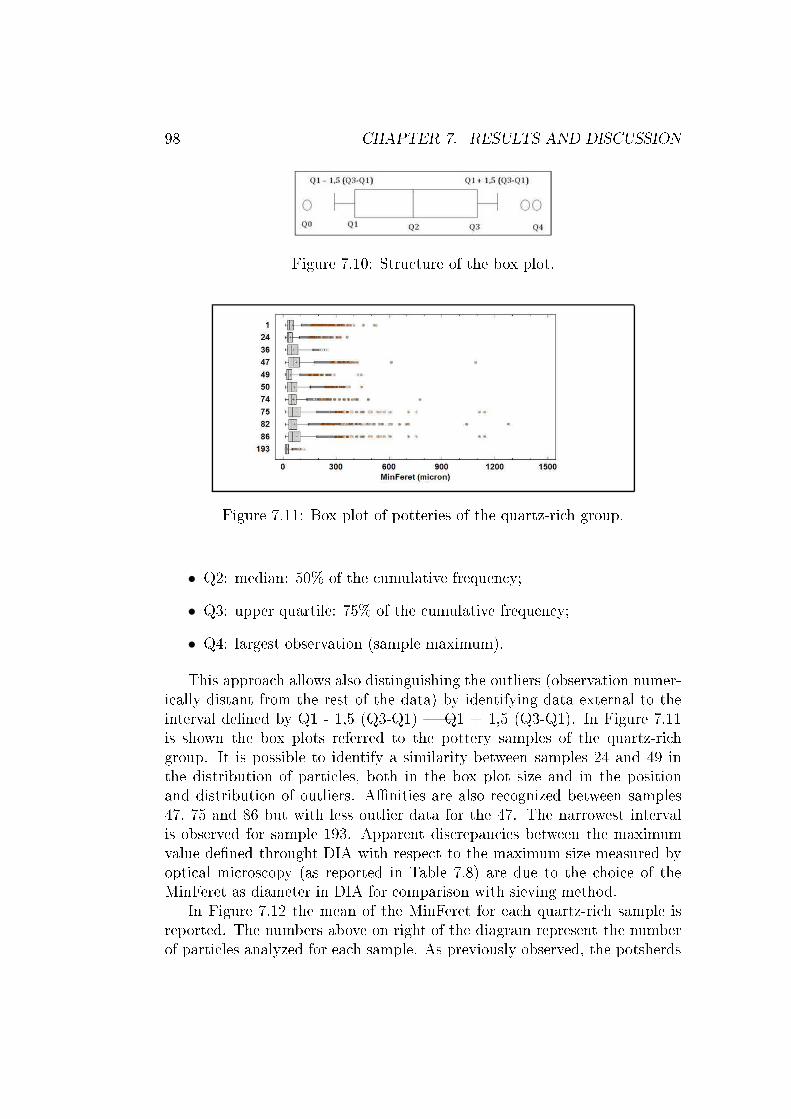
98 CHAPTER 7. RESULTS AND DISCUSSIONFigure 7.10: Stru ture of the box plot.
Figure 7.11: Box plot of potteries of the quartz-ri h group.• Q2: median: 50% of the umulative frequen y;• Q3: upper quartile: 75% of the umulative frequen y;• Q4: largest observation (sample maximum).This approa h allows also distinguishing the outliers (observation numer-i ally distant from the rest of the data) by identifying data external to theinterval de�ned by Q1 - 1,5 (Q3-Q1) � Q1 + 1,5 (Q3-Q1). In Figure 7.11is shown the box plots referred to the pottery samples of the quartz-ri hgroup. It is possible to identify a similarity between samples 24 and 49 inthe distribution of parti les, both in the box plot size and in the positionand distribution of outliers. A�nities are also re ognized between samples47, 75 and 86 but with less outlier data for the 47. The narrowest intervalis observed for sample 193. Apparent dis repan ies between the maximumvalue de�ned throught DIA with respe t to the maximum size measured byopti al mi ros opy (as reported in Table 7.8) are due to the hoi e of theMinFeret as diameter in DIA for omparison with sieving method.In Figure 7.12 the mean of the MinFeret for ea h quartz-ri h sample isreported. The numbers above on right of the diagram represent the numberof parti les analyzed for ea h sample. As previously observed, the potsherds

7.5. PETROGRAPHIC ANALYSIS 99
Figure 7.12: Mean of MinFeret for samples of the quartz-ri h group with thenumber of parti les analyzed.show very di�erent grain sizes, preventing from the possibility of distinguishhomogeneous groups. It is important to note that the petrographi featuresobserved under the opti al mi ros opy were only qualitative, while by theDIA it was possible to quantify them. Moreover, by the DIA approa h itis possible to pro ess a number of parti les not a hievable by the standardmi ros opi analysis.Grain-size distribution was also determined in terms of area per entageas shown in Figure 7.13.When omparing the size distribution of quartz in lusions vs. their area% for all the studied samples, important di�eren es arise among them (Figure7.14). More in detail, samples 24, 36, 47 and 193 show a unimodal grain-sizedistribution, with an asymmetri tail to the largest size for sample 24, andthe presen e of a unique large rystal about 1100 µm in size in sample 47. Allthe other samples have a bimodal or polimodal grain-size distribution, and an be divided into two main groups, one omprising samples with an averagevalue of the oarser modes around 500-600 µm (samples 74, 75, 82 and 86) butrea hing maximum size around 1 mm, and the other one formed of sampleswith a general smaller grain-size distribution, with grains always smaller than600 µm (samples: 1, 49 and 50). Despite these di�eren es, all the samplesshow at least a mode for values less than 200-300 µm, representing the �nergrain-size fra tion of quartz, naturally present in the base lay.Di�eren es in the grain-size distribution are more di� ult to dete t in the umulative urves of reported in Figure 7.15, despite the fa t that this typeof representation largely used in sedimentology and in the grain-size analysisof loose materials.
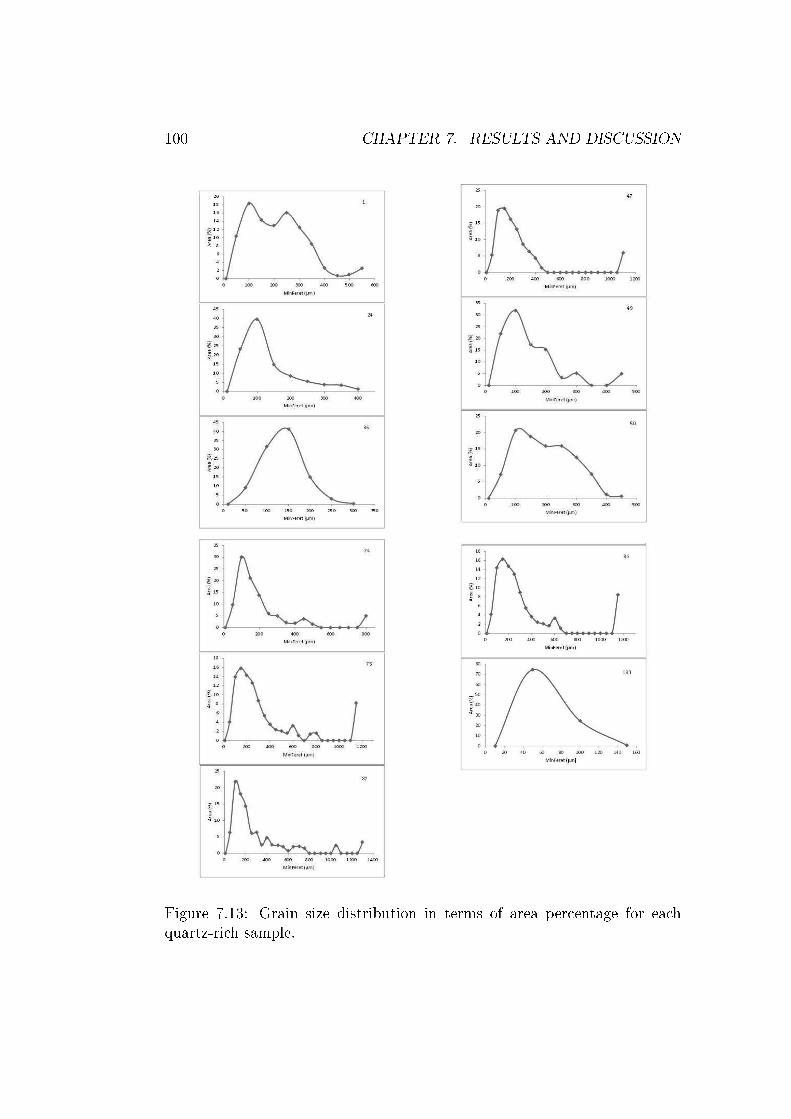
100 CHAPTER 7. RESULTS AND DISCUSSION
Figure 7.13: Grain size distribution in terms of area per entage for ea hquartz-ri h sample.
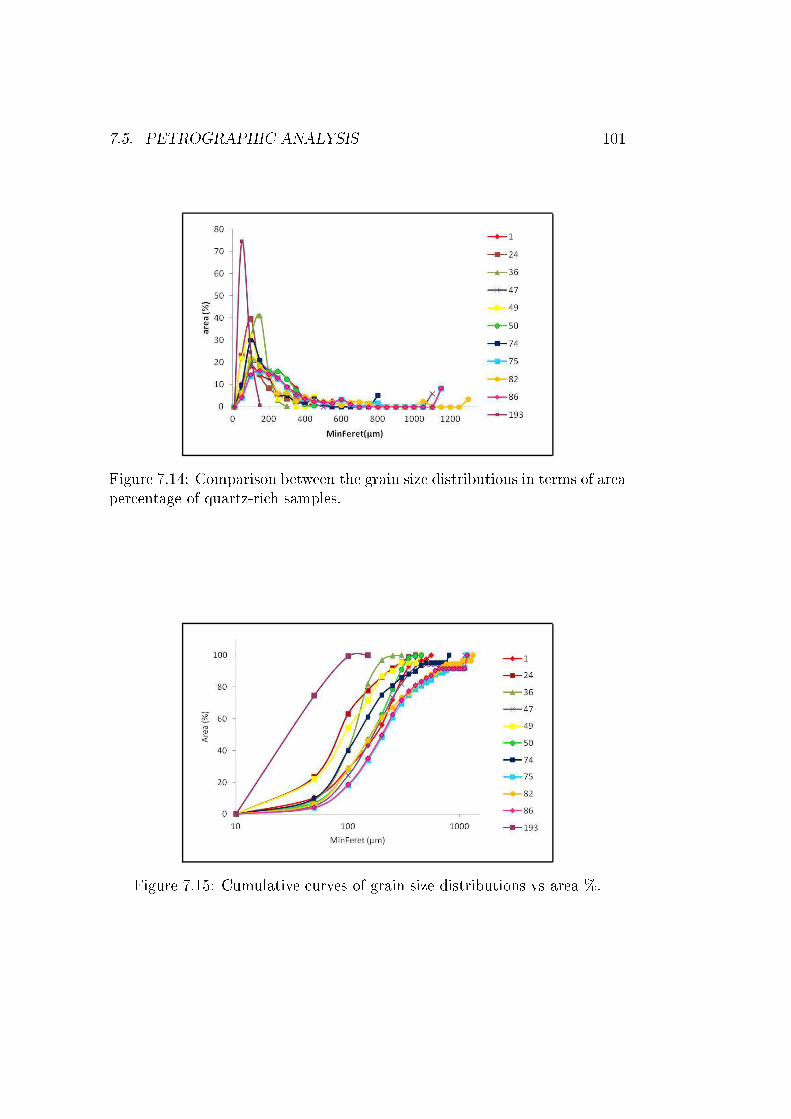
7.5. PETROGRAPHIC ANALYSIS 101
Figure 7.14: Comparison between the grain size distributions in terms of areaper entage of quartz-ri h samples.
Figure 7.15: Cumulative urves of grain size distributions vs area %.
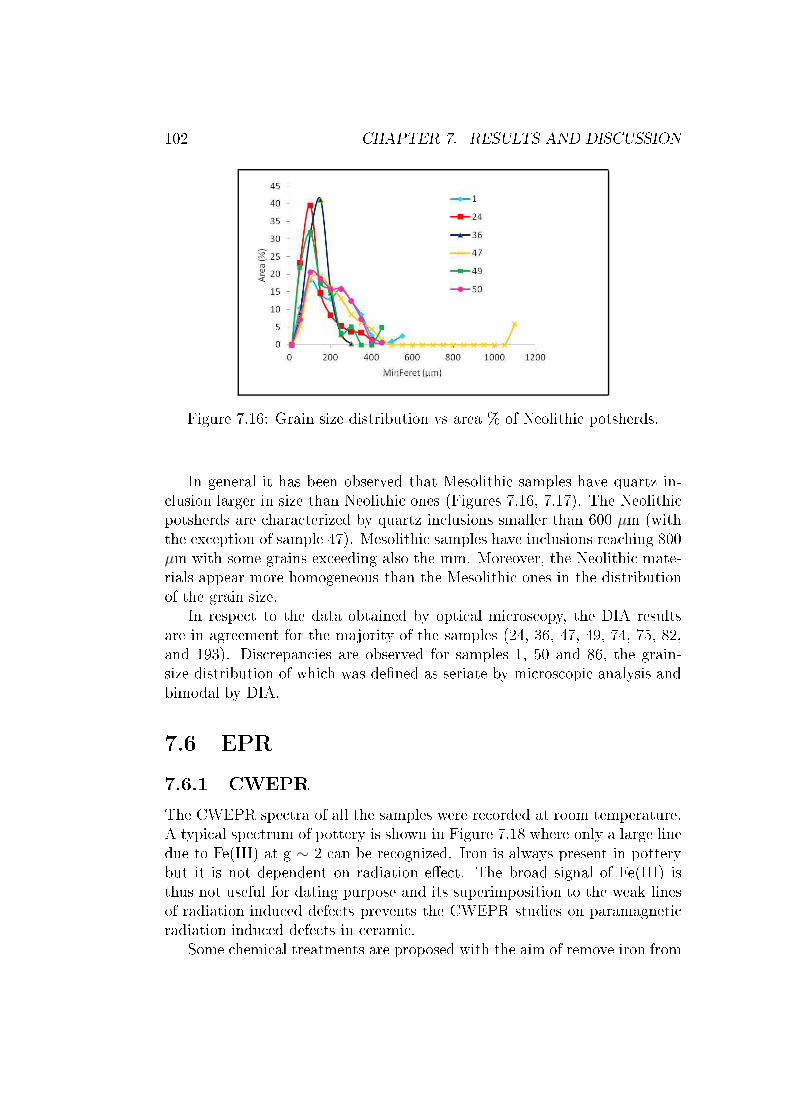
102 CHAPTER 7. RESULTS AND DISCUSSION
Figure 7.16: Grain size distribution vs area % of Neolithi potsherds.In general it has been observed that Mesolithi samples have quartz in- lusion larger in size than Neolithi ones (Figures 7.16, 7.17). The Neolithi potsherds are hara terized by quartz in lusions smaller than 600 µm (withthe ex eption of sample 47). Mesolithi samples have in lusions rea hing 800µm with some grains ex eeding also the mm. Moreover, the Neolithi mate-rials appear more homogeneous than the Mesolithi ones in the distributionof the grain size.In respe t to the data obtained by opti al mi ros opy, the DIA resultsare in agreement for the majority of the samples (24, 36, 47, 49, 74, 75, 82,and 193). Dis repan ies are observed for samples 1, 50 and 86, the grain-size distribution of whi h was de�ned as seriate by mi ros opi analysis andbimodal by DIA.7.6 EPR7.6.1 CWEPRThe CWEPR spe tra of all the samples were re orded at room temperature.A typi al spe trum of pottery is shown in Figure 7.18 where only a large linedue to Fe(III) at g ∼ 2 an be re ognized. Iron is always present in potterybut it is not dependent on radiation e�e t. The broad signal of Fe(III) isthus not useful for dating purpose and its superimposition to the weak linesof radiation indu ed defe ts prevents the CWEPR studies on paramagneti radiation indu ed defe ts in erami .Some hemi al treatments are proposed with the aim of remove iron from
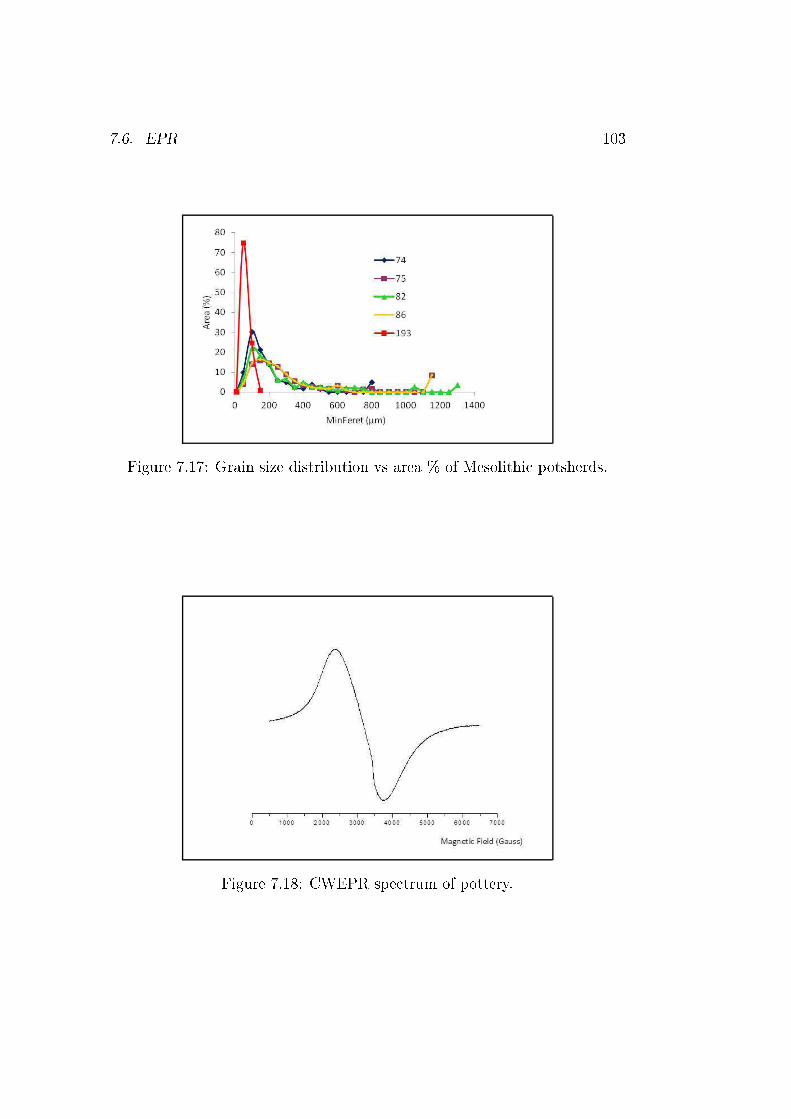
7.6. EPR 103
Figure 7.17: Grain size distribution vs area % of Mesolithi potsherds.
Figure 7.18: CWEPR spe trum of pottery.
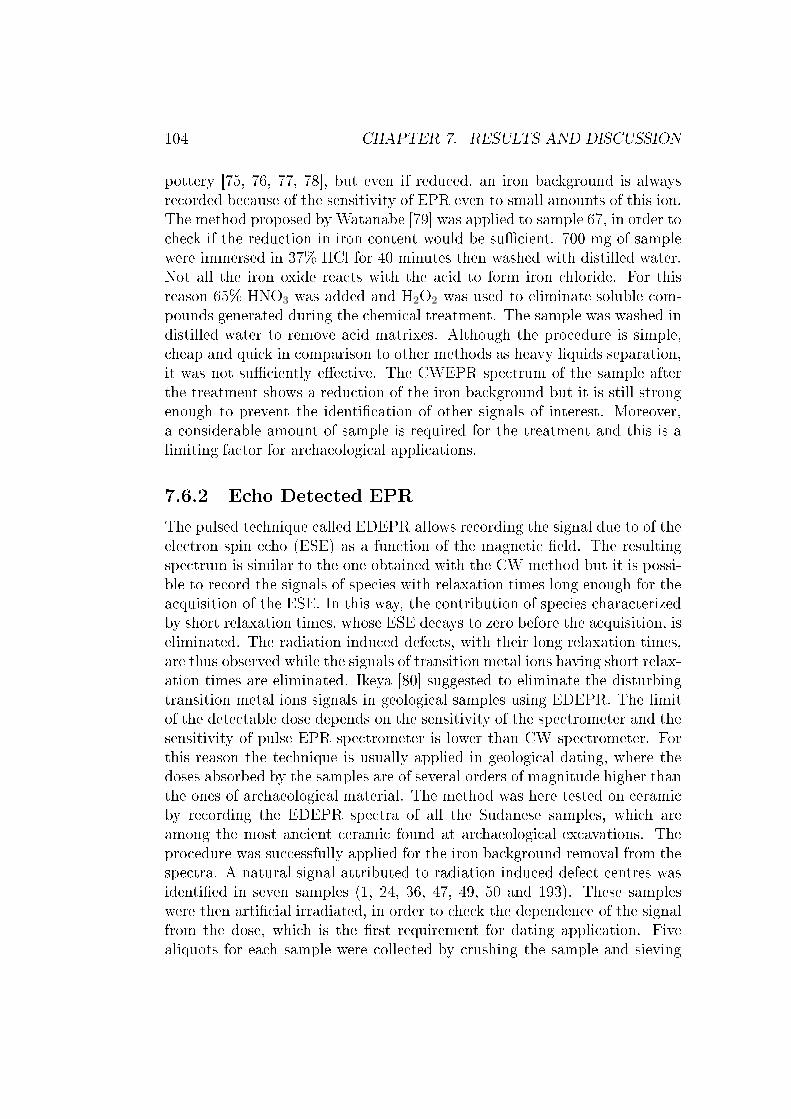
104 CHAPTER 7. RESULTS AND DISCUSSIONpottery [75, 76, 77, 78℄, but even if redu ed, an iron ba kground is alwaysre orded be ause of the sensitivity of EPR even to small amounts of this ion.The method proposed by Watanabe [79℄ was applied to sample 67, in order to he k if the redu tion in iron ontent would be su� ient. 700 mg of samplewere immersed in 37% HCl for 40 minutes then washed with distilled water.Not all the iron oxide rea ts with the a id to form iron hloride. For thisreason 65% HNO3 was added and H2O2 was used to eliminate soluble om-pounds generated during the hemi al treatment. The sample was washed indistilled water to remove a id matrixes. Although the pro edure is simple, heap and qui k in omparison to other methods as heavy liquids separation,it was not su� iently e�e tive. The CWEPR spe trum of the sample afterthe treatment shows a redu tion of the iron ba kground but it is still strongenough to prevent the identi� ation of other signals of interest. Moreover,a onsiderable amount of sample is required for the treatment and this is alimiting fa tor for ar haeologi al appli ations.7.6.2 E ho Dete ted EPRThe pulsed te hnique alled EDEPR allows re ording the signal due to of theele tron spin e ho (ESE) as a fun tion of the magneti �eld. The resultingspe trum is similar to the one obtained with the CW method but it is possi-ble to re ord the signals of spe ies with relaxation times long enough for thea quisition of the ESE. In this way, the ontribution of spe ies hara terizedby short relaxation times, whose ESE de ays to zero before the a quisition, iseliminated. The radiation indu ed defe ts, with their long relaxation times,are thus observed while the signals of transition metal ions having short relax-ation times are eliminated. Ikeya [80℄ suggested to eliminate the disturbingtransition metal ions signals in geologi al samples using EDEPR. The limitof the dete table dose depends on the sensitivity of the spe trometer and thesensitivity of pulse EPR spe trometer is lower than CW spe trometer. Forthis reason the te hnique is usually applied in geologi al dating, where thedoses absorbed by the samples are of several orders of magnitude higher thanthe ones of ar haeologi al material. The method was here tested on erami by re ording the EDEPR spe tra of all the Sudanese samples, whi h areamong the most an ient erami found at ar haeologi al ex avations. Thepro edure was su essfully applied for the iron ba kground removal from thespe tra. A natural signal attributed to radiation indu ed defe t entres wasidenti�ed in seven samples (1, 24, 36, 47, 49, 50 and 193). These sampleswere then arti� ial irradiated, in order to he k the dependen e of the signalfrom the dose, whi h is the �rst requirement for dating appli ation. Fivealiquots for ea h sample were olle ted by rushing the sample and sieving
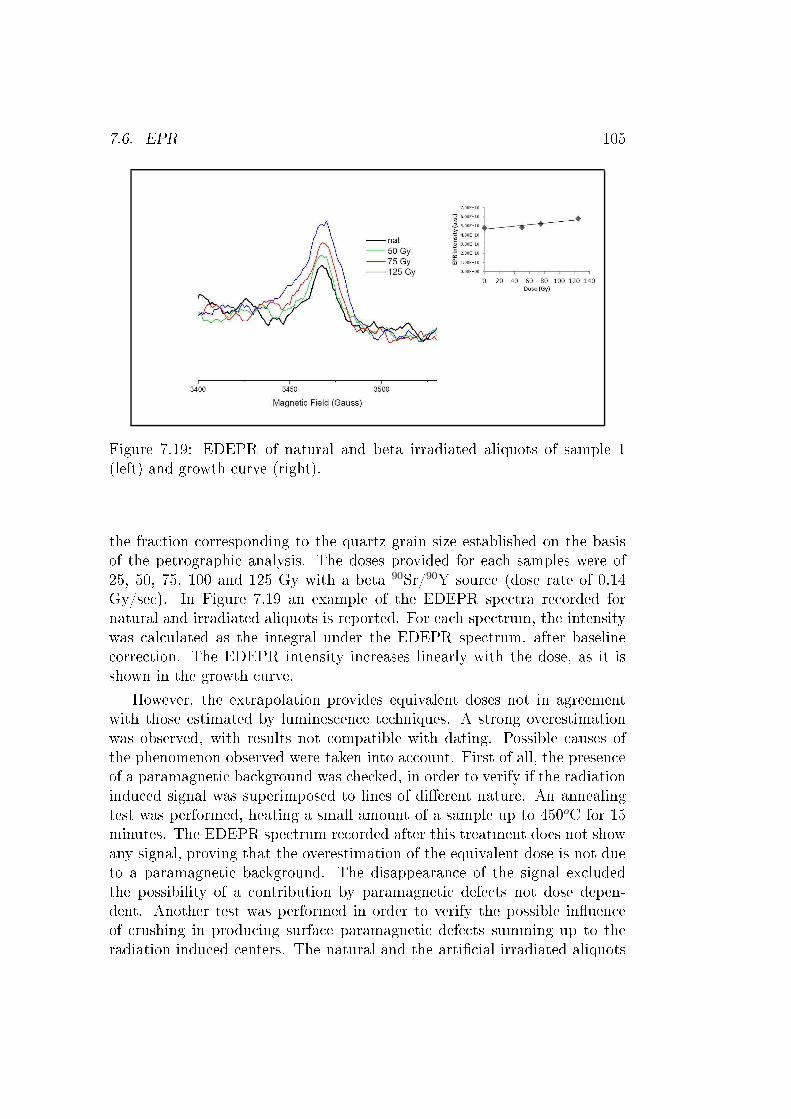
7.6. EPR 105
Figure 7.19: EDEPR of natural and beta irradiated aliquots of sample 1(left) and growth urve (right).the fra tion orresponding to the quartz grain size established on the basisof the petrographi analysis. The doses provided for ea h samples were of25, 50, 75, 100 and 125 Gy with a beta 90Sr/90Y sour e (dose rate of 0.14Gy/se ). In Figure 7.19 an example of the EDEPR spe tra re orded fornatural and irradiated aliquots is reported. For ea h spe trum, the intensitywas al ulated as the integral under the EDEPR spe trum, after baseline orre tion. The EDEPR intensity in reases linearly with the dose, as it isshown in the growth urve.However, the extrapolation provides equivalent doses not in agreementwith those estimated by lumines en e te hniques. A strong overestimationwas observed, with results not ompatible with dating. Possible auses ofthe phenomenon observed were taken into a ount. First of all, the presen eof a paramagneti ba kground was he ked, in order to verify if the radiationindu ed signal was superimposed to lines of di�erent nature. An annealingtest was performed, heating a small amount of a sample up to 450oC for 15minutes. The EDEPR spe trum re orded after this treatment does not showany signal, proving that the overestimation of the equivalent dose is not dueto a paramagneti ba kground. The disappearan e of the signal ex ludedthe possibility of a ontribution by paramagneti defe ts not dose depen-dent. Another test was performed in order to verify the possible in�uen eof rushing in produ ing surfa e paramagneti defe ts summing up to theradiation indu ed enters. The natural and the arti� ial irradiated aliquots
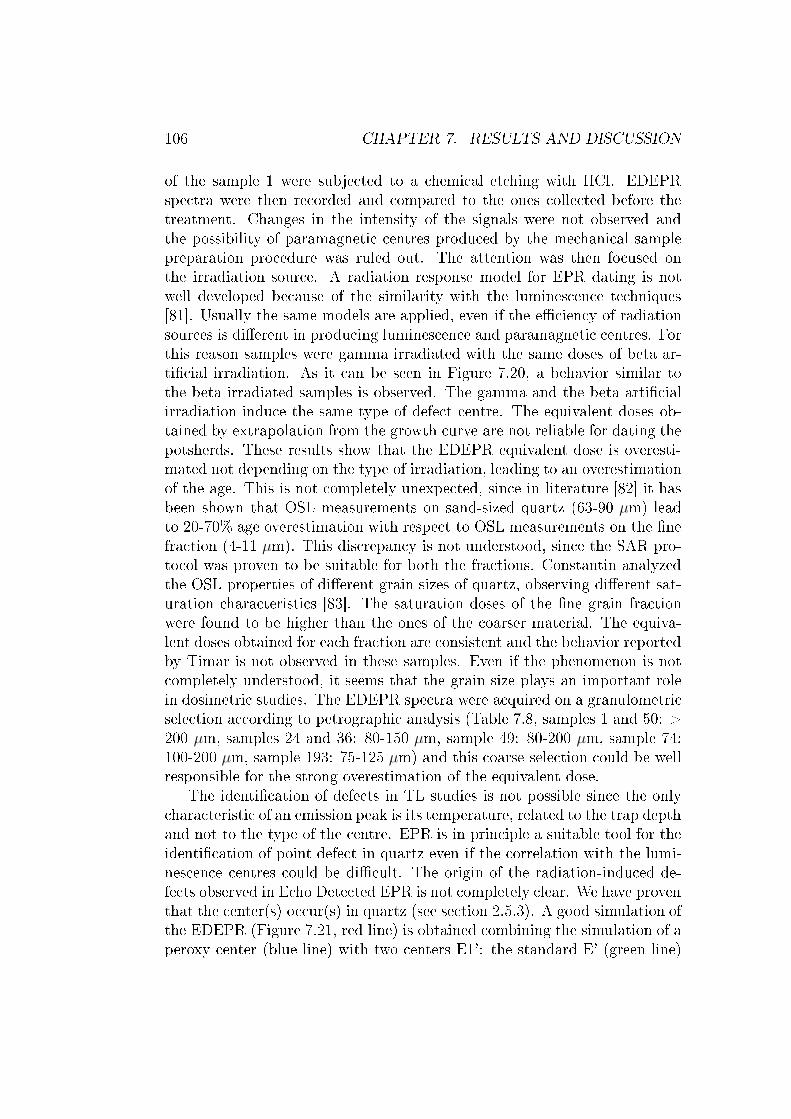
106 CHAPTER 7. RESULTS AND DISCUSSIONof the sample 1 were subje ted to a hemi al et hing with HCl. EDEPRspe tra were then re orded and ompared to the ones olle ted before thetreatment. Changes in the intensity of the signals were not observed andthe possibility of paramagneti entres produ ed by the me hani al samplepreparation pro edure was ruled out. The attention was then fo used onthe irradiation sour e. A radiation response model for EPR dating is notwell developed be ause of the similarity with the lumines en e te hniques[81℄. Usually the same models are applied, even if the e� ien y of radiationsour es is di�erent in produ ing lumines en e and paramagneti entres. Forthis reason samples were gamma irradiated with the same doses of beta ar-ti� ial irradiation. As it an be seen in Figure 7.20, a behavior similar tothe beta irradiated samples is observed. The gamma and the beta arti� ialirradiation indu e the same type of defe t entre. The equivalent doses ob-tained by extrapolation from the growth urve are not reliable for dating thepotsherds. These results show that the EDEPR equivalent dose is overesti-mated not depending on the type of irradiation, leading to an overestimationof the age. This is not ompletely unexpe ted, sin e in literature [82℄ it hasbeen shown that OSL measurements on sand-sized quartz (63-90 µm) leadto 20-70% age overestimation with respe t to OSL measurements on the �nefra tion (4-11 µm). This dis repan y is not understood, sin e the SAR pro-to ol was proven to be suitable for both the fra tions. Constantin analyzedthe OSL properties of di�erent grain sizes of quartz, observing di�erent sat-uration hara teristi s [83℄. The saturation doses of the �ne grain fra tionwere found to be higher than the ones of the oarser material. The equiva-lent doses obtained for ea h fra tion are onsistent and the behavior reportedby Timar is not observed in these samples. Even if the phenomenon is not ompletely understood, it seems that the grain size plays an important rolein dosimetri studies. The EDEPR spe tra were a quired on a granulometri sele tion a ording to petrographi analysis (Table 7.8, samples 1 and 50: >200 µm, samples 24 and 36: 80-150 µm, sample 49: 80-200 µm, sample 74:100-200 µm, sample 193: 75-125 µm) and this oarse sele tion ould be wellresponsible for the strong overestimation of the equivalent dose.The identi� ation of defe ts in TL studies is not possible sin e the only hara teristi of an emission peak is its temperature, related to the trap depthand not to the type of the entre. EPR is in prin iple a suitable tool for theidenti� ation of point defe t in quartz even if the orrelation with the lumi-nes en e entres ould be di� ult. The origin of the radiation-indu ed de-fe ts observed in E ho Dete ted EPR is not ompletely lear. We have proventhat the enter(s) o ur(s) in quartz (see se tion 2.5.3). A good simulation ofthe EDEPR (Figure 7.21, red line) is obtained ombining the simulation of aperoxy enter (blue line) with two enters E1': the standard E' (green line)
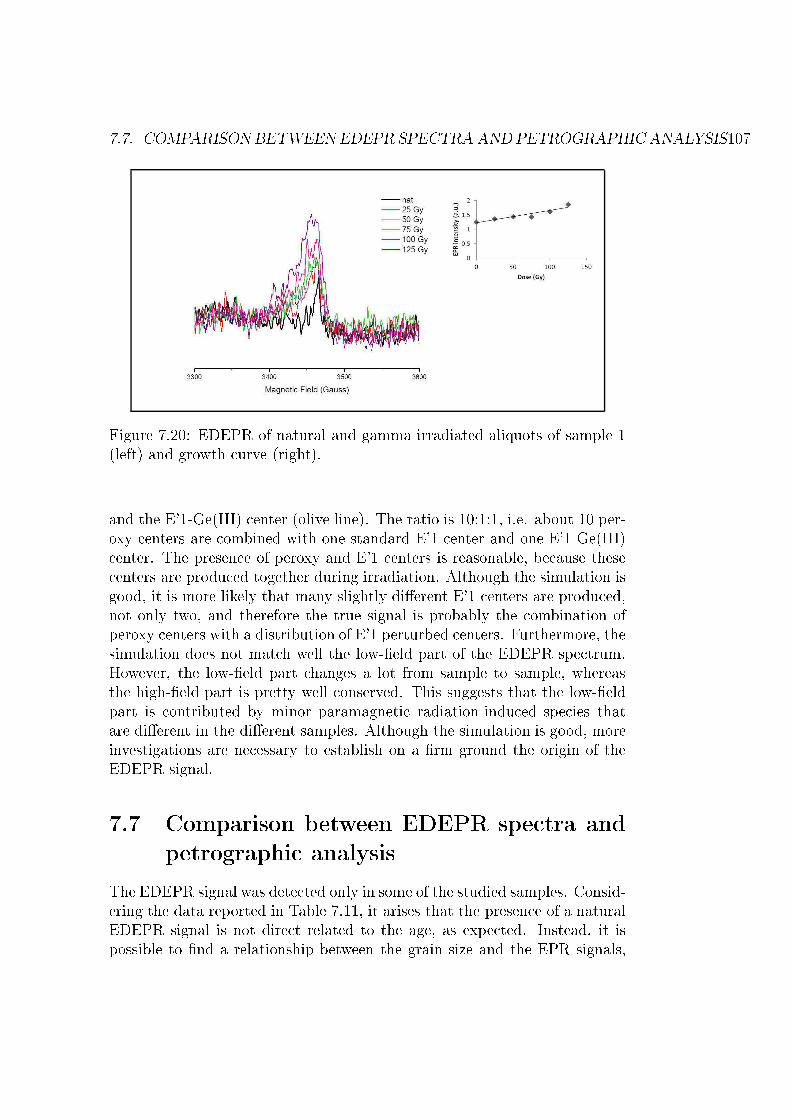
7.7. COMPARISON BETWEEN EDEPR SPECTRA AND PETROGRAPHIC ANALYSIS107
Figure 7.20: EDEPR of natural and gamma irradiated aliquots of sample 1(left) and growth urve (right).and the E'1-Ge(III) enter (olive line). The ratio is 10:1:1, i.e. about 10 per-oxy enters are ombined with one standard E'1 enter and one E'1-Ge(III) enter. The presen e of peroxy and E'1 enters is reasonable, be ause these enters are produ ed together during irradiation. Although the simulation isgood, it is more likely that many slightly di�erent E'1 enters are produ ed,not only two, and therefore the true signal is probably the ombination ofperoxy enters with a distribution of E'1 perturbed enters. Furthermore, thesimulation does not mat h well the low-�eld part of the EDEPR spe trum.However, the low-�eld part hanges a lot from sample to sample, whereasthe high-�eld part is pretty well onserved. This suggests that the low-�eldpart is ontributed by minor paramagneti radiation-indu ed spe ies thatare di�erent in the di�erent samples. Although the simulation is good, moreinvestigations are ne essary to establish on a �rm ground the origin of theEDEPR signal.7.7 Comparison between EDEPR spe tra andpetrographi analysisThe EDEPR signal was dete ted only in some of the studied samples. Consid-ering the data reported in Table 7.11, it arises that the presen e of a naturalEDEPR signal is not dire t related to the age, as expe ted. Instead, it ispossible to �nd a relationship between the grain size and the EPR signals,

108 CHAPTER 7. RESULTS AND DISCUSSION
Figure 7.21: Simulation of EDEPR spe trum of sample 1, irradiated beta125 Gy.whi h were re orded just for potteries with a small size of quartz in lusions.The orrelation between natural EDEPR signal and quartz grain size wasproven also by sieving two samples without natural signal (82 and 86) andsele ting the �ne fra tion. In Figure 7.22 the spe tra obtained measuring thewhole samples in the magneti �eld region in whi h the signal is expe teddo not show any line. In the spe tra olle ted only on the �ne grain sizefra tion (lower than 300 µm) of the same samples, it is possible to re ordnatural EDEPR signal, as in the ase of the other potsherds hara terizedby �ne-grained quartz in lusions.This di�eren e in the palaeodose between �ne and oarse fra tion is knownin literature and a theory was proposed to explain the di�eren e [84℄.The the-ory has been revised for adapting it to Monte-Carlo simulations on in lusions[85℄. A ording to the theory, assuming that the quartz grain does not on-tain radionu lides, the palaeodose is related to the grain size by the relation:D = (1− φ) ·Dm (7.1)where Dm is the in�nite-medium dose of the matrix, D is the dose re eivedby the quartz grain (the in lusion), and φ is the ratio between the averagebeta-dose in the in lusion Di and the beta-dose whi h the grain would re eiveif it were in�nite-size (Dinf). This ratio φ depends on the grain size, rang-
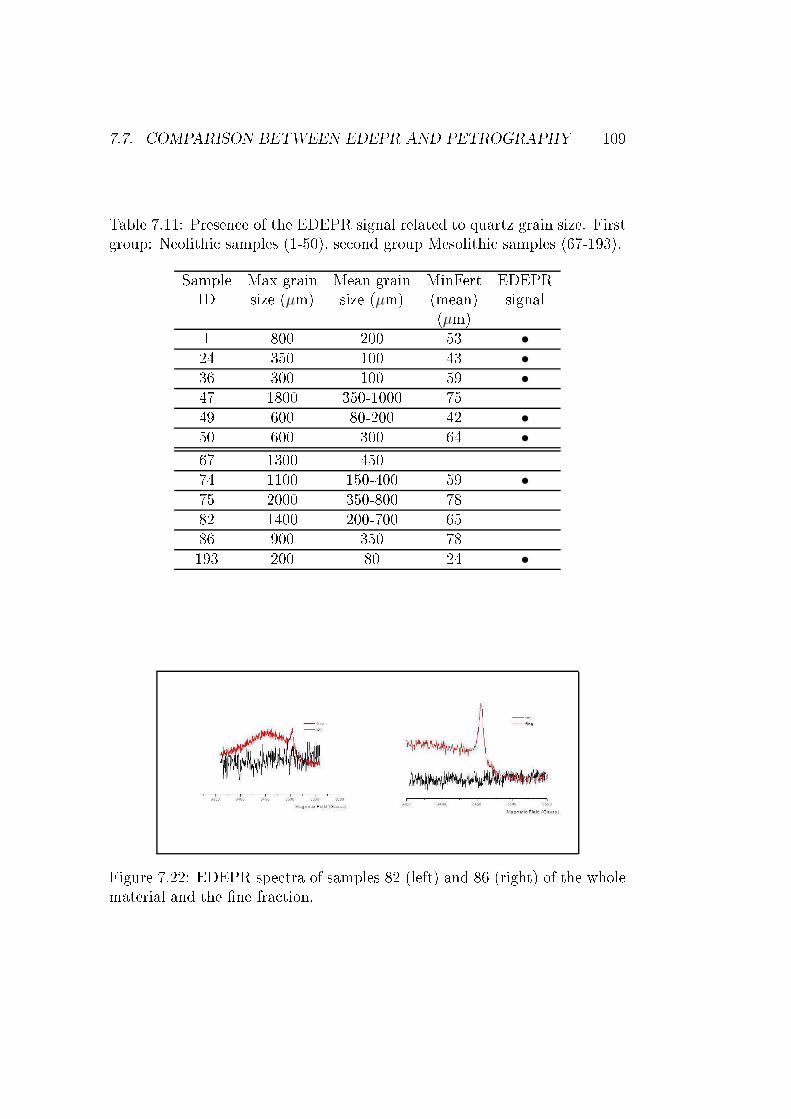
7.7. COMPARISON BETWEEN EDEPR AND PETROGRAPHY 109Table 7.11: Presen e of the EDEPR signal related to quartz grain size. Firstgroup: Neolithi samples (1-50), se ond group Mesolithi samples (67-193).Sample Max grain Mean grain MinFert EDEPRID size (µm) size (µm) (mean) signal(µm)1 800 200 53 •24 350 100 43 •36 300 100 59 •47 1800 350-1000 7549 600 80-200 42 •50 600 300 64 •67 1300 45074 1100 150-400 59 •75 2000 350-800 7882 1400 200-700 6586 900 350 78193 200 80 24 •
Figure 7.22: EDEPR spe tra of samples 82 (left) and 86 (right) of the wholematerial and the �ne fra tion.
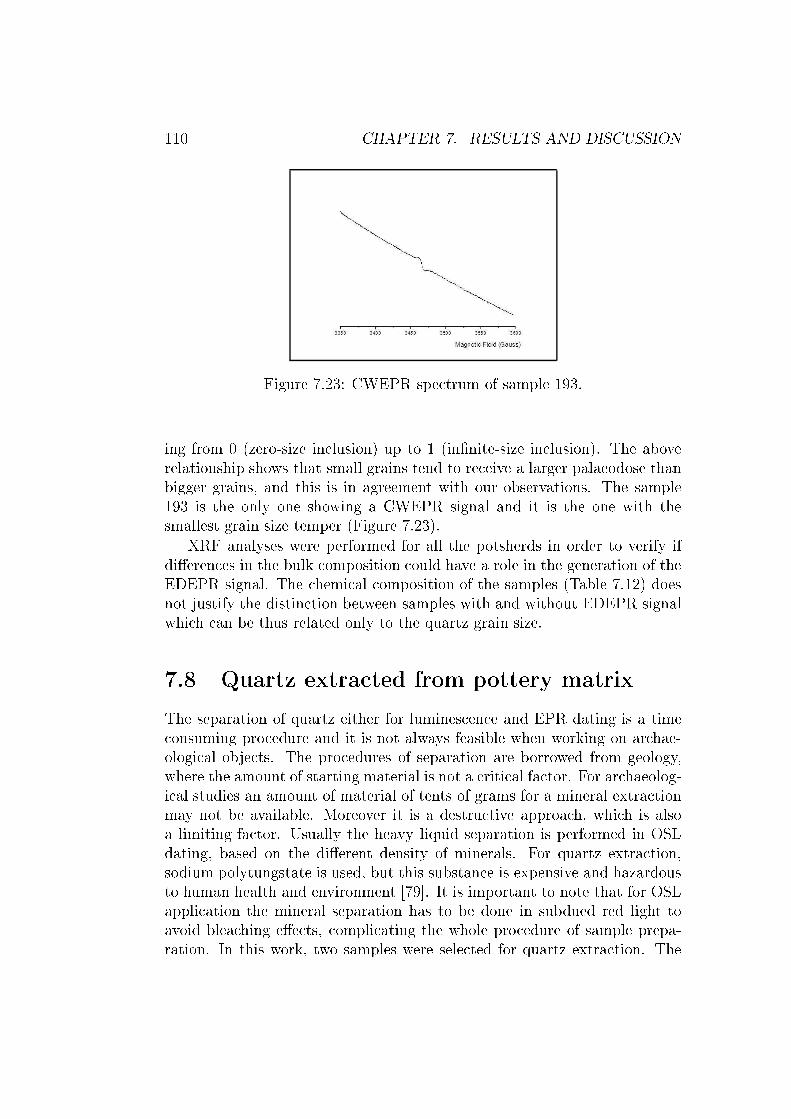
110 CHAPTER 7. RESULTS AND DISCUSSION
Figure 7.23: CWEPR spe trum of sample 193.ing from 0 (zero-size in lusion) up to 1 (in�nite-size in lusion). The aboverelationship shows that small grains tend to re eive a larger palaeodose thanbigger grains, and this is in agreement with our observations. The sample193 is the only one showing a CWEPR signal and it is the one with thesmallest grain size temper (Figure 7.23).XRF analyses were performed for all the potsherds in order to verify ifdi�eren es in the bulk omposition ould have a role in the generation of theEDEPR signal. The hemi al omposition of the samples (Table 7.12) doesnot justify the distin tion between samples with and without EDEPR signalwhi h an be thus related only to the quartz grain size.7.8 Quartz extra ted from pottery matrixThe separation of quartz either for lumines en e and EPR dating is a time onsuming pro edure and it is not always feasible when working on ar hae-ologi al obje ts. The pro edures of separation are borrowed from geology,where the amount of starting material is not a riti al fa tor. For ar haeolog-i al studies an amount of material of tents of grams for a mineral extra tionmay not be available. Moreover it is a destru tive approa h, whi h is alsoa limiting fa tor. Usually the heavy liquid separation is performed in OSLdating, based on the di�erent density of minerals. For quartz extra tion,sodium polytungstate is used, but this substan e is expensive and hazardousto human health and environment [79℄. It is important to note that for OSLappli ation the mineral separation has to be done in subdued red light toavoid blea hing e�e ts, ompli ating the whole pro edure of sample prepa-ration. In this work, two samples were sele ted for quartz extra tion. The
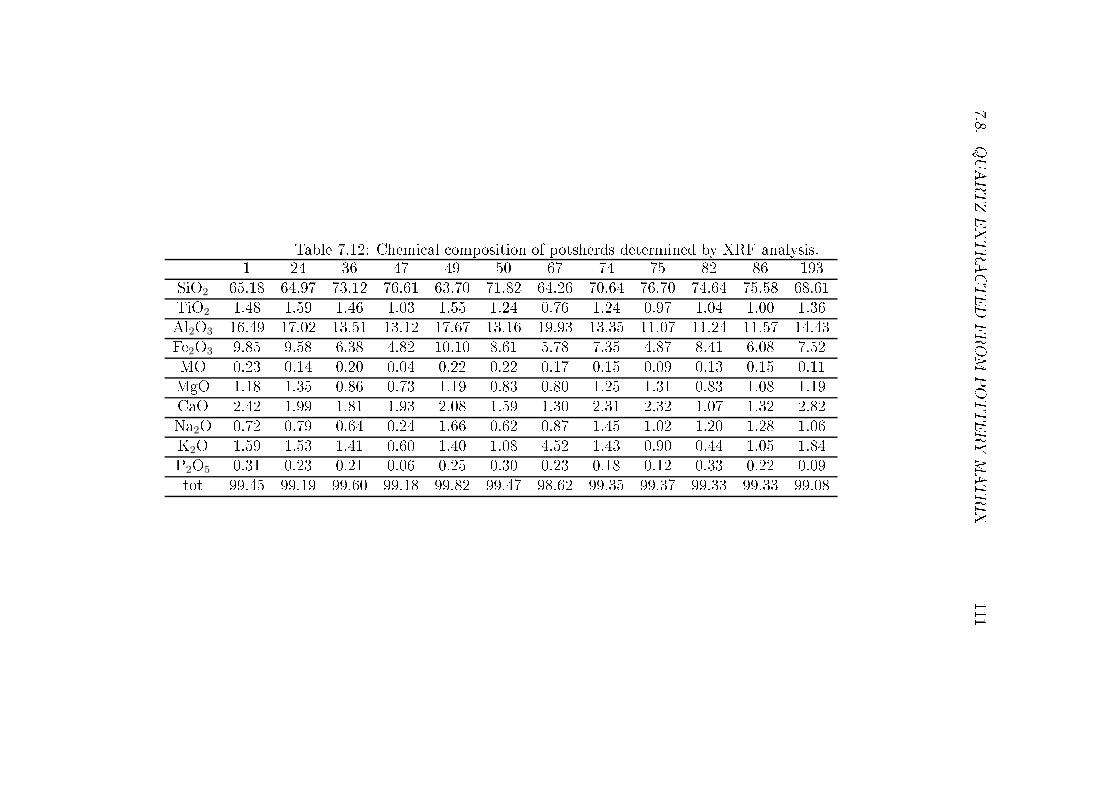
7.8.QUARTZEXTRACTEDFROMPOTTERYMATRIX111
Table 7.12: Chemi al omposition of potsherds determined by XRF analysis.1 24 36 47 49 50 67 74 75 82 86 193SiO2 65.18 64.97 73.12 76.61 63.70 71.82 64.26 70.64 76.70 74.64 75.58 68.61TiO2 1.48 1.59 1.46 1.03 1.55 1.24 0.76 1.24 0.97 1.04 1.00 1.36Al2O3 16.49 17.02 13.51 13.12 17.67 13.16 19.93 13.35 11.07 11.24 11.57 14.43Fe2O3 9.85 9.58 6.38 4.82 10.10 8.61 5.78 7.35 4.87 8.41 6.08 7.52MO 0.23 0.14 0.20 0.04 0.22 0.22 0.17 0.15 0.09 0.13 0.15 0.11MgO 1.18 1.35 0.86 0.73 1.19 0.83 0.80 1.25 1.31 0.83 1.08 1.19CaO 2.42 1.99 1.81 1.93 2.08 1.59 1.30 2.31 2.32 1.07 1.32 2.82Na2O 0.72 0.79 0.64 0.24 1.66 0.62 0.87 1.45 1.02 1.20 1.28 1.06K2O 1.59 1.53 1.41 0.60 1.40 1.08 4.52 1.43 0.90 0.44 1.05 1.84P2O5 0.31 0.23 0.21 0.06 0.25 0.30 0.23 0.18 0.12 0.33 0.22 0.09tot 99.45 99.19 99.60 99.18 99.82 99.47 98.62 99.35 99.37 99.33 99.33 99.08
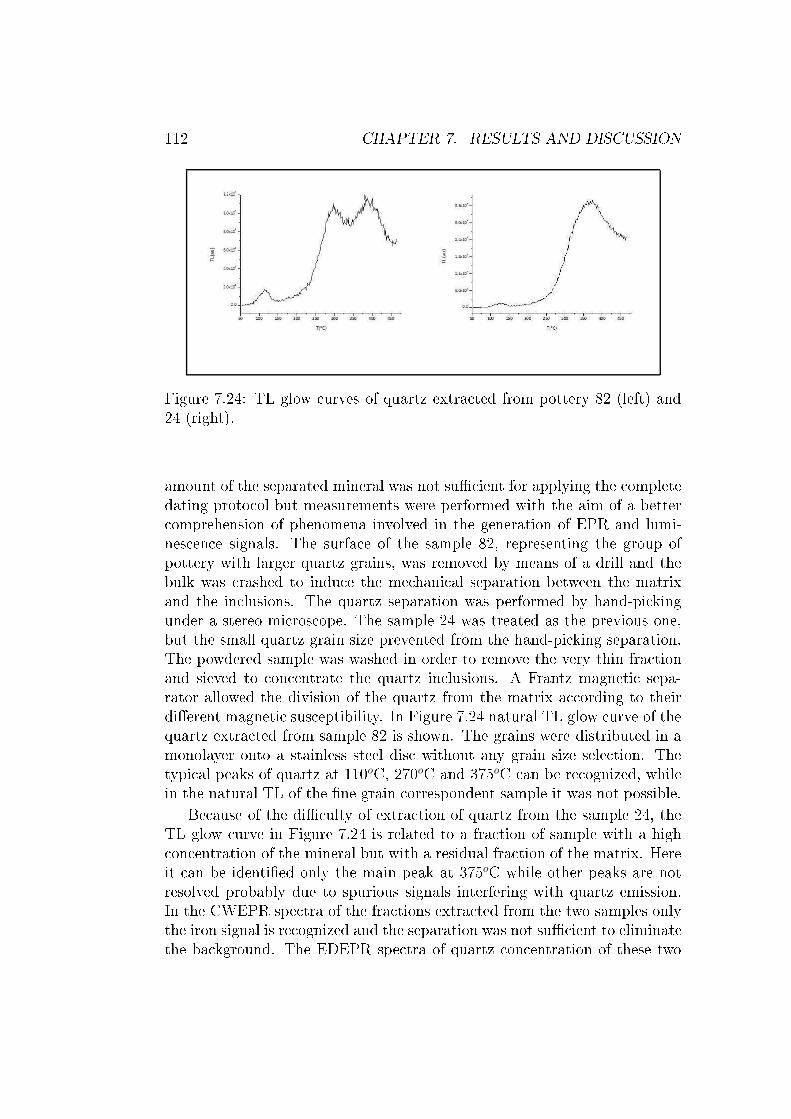
112 CHAPTER 7. RESULTS AND DISCUSSION
Figure 7.24: TL glow urves of quartz extra ted from pottery 82 (left) and24 (right).amount of the separated mineral was not su� ient for applying the ompletedating proto ol but measurements were performed with the aim of a better omprehension of phenomena involved in the generation of EPR and lumi-nes en e signals. The surfa e of the sample 82, representing the group ofpottery with larger quartz grains, was removed by means of a drill and thebulk was rashed to indu e the me hani al separation between the matrixand the in lusions. The quartz separation was performed by hand-pi kingunder a stereo mi ros ope. The sample 24 was treated as the previous one,but the small quartz grain size prevented from the hand-pi king separation.The powdered sample was washed in order to remove the very thin fra tionand sieved to on entrate the quartz in lusions. A Frantz magneti sepa-rator allowed the division of the quartz from the matrix a ording to theirdi�erent magneti sus eptibility. In Figure 7.24 natural TL glow urve of thequartz extra ted from sample 82 is shown. The grains were distributed in amonolayer onto a stainless steel dis without any grain size sele tion. Thetypi al peaks of quartz at 110oC, 270oC and 375oC an be re ognized, whilein the natural TL of the �ne grain orrespondent sample it was not possible.Be ause of the di� ulty of extra tion of quartz from the sample 24, theTL glow urve in Figure 7.24 is related to a fra tion of sample with a high on entration of the mineral but with a residual fra tion of the matrix. Hereit an be identi�ed only the main peak at 375oC while other peaks are notresolved probably due to spurious signals interfering with quartz emission.In the CWEPR spe tra of the fra tions extra ted from the two samples onlythe iron signal is re ognized and the separation was not su� ient to eliminatethe ba kground. The EDEPR spe tra of quartz on entration of these two

7.8. QUARTZ EXTRACTED FROM POTTERY MATRIX 113samples do not show signi� ant di�eren e from the one of the whole pottery,proving that the lay matrix and the minerals of the temper do not in�uen ethe EPR signal of radiation indu ed defe t in quartz. This is important sin ethe quartz separation is thus not ne essary, redu ing the amount of materialrequired for measurements and the time of sample preparation.

114 CHAPTER 7. RESULTS AND DISCUSSION

Chapter 8Con lusionsA omparative study of dosimetri dating te hniques applied to ar haeolog-i al pottery has been arried out. The sele tion of samples of known age hara terized by quartz temper was a ne essary premise for the dating ap-proa h. Three te hniques (TL, OSL and EPR) were tested by applying twoproto ols (MAAD and SAR). Lumines en e te hniques allowed obtainingages of the two groups of potsherds from Mesolithi and Neolithi periods ina ordan e with the radio arbon dating of the layer of provenan e. The ad-ditive pro edure was the less satisfying and it is not re ommended for datingprehistori materials. The potential of the SAR proto ol over the onven-tional MAAD was proven. Although the a hievable a ura y needs moreexperimental testing, the SAR proto ol is promising for those ases wherethe amount of sample is restri ted. In parti ular, OSL an be used for datingheated materials as potteries, when they are hara terized by a quartz-ri htemper, without needing any mineral separation. This is an important resultsin e, di�erently from geology, the availability of dating material in ar haeol-ogy is very limited. EDEPR appeared to be a valid tool in spotting radiationindu ed defe ts in erami without any hemi al treatment of the sample andwith the possibility of performing several measurements on the same aliquotof material. A natural signal was isolated from potsherds hara terized byquartz temper with a �ne grain size and not, as expe ted, from the Mesolithi ones. The dose dependen e of the signal was proven by beta and gamma ir-radiation but it was not possible to obtain meaningful equivalent doses fordating purposes. However, this was the �rst attempt to date ar haeologi alpottery by means of EDEPR and even if further investigations are needed,these results are en ouraging, also be ause the extra tion of quartz from thematrix is not ne essary. The dosimetri dating methods are a powerful tooldespite the low pre ision in all the ases of absen e of suitable materials forradio arbon dating whi h is the most widely used te hnique. They are able115
116 CHAPTER 8. CONCLUSIONSto give information about the erami itself and not about the related mate-rials, improving the hronologi al framework of the samples. The approa hadopted in this work ould be a �rst step of a resear h proje t on erningthe hronologi al studies of prehistori pottery.
Bibliography[1℄ Wagner, G.A. 1998, Age determination of young ro ks and artifa ts �Physi al and hemi al lo ks in Quaternary Geology and Ar haeology,Springer, Berlin[2℄ Ikeya, M. 1993, New Appli ations of Ele tron Spin Resonan e - Dating,Dosimetry and Mi ros opy, World S ienti� , Singapore[3℄ Aitken, M. J. 1985, Thermolumines en e Dating, London: A ademi [4℄ Galloway, R.B., 2001. Lumines en e dating: Limitation to a ura y at-tainable, Journal of Radioanalyti al and Nu lear Chemistry ( 247-3)679-683[5℄ Zink, A.J.C. et al., 2011. Dire t OSL dating of Iron Age pottery fromSouth Afri a � Preliminary dosimetry investigations, Quaternary Geo- hronology (8) 1-9.[6℄ Rudra, J.K. Beall Fowler, W., 1986. Oxygen va an y and the E'1 enterin rystalline SiO2, Physi al Review B (35-15) 8223-8230[7℄ Preusser, F. et al., 2009. Quartz as a natural lumines en e dosimeter,Earth-S ien e Reviews (97) 184�214[8℄ Wintle, A.G. 1997. Lumines en e dating: laboratory pro edures andproto ols , Radiation Measurements (27) 769-817[9℄ Bailey, R.M. et al., 1997. Partial blea hing and the de ay form hara -teristi s of quartz osl, Radiation Measurements (27- 2) 123-136[10℄ Rink, W.J., 1997. Ele tron Spin Resonan e (ESR) dating and ESR ap-pli ations in Quaternary s ien e and ar haeometry, Radiation Measure-ments (27- 5) 975-1025 117
118 BIBLIOGRAPHY[11℄ Jani, M.G. et al., 1982. Further hara terization of the E'1 enter in rystalline SiO2, Physi al Review B (27-4) 2285-2293[12℄ Toyoda, S., S hwarz, H.P., 1997. Counterfeit E'1 signal in quartz. Radi-ation Measurements (27) 59-66[13℄ Feathers J. K., 2003, Use of lumines en e dating in ar haeology Meas.S i. Te hnol. (14) 1493�1509[14℄ Huntley, D.J., et al.,1985 . Opti al dating of sediments. Nature (313)105-7[15℄ Murray, A.S., Wintle, A.G., 1998. Fa tors ontrolling the shape of theOSL de ay urve in quartz. Radiat. Meas. (29) 65-79[16℄ Wintle, A.G., Murray, A.S., 2006. A review of quartz opti ally stimu-lated lumines en e hara teristi s and their relevan e in single-aliquotregeneration dating proto ols, Radiation Measurements (41) 369-391[17℄ Baili�, I.K., Holland, N., 2000. Dating bri ks of the last two millenniafrom New astle upon Tyne: a preliminary study, Radiation Measure-ments (32) 615-619[18℄ Mi hael, C.T., Za harias, N., 2006. Equivalent dose (palaeodose) estima-tion in thermolumines en e dating using a single aliquot of polymineral�ne grains. Radiation Prote tion Dosimetry (119) 458-461[19℄ Hong , D.G. et al., 2006. Equivalent dose determination of single aliquotregenerative-dose (SAR) proto ol using thermolumines en e on heatedquartz, Nu lear Instruments and Methods in Physi s Resear h B (243)174-178[20℄ Shelmann G. et al. 2008. Ele tron spin resonan e (ESR) dating of Qua-ternary materials, Eiszeitalter und Gegenwart Quaternary S ien e Jour-nal (57/1-2) 150-178[21℄ Huntley, D.J., Lamothe, M., 2001. Ubiquity of anomalous fading in K-feldspar and the measurements and orre tions for it in opti al dating.Can.J.Earth S i. (38) 1093-1106[22℄ Baili�, I.K., 2007. Methodologi al developments in the lumines en edating of bri k from English late-medieval and post-medieval buildings,Ar haeometry (49) 827-851
BIBLIOGRAPHY 119[23℄ Barnett, S.M., 2000. Lumines en e dating of pottery from later prehis-tori Britain, Ar haeomerry (42-2) 431-457[24℄ Leung, P.L. et al., 2005. The preliminary appli ation ofOSL in om-parison withTL for authenti ation ofan ient Chinese bri ks, RadiationMeasurements (40) 1- 4[25℄ Oke, G., Yurdatapan E., 2000. Opti ally stimulated lumines en e datingof pottery from Turkey, Talanta (53) 115-119[26℄ Thomas, P.J. et al., 2008. Opti ally stimulated lumines en e dating ofheated materials using single-aliquot regenerative-dose pro edure: a fea-sibility study using ar haeologi al artefa ts from India, Journal of Ar- haeologi al S ien e (35) 781-790[27℄ Tite, M.S., 2008. Cerami produ tion, provenan e and use - a review,Ar haeometry (50) 216-231[28℄ Ri e, P.M., 1999. On the Origins of Pottery, Journal of Ar haeologi alMethod and Theory (6-1) 1-54[29℄ Budja, M. 2006. The transition to farming and the erami traje to-ries in Western Eurasia: from erami �gurines to vessels. Do umentaPraehistori a (XXXIII) 183-201[30℄ Verpoorte, 2001. Pla es of Art, tra es of Fire. Ar haeologi al StudiesLeiden University 8 (Dolnì Vestoni e Studies 6).[31℄ Wu, X. et al., 2012. Early Pottery at 20,000 years ago in XianrendongCave, China, S ien e (336) 1696-1700[32℄ Shela h, G., 2012. On the invention of Pottery, S ien e (336) 1644-1655[33℄ Stott, A.W., et al., 2003. Dire t dating of ar haeologi al pottery by ompound- spe i� 14C analysis of preserved lipids. Anal.Chem. (75)5037-5045[34℄ Wilson, M.A. et al., 2009. Dating �red- lay erami s using long-termpower law rehydroxylation kineti s, Pro . R. So . (465) 2407-2415[35℄ Bonsall, C. et al., 2002. Dire t dating of Neolithi pottery: progress andprospe ts. Do umenta Praehistori a (XXIX,Issue: Neolithi Studies 9)47-59
120 BIBLIOGRAPHY[36℄ Salvatori, S., 2012. Dis losing Ar haeologi al Complexity of the Khar-toum Mesolithi : New Data at the Site and Regional Level, Afri anAr haeologi al Review (29-4) 399-472[37℄ Salvatori, S., Usai, D. 2008. R12 and the Neolithi of Sudan. New per-spe tives in S. Salvatori and D. Usai (Eds.), A Neolithi emetery inthe northern Dongola Rea h (Sudan): Ex avation at Site R12 (9-18).London: The Sudan Ar haeologi al Resear h So iety Publi ations.[38℄ Usai, D., 2005. The Mesolithi and Neolithi periods in the SudaneseNile valley: problems and perspe tives, Afri a (LX,3-4) 544-554[39℄ Kuzmin, Y.V., 2006. Chronology of the earliest pottery in East Asia:progress and pitfalls, Antiquity (80) 362-371[40℄ Aikens, C. M. (1995). First in the world: The Jomon pottery of earlyJapan In W. Barnett and J. Hopes (Eds.), The emergen e of pottery.Te hnology and innovations in an ient so ieties (11-22). Washington:Smithsonian Institution Press.[41℄ Harris, V. (1997). Jomon pottery in an ient Japan in I. Freestone andD. Gaimster (Eds.), Pottery in the making (world erami traditions)(20-25). London: British Museum.[42℄ Jesse, F., 2010. Early pottery in Northern Afri a, Journal of Afri anAr haeology (8) 219-238[43℄ Usai, D., 2004. Early Khartoum and related groups. In T. Kendall (Ed)Pro eedings of the Ninth International Conferen e of Nubian Studies,Museum of Fine Arts and Northeastern University, Boston, August 20-26, 1998 (419-435). Department of Afri an-Ameri an Studies Northeast-ern University Boston.[44℄ Salvatori, S. et al., 2011. Mesolithi site formation and palaeoenviron-ment along the White Nile (Central Sudan), Afri an Ar haeologi al Re-view (28-3) 177-211[45℄ Salvatori, S. and Usai, D., 2008. El Salha Proje t 2005: New KhartoumMesolithi sites from Central Sudan, Kush (19) 87-96[46℄ Usai, D. (2003). The Is.I.A.O. El Salha Proje t. Kush, 18, 173-182[47℄ Usai, D., 2006. The El Salha proje t, Sudan in A tes of the XIVthCongress of the U.I.S.P.P., Liege, Belgium, 28 September 2001, generalSessions and Posters (207-212). Oxford: BAR International Series 1522
BIBLIOGRAPHY 121[48℄ Usai, D., in press. Re ent advan es in understanding the Prehistory ofCentral Sudan in J. R. Anderson and D. A. Welsby (Eds.), Pro eedingsof the 12th International Conferen e of Nubian Studies. Leuven: Peeter[49℄ Usai, D., Salvatori, S., 2002. The IsIAO El-Salha ar haeologi al proje t,Sudan and Nubia (6) 67-72[50℄ Usai, D. Salvatori, S., 2005. The IsIAO Ar haeologi al Proje t in the ElSalha area (Omdurman South, Sudan): results and perspe tives, Afri a(LX,3-4) 474-493[51℄ Zerboni, A. 2011. Mi romorphology reveals in situ Mesolithi living�oors and ar haeologi al features in multiphase sites in Central Sudan,Geoar haeology: an international journal (26-3) 365-391[52℄ Lario, J. et al., 1997. Palaeoenvironmental evolution of the BlueNile (Central Sudan) during the early and mid-Holo ene (Mesolithi -Neolithi transition), Quat. S i. Rev. (16) 583-588[53℄ Cohen, M.N., 1977. The Food Crisis in Prehistory. Overpopulation andthe Origins of Agri ulture. Yale University Press, New Haven[54℄ Usai, D., 2006b. Early and Middle Holo ene ultural hange in theNile Valley (Egypt and Sudan) in A tes of the XIVth Congress of theU.I.S.P.P., Liege, Belgium, 2-8 September 2001, general Sessions andPosters (93-99). Oxford: BAR International Series 1522[55℄ Usai, D., 2007. Geographi Overviews, Afri a (North): Nubia (49-56) inD.M. Pearsall (Ed.) En y lopedia of Ar haeology. New York: A ademi Press[56℄ Gautier, A., 1983. Animal life along the prehistori Nile: the eviden efrom Saggai 1 and Geili (Sudan), Origini (12) 50-115[57℄ Gautier, A., 2007. Animal domesti ation in North Afri a in M. Bollig,O. Bubenzer, R. Voelsang and H. P. Wotzka, (Eds.), Aridity, hangeand on�i t in Afri a (75-89). Koln: Heinri h-Barth-Institute[58℄ Gautier, A., 2007. Animal domesti ation in North Afri a in M. Bollig,O. Bubenzer, R. Vogelsang and H. P. Wotzka, (Eds.), Aridity, hangeand on�i t in Afri a (75-89). Koln: Heinri h-Barth-Institute[59℄ Williams, M., 2009. Late Pleisto ene and Holo ene environments in theNile basin, Global and Planetary Change (69) 115
122 BIBLIOGRAPHY[60℄ Williams, M. A. J., 2012. River sediments, Phil. Trans. R. So . A (370)2093-2122[61℄ Williams, M. A. J., Talbot, M.R., 2009. Late Quaternary Environmentsin the Nile basin in H. J. Dumont (Ed), The Nile. Origin, Environments,Limnology and Human Use (Monographiae Biologi ae, Volume 89)(61-72). Dordre ht: Springer[62℄ Williams M.A.J., Williams, F.M., Duller, G.A.T., Munro, R.N., ElTome, O.A.M., Barrows, T.T., Ma klin, M., Woodward, J., Talbot,M.R., Haberlah, D. and Fluin, J. 2010. Late Quaternary �oods anddroughts in the Nile valley, Sudan: new eviden e from opti ally stim-ulated lumines en e and AMS radio arbon dating, Quaternary S ien eReviews (29) 1116-1137[63℄ Salvatori, S., Usai, D., 2007. The oldest rep-resentation of a Nile boat, Antiquity (81,314).http://www.antiquity.a .uk/projgall/usai/index.html[64℄ Ri e, M.P., 1987. Pottery analysis. 2005 edn. USA: The University ofChi ago Press[65℄ Veniale, F., 1990. Modern te hniques of analysis applied to an ient e-rami s, Advan ed Workshop, Analyti al Methodologies for the Investi-gation of Damaged Stones, Pavia (Italy), 14-12 September 1990[66℄ Govindaraju, K., 1994, 1994 ompilation of working values and sampledes ription for 383 geostandards , Geostandards Newsletter (18) 1-158[67℄ Whitbread, I.K., 1995. Greek Transport Amphorae: A Petrologi al andAr haeologi al Study, Fit h Laboratory O asional Paper (4) BritishS hool at Athens.[68℄ Ba elle, L., Bosellini, A., 1965. Diagrammi per la stima visiva della omposizione per entuale nelle ro e sedimentarie. Ann. Univ. Ferrara(N.S.) (9) 59-62.[69℄ Kemp R.A., 1985. Soil mi romorphology and the Quaternary. Quater-nary Resear h Asso iation Guide (2) Cambridge.[70℄ Muller, G., 1964. Methoden der Sediment-Untersu hung.Sedimentologie,Teil I.E. S hweizenbartas he Verlagsbu hhandlung, Stuttgart 303[71℄ Middleton, A.P., et al., 1985. Textural analysis of erami thin se tions:evaluation of grain sampling pro edures. Ar haeometry, 27(1) 64-74.
BIBLIOGRAPHY 123[72℄ Reedy, C.L., 2008. Thin-se tion petrography of stone and erami ul-tural materials. London: Ar hetype Publi ations Ltd.[73℄ Reedy, C.L., 2006. Review of digital image analysis of petrographi thinse tions in onservation resear h. Journal of[74℄ Stoltman, J.B., 1989. A quantitative approa h to the petrographi anal-ysis of erami thin se tions. Ameri an Antiquity, 54(1) 147-160[75℄ Dobosz, B., Krzyminiewsky, R., 2007. Linear transformation of EPRspe tra as a method proposed for improving identi� ation of paramag-neti spe ies in erami . Appl. Radiat. Isot. (65) 392-396[76℄ Bartoll, J., Ikeya, M., 1997. ESR dating of pottery: a trial. Appl. Radiat.Isot. 48, 981-984[77℄ Bensimon, Y. et al., 2000. Nature and thermal stability of paramagneti defe ts in natural lay: a study by ele tron spin resonan e. J.Phys.Chem. Solids 61, 1623-1632[78℄ Campos, S.S. et al., 2011. Proposal for a new method to extra t quartzfrom materials used for retrospe tive dosimetry and dating. Radiat.Measur. 46, 1509-1513[79℄ Watanabe, S. et al. 2008. Chemi al pro ess to separate iron oxides parti- les in pottery sample for EPR dating. Spe tro him. A ta Part A: Mol.Biomol. Spe tros. 71(4) 1261-1265[80℄ Ikeya, M., 2004, ESR Dating, Dosimetry and Mi ros opy forTerrestrialand Planetary Materials, Ele tron Paramagneti Resonan e (19) TheRoyal So iety of Chemistry[81℄ Jonas, M., 1997, Con epts and methods of ESR dating, Radiat. Meas.(27) 943-973[82℄ Timar-Gabor, A., Vandenberghe, D.A.G., Vasiliniu , S., Panaoitu, C.E.,Panaiotu, C.G., Dimofte, D., Cosma, C., 2011. Opti al dating of Roma-nian loess a omparison between silt-sized and sand-sized quartz. Qua-ternary International 240, 62e70.[83℄ Constantin, D. et al., 2012. SAR-OSL dating of di�erent grain-sizedquartz from a sedimentary se tion in southern Romania interbeddingthe Campanian Ignimbrite /Y5 ash layer. Quat. Geo h.(10) 81-86
124 BIBLIOGRAPHY[84℄ Mejdahl, V., 1979. Thermolumines en e dating: beta dose attenuationin quartz grains. Ar haeometry (21) 61-73[85℄ Fain, J. et al., 1999. Lumines en e and ESR dating Beta-dose attenua-tion for various grain shapes al ulated by a Monte-Carlo method. Quat.Geo h.(18) 231-234[86℄ Wintle, A.G.,2008. Lumines en e dating: where it has been and whereit is going, Boreas (37) 471-482.