diminishing returns: why investors may … and company...diminishing returns: why investors may need...
TRANSCRIPT

MAY 2016
AUTHORED IN COLLABORATION WITH MCKINSEY’S STRATEGY AND CORPORATE FINANCE PRACTICE
DIMINISHING RETURNS: WHY INVESTORS MAY NEED TO LOWER THEIR EXPECTATIONS

Copyright © McKinsey & Company 2016
In the 25 years since its founding, the McKinsey Global Institute (MGI) has sought to develop a deeper understanding of the evolving global economy. As the business and economics research arm of McKinsey & Company, MGI aims to provide leaders in the commercial, public, and social sectors with the facts and insights on which to base management and policy decisions. The Lauder Institute at the University of Pennsylvania ranked MGI the world’s number-one private-sector think tank in its 2015 Global Think Tank Index.
MGI research combines the disciplines of economics and management, employing the analytical tools of economics with the insights of business leaders. Our “micro-to-macro” methodology examines microeconomic industry trends to understand better the broad macroeconomic forces affecting business strategy and public policy. MGI’s in-depth reports have covered more than 20 countries and 30 industries. Current research focuses on six themes: productivity and growth, natural resources, labor markets, the evolution of global financial markets, the economic impact of technology and innovation, and urbanization. Recent reports have assessed the economic benefits of tackling gender inequality, the global consumers to watch, a new era of global competition, Chinese innovation, and digital globalization.
MGI is led by three McKinsey & Company directors: Jacques Bughin, James Manyika, and Jonathan Woetzel. Michael Chui, Susan Lund, Anu Madgavkar, and Jaana Remes serve as MGI partners. Project teams are led by the MGI partners and a group of senior fellows, and include consultants from McKinsey & Company’s offices around the world. These teams draw on McKinsey & Company’s global network of partners and industry and management experts. Input is also provided by members of the MGI Council: Eric Labaye (chairman of MGI), Andres Cadena, Richard Dobbs, Katy George, Rajat Gupta, Eric Hazan, Acha Leke, Scott Nyquist, Gary Pinkus, Shirish Sankhe, Oliver Tonby, and Eckart Windhagen. In addition, leading economists, including Nobel laureates, as well as business leaders and policymakers act as research advisers.
The partners of McKinsey & Company fund MGI’s research; it is not commissioned by any business, government, or other institution. For further information about MGI and to download reports, please visit www.mckinsey.com/mgi.
AUTHORED IN COLLABORATION WITHMcKinsey & Company’s Strategy and Corporate Finance Practice
McKinsey’s Strategy and Corporate Finance practice’s core mission is to help clients make substantial improvements in their performance. Over the past five years, the practice has conducted more than 11,000 strategy engagements worldwide. A dedicated Strategy Analytics Centre combines proprietary databases with advanced modelling techniques and analytical platforms to generate distinctive data-driven insights on corporate performance, value creation, macroeconomic forces, and global and local trends. The practice’s textbook Valuation is in its sixth edition and remains the number one guide to corporate valuation, helping managers, investors, and students around the world understand how to foster corporate health and create value for the future. These insights and capabilities build on the practice’s continued investment in research and expertise across strategy, corporate finance, digital transformation, innovation, growth, transactions, regulatory strategy, and leadership development. The practice is led by two McKinsey & Company directors: Martin Hirt and Robert Uhlaner. Please visit www.mckinsey.com/business-functions/strategy-and-corporate-finance/how-we-help-clients.

Richard Dobbs | London
Tim Koller | New York
Susan Lund | Washington, DC
Sree Ramaswamy | Washington, DC
Jon Harris | London
Mekala Krishnan | Stamford
Duncan Kauffman | Singapore
MAY 2016
AUTHORED IN COLLABORATION WITH MCKINSEY’S STRATEGY AND CORPORATE FINANCE PRACTICE
DIMINISHING RETURNS: WHY INVESTORS MAY NEED TO LOWER THEIR EXPECTATIONS

PREFACE
In September 2015, the McKinsey Global Institute (MGI) published a report about the impact of much tougher global competition on corporate profits.* This research found that the past 30 years have been a golden age for companies, and for large North American and Western European companies in particular. Profits were boosted by strong revenue growth from new consumers in emerging markets, containment of costs from automation and global supply chains, and falling corporate taxes and interest rates. That era, we found, is now ending, as the global macroeconomic picture changes and as incumbents face competition from emerging-market companies, technology-enabled corporations stepping out into new sectors, and small and medium-size enterprises benefiting from the scale of platforms such as Amazon and Alibaba. One of the questions that our research raised was what the implications of these changing times could be for investors. This report is our first attempt at providing an answer.
MGI does not make financial market forecasts. But by applying our research into the fundamental global economic and business trends that drive returns earned by equity and fixed-income investors, we arrive at some thought-provoking conclusions about the prospects for future returns. In particular, total returns from both stocks and bonds in the United States and Western Europe are likely to be substantially lower over the next 20 years than they were over the past three decades. If our analysis is correct, this will have significant repercussions for both institutional and individual investors, pension funds, and governments around the world. In coming months we plan to refine and deepen our research.
This research was led by Richard Dobbs, a McKinsey director in London; Tim Koller, an expert partner in McKinsey’s Strategy and Corporate Finance Practice in New York; Susan Lund, an MGI partner based in Washington, DC; and Sree Ramaswamy, an MGI senior fellow based in Washington. Mekala Krishnan led the project team, which comprised Andy Cheema, Nicholai Hill, Duncan Kauffman, and Kenji Nakada. The team benefited from the industry expertise of Jon Harris, a McKinsey director in London. MGI senior editors Janet Bush, Peter Gumbel, and Geoffrey Lewis; Rebeca Robboy and Matt Cooke in external communications; Julie Philpot, editorial production manager; Marisa Carder, Patrick White, and Margo Shimasaki, designers; and Richard Johnson, senior editor, data visualization, also worked on this report.
We are grateful to the academic advisers who provided challenge, insights, and guidance: Martin N. Baily, Bernard L. Schwartz Chair in Economic Policy Development and senior fellow and director of the Business and Public Policy Initiative at the Brookings Institution, and Richard N. Cooper, Maurits C. Boas Professor of International Economics at Harvard University. We would also like to thank Howard Davies, chairman of the Royal Bank of Scotland;
* Playing to win: The new global competition for corporate profits, McKinsey Global Institute, September 2015.

Elroy Dimson, Paul Marsh and Michael Staunton of the London Business School; Anshu Jain, former co-CEO of Deutsche Bank; David G. Lenze of the Bureau of Economic Analysis; Richard Meddings, chair of the audit committee at HM Treasury; Nick Moakes, managing director, investment division, Wellcome Trust; and Adair Turner, former chairman of the UK Financial Services Authority, for their valuable guidance and suggestions, which were provided in a private capacity.
This project benefited immensely from McKinsey colleagues sharing their expertise and analysis: Jonathan Ablett, Pooneh Baghai, Tim Beacom, Pierre-Ignace Bernard, Vincent Bérubé, Gil Bolotin, Bing Cao, Gene Cargo, Sarika Chandhok, Tim Church, Kevin Clancy, Joseph Cyriac, Alexander D’Amico, Onur Erzan, Frank Fernholz, Sacha Ghai, Ezra Greenberg, Kathrin Habrich, Nick Hoffman, Martin Huber, Ritesh Jain, Mimi James, Owen Jones, Daniel Kaposzta, Bryce Klempner, Ju-Hon Kwek, Diaan-Yi Lin, Aishwarya Makkar, Devin McGranahan, Fabrice Morin, Carla Rosch, Abhishek Saxena, Achim Schlitter, Sriyanka Senapati, Ishaan Seth, Nancy Szmolyan, Jonathan Tetrault, Robert Uhlaner, and Zane Williams.
This report contributes to MGI’s mission to help business and policy leaders understand the forces transforming the global economy, identify strategic locations, and prepare for the next wave of long-term growth. As with all MGI research, this work is independent and has not been commissioned or sponsored in any way by any business, government, or other institution. We welcome your emailed comments on the research at [email protected].
Jacques Bughin Director, McKinsey Global Institute Brussels
James Manyika Director, McKinsey Global Institute San Francisco
Jonathan Woetzel Director, McKinsey Global Institute Shanghai
May 2016

© Alamy

CONTENTS
In brief
1985 to 2014 was a golden era for investment returns Page 2
Four exceptional factors underpinned the above-average returns Page 10
Business and economic conditions are changing Page 17
Future conditions suggest returns will be lower Page 20
Households and pension funds are at risk from lower returns Page 28
Technical appendix Page 39
IN BRIEF
DIMINISHING RETURNS: WHY INVESTORS MAY NEED TO LOWER THEIR EXPECTATIONSBuoyed by exceptional economic and business conditions, returns on US and Western European equities and bonds during the past 30 years were considerably higher than the long-run trend. Some of these conditions are weakening or even reversing. In this report, we attempt to quantify the impact on future investment returns. Our analysis suggests that over the next 20 years, total returns including dividends and capital appreciation could be considerably lower than they were in the past three decades. This would have important repercussions for investors and other stakeholders, many of whom have grown used to these high returns.
� Despite repeated market turbulence, real total returns for equities investors between 1985 and 2014 averaged 7.9 percent in both the United States and Western Europe. These were 140 and 300 basis points (1.4 and 3.0 percentage points), respectively, above the 100-year average. Real bond returns in the same period averaged 5.0 percent in the United States, 330 basis points above the 100-year average, and 5.9 percent in Europe, 420 basis points above the average.
� A confluence of economic and business trends drove these exceptional returns. They include sharp declines in inflation and interest rates from the unusually high levels of the 1970s and early 1980s; strong global GDP growth, lifted by positive demographics, productivity gains, and rapid growth in China; and even stronger corporate profit growth, reflecting revenue growth from new markets, declining corporate taxes over the period, and advances in automation and global supply chains that contained costs.
� Some of these trends have run their course. The steep decline in inflation and interest rates has ended. GDP growth is likely to be sluggish as labor-force expansion and productivity gains have stalled. While digitization and disruptive technologies could boost margins of some companies in the future, the big North American and Western European firms that took the largest share of the global profit pool in the past 30 years face new competitive pressures as emerging-market companies expand, technology giants disrupt business models, and platform-enabled smaller rivals compete for customers.
� As a result, investment returns over the next 20 years are likely to fall short of the returns of the 1985–2014 period. In a slow-growth scenario, total real returns from US equities over the next 20 years could average 4 to 5 percent—more than 250 basis points below the 1985–2014 average. Fixed-income real returns could be around 0 to 1 percent, 400 basis points lower or more. Even in a higher-growth scenario based on resurgent productivity growth, we find that returns may fall below the average of the past 30 years, by 140 to 240 basis points for equities and 300 to 400 basis points for fixed income. Our analysis shows a similar outcome for Europe.
� Most investors today have lived their entire working lives during this golden era, and a long period of lower returns would require painful adjustments. Individuals would need to save more for retirement, retire later, or reduce consumption during retirement, which could be a further drag on the economy. To make up for a 200 basis point difference in average returns, for instance, a 30-year-old would have to work seven years longer or almost double his or her saving rate. Public and private pension funds could face increasing funding gaps and solvency risk. Endowments and insurers would also be affected. Governments, both national and local, may face rising demands for social services and income support from poorer retirees at a time when public finances are stretched.

1 Historical returns for Western European fixed-income are based on treasury bonds using data from the Dimson-Marsh-Staunton Global Returns database, which targets a bond duration of 20 years. Future returns show ranges across a set of countries, and are based on ten-year bonds; numbers reflect the range between the low-end of the slow-growth scenario and the high end of the growth-recovery scenario.
SOURCE: McKinsey Global Institute analysis
Lowering your sightsAfter an era of stellar performance, returns on US and Western European equities and bonds could come back down to earth over the next 20 years1
US equities European equities US bonds European bonds
Last 30
7.9
Next 20
4.0–6.5
Next 20Last 30
4.5–6.0
7.9
Next 20Last 30
0–2.0
5.0
Last 30
5.9
Next 20
0–2.0
6.5%
4.9
1.7 1.6
The economic and business drivers of equity and fixed-income returns are shiftingInflation has been tamed Interest rates at historic lows
GDP growth blues Corporate profits under pressure
Last 30Fell from above 10% in many
countries in the early 1980s to below 2% after 2008
Last 30Nominal rates on 10-year govern-ment bonds fell
from above 10% in 1980s to about 2% or lower today in many countries
Next 20Emerging-market companies and
new tech competition could cut margins
Next 20More likely to rise
than fall as the economy recovers
Next 20Little room to fall further but speed
of future increases is uncertain
Next 20Without big
productivity gains, growth could be
weaker as employment growth slows
Last 30New markets, low-cost labor, global supply chains, and
falling corporate taxes boosted
margins
Last 30Robust growth due to strong
productivity gains and increased employment
Growth-recovery scenario
Slow-growth scenario
The past 30 years saw returns that exceeded the long-run average
The next 20 years could be more challenging
Historical real returns
Last 100 years average return

x McKinsey Global Institute Diminishing returns: Why investors may need to lower their expectations
© Getty Images

DIMINISHING RETURNS: WHY INVESTORS MAY NEED TO LOWER THEIR EXPECTATIONSOver the past 30 years, financial investors have had to contend with two equity market collapses, in 2000 and 2008; the steepest one-day decline in history on the New York Stock Exchange, in 1987; an emerging-market crisis that erupted in Asia in 1997 and spread to Russia and Brazil in 1998; and a worldwide financial meltdown and banking crisis. Despite these challenging episodes, financial markets in the United States and Western Europe still delivered total returns to investors between 1985 and 2014 that were considerably higher than the long-term average.
These returns were lifted by an extraordinarily beneficial confluence of economic and business factors, many of which appear to have run their course. Consequently, investors may need to adjust their expectations downward.
In this report, we discuss the changing economic and business conditions that will determine the future returns earned by US and European equity and fixed-income investors and attempt to size the magnitude of the potential shift. Our analysis finds that even if GDP growth rates were to return to the trend rate of the past 50 years, other factors could dampen annual returns over the coming decades by 150 to 400 basis points compared with returns earned in the past 30 years.1 We also discuss what it would take—such as sweeping technological change that lifts corporate productivity and profit growth—to bring returns back to the same level investors enjoyed between 1985 and 2014.
This report has several important caveats. First, we model returns only on US and Western European traded equities and bonds. For reasons of simplicity, we exclude performance of real estate and alternative investments. We also do not assess the past or future performance of emerging-market investments. All of these could lift average returns for investor portfolios in the years ahead, and indeed in future iterations of this work we may expand our analysis to include them. Finally, the analysis in this paper is not meant to be a forecast of future equity or bond returns. Our goal is to help investors, governments, and individuals understand the drivers of returns and the trends that could dampen future investment performance, the potential magnitudes involved, and their implications, so that they can reset their expectations.
1 The scope of our analysis is limited to equity and bond markets in the United States and Western Europe, which comprises 14 countries: Austria, Belgium, Denmark, Finland, France, Germany, Ireland, Italy, the Netherlands, Portugal, Spain, Sweden, Switzerland, and the United Kingdom. Certain countries may be excluded from specific analyses, depending on data availability. We have not taken into account stock or bond investments in emerging economies, largely because of a lack of reliable long-term data. For fixed income, we look at government bonds. Equities data typically consists of companies headquartered or with significant operations in the region.
The returns of the past 30 years were lifted by an extraordinarily beneficial confluence of economic and business factors.

2 McKinsey Global Institute Diminishing returns: Why investors may need to lower their expectations
1985 TO 2014 WAS A GOLDEN ERA FOR INVESTMENT RETURNSThe period from 1985 to 2014 produced equity and bond returns far above long-term averages for both the United States and Western Europe (Exhibit 1).
Real total returns on US and Western European equities both averaged 7.9 percent. In the United States, this was 140 basis points above the 100-year average and 220 basis points higher than the 50-year average. Western European equity returns in the 1985–2014 period also exceeded the 100-year and 50-year averages, by 300 and 220 basis points respectively.
Fixed-income investments, as measured by total real returns on government bonds, were also considerably higher on both sides of the Atlantic in the 1985–2014 period than they had
Exhibit 1
Diminishing returns (investor implications)Reportmc 0427
Returns on equities and bonds have been high over the past 30 years relative to the long-term average
0.1
1.0
10.0
100.0
1,000.0
Total real returns indexIndex: 1.0= 1914 (log scale)
201914 30
European equities1
201450
US equities
European government bonds1,2
US government bonds3
60 200040 908070
SOURCE: Dimson-Marsh-Staunton Global Returns database; Damodaran database, Stern School of Business, New York University; Jutta Bolt and Jan Luitenvan Zanden, The first update of the Maddison Project: Re-estimating growth before 1820, Maddison Project working paper number 4, University of Groningen, January 2013; Conference Board; McKinsey Global Institute analysis
1 European returns are weighted average real returns based on each year's Geary-Khamis purchasing power parity GDP for 14 countries in Western Europe: Austria, Belgium, Denmark, Finland, France, Germany, Ireland, Italy, the Netherlands, Portugal, Spain, Sweden, Switzerland, and the United Kingdom. Austria, Germany, and Italy are excluded from 100-year calculations and from exhibit. Each country’s consumer price index is used to calculate its real returns.
2 For Europe, duration varies by country, but the Dimson-Marsh-Staunton database targets bonds having a 20-year duration.3 Time frame between 1914 and 1927 calculated using Dimson-Marsh-Staunton data. Bond duration for 1928 and later is ten years.
Total real returnsAnnualized, based on 3-year average index at start and end years%
1.6
4.9
1.7
6.5
Bonds
Equities
Equities
Bonds
4.4
5.7
2.5
5.7
5.9
7.9
5.0
7.9United States
1915–2014 1965–2014 1985–2014
Western Europe

3McKinsey Global Institute Diminishing returns: Why investors may need to lower their expectations
been in 1915–2014 and 1965–2014. Total real US government bond returns of 5 percent were 330 basis above the 100-year average and 250 basis points above the 50-year average, while real returns on European bonds averaged 5.9 percent, which was more than triple the 100-year average and 150 basis points above the 50-year average.2
Most investors today have lived their entire business and professional lives during this golden era and many have grown used to expecting that future returns will match those of the past. Many public pension fund managers in the United States, for example, assume returns on a blended portfolio of equities and bonds of about 8 percent in nominal terms, which corresponds to about 5 to 6 percent in real terms.3 With a portfolio of 70 percent of assets in equities and the remainder in fixed income, and assuming real fixed-income returns of 2 percent going forward, this implies that expectations of real equity returns could be 6.0 to 7.5 percent.
This era is coming to an end, as the factors that have contributed to the higher returns in the past run out of steam. To understand this, we need to start by examining what has driven the extraordinary returns of the past three decades.
IDENTIFYING DRIVERS OF EQUITY AND FIXED-INCOME RETURNSGenerations of investors have sought to identify the factors that drive equity and fixed-income returns. In the investing and economic literature, debate continues over the degree to which equity and fixed-income markets are efficient and rational or unpredictable and emotion-driven.4 Researchers and institutional investors seeking to estimate equity returns in the near and long term use a variety of approaches, and there is a growing body of literature on the topic.5
One approach often used for equities is to calculate a long-run average equity return (such as over the past 100 years), and use this to estimate a historical equity risk premium, as the average return minus a risk-free rate. It is then possible to estimate future returns based on projections for the equity risk premiums and the risk-free rate (typically taken as prevailing interest rates on government bonds). An alternate approach uses a discounted cash flow model, with equity returns calculated based on assumptions for GDP growth, inflation, dividend yields, and price-to-earnings (PE) ratios. This approach typically requires assumptions to be made on variables such as dividend yields or PE ratios (which are not directly economic and business variables).
2 Total equity and bond returns include both capital gains and distributions (interest and dividends). Bond returns are calculated as the sum of annual yields and the capital gain or loss that could be realized by reinvesting in a new bond of the same maturity at the prevailing interest rate at the start of every year. Unless explicitly stated, all returns calculations refer to real values and to total returns. Time periods refer to start-of-year and end-of-year values. Bond duration for the United States is ten years. For Europe, duration varies by country but is typically 20 years. For more details, please see the Technical appendix.
3 According to a survey by Wilshire Consulting, the median discount rate for state public pension plans was 7.65 percent in 2014, and for city plans it was 7.5 percent. For more details, see 2015 report on state retirement systems: Funding levels and asset allocation, Wilshire Consulting, February 2015, and 2015 report on city and county retirement systems: Funding levels and asset allocation, Wilshire Consulting, September 2015.
4 The efficient market theory has been especially called into question since the 2008 financial crisis. See, for example, George Akerlof and Robert J. Shiller, Animal spirits: How human psychology drives the economy, and why it matters for global capitalism, Princeton University Press, 2009, and Justin Fox, The myth of the rational market: A history of risk, reward, and delusion on Wall Street, Harper Business, 2009.
5 See, for example, Elroy Dimson, Paul Marsh, and Mike Staunton, Triumph of the optimists: 101 years of global investment returns, Princeton University Press, 2002; John C. Bogle and Michael W. Nolan Jr., “Occam’s razor redux: Establishing reasonable expectations for financial market returns,” Journal of Portfolio Management, volume 42, number 1, fall 2015; Brian D. Singer and Kevin Terhaar, Economic foundations of capital market returns, Research Foundation of the Institute of Chartered Financial Analysts, 1997; State Street Global Advisors, Long-term asset class forecasts (released quarterly). “The low-return world,” Elroy Dimson, Paul Marsh, and Mike Staunton, Credit Suisse Global Investment Returns Yearbook 2013; Strategic Economic Decisions, “1982–2015: The most remarkable stock market of the past century: what really happened, and why it will not be repeated,” Profile, number 132, March 2015; Jeremy J. Siegel, Stocks for the long run: The definitive guide to financial market returns and long-term investment strategies, McGraw-Hill Education, 2014.

4 McKinsey Global Institute Diminishing returns: Why investors may need to lower their expectations
Our approach in this report differs from these other approaches, although our findings are consistent with some. We build on the discounted cash flow approach, but we directly link returns on equities and fixed income both to the real economy and to business fundamentals. Our approach lays out a detailed analytical framework by which to quantify future returns on these investments. We believe this can serve as a tool for investors to analyze returns under alternate conditions in the economy.
For bonds, the essential elements of total returns are yield to maturity and capital gains or losses driven by changes in the yield to maturity (Exhibit 2). Interest rates are a critical element determining price: after the bond is issued, the bond’s price changes as interest rates fluctuate, rising as prevailing interest rates fall and vice versa. This results in capital gains or losses for the bondholder. The movement of interest rates is determined by many factors, including supply of and demand for credit, actions by central banks, changes in credit risk for both governments and corporations, and changes in investor risk appetite. Higher inflation has an impact on fixed-income returns by raising nominal interest rates, but it affects the real yields on bonds.6 Investors demand a risk premium to compensate for expectations of inflation in the future, but realized inflation may be lower or higher than expected. This mismatch between expected and realized inflation partially explains the sustained decline in real interest rates since 1985.
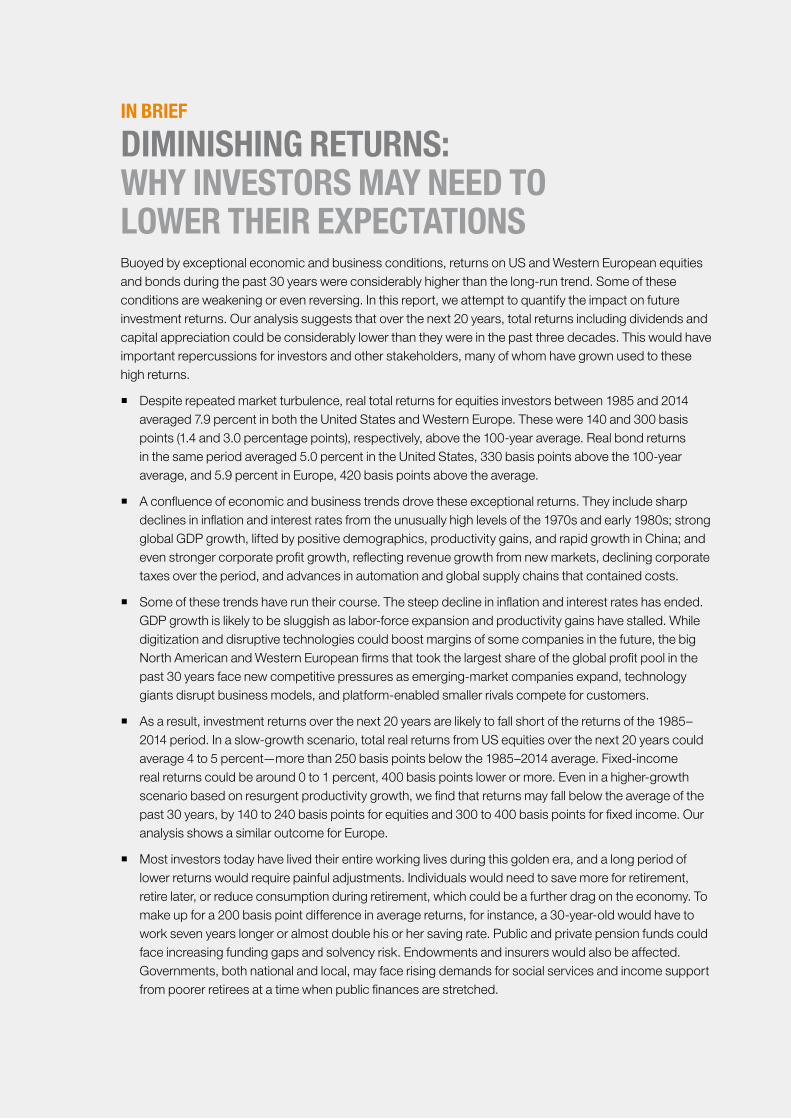
Equity returns are explained by a more complex set of factors that are also underpinned by economic and business fundamentals. The two direct components of total equity returns are, similarly to bonds, price appreciation and a cash yield, which is the cash returned to investors in the form of dividends and share repurchases as a percentage of the value of equities at the beginning of the measurement period (Exhibit 3).7 Price appreciation is
6 In our analysis here, we measure inflation based on the consumer price index. We use the consumer price index for each country to calculate real returns for that country. For Europe, aggregate real returns are calculated by first converting nominal returns in local currency to real returns for that country using the country’s consumer price index, and then aggregating real returns across European countries based on a weighted average by GDP.
7 Some critics say buybacks lead to underinvestment, jeopardizing growth. McKinsey research indicates that buybacks by large US companies grew from 10 percent of the market income in the early 1990s to about 47 percent since 2011. Overall, however, distributions to shareholders via buybacks and dividends have remained constant at about 85 percent of income since the 1990s. The research concludes that the increase in buybacks is merely the evolution in how companies distribute excess cash to shareholders. See Are share buybacks jeopardizing future growth? McKinsey & Company, October 2015. In this paper, we use aggregate market capitalization to calculate the impact of share price increase, thus removing the impact of buybacks on price per share.
Exhibit 2
Drivers of fixed-income returns in the past 30 years
SOURCE: McKinsey Global Institute analysis
NOTE: Based on three-year average index at start and end years. Numbers may not sum due to rounding.
Contribution to fixed-income returns in the United States, 1985–2014, annualized%
Total real returns on 10-year US Treasury bonds5.0
Nominal returns
7.9
Ex-post inflation
2.9
Nominal capital gains (due to declining yields)2.0
Nominal yields
5.9
+–
Variables linked to economic conditions

5McKinsey Global Institute Diminishing returns: Why investors may need to lower their expectations
determined by a company’s earnings growth (based on growth in revenue and change in profit margins), and changes in the price-to-earnings (PE) ratio. Changes in the PE ratio reflect changes in investors’ expectations of future earnings growth, return on equity, inflation, and the cost of equity (see the Technical appendix for a more detailed discussion on how PE ratios depend on these variables).
Our analysis of the US equity market is based on the aggregate returns of non-financial companies in the S&P 500, meaning the sum of all the companies in the index using financial metrics from McKinsey’s Corporate Performance Analytics database.8 Aggregate revenue growth is closely tied to GDP growth, although in some periods aggregate revenues may grow faster or slower than GDP growth. The cash returned to shareholders is the companies’ earnings times a payout ratio, which is simply the portion of earnings not needed to be reinvested in the business to drive future growth. The amount of earnings needed to be reinvested for future growth is, in turn, determined by nominal growth and the marginal return on equity. All else being equal, when companies earn a higher return on equity, they do not need to invest as much to achieve a given level of growth. Conversely when companies grow faster they need to invest more of their earnings at a given return on equity and will have lower payout ratios.
Inflation has an important, but under-appreciated effect on equity returns, affecting both payout ratios and PE ratios. Higher inflation increases nominal net income growth, which in turn reduces the payout ratio and the cash returned to shareholders, unless companies are able to increase their return on equity sufficiently to offset the effect of higher nominal growth on required investment.9 During the high inflation of the 1970s and early 1980s, firms were not able to increase their prices and profit margins enough to compensate for the higher reinvestment rates required. In addition to reducing cash distributions, high inflation also reduces PE ratios. During periods of high inflation, investors increase the nominal interest rates on fixed income investments. To maintain the relative attractiveness of equities versus fixed income investments, investors also increase the nominal discount rates that they use to value companies’ future cash flows. At the same time, investors lower their cash flow expectations because of the lower payout ratios we just described.
Changes in real interest rates can also affect the value of equities and, therefore, equity returns. One effect is on interest expense and interest income. Higher real rates lead to higher interest expense and lower interest income. For companies with modest leverage, these effects are not significant. In theory, changes in real interest rates could also affect the real cost of equity (the discount rate investors use to discount expected future cash flows
8 Real returns in this exhibit are based on non-financial institutions in the S&P 500 and were used for the sole purpose of understanding the drivers behind 30- and 50-year returns. Given the different coverage of companies here, values for returns may vary slightly from those of US equities shared elsewhere in this report. GDP growth was based on a weighted average of US and non-US GDP growth, based on share of domestic vs. overseas corporate profits.
9 Companies attempt to pass along the impact of inflation to customers by growing earnings with inflation. However, prior McKinsey research has shown that this is insufficient to maintain returns to shareholders as inflation increases. Instead, to mitigate the impact of rising inflation, companies need to ensure that their cash flows grow with inflation by increasing their payout ratio, through an increase in their return on invested capital. For more details, see Marc Goedhart, Timothy M. Koller, and David Wessels, “How inflation can destroy shareholder value,” McKinsey on Finance, number 34, winter 2010.
Equity returns are explained by a more complex set of factors that are also underpinned by economic and business fundamentals.
6 McKinsey Global Institute Diminishing returns: Why investors may need to lower their expectations
from companies). As we discuss later, however, the empirical evidence does not show that changes in real interest rates have measurable effects on the real cost of equity.
Exhibit 3
Drivers of equity returns in the past 30 years
Contribution to equity returns in the United States, 1985–2014, annualized%
Total real returns on US equities
8.9
Nominal returns
11.8
Ex-post inflation
2.9
NOTE: The letter “f” denotes “function.” For more details, see Technical appendix. Numbers may not sum due to rounding.1 Calculated as the product of payout ratio and earnings yield.2 Acquisitions paid for by shares rather than cash. 3 Includes cross terms.4 Calculated as 1 – (nominal net income growth ÷ marginal return on equity).5 Based on weighted average US + non-US GDP growth. See Technical appendix for more details.6 Refers to 3-year average at start of period and 3-year average at end of period.7 Average capital productivity over the past 30 years.8 30-year average of total debt divided by the sum of total debt and the book value of equity.
SOURCE: McKinsey Corporate Performance Analytics; McKinsey Global Institute analysis
Nominal market capitalization appreciation
7.8
Marginal return on equity
20.4Cash yield, including dividends and net repurchases1
4.0
Dilutive effect of acquisitions paid by equities2
-1.8
Payout ratio, including dividends and net repurchases4
67.0
Earnings yield
5.9
PE ratio
10.0 to 14.86
Ex-post inflation
2.9
Real US and non-US GDP growth5
2.7
Additional revenue on top of GDP growth3
0.8
Margin change3
0.4
Margin
5.3 to 10.16
Capital productivity
1.47
Leverage
0.48
Real cost of equity
7.0
Expectations of real net income growth3.8
Expectations of average return on equity14.3
Expectations of inflation
2.9
+
f
f
f
f
×
+
+
–
Variables linked to
Economic conditions
Investor expectations
Business conditions
Change in PE ratio
2.9
Nominal net income growth3
6.8

7McKinsey Global Institute Diminishing returns: Why investors may need to lower their expectations
EQUITY AND FIXED-INCOME RETURNS OVER THE PAST 30 YEARS WERE LIFTED BY FALLING INFLATION, DECLINING INTEREST RATES, STRONG GDP GROWTH, AND EVEN STRONGER PROFIT GROWTHSome of the differentiating factors for returns are most clearly identified by looking at the difference between total fixed-income and equity returns over the 30 years between 1985 and 2014 and comparing them with returns from the 50 years between 1965 and 2014.10
The most important factor for US ten-year government bonds were the large capital gains driven by declining interest rates in the past 30 years. Capital gains accounted for 1.8 percentage points of the 2.5 percentage point difference between 30-year and 50-year returns. Inflation that was lower than expected contributed an additional 1.3 percentage points. These factors were diminished by the change in nominal yields over the two periods (Exhibit 4).
10 A lack of detailed historical data prevents us from making an in-depth comparison to the 100-year period from 1915 to 2014. As a surrogate, we have used the 50 years from 1965 to 2014, for which decomposed data are available. While we realize that it is not perfect for comparison purposes, this half century comprises 30 years of relatively good returns and 20 years of relatively poor ones, which over the entire period makes it closer to a long-run “normal.” Exhibits detailing the drivers of both fixed income and equities over the 50-year period from 1965 to 2014 are in the Technical appendix.
Exhibit 4
Declining yields and lower inflation drove higher bond returns in the United States in the last 30 years
5.0
2.5
1.7
1.30.6
1.8
1985–2014real returns(nominal less ex-post inflation)
Lowerex-post inflation
Lowernominal yields
Higher nominal capital gains (due to declining yields)
1965–20141915–2014
SOURCE: Dimson-Marsh-Staunton Global Returns database; Damodaran database, Stern School of Business, New York University; McKinsey Global Institute analysis
NOTE: Based on three-year average index at start and end years. Numbers may not sum due to rounding.
Fixed-income returns, 10-year US Treasury bonds, annualized%
Real returns (nominal less ex-post inflation)
“Long-term” normal returns
Inflation▪ 30-year = 2.9%▪ 50-year = 4.3%
Driver effect
Increased 30-year returnsReduced 30-year returns

8 McKinsey Global Institute Diminishing returns: Why investors may need to lower their expectations
The same factors affected Western European fixed-income returns. For UK ten-year government bonds, for example, real returns in the past 30 years amounted to 4.9 percent, compared with 2.5 percent in the past 50 years. Of the 2.4 percentage point difference in real returns between the 30-year and 50-year return, higher nominal capital gains in the 30-year period contributed 1.6 percentage points, while lower inflation contributed an additional 2.4 percentage points. Higher nominal yields in the 50-year period shaved some of the impact from these gains, by 1.5 percentage points.
For equities, changes in price-to-earnings ratios, which reflect investor expectations of future real profit growth, inflation, and return on equity, played a decisive role in lifting returns over the past 30 years. The difference in average real equity returns between the 30 years from 1985 and 2014, and the 50 years from 1965 to 2014 amounts to 3.3 percentage points (Exhibit 5). Differences in the PE ratio pattern between the two periods accounted for 2.5 percentage points of the difference. PE ratios were roughly the same at the beginning and end of the 50-year period. However, during the 30-year period, forward PE ratios increased from an average of 10 between 1982 to 1984 to an average of 14.8 between 2012 and 2014. In 2014, forward PE ratios stood at 17. Growth in profit margins in the past three decades accounted for 1.1 points of the increase in equity returns. Slightly higher real GDP growth in the 50-year period contributed to higher 50-year returns by 0.3 percentage points.
Exhibit 5
Declining inflation and increasing margins drove higher equity returns in the United States in the last 30 years
8.9
5.6
6.5 2.5
1.1
1915–20141 1965–20142 Other2,3
0.1
Lower real GDP growth
0.3
1985–2014real returns(nominal less ex-post inflation)2
Increase in net income margin2
Increase in PE ratios (driven by declining inflation and increasing margins)2
SOURCE: Dimson-Marsh-Staunton Global Returns database; McKinsey Corporate Performance Analytics; McKinsey Global Institute analysis
1 Based on Dimson-Marsh-Staunton Global Returns database and includes both financial and non-financial institutions.2 Based on data from McKinsey’s Corporate Performance Analytics and only includes non-financial S&P 500 companies.3 Includes impact of revenue growth incremental to GDP growth.NOTE: Numbers may not sum due to rounding.
Equity returns, United States, annualized%
Real returns (nominal less ex-post inflation)
“Long-term” normal returns
Driver effect
Increased 30-year returnsReduced 30-year returns

9McKinsey Global Institute Diminishing returns: Why investors may need to lower their expectations
The increase in PE ratios in the recent 30-year period reflects a rebound since the 1970s, a period of double-digit inflation. During the 1960s, PE ratios on US equities averaged between 15 and 16 for the market overall. However, in the mid-1970s, they plunged to between 7 and 9, largely due to high inflation. As we discussed in the previous section, high inflation leads to lower PE ratios as investors reduce their cash flow expectations because companies have to invest more of the profits to achieve the same real profit growth, thus generating lower cash flows. Also, investors demand higher nominal returns to offset their concern about the declining purchasing power of future dividends, increasing nominal discount rates. By the early 1980s, PE ratios had recovered only slightly, to about 10, as investors were still concerned about high inflation even though actual inflation had begun to subside. Continued declining inflation eventually convinced investors that inflation had been wrung out of the system. In addition, aggregate profit margins continually improved during the 30-year period, leading to higher cash payout ratios.
As a consequence of these favorable trends, PE ratios rebounded, rising to a range of 15 to 20 times earnings in the early 1990s, roughly where they stand today.11 This increase of PE ratios from the 1980s to today’s levels had an outsized impact on equity returns over the past 30 years. As noted, the conditions at the start and end of the 50-year period were relatively “normal,” and this is reflected in the PE ratios in the 1960s and PE ratios today, which have been in the range of 15 to 20.
11 In the late 1990s, PE ratios rose as high as 40 to 50 during the peak of the technology bubble. However, this was a temporary phenomenon and PE ratios quickly fell back to about 15 to 16 by the mid-2000s.
Changes in PE ratios, inflation, and return on equity played a decisive role in lifting total US equity returns in the past 30 years more than three percentage points above the 50-year average.

10 McKinsey Global Institute Diminishing returns: Why investors may need to lower their expectations
FOUR EXCEPTIONAL FACTORS UNDERPINNED THE ABOVE-AVERAGE RETURNSAs we have seen from the exhibits above, four factors—inflation, interest rates, real GDP growth, and corporate profitability—constitute the fundamental economic and business conditions underpinning equity and bond returns. Assessing what explains their past trends, and how this may shift in the years ahead, is critical for assessing future medium- and long-term market trends.
INFLATION HAS DECLINED SHARPLY SINCE ITS PEAK IN THE LATE 1970SThe three-decade decline in US and European inflation since the oil shocks and easy monetary policy of the 1970s has had a significant beneficial impact in financial markets. In the United States, consumer price inflation averaged 2.9 percent over the 30-year period, considerably less than the 50-year inflation average of 4.3 percent.
The turning point for inflation came in 1979, when the Federal Reserve under the chairmanship of Paul Volcker raised interest rates aggressively to bring down inflation, which had risen above 13 percent. By 1982, US annual inflation had fallen to 3.9 percent and stayed at about 4 percent through the rest of the 1980s. European central banks took similarly aggressive action to rein in inflation. In the United Kingdom, inflation reached 25 percent in 1975 but declined to 5.4 percent by 1982. Inflation in France reached 15 percent in 1974 but dropped to 4.7 percent by 1985 and has been subdued ever since. German inflation never reached the same heights as those of its large European neighbors, but it also dropped sharply, from more than 6 percent in 1981 to about 2 percent in 1984. German reunification in 1990 led to a renewed bout of inflationary pressure, with consumer price inflation rising in 1992, but the Bundesbank responded quickly by raising interest rates. Since the 2008 financial crisis, inflation has dipped further, and particularly in Western Europe it has dropped so low as to stoke concerns about the risks of deflation.
As discussed above, inflation affects real equity returns through the payout ratio and its effect on PE ratios. Higher inflation over the past 50 years led to a payout ratio of 57 percent, compared with 67 percent over the past 30 years. The low PE ratios of the 1970s and 1980s were a direct consequence of the high inflation investors had come to expect, and the subsequent rise in PE ratios was the biggest contributing factor to the high equity returns of the past 30 years. The net cash yield to shareholders was roughly the same in both periods, at about 4 percent, as lower payout ratios and lower PE ratios largely offset one another (for more details, see the Technical appendix).
For fixed-income returns, capital gains from declining nominal interest rates were a key contributor to higher returns in the past 30 years. Falling inflation explains part of this decline in nominal rates but it was also due to a decline in real interest rates after central banks brought inflation under control in the 1980s and helped reduce investors’ inflation risk premium.12
FALLING INVESTMENT, HIGHER SAVINGS, AND CENTRAL BANK ACTION REDUCED INTEREST RATES, WHICH ARE NOW NEGATIVE IN SOME COUNTRIESGlobal nominal and real interest rates, which have a direct bearing on bond prices and also affect equities, have declined since the 1980s. Central banks first tamed inflation, and then the propensity to save rose while the global investment rate fell.13 Since the 2008 financial crisis, central banks have used rates and other unconventional monetary policy instruments
12 Farewell to cheap capital? The implications of long-term shifts in global investment and saving, McKinsey Global Institute, December 2010.
13 Ibid.

11McKinsey Global Institute Diminishing returns: Why investors may need to lower their expectations
in attempts to rekindle economic growth. In the United States, the rate on nominal ten-year US Treasury bonds fell from about 14 percent in 1981 to 2.2 percent at the end of 2015; it stands at 1.9 percent as we write this report. In the Eurozone, nominal interest rates on ten-year government bonds declined from 14.6 percent in 1981 to 1.3 percent in 2015, according to the Organisation for Economic Co-operation and Development (OECD).14 In the United Kingdom, nominal interest rates of ten-year government bonds declined from above 13 percent in the early 1980s to 1.9 percent in 2015.
Some researchers have estimated that, in real terms, global interest rates declined by 4.5 percentage points between 1980 and 2015.15 For mature economies, prior MGI research has shown that real interest rates on ten-year government bonds declined from between 6 and 8 percent in the early 1980s to 1.7 percent in 2009.16 Declining inflation explains the early part of the fall. As inflation stabilized, the perceived risk of unexpected future inflation also decreased, driving down inflation risk premiums.
Other factors have contributed to the decline in interest rates. Favorable demographics, which increased the share of the working-age population and reduced the dependency ratio, may have raised the propensity for savings, especially in China.17 The consequential sudden and massive inflows of savings from emerging markets into US and other financial markets, the so-called global saving glut, contributed to lower interest rates.18 The falling relative price of capital goods and a reduction in public investment contributed to lower demand for capital, which in turn reduced pressure on interest rates.19 Demand for capital also fell with investment. Investment as a share of GDP fell from 24 percent of US GDP in 1985 to 20 percent in 2015.
Since 2007, monetary policy during the global financial downturn and subsequent weak recovery has sent interest rates in both the United States and Western Europe to historic low levels. The nominal ten-year US Treasury yield fell from just over 4.7 percent at the start of 2007 to 1.9 percent in March 2016. In the United Kingdom, the decline for this maturity was 270 basis points from 4.7 percent at the start of 2007 to 1.5 percent in the same period. Similar declines were seen in much of Europe, with nominal yields on ten-year sovereign bonds now standing less than 1 percent in France and Germany, 1.2 percent in Italy, and 1.4 percent in Spain. Nominal yields on ten-year bonds are negative in Switzerland. These ultra-low interest rates reflect an aggressive monetary policy response that also includes the provision of liquidity and credit market facilities to banks and large asset purchases often called quantitative easing. The balance sheets of central banks have ballooned as a result. The Federal Reserve balance sheet grew from less than $900 billion in 2007 to almost $4.5 trillion in March 2016, while at the European Central Bank, the total rose from just over €900 billion ($1 trillion) in 2007 to €2.9 trillion ($3.3 trillion) in April 2016.
In the United States, capital gains on bonds added 1.9 percentage points to bond returns between 1985 and 2014 as nominal interest rates dropped from 9 percent to 2 percent. In
14 Based on the evolving composition of the Eurozone. Data refer to central government bond yields on the secondary market, gross of tax, with around ten years’ residual maturity. Average is calculated based on purchasing power parity GDP weights.
15 Mervyn King and David Low, Measuring the “world” real interest rate, NBER working paper number 19887, February 2014; Lukasz Rachel and Thomas D. Smith, Secular drivers of the global real interest rate, Bank of England staff working paper number 571, December 2015.
16 Farewell to cheap capital? The implications of long-term shifts in global investment and saving, McKinsey Global Institute, December 2010.
17 Lukasz Rachel and Thomas D. Smith, Secular drivers of the global real interest rate, Bank of England staff working paper number 571, December 2015.
18 The term “global saving glut” was popularized by Ben S. Bernanke, who later served as Federal Reserve chairman, in a speech to the Virginia Association of Economists in Richmond, Virginia, on March 10, 2005.
19 Ibid. Lukasz Rachel and Thomas D. Smith, “Secular drivers of the global real interest rate,” Bank of England staff working paper number 571, December 2015
10-YEARbond yields are negative in Switzerland

12 McKinsey Global Institute Diminishing returns: Why investors may need to lower their expectations
the United Kingdom, capital gains from declining rates contributed about two percentage points of the total return on UK bonds of 8.7 percent returns over the 30-year period.
Companies benefited from lower interest expenses. For US listed firms, net interest payments declined by 40 percent in the 30-year period, adding roughly one percentage point to the increase in post-tax margins.
Another path by which interest rates can affect equity returns is through the discount rates (or cost of equity) used by investors to estimate the present value of future cash flows. In theory, and all else being equal, low interest rates could boost prices by lowering the discount rates used by investors. This should result in an increase in PE ratios. Mathematically, every one percentage point drop in the cost of equity should increase the PE ratio by 20 to 25 percent. However, our analysis shows that over the past 50 years the real cost of equity has usually stayed within a narrow band of 6 to 8 percent, averaging about 7 percent. This has remained the case even with ultra-low interest rates. This indicates that even if investors believe the risk-free rate has fallen because of a decline in government bond yields, they have offset this with a higher equity risk premium. Alternately, it may be that investors do not view the government bond rate as the appropriate proxy for the risk-free rate, particularly in today’s environment.20 In either case, the total cost of equity for the average company does not appear to have benefited from ultra-low interest rates. If it had, we would expect to see PE ratios and stock prices substantially above today’s levels. This is consistent with the discount rates we observe companies and bankers using to evaluate and price acquisitions. It is also consistent with our observation that most management teams and corporate boards have not reduced their investment hurdle rates or minimum returns for projects. One reason for corporations keeping their costs of equity high is that even if the cost of equity were low today, companies and investors cannot lock in that cost of equity the way they can lock in a long-term borrowing rate. Companies are reluctant to invest at a low cost of equity if they believe that equity costs will return to higher levels. It would be value-destroying to a company to invest in a new 20-year project that earns an 8 percent return on equity against a hypothetical cost of equity of say 7 percent, only to find the cost of equity increasing to 9 or 10 percent within a year or two, making the project permanently underwater.21
Interest rates can also have an impact on share prices and equity returns through portfolio rebalancing, where low yields on fixed-income securities result in an increased demand for equities, thus driving up prices. This, however, works only if investors see equity investment as a true substitute for fixed-income investment. The volatility of equity markets since the 2008 financial crisis may have deterred some fixed-income investors from moving into equities.
Lower interest rates and inflation can also boost other classes of assets besides equities and fixed income, including real estate (see Box 1, “Real estate prices in some markets exceeded their historical average”).
20 For more details, see “Calculating and interpreting results,” in Tim Koller, Marc Goedhart, and David Wessels, Valuation: Measuring and managing the value of companies, sixth edition, John Wiley & Sons, 2015; and Richard Dobbs, Tim Koller, and Susan Lund, “What effect has quantitative easing had on your share price?” McKinsey on Finance, number 49, winter 2014. See also Marc H. Goedhart, Timothy M. Koller, and Zane D. Williams, “The real cost of equity,” McKinsey Quarterly, October 2002.
21 QE and ultra-low interest rates: Distributional effects and risks, McKinsey Global Institute, November 2013.

13McKinsey Global Institute Diminishing returns: Why investors may need to lower their expectations
WORLD GDP GROWTH WAS FUELED BY FAVORABLE DEMOGRAPHICS AND PRODUCTIVITY GAINSAs we have seen above, real GDP growth is one of the key drivers of equity returns, helping to boost corporate revenue and profit growth. Prior McKinsey research found that between 1985 and 2014, global GDP grew in line with the post–Second World War historical trends, averaging 3.3 percent per year globally, compared with 3.6 percent between 1965 and 2014.22 Similar trends were evident in the United States and Western Europe. In the United States the 30-year average growth rate of GDP was 2.6 percent, compared with 2.9 percent over the past half century; in Western Europe, it was about 1.7 percent, compared with 2.2 percent over the past half century. We consider global GDP growth, not just domestic growth, because a large share of revenue for US and Western European firms comes from overseas. A recent McKinsey study found that in 2013, the largest listed firms in advanced economies derived 50 percent or more of their revenue from foreign markets.23 China alone accounted for almost 30 percent of the GDP growth of the past 50 years within a group of the 19 national economies of the G-20 plus Nigeria.
While the rate of GDP growth over the past 30 years was not exceptional compared with the past 50 years, two drivers of historical GDP growth are notable, particularly with a view to prospects for future growth. The first of these was brisk growth in the working-age population (15- to 64-year-olds) and employment growth. MGI research has found that in the G-19 and Nigeria, the share of the working-age population climbed from 58 percent in 1964 to 68 percent in 2014. Employment in this group of 20 economies contributed about 48 percent of their GDP growth. Employment in the United States grew at an annual rate of 1.4 percent during the past 50 years, contributing slightly less than 50 percent of GDP growth. China and other emerging-market countries more than doubled their employment in this period. As we will discuss later, demographic projections over the next 50 years show that for most countries, employment growth could be much slower at 0.3 percent—potentially reversing this favorable trend for asset returns.
Rising productivity contributed 52 percent to global GDP growth between 1964 and 2014.24 Productivity in the United States grew at an average annual rate of 1.5 percent in this 50-year period. In Western Europe, productivity growth was 1.8 percent per year. A number of factors propelled productivity growth, including a shift of employment from low-productivity agriculture to more productive manufacturing and service sectors, growing automation and efficiency in operations, and increasing integration of the world economy that led to more productive modern businesses gaining share from less productive ones. The average employee generates 2.4 times as much output today as in 1964. In both Western Europe and the United States, productivity increased from a relatively high base.25
22 For more details, see Global growth: Can productivity save the day in an aging world? McKinsey Global Institute, January 2015.
23 Based on the largest 100 companies from the 2013 Fortune Global 500 list that reported revenue by geographic segment in that year and had revenue from overseas markets. For more details, see Jacques Bughin, Susan Lund, and James Manyika, “Harnessing the power of shifting global flows,” McKinsey Quarterly, February 2015.
24 Global growth: Can productivity save the day in an aging world? McKinsey Global Institute, January 2015. 25 Ibid.
In 1964–2014
52%of global GDP growth came from rising productivity

14 McKinsey Global Institute Diminishing returns: Why investors may need to lower their expectations
Box 1. Real estate prices in some markets exceeded their historical averageThe business and economic fundamentals of the 1985–2014 period that affected stocks and bonds, in particular the decline in interest rates, also played out in the real estate market. However, the highly localized nature of real estate means that this impact was mixed on a global level.
Real estate is one of the largest asset classes. In the United States, for example, equities and fixed income in 2014 together amounted to $61 trillion, compared with real estate holdings of just over $34 trillion. So-called alternative assets—including private equity, commodities, and options and futures—together amounted to about $2 trillion.
The appreciation in the value of residential homes has typically been lower than that of the return on equities. But the attractiveness from an investment standpoint is enhanced by the owners’ ability to borrow against it. If a homeowner borrows 80 percent of the purchase price of a home, and the home price increases at 1 percent per annum in real terms, over a 30-year period the homeowner will “perceive” a 6.6 percent real return on the investment (assuming the homeowner treats the mortgage payments as the equivalent of rent).
Between 1985 and 2014, real housing prices increased faster than the 40-year average in France, the Netherlands, the United Kingdom, and the United States, contributing to a rise in household wealth. This was not the case in all countries, however: Germany and Switzerland, for instance, did not experience such housing price gains during this period. Even taking account of the turbulence in real estate markets during and after the 2008 financial crisis, increases in US home prices have outstripped the inflation rate by 1 percent annually over the past 30 years (Exhibit 6). Taking a longer time frame of 100 years, house prices in the United States increased in line with the rate of inflation.
A number of factors have been at work. Falling interest rates reduce mortgage rates, and thus enable borrowers to take out mortgages more cheaply or to borrow more. US and Western European mortgage rates dropped in the 2000s to levels not seen since the 1960s; since then, mortgage rates have hit new lows. However, the strength of the relationship between interest rates and home price is debated: empirical evidence suggests that a decrease in interest rates of 100 basis points increases home prices by up to 7 percent.1 However, this traditional link may have been loosened since the financial crisis. Prior McKinsey research found that house prices continued to fall until 2011 even though the Federal Reserve started to lower its policy rate in 2007, engaged in more unconventional policy measures in late 2008, and began its first two rounds of large-scale asset purchases in 2008 and 2009. Tightening of lending standards since the financial crisis may have played a role, preventing many potential new buyers from securing mortgages.2
Beyond macroeconomic factors such as GDP growth, inflation, and interest rates, local factors exert a powerful influence on housing prices. These factors include the growth of local populations, income trends, availability of land for building, and local zoning and building regulations.3 The importance of such local factors makes it difficult to analyze real estate markets at a national level. Within the same country, prices may soar in some cities and decline in others. In the United States, home prices have grown at two to four times the national average over the past 30 years in densely populated cities with vibrant local economies, including New York and San Francisco. Home prices in London rose by an average of 3.6 percent per year in real terms between 1985 and 2014, slightly higher than the 3.3 percent United Kingdom average during this period. Meanwhile, in cities such as Dallas, economic growth has not resulted in as much home price appreciation, given the greater availability of land for development and expansion of housing into the suburbs.
1 Kenneth N. Kuttner, “Low interest rates and housing bubbles: Still no smoking gun,” in The role of central banks in financial stability: How has it changed? Douglas D. Evanoff et. al., eds., World Scientific Publishing Company, 2014.
2 QE and ultra-low interest rates: Distributional effects and risks, McKinsey Global Institute, November 2013.3 Edward L. Glaeser, “Housing supply,” NBER Reporter research summary, spring 2004.

15McKinsey Global Institute Diminishing returns: Why investors may need to lower their expectations
Box 1. Real estate prices in some markets exceeded their historical average (continued)
Exhibit 6
Real estate returns vary significantly by country
SOURCE: Dimson-Marsh-Staunton Global Returns database; Federal Reserve Bank of Dallas; McKinsey Global Institute analysis
0
50
100
150
200
250
300
350
85 201490 2000801975 100595
Real home pricesIndex: 100 = 1975
France
Germany
Switzerland
United States
The Netherlands
United Kingdom
Nominal values adjusted for inflation using CPI
Real home price returnsAnnualized, based on 3-year average index at start and end years%
-0.4
0.8
1.0
1.1
2.1
3.0
Germany
The Netherlands
France
United Kingdom
United States
Switzerland
-0.7
1.0
0.6
2.7
2.5
3.3
1975–2014 1985–2014
Box 1

16 McKinsey Global Institute Diminishing returns: Why investors may need to lower their expectations
CORPORATE PROFIT MARGINS HAVE BEEN EXCEPTIONALLY HEALTHY OVER THE PAST 30 YEARSIncreases in profit margins have also increased total profit growth and equity price appreciation. The past three decades have been exceptional times for North American and Western European multinational companies, with profits growing much faster than global GDP. In the United States, an increase in net income margins contributed one-third, or 1.1 percentage points, of the higher real equity returns of the past 30 years, compared with the past 50 years.
Overall, global corporate after-tax operating profits rose to 9.8 percent of global GDP in 2013 from 7.6 percent in 1980, an increase of about 30 percent. Global net income growth was even more impressive, growing its share of global GDP by more than 70 percent.26 While the global profit pool expanded, North American and Western European companies captured more than half the total. In 2013, North American companies generated 26 percent of global profits, and Western European firms 25 percent.27 North American publicly listed firms increased their post-tax margins from 5.6 percent to 9.0 percent over the three decades, a gain of about 60 percent.28 Between 2010 and 2014, US firms’ after-tax profits measured as a share of national income exceeded the 10.1 percent level last reached in 1929. At their peak in 2012, US corporate after-tax profits rose to 11 percent of national income. By 2015, that share had dropped back to 9.8 percent.
Margin growth was driven by several factors. Companies were able to grow revenue by accessing the growing global consumer class in emerging markets. Corporate revenue more than doubled from $56 trillion in 1980 to more than $130 trillion in 2013, driven by the growth in consumption and investment. Today, nearly one-third of all US firms’ profit comes from overseas compared with about 15 percent in 1980.
As companies increased their revenue, they also reduced their cost base. More than one billion people joined the global labor pool during this period, allowing firms in labor-intensive industries to benefit from lower labor costs. Rapid technological innovation has helped companies improve productivity and further reduce costs; in the past 30 years, the cost of automation (relative to labor) has fallen by more than half in advanced economies. Tax payments also declined in many countries over the past 30 years. Statutory corporate tax rates fell by as much as 50 percent in some OECD countries; effective tax rates declined even faster. The rate for publicly listed companies in advanced economies dropped from nearly 43 percent in 1993 to roughly 31 percent in 2015.29
In the past few years, profit growth has been increasingly driven by intellectual property and other intangible assets in sectors such as pharmaceuticals, medical devices, media, finance, and information technology. Companies in these industries accounted for 17 percent of North American and European profits in 1999; by 2013, that share had grown to 31 percent.30
26 Based on an analysis of 28,250 companies (16,850 publicly listed firms and 11,400 privately held firms) with more than $200 million in annual revenue. For more details, see Playing to win: The new global competition for corporate profits, McKinsey Global Institute, September 2015.
27 For the purposes of this analysis, North America comprises the United States and Canada. Western Europe comprises the EU-15 and Switzerland.
28 Based on an analysis of US and Canadian non-financial firms with more than $200 million in annual revenue, available from the CPAT database.
29 For more details, see Playing to win: The new global competition for corporate profits, McKinsey Global Institute, September 2015.
30 Ibid.
Post-tax margins for North American firms increased by
60%

17McKinsey Global Institute Diminishing returns: Why investors may need to lower their expectations
BUSINESS AND ECONOMIC CONDITIONS ARE CHANGINGThe fundamental economic and business conditions outlined above that contributed to above-average returns in the past 30 years have run out of steam, and in some cases are in the process of reversing.
THE STEEP DROP IN INTEREST RATES IS UNLIKELY TO CONTINUEThe decline in interest rates around the world starting in the 1980s gave a strong boost to both equity and fixed-income returns, as we have seen. While the future path of interest rates is unclear, the steep declines of the past 30 years are unlikely to be repeated.
Rates are either beginning to shift direction or have little room to fall further. In some countries they are already negative. In December 2015, the US Federal Reserve nudged its target range for the benchmark federal funds rate up by 0.25 percent, to 0.5 percent. This was the first official rate rise in seven years. The Federal Reserve cited considerable improvements in US labor market conditions and said it was “reasonably confident that inflation will rise, over the medium term, to its 2 percent objective.” Since then, the Federal Reserve, in its March 2016 meeting, appeared to slow down its plans for further rate increases in 2016 and also reduced its expectations for inflation for the year, citing weak global growth. And despite the increase in the federal funds rate, nominal yields on ten-year US Treasuries remain below 2 percent.
In the Eurozone, interest rates have reached historic lows. In March 2016, the European Central Bank once again cut short-term rates, expanded its quantitative easing bond buying program, and offered banks an incentive to increase their lending. It was the first major central bank to cut deposit rates to less than zero, meaning banks have to pay to hold deposits at the European Central Bank. Consumer prices in Western Europe are essentially flat or even posting small monthly declines. In February 2016, the European Central Bank downgraded its forecast for inflation in 2016 to 0.5 percent, half the rate forecast at the end of 2015, and well below the central bank’s 2 percent target. In early 2016, nominal yields on ten-year government bonds in many countries were approaching zero. Nominal yields on ten-year government bonds in Switzerland are below zero.
Some economists believe we have entered an era of “secular stagnation” and expect rates to remain low for the foreseeable future, because of the weak growth outlook.31 This is not without precedent; Japan has had low interest rates for 25 years. In February 2016, the Japanese government even sold ten-year bonds that offered a negative yield.32 A different perspective is seen in the Philadelphia Federal Reserve’s survey of professional forecasters in the first quarter of 2016, with estimates of average nominal ten-year US Treasury yields over the next 10 years ranging from 2 percent to 4.8 percent (at year-end 2015, yields were at 2.2 percent). Economic forces may pull interest rates in different directions. For example, if economic growth continues to be weak, demand for investment capital could remain constrained, putting downward pressure on interest rates. However, this could be offset by reduced supply of credit as retirees draw down on their savings and governments borrow more. Even among economists who expect rates to rise, there is disagreement and uncertainty about the pace of any such increases.
31 See, for example, Lawrence M. Summers, “The age of secular stagnation: What it is and what to do about it,” Foreign Affairs, March/April 2016.
32 Kevin Buckland and Shigeki Nozawa, “Japan sells 10-year bonds at negative yield for the first time,” Bloomberg News, February 20, 2016.

18 McKinsey Global Institute Diminishing returns: Why investors may need to lower their expectations
If inflationary pressures continue to remain subdued and interest rates stay low—even in the United States, some critics questioned the Federal Reserve’s rate hike in December 2015—corporate margins could benefit from reduced interest expenses, though the broader impact of long-term low or negative interest rates is difficult to assess. Investors in Japan, for instance, have not reduced their cost of equity despite low interest rates. US or European investors may follow the same path. At the same time, if investors believed interest rates would be permanently lower, this could result in a decline in the cost of equity, leading to higher PE ratios. In either case, this is uncharted territory for US and European equity returns. For the purposes of our analysis, we assume that investors’ real cost of equity does not change going forward, consistent with the historical experience of Japan.
For bonds, however, low interest rates would imply an environment of low returns going forward. In the longer term, higher interest rates could be positive for investors seeking yield, but the eventual transition from low rates to higher ones will leave investors with capital losses.
STALLED EMPLOYMENT GROWTH COULD WEIGH ON GDP GROWTHA simultaneous increase in productivity and employment fueled global GDP growth over the past 50 years, but that confluence no longer exists. An aging world population means that one of the twin engines that powered growth over the past half century—the growing number of working-age adults—has stalled. Employment growth of 1.7 percent a year between 1964 and 2014 is set to drop to just 0.3 percent a year over the next 50 years in the G-19 countries and Nigeria. Peak employment is likely to occur within the next 50 years. This leaves the onus on productivity growth to power long-term GDP growth.
The magnitude of the aging trend and its impact on growth varies by country. In the United States, population growth slowed to 0.9 percent per year in the past decade, from 1.1 percent per year over the preceding two decades, and is projected to decline to 0.7 percent over the next 20 years. According to the Bureau of Labor Statistics, one-third of the US labor force is 50 years of age or older. The United Nations projects that the US working-age population will decline from 66 percent of the population in 2015 to 60 percent over the next two decades. In Western Europe, aging is more striking than in the United States. In France, for example, the share of the working-age population is expected to decline from 63 percent to 58 percent over the next 20 years. In Germany, the fertility rate has exceeded replacement rate in only seven of the past 50 years. Employment has already peaked in Germany, and its labor pool could shrink by up to one-third by 2064. Until the 2015 influx of refugees from Syria, Iraq, and elsewhere, the German population was expected to shrink by as much as 0.3 percent per year over the next 20 years.
MGI research has found that even if productivity were to grow in real terms at the rapid 1.8 percent annual rate of the past 50 years, the rate of global GDP growth would fall by 40 percent over the next 50 years given the decline in employment growth. The global economy expanded sixfold in the 50 years after 1964 but would grow only threefold between 2014 and 2064. In the United States, this implies that real GDP growth could slow to 1.9 percent over the next 20 years. In Germany, absent a rise in productivity, GDP growth could drop by more than 50 percent over the next 50 years. Italy would sustain a 36 percent decrease in GDP growth, and France’s GDP growth would drop 18 percent. To compensate fully for slower employment growth, real productivity growth would need to be 80 percent faster, or 3.3 percent a year. The research identified opportunities to boost productivity growth to as much as 4 percent per year, but that would necessitate significant effort by businesses and governments to innovate and adopt best practices from others.33
33 For a detailed discussion, see Global growth: Can productivity save the day in an aging world? McKinsey Global Institute, January 2015.
1/3of US labor force is 50 or older

19McKinsey Global Institute Diminishing returns: Why investors may need to lower their expectations
BUSINESSES FACE A MORE COMPETITIVE ENVIRONMENT THAT COULD REDUCE MARGINSThe North American and Western European companies that benefited the most from growth of the global profit pool between 1980 and 2013 are facing tougher competition from three sources that could reduce their margins and profits.34
The first source is new competitors from emerging markets. The number of multinational firms has doubled since 1990, and many of the newcomers are from emerging markets.35 These new competitors often play by different rules, bringing low cost structures, more nimble market responses, and a willingness to accept lower returns. Their rapid growth, increasingly through acquisitions, poses a significant challenge to large Western incumbents in many industries. Chinese firms already make up some 20 percent of the Fortune Global 500, while the share of US and Western European companies dropped from 76 percent in 1980 to 54 percent in 2013.36
Technology and tech-enabled firms represent the second source of margin-threatening competition—and are unpredictable. By building powerful digital platforms and networks, the biggest technology and tech-enabled giants have reached unprecedented scale in terms of users, customers, revenue, and profits. Some have disrupted long-standing business models by converting huge amounts of industry value to consumer surplus at the expense of incumbents’ profits—by providing apps or services without charge to users, for example. Thus in 2013, forty percent of international call minutes were Skype-to-Skype calls, representing $37 billion of lost revenue for telecom firms. From 2005 to 2013, the total revenue lost from this growing trend amounted to nearly $150 billion.37 Marginal costs for online businesses can be almost zero, enabling technology and tech-enabled firms to make rapid moves into new sectors.
The third source of heightened competition for large businesses will increasingly come from small and medium-sized enterprises. Historically these players were not able to compete with large enterprises because they lacked scale. But this is changing. Alibaba, eBay, Amazon, and other online platforms are now providing a way for thousands of small and medium-sized enterprises to achieve immediate global reach and compete with far larger players, turning themselves into “micro-multinationals” that are able to sell to customers around the world.
This changing competitive landscape, combined with rising costs, is likely to have an impact on profit margins. MGI research suggests that after-tax profits could fall from 9.8 percent of global GDP to 7.9 percent, reversing in a single decade the corporate gains of the past 30 years.38 Western European profits could be especially hard hit; European firms are more exposed to capital-intensive sectors than US companies and less engaged in industries such as pharmaceuticals, media, and IT that have experienced strong profit growth in the past decade. More competition is not the only threat to margins. Labor costs are rising rapidly in some emerging markets, eroding one of the principal cost advantages that big North American and Western European companies have enjoyed for the past three decades. And governments are looking to raise corporate tax take and close loopholes. In April 2016, for example, the US Treasury announced rules aimed at stopping US companies from reincorporating abroad, if only on paper, to avoid US income taxes.
34 Playing to win: The new global competition for corporate profits, McKinsey Global Institute, September 2015. 35 This is a conservative estimate that does not include multinational companies based in low-tax jurisdictions.36 Urban world: The shifting global business landscape, McKinsey Global Institute, October 2013.37 Playing to win: The new global competition for corporate profits, McKinsey Global Institute, September 2015.38 Ibid.

20 McKinsey Global Institute Diminishing returns: Why investors may need to lower their expectations
FUTURE CONDITIONS SUGGEST RETURNS WILL BE LOWERBased on our analysis of the economic and business forces determining returns, we project equity and fixed-income returns over the next 20 years using two scenarios for growth. In neither case would United States or Western European equity and bond returns match those of the past 30 years, and they could even be lower than 50- or 100-year average returns.
We start with a discussion of the two growth scenarios and their impact on US equities and fixed-income returns for investors (Exhibit 7). This is followed by an analysis of the effect of similar scenarios on Western European equities and fixed income. In each growth scenario, we assume that there is a period over which business and economic fundamentals change, and investors adjust their expectations to these changing fundamentals (see the Technical appendix for a detailed discussion of the two scenarios).
Exhibit 7
Returns over the next 20 years could be lower than long-term average returns in the United States
1 Historical data based on three-year average.2 NOPLAT is net operating profit less adjusted taxes. 3 Based on G18 (consists of G20 minus Eurozone and US) and Nigeria.4 Refers to ending values, with an adjustment period from today’s rates.5 Based on 2015 values.
SOURCE: McKinsey Global Institute analysis
Assumptions and returns for US equities and fixed income%
Historical data Scenarios, 2016–35
1965–2014 1985–2014 Slow growth Growth recovery
Assumptions
Real GDP growth%
US 2.9 2.6 1.94 2.94
Non-US3 3.4 3.0 2.14 3.44
Inflation% 2.9 4.3 1.6 2.4
Nominal interest rates1
%Start of period 4.1 11.2 2.25 2.25
End of period 2.3 2.3 2.0–3.54 4.0–5.54
NOPLAT margin1,2
%Start of period 7.3 5.3 10.1 10.1
End of period 10.1 10.1 8.1–8.74 9.6–10.14
Total US returns, annualized (%)
Equities
Fixed income, based on 10-year treasury bonds
7.95.7 4.0–5.0
5.5–6.5
5.0
2.50–1.0
1.0–2.0

21McKinsey Global Institute Diminishing returns: Why investors may need to lower their expectations
For US equities, for example, PE ratios are at about 17 today, reflecting investor expectations that economic and business fundamentals will be relatively strong going forward. These PE ratios are roughly consistent with investors expecting 2 percent inflation and 3 percent real earnings growth going forward. As fundamentals evolve, investors will need to adjust their expectations, particularly in the slow-growth scenario. The exact time frame over which fundamentals decline and this adjustment will take place is hard to predict, but evidence from history suggests it could be anywhere from ten to 20 years.39 These changing fundamentals could lead to lower returns during the adjustment period. In the case of bonds, increasing interest rates lead to capital losses, potentially lowering returns in the short term. Our estimates are based on non-financial institutions. Shareholder returns for financial institutions are harder to forecast than non-financial institutions because their profitability and growth is influenced as much by GDP growth as by regulation and monetary policy. That said, if financial institutions grow with the economy and maintain their current profitability, shareholder returns should be similar to non-financial companies over a 20-year period.
SCENARIO 1. SLOW GROWTH COULD REDUCE TOTAL US EQUITY RETURNS BY MORE THAN 250 BASIS POINTS AND BOND RETURNS BY 400 BASIS POINTS OR MORE BELOW THE 1985–2014 PERIODIn the first scenario, the slow-growth environment of today continues, and both equity and fixed-income returns in the United States over the next 20 years would be substantially lower than in the 1985–2014 period.
We assume that faster productivity growth does not compensate for lower employment growth, but instead remains at the long-term average of the past 50 years. In the United States, average real GDP growth would be 1.9 percent over the next 20 years, while GDP growth in the rest of the world would be a little higher, at 2.1 percent.40 Employment would grow at 0.5 percent per year and productivity at 1.5 percent per year in the United States. In this scenario, our model suggests that nominal interest rates on ten-year US government bonds would rise, but only slowly, reaching 2.0 to 3.5 percent. Inflation would remain tame, averaging 1.6 percent over the next 20 years, reflecting weak demand. Profit margins would shrink due to technological disruptions and increased competition. US companies’ average margins, based on their net operating profit less adjusted taxes (NOPLAT), would fall from 10.1 percent in 2014 to between 8.1 and 8.7 percent through 2035, a rate that is still higher than that seen in 1965 to 1985.41
39 For example, prior MGI research has discussed that since the Federal Reserve conquered inflation in the early 1980s, inflation expectations have steadily fallen. However, it has taken nearly 20 years to assuage investors’ fears of unexpected inflation. For more details, see Farewell to cheap capital? The implications of long-term shifts in global investment and saving, McKinsey Global Institute, December 2010.
40 As measured by net operating profit less adjusted taxes (NOPLAT).41 This is based on the average margins of non-financial companies in the S&P 500, as captured in the CPAT
database, which includes foreign firms incorporated in the United States. In previous sections, we discuss the profits of North American firms rising from 5.6 percent to 9 percent in the last three decades. Those numbers are based on publicly listed US and Canadian firms with annual revenue greater than $200 million.
In both of our scenarios for slow growth and growth recovery, US and Western European equity and bond returns fail to match those of the past 30 years and could be lower than the 50- and 100-year averages.

22 McKinsey Global Institute Diminishing returns: Why investors may need to lower their expectations
If growth continues on this weak path and competition continues to squeeze profits, real equity returns for investors could fall to between 4 and 5 percent over the 20-year period. This would be around 300 to 400 basis points below US real equity returns of 7.9 percent from 1985 to 2014. These returns would also be lower than long-term historical returns of 5.7 percent over the past 50 years and 6.5 percent over the past 100 years. PE ratios would fall from their values of 17 today to about 14.5 to 15 over the 20-year period, as investors adjust their expectations downward. Total returns on fixed-income investments could be between zero and 1.0 percent over the next 20 years. This is as much as 400 to 500 basis points below total returns in the past 30 years, and also below the 100-year and 50-year averages of 1.7 percent and 2.5 percent, respectively.
As noted, the exact time frame over which fundamentals change and investors adjust their expectations is uncertain. Over the first decade of this 20-year period, we calculate that real equity returns may fall below 4 percent as PE ratios decline based on declining margins and slow GDP growth.
SCENARIO 2. IN A GROWTH-RECOVERY SCENARIO, US EQUITY AND BOND RETURNS WOULD BE 140–240 AND 300–400 BASIS POINTS, RESPECTIVELY, BELOW THE AVERAGE OF THE 1985–2014 PERIODIn the second scenario, the US and global economies exhibit faster growth, reflecting strong productivity growth. Real equity returns would be higher, as would real bond returns. But both would remain below the 1985–2014 average.
In this growth-recovery scenario, GDP growth would pick up as productivity growth accelerates and compensates for slower employment growth. This scenario could reflect the impact of new technologies that lift productivity growth, such as the Internet of Things, advances in computing and automation, new materials, and further digitization of industries. We would also have to assume that employees displaced by these technologies are redeployed productively.
This scenario is predicated on real US GDP growth of 2.9 percent per year and non-US GDP growth of about 3.4 percent per year. Productivity growth would significantly pick up, to 2.4 percent per year in the United States, driven by technological advances. At the same time, if US companies could match the performance of their best-performing industry or global peers, companies could maintain their post-tax margins at roughly today’s levels. We assume that, in this environment, nominal interest rates on ten-year US Treasury bonds would rise to about 4.0 to 5.5 percent and inflation would average around 2.4 percent over the next 20 years, in line with the target of the US Federal Reserve.
Even if a new surge of productivity can restore historical GDP growth rates, we find that investment returns would not match the 30-year average. This would be due to the absence of several unique factors that drove returns historically, including increasing profit margins and PE ratios. As stated previously, PE ratios today are at 17 and are roughly consistent with investors expecting about 2 percent inflation and 3 percent real earnings growth going forward. PE ratios in this scenario would remain at about 2015 values, ranging from about 16.5 to 17.5, reflecting performance of US equities in line with investors’ expectations. We estimate that total real returns on US equities in this scenario over the next 20 years could be about 5.5 to 6.5 percent—about 140 to 240 basis points below the 1985–2014 average, but roughly on a par with the 50-year and 100-year averages of 5.7 and 6.5 percent, respectively. Real fixed-income returns over the next two decades could be about 1 to 2 percent, or 300 to 400 basis points below the returns of the past 30 years.
In a slow-growth scenario, real equity returns may fall below
5%

23McKinsey Global Institute Diminishing returns: Why investors may need to lower their expectations
For the first half of this 20-year period, total real returns on both equities and fixed income could be even lower, for the reasons stated previously. For example, real returns on fixed income could be zero in the first ten years, reflecting capital losses as the rapid rise in interest rates depresses total returns.
FOR US EQUITIES, PROFIT MARGINS AND PE RATIOS ACCOUNT FOR THE MAIN DIFFERENCE IN RETURNS IN THE TWO SCENARIOS, WHILE FOR BONDS, IT IS NOMINAL YIELDSThe most important driver of different bond returns in the two scenarios is the nominal yield (Exhibit 8). Capital losses due to rising yields also play a bigger role in shaving returns in the growth-recovery scenario than in the slow-growth scenario (see the Technical appendix for a detailed comparison between these two scenarios and drivers of returns over the past 30 years).
Changes in profit margins are a key driver of the difference between the 5.5 to 6.5 percent 20-year average returns of the growth-recovery scenario and the 4.0 to 5.0 percent returns of the slow-growth scenario (Exhibit 9). Margin differences directly account for about 0.5 percentage points of the difference, affecting profit growth. Margin differences also have a strong indirect impact on PE ratios and payout ratios. The change in PE ratios accounts for about one percentage point of the difference in returns in the two scenarios. Real GDP growth provides about 0.5 percentage point of the difference. Cash yields are lower in the growth-recovery scenario, shaving returns by 0.5 percentage points relative to the slow-growth scenario.
Exhibit 8
Nominal yields account for most of the difference in bond returns between the two scenarios for the United States
SOURCE: McKinsey Global Institute analysis
NOTE: Numbers may not sum due to rounding.
Contribution to fixed-income returns in the United States, 2016–35, annualized%
Nominal capital gains (due to declining yields)
-0.5 to 0 -1.5 to -1.0
Nominal yields
2.0 to 3.0 4.5 to 6.0
Nominal returns
2.0 to 2.5 3.5 to 4.0
Inflation
1.6 2.4
Total real returns on 10-year US Treasury
bonds
0 to 1.0 1.0 to 2.0
+
–
Slow-growth scenario
Growth-recovery scenario

24 McKinsey Global Institute Diminishing returns: Why investors may need to lower their expectations
Exhibit 9
Margins, PE ratios, and real GDP growth account for most of the difference in equity returns between the two scenarios for the United States
SOURCE: McKinsey Corporate Performance Analytics; McKinsey Global Institute analysis
1 Including dividends and net repurchases.2 Calculated as the product of payout ratio and earnings yield.3 Calculated as 1 – (nominal net income growth ÷ marginal return on equity).4 Includes cross terms.5 Based on weighted average US + non-US GDP growth. See Technical appendix for more details.NOTE: The letter “f” denotes “function.” For more details, see Technical appendix. Numbers may not sum due to rounding.
Contribution to equity returns in the United States, 2016–35, annualized%
Inflation
1.6 2.4
Slow-growth scenario
Growth-recovery scenario
Real US and non-US GDP growth5
~2.0 2.5 to 3.0
Margin change4
~ -1.0 -0.5 to 0
Change inPE ratio
~ -1.0 -0.5 to 0
Nominal net income growth4
2.5 to 3.0
4.5 to 5.0
Marginal return on equity
10.0 to 15.0
15.0 to 20.0
Nominal market capitalization appreciation
1.5 to 2.0
4.0 to 5.0
Cash yield1,2
~4.5 ~4.0
Payout ratio1,3
~80.0 70.0 to 75.0
Earnings yield
~5.5 5.0 to 5.5
Nominal returns
6.0 to 6.5
8.0 to 9.0
Inflation
1.6 2.4
Total real returns on US equity
4.0 to 5.0
5.5 to 6.5
+
+
f
×
+
–

25McKinsey Global Institute Diminishing returns: Why investors may need to lower their expectations
These outcomes are scenarios rather than forecasts, and other factors we have not explored could affect the business and economic fundamentals. Technology and innovation might turn out to have less impact on productivity, growth, and margins than is commonly expected—or advances that are still below the radar could make current expectations look far too conservative. (For a discussion of the conditions needed to raise equity and fixed-income returns to the level of the past 30 years, or drop below even our slow-growth scenario, see Box 2, “Other scenarios with better or worse returns.”) However, the framework we have created linking broad economic and business trends to returns provides investors with potentially useful indicators. These can help create a perspective to assess trends on future investment returns and the impact on investors, businesses, and governments in the next two decades.
Box 2. Other scenarios with better or worse returnsIn both the slow-growth and growth-recovery scenarios, returns over the next 20 years will be substantially lower than over the past 30 years, and potentially lower than over the past 50 or 100 years. What would it take for equity and fixed-income returns to remain as strong as they were during 1985–2014? And, conversely, what would need to change for returns to underperform even our slow-growth scenario?
For equities, a more positive scenario for the United States involves strong GDP and profit margin growth, with more muted inflation. This would require real GDP growth on a par with the historical 50-year average of 2.9 percent in the United States and 3.4 percent in the rest of the world (as in our growth-recovery scenario) combined with an increase in margins of one percentage point (from the 10.1 percent they are at today, for example by capturing gains from digital technologies and big data analytics) and weaker inflation of 1.6 percent (on a par with our slow-growth scenario). Such a combination could yield real returns of about 7.5 to 8.0 percent over the next 20 years. This scenario would require the United States to raise productivity growth from the 1.5 percent average over the past 50 years to 2.3 percent. This also assumes that inflation will not rise to 2 percent or higher levels, as projected by the Federal Reserve, for example, due to such factors as slack in labor markets, capacity that is not being utilized, and cash that has not been invested. Technological disruption beyond the levels we can envision today could potentially accelerate GDP growth beyond the rate of our growth-recovery scenario. This type of technological disruption together with fast-growing emerging-market companies could create sizable value for investors. However, one of the
characteristics of emerging-market firms is that many are not publicly listed, but closely held, often by families or governments.
It is more challenging still to imagine a scenario in which fixed-income returns rise to the levels seen in the past 30 years, during which total real returns on ten-year Treasury bonds have averaged 5.0 percent in the United States. Consider one scenario in which inflation remains very low, at today’s levels of close to 1 percent. If nominal interest rates on these bonds were to rise gradually to as high as 9 or 10 percent in the next ten years, real returns would reach the levels of the past 30 years.
Conversely, what would it take for equity returns to drop even lower than our projections for the slow-growth scenario? For US equities, if margins were to decline to 7.1 percent, real equity returns over the next 20 years would be 3 to 3.5 percent. This is roughly on a par with average margins in the late 1980s and early 1990s, and three percentage points lower than margins today. For this to occur, the margins in asset-light industries such as pharmaceuticals and IT would need to decline by about 30 percent. These sectors have increasingly grown in importance, boosting their share of Western companies’ profits from 17 percent in 1999 to about 30 percent today but are facing increasing regulatory scrutiny. Alternatively, if margins remained at the 8.1 to 8.7 percent of the slow-growth scenario, capital productivity of US firms would need to decline by 20 to 25 percentage points for returns to fall to 3 to 3.5 percent over the next 20 years. In another scenario, global GDP that fell below our slow-growth forecast could bring with it the risk of renewed recession or stagnation, and lower returns.

26 McKinsey Global Institute Diminishing returns: Why investors may need to lower their expectations
EUROPEAN RETURNS WILL ALSO LIKELY BE LOWER IN THE NEXT TWO DECADESWestern Europe’s sector mix and competitive trends, its GDP growth, inflation, and interest rate prospects all vary from those in the United States. There is also significant variation within Western Europe from country to country. For this analysis we separately examined two scenarios for economic and business conditions in Western Europe. For equity returns, we looked at Western Europe in aggregate, but for fixed-income returns we focused on individual countries: France, Germany, and the United Kingdom. Our analysis reveals that investors in Western Europe should expect trends similar to those in the United States, though the magnitude of the fall in future returns could be different (Exhibit 10).
Exhibit 10
Returns over the next 20 years could be lower than long-term average returns in Europe
SOURCE: OECD; Dimson-Marsh-Staunton Global Returns database; Conference Board; European Commission AMECO database; McKinsey Corporate Performance Analytics; McKinsey Global Institute analysis
Historical data Scenarios, 2016–35
1965–2014 1985–2014 Slow growth Growth recovery
Assumptions
Real GDP growth%
Western Europe3 2.2 1.7 1.56 2.26
Rest of the world4 3.7 3.2 2.26 3.76
Inflation%
France 4.5 2.1 1.3 1.6
Germany 2.8 1.9 1.5 1.8
United Kingdom 6.1 3.7 1.6 2.0
Nominal interest rates1
%
FranceStart of period 5.4 14.6 0.97 0.97
End of period 2.1 2.1 2.0–3.56 4.0–5.56
GermanyStart of period 6.1 8.3 0.57 0.57
End of period 1.4 1.4 2.0–3.56 4.0–5.56
United Kingdom
Start of period 5.5 11.8 1.97 1.97
End of period 2.3 2.3 2.0–3.56 4.0–5.56
NOPLAT margin1,2
%Western Europe
Start of period n/a 5.0–6.05 7.5 7.5
End of period 7.5 7.5 6.8–7.06 7.3–7.56
Total European returns, annualized (%)
Equities Western Europe 5.7 7.9 4.5–5.0 5.0–6.0
Fixed income, based on 10-year treasury bonds
France 3.7 6.8
0–1.0 1.0–2.0Germany 4.2 5.1
United Kingdom 2.5 4.9
Assumptions and returns for European equities and fixed income%
1 Historical data based on three-year average.2 NOPLAT is net operating profit less adjusted taxes. 3 Based on data for EU-4 countries: France, Germany, Italy, and the United Kingdom.4 Rest of world refers to all other G-20 countries and Nigeria.5 Estimates based on triangulation of multiple sources.6 Refers to ending values, with an adjustment period from today’s rates.7 Based on 2015 values.

27McKinsey Global Institute Diminishing returns: Why investors may need to lower their expectations
In the first scenario, the slow-growth environment of today would continue, with real GDP growth of 1.5 percent in Western Europe in aggregate. Inflation would pick up but only slowly, rising on average across Western Europe to 1.8 percent in the next ten years. The profit margins of Western European companies, like those of their competitors in North America, would shrink, from about 7.5 percent today to 6.8 to 7.0 percent through 2035. In this scenario, real equity returns could be about 4.5 to 5.0 percent over the next 20 years. This is on a par with the 50-year and 100-year averages of 5.7 percent and 4.9 percent, respectively, but more than 250 basis points below the average returns of the past 30 years of 7.9 percent. The equity returns in this scenario for Europe are slightly higher than those for the United States. This is because margins for Western European companies are expected to decline at a slower pace than for US firms.42
Nominal interest rates (on ten-year government bonds) would rise from their current lows. For example, for France, they would rise from the current ultra-low level of 0.9 percent to 2.0 to 3.5 percent over the next ten years. In this scenario, real returns on ten-year French, German, and UK treasury bonds would remain very low over the entire 20-year period, between 0 and 1 percent, after flat or negative returns in the first few years. This is considerably lower than historical real returns for ten-year French government bonds, which were 3.7 percent over the past 50 years and 6.8 percent the past 30 years. In the United Kingdom, real returns on UK treasury bonds were 2.5 percent over the past 50 years and 4.9 percent over the past 30 years. In Germany, historical returns were 4.2 percent in the past 50 years and 5.1 percent in the past 30 years. For the European countries we looked at in this scenario, the fixed-income returns over the next 20 years would be more than 300 basis points lower than the returns of the past 30 years and 150 basis points or more lower than the returns of the past 50 years.
In the alternate growth-recovery scenario, GDP growth in Western Europe would pick up to 2.2 percent, ending a decade of sluggishness. Companies would tap into productivity improvements, maintaining profit margins on a par with today’s levels of 7.3 to 7.5 percent. Inflation in Western Europe as a whole would rise to 1.8 percent by 2020, in line with the current projections of the International Monetary Fund and the European Central Bank. Returns in this recovery scenario would be higher than the slow-growth case. Real equity returns would be about 5 to 6 percent per year over 20 years, close to the 50-year or 100-year average, but lower than the average of the past 30 years. Real bond returns could still be close to zero or negative in the first years for some countries, but then become more strongly positive over the 20-year period, rising to between 1.0 and 2.0 percent. Nominal interest rates (on ten-year government bonds) would rise rapidly.
42 For more details, see Playing to win: The new global competition for corporate profits, McKinsey Global Institute, September 2015.
Even in a growth-recovery scenario, Western European real bond returns could be close to zero or negative in the first years in some countries.

28 McKinsey Global Institute Diminishing returns: Why investors may need to lower their expectations
HOUSEHOLDS AND PENSION FUNDS ARE AT RISK FROM LOWER RETURNS In both scenarios we have discussed, returns to investors in the United States and Western Europe would be lower in the next ten to 20 years than they have been in the past 30 years, and they would potentially also be lower than the 50- or 100-year average. While this could be offset by higher returns from investing in emerging markets or alternative assets, investors need to prepare for this potential outcome.
Investors—households, private and public pension funds, corporations, endowments, and insurers—have differing exposure to lower returns because they invest in a different mix of assets. As an illustration, compare the differing exposure of US investors in 2014 (Exhibit 11).43 Households are especially large direct investors in equities, and they also are indirect investors in this asset class through their public and private pension funds. They are therefore particularly exposed to lower total equity returns. Insurance companies have a much higher exposure to fixed income than households, holding more than 60 percent of their assets in different types of fixed-income securities. Beyond these investors, lower returns will have an impact on asset managers and, most broadly, on policy makers.
43 The Federal Reserve data for pension funds includes both defined-benefit and defined-contribution plans. For insurers, it includes equities and fixed-income assets held in both General and Separate Accounts.
Exhibit 11
SOURCE: US Federal Reserve, Financial Accounts of the United States, December 10, 2015, release; McKinsey Global Institute analysis
1 Excludes assets owned by all other investor groups including federal pensions, government assets excluding retirement funds, exchange-traded funds, government-sponsored enterprises, security brokers and dealers, etc.
2 Government bond category includes all US Treasury securities3 Other fixed income category includes open market paper, agency and GSE-backed securities, and municipal securitiesNOTE: Numbers may not sum due to rounding. Includes US and foreign assets owned by US investor groups, and excludes US assets owned by foreign
investors. For each investor group mutual funds and money market mutual funds holdings have been distributed across asset classes based on the asset class distribution of aggregate holdings across all investor groups. Excludes holdings of cash, alternative and non-financial assets.
Equities and fixed-income asset ownership by US investor groups, 20141
$ trillion
Corporate equities
Government bonds2
Corporate and foreign
bondsOther fixed
income3 Total
Households and non-profits 18.4 1.5 2.2 3.1 25.2
Institutional investors
State and local pensions 2.6 0.2 0.6 0.2 3.7
Private pensions 4.4 0.5 1.3 0.7 6.8
Property and casualty insurance 0.3 0.1 0.4 0.4 1.3
Life insurance 1.9 0.2 2.3 0.6 5.0
Corporations Banks 0.1 0.4 0.5 2.2 3.3
Nonfinancial corporations 0.1 0.1 0.1 0.3 0.6
Government Central bank 0.0 2.5 0.0 1.8 4.2
Total 28.0 5.6 7.5 9.3
Breakdown of assets owned by US investor groups

29McKinsey Global Institute Diminishing returns: Why investors may need to lower their expectations
HOUSEHOLDS COULD COME UNDER PRESSURE FROM FALLING RETURNSAs Exhibit 11 illustrates, US households hold a significant proportion of their financial assets in equities. In 2014, US households and non-profit organizations held $18.4 trillion in equities and $6.8 trillion in different types of fixed-income assets. Given demographic trends, the share of Americans of retirement age will increase by one and a half times over the next 30 years to reach 21 percent of the population by 2050, or nearly 92 million people. Many of the baby boomers have not saved sufficiently for their retirement. Even the small minority of those who have saved sufficiently under historic rates of return could find themselves short of savings in a world of lower returns.
To show this, consider the impact on a 30-year-old who might expect to receive a 4.5 percent real return from his or her blended investment portfolio of equities and fixed income—consistent with the growth-recovery scenario—rather than 6.5 percent, consistent with returns over the past 30 years.44 To compensate, all else being equal (and especially with no change in life expectancy), that individual would need to work seven years longer or almost double the rate at which he or she saves (see Box 3, “Why 2 percent matters”). If returns were even lower, at 3.5 percent in real terms—consistent with the slow-growth scenario—this individual would need to work an additional nine years, or more than double his or her annual savings.
44 Blended portfolio averages calculated based on a portfolio of 60 percent invested in equities and 40 percent invested in ten-year government bonds. Assumes initial salary of $50,000, real salary growth of 1 percent and life expectancy of 85, with annual social security benefits of $16,000 per person.
Even baby boomers who have been saving for retirement may be caught short in an era of lower returns.
Box 3. Why 2 percent mattersIn both of our scenarios, total returns for both equities and fixed income over the next two decades will be several hundred basis points below the 30-year average from 1985 to 2014. What would that mean for a US investor, in dollars (Exhibit 12)?
Exhibit 12
Over the next 20 years, $100 will grow (in real terms) to…
Slow-growth scenario Growth-recovery scenario On par with last 30 years
US equities $220–270 $290–350 $460
US fixed income $100–120 $120–150 $260
Combined portfolio: 60% US equities, 40% US fixed income $160–200 $210–250 $370
Why 2 percent matters
SOURCE: McKinsey Global Institute analysis
NOTE: Numbers are rounded to nearest 10.

30 McKinsey Global Institute Diminishing returns: Why investors may need to lower their expectations
Older investors may find they need to postpone retirement and, even then, may need to accept a lower standard of living when they stop working. Already, nearly 65 percent of US baby boomers plan to work beyond the age of 65 to shore up their savings and put off when they start drawing Social Security benefits.45 Moreover, private pension plans are increasingly transitioning from defined-benefit to defined-contribution plans, which places the investment risk on the individual.
PUBLIC PENSION FUNDS COULD EXPERIENCE WIDENING FUNDING GAPS AND SOLVENCY RISKSDiminished returns could have a severe impact on defined-benefit public employee pension funds that today account for about 90 percent of the assets of US state and local pension funds (the rest are held in defined-contribution plans).46 US public employee pension plans are increasingly invested in equities. Over the past 30 years, their allocation to fixed income has fallen from 75 percent to 27 percent.47
Many defined-benefit plans are already facing a funding shortfall and, in an era of lower returns, the funding gap would be even larger. In the United States, about 90 percent of state and local employee retirement funds are underfunded , with a total funding gap of roughly $1.2 trillion.48 Ten large public pension funds, including the California Public Employees Retirement System, the California State Teachers’ Retirement System, and the Illinois Teachers’ Retirement System, account for nearly 40 percent of this total funding gap.
This is all the more worrying because most pension funds are still assuming relatively high future returns of about 7.5 to 7.7 percent in nominal terms. An analysis of more than 130 state retirement funds showed that the median expected future returns (based on the discount rate used) was 7.65 percent in 2014. While this marked a decline from 8 percent in 2012, it could still be above the returns in our growth-recovery scenario.49 To deliver this 7.65 percent nominal return would require a real equity return of 6.5 percent, if real fixed-income returns are 2 percent and inflation is also 2.4 percent. If fixed income returns were lower, at 1 percent in real terms, this would imply real equity returns of about 7 percent.
If returns match our slow-growth scenario, the $1.2 trillion funding gap for state and local funds could grow by about $1 trillion to $2 trillion, assuming a portfolio of 30 percent bonds and 70 percent equities. In our growth-recovery scenario, the gap could grow by as much as about $0.5 trillion.
45 Catherine Collinson, Baby boomer workers are revolutionizing retirement: Are they and their employers ready? Transamerica Center for Retirement Studies, December 2014.
46 Defined-benefit plans guarantee a fixed return to retirees. In contrast, defined-contribution plans such as 401(k) plans, are those where retirement benefits are determined by the investment gains and losses of the portfolio. These plans transfer the risk of changing investment returns to households, while in the latter, the risk lies with plan sponsors. In the United States, state and local pension funds are primarily defined benefit plays, with roughly $5.0 trillion of assets held in defined-benefit plans and $0.5 trillion in defined-contribution plans as of 2014.
47 Sacha Ghai, Bryce Klempner, and Josh Zoffer, “Bending the third rail: Better investment performance for US pensions,” McKinsey on Investing, number 2, July 2015.
48 Estimated by triangulating across multiple sources. For more details, see Center for Retirement Research at Boston College, US Federal Reserve, Financial Accounts of the United States, December 10, 2015 release; 2015 report on state retirement systems: Funding levels and asset allocation, Wilshire Consulting, February 2015; and 2015 report on city and county retirement systems: Funding levels and asset allocation, Wilshire Consulting, September 2015. Wilshire data show that state pension funds had an average funding ratio of 77 percent, compared with 95 percent in 2007, a decline that reflected the impact of the recession.
49 For more details, see 2015 report on state retirement systems: Funding levels and asset allocation, Wilshire Consulting, February 2015, and 2015 report on city and county retirement systems: Funding levels and asset allocation, Wilshire Consulting, September 2015. Our analysis of 70 public pension plans from data in the Pension and Investments database for 2014 also revealed median and average assumed rates of return of 7.7 percent.
90%of US state and local employee retirement funds are underfunded

31McKinsey Global Institute Diminishing returns: Why investors may need to lower their expectations
Many European public employee defined-benefit pensions are primarily “pay-as-you-go,” funded by tax revenue rather than investment returns, and thus are not as directly exposed to equity and fixed-income markets as US public pension funds. For example, in the United Kingdom, pay-as-you-go public pension plans for employees had roughly £1.2 trillion ($1.7 trillion) in liabilities, while the total liabilities of funded plans was about £300 billion ($430 billion) (with the latter holding roughly £200 billion [$290 billion] in assets).50 The unfunded pensions face problems from changing dependency ratios given aging but are less exposed to changes in investment returns.51
The rising gap for funded pensions could be addressed in a number of ways—none of them particularly palatable. Governments could increase their pension contributions, but this would take money away from other services, or increase taxes.52 Governments could change the benefits available in the future (for example, this could involve shifting toward defined-contribution plans or hybrid defined-benefit and defined-contribution plans, reducing overall benefit levels for new employees, or modifying cost of living adjustments to reduce pension liabilities), or increase the retirement age.53 Another approach would be to invest in riskier assets in a bid to boost returns.
PRIVATE PENSION PLANS ALSO FACE FUNDING GAPSLower returns could have a less significant impact on US private pension funds than on their public counterparts, because the share of private pension fund assets in defined-benefit plans is smaller. Most private pension funds in the United States are defined-contribution plans, where the risk of falling investment returns is borne by their beneficiaries. Data from the US Federal Reserve show that, in the United States, about $5.3 trillion in assets were held in private defined-contribution plans at the end of 2014 compared with $3.0 trillion in defined-benefit plans. While the rest of this section will be primarily be devoted to defined-benefit pension plans, it is important to note that the trend toward defined-contribution private pension plans has increasingly transferred the risk of low returns from corporations to households. According to the Bureau of Labor Statistics, about 61 percent of private workers in the United States had access to a defined-contribution plan, compared with only 18 percent with access to a defined-benefit plan.
50 Whole of Government Accounts, year ended 31 March 2014, HM Treasury, 2015.51 They are, however, exposed to actuarial gains or losses in their liabilities as interest rates fluctuate. This is
because the discount rates to measure the present value of liabilities of such plans are typically based on high-yield corporate bonds. One estimate for 20 OECD countries of both underfunded and unfunded government pension liabilities (both employee pensions and US Social Security and similar programs in other countries) put the value at $78 trillion, or 190 percent of GDP. Countries in Western Europe, including France, Germany, Italy, Portugal, Spain, and the United Kingdom, had pension liabilities exceeding 300 percent of GDP. Rising life expectancy could put further pressure on pension obligations, with some estimates suggesting that a one-year increase in life span would increase the present value of pension liabilities by 3 to 5 percent. See Dieter Brauninger, Institutions for occupational retirement provision in Europe: Ongoing challenges, Deutsche Bank, May 2014, and “The coming pensions crisis: Recommendations for keeping the global pensions system afloat,” Citi GPS: Global Perspectives and Solutions, March 2016.
52 See, for example, Dara Zeehandelaar and Amber M. Northern, The big squeeze: Retirement costs and school-district budgets, Thomas Fordham Institute, June 2013.
53 Patrick McGuinn, Pension politics: Public employee retirement system reform in four states, Brown Center on Education Policy at Brookings, February 2014.
Most US public pension funds are still assuming relatively high future returns of about 7.5 percent to 7.7 percent in nominal terms.

32 McKinsey Global Institute Diminishing returns: Why investors may need to lower their expectations
Private pension funds in the United States hold slightly more than 60 percent of their assets in equities compared with fixed income. Defined-benefit corporate pension funds in the past few years have already seen the impact of ultra-low interest rates, through the increase in the present value of liabilities.54 Accounting rules in the United States require corporate pension funds to discount their future liabilities based on corporate bond yields. (This approach is different from public-sector plans that use an expected return as their discount rate.) As interest rates have fallen, the present value of liabilities has increased, but asset prices have not kept pace.55 An analysis of the top 100 defined-benefit corporate plans found that liabilities increased by about 44 percent between 2007 and 2014.56 This compares with an increase in assets of about 12 percent over the same period.57 Assets sharply declined between 2007 and 2008 and did not return to 2007 levels until 2012. By contrast, liabilities increased almost steadily between 2007 and 2014. While funding ratios have improved since the financial crisis, these companies still have a funding gap of about $300 billion.
European corporate pension funds have had a similar experience. Defined-benefit plan liabilities grew by 31 percent between 2007 and 2012, primarily driven by declining interest rates. By contrast, assets increased by 23 percent.58 Funding gaps vary by country in Western Europe; for example, in Switzerland, funding ratios of private-sector retirement funds exceeded 100 percent at the end of 2013, while in Germany, the funding ratio for the DAX 30 German companies was at 65 percent in 2013.59 The FTSE 350 companies in the United Kingdom had estimated pension deficits of £84 billion ($119 billion), with liabilities of £686 billion ($969 billion), a funding ratio of 88 percent.60 One positive impact of a rise in interest rates in either the slow-growth or the growth-recovery scenario would be to reduce the present value of liabilities. However, this could be offset by a decline in overall investment returns, particularly in the slow-growth scenario, which may mean that corporate plans would still require additional contributions from employers, potentially hurting their profit margins.61
A Willis Towers Watson survey of private defined-benefit pension funds found that expected rates of return for US private pension funds were about 7 percent on average in nominal or 4.5 percent in real terms, lower than the rates assumed by public pension funds.62 For the United Kingdom, the average expected return was 5.7 percent in nominal or about
54 For more detail, see QE and ultra-low interest rates: Distributional effects and risks, McKinsey Global Institute, November 2013.
55 If pension funds had a completely matched book between liabilities and long-term bonds, changes to the interest rate would have no effect. This is not the case in reality, however, as pension funds invest in a wide variety of assets in an attempt to generate returns. Depending on the degree of matching between the maturities of assets and liabilities, lower interest rates can create a gap between returns and the funds needed to pay retirees.
56 John Ehrhardt, Zorast Wadia, and Alan Perry, Milliman 2015 pension funding study, Milliman, April 2015.57 This could in part be due to companies continuing the shift to defined-contribution plans as well as removing
workers from defined-benefit plans through one-time lump-sum buyouts.58 QE and ultra-low interest rates: Distributional effects and risks, McKinsey Global Institute, November 2013. 59 Dieter Brauninger, Institutions for occupational retirement provision in Europe: Ongoing challenges, Deutsche
Bank, May 2014.60 “The coming pensions crisis: Recommendations for keeping the global pensions system afloat,” Citi GPS:
Global Perspectives and Solutions, March 2016.61 Beyond the impact on corporate pension funds from lower investment returns, trends in the real economy
suggest other potential implications for corporations. One such area is the cost of capital used by companies. Continued low interest rates (as assumed in our slow-growth scenario) would keep the cost of debt low. However, the bulk of corporate financing is equity financing, and prior McKinsey analysis indicates that companies have not adjusted their cost of equity despite the current climate of low interest rates This implies that the overall impact of continuing low, or even rising, interest rates on the cost of capital is likely to be small. Indeed, the most significant risk in a time of low returns might be behavioral. In a world of reduced organic earnings growth, executives may be tempted to cut back investments to boost short-term returns to shareholders. While such an approach may temporarily increase returns, it could prove harmful in the long term. See QE and ultra-low interest rates: Distributional effects and risks, McKinsey Global Institute, November 2013.
62 2015 global survey of accounting assumptions for defined benefit plans, Willis Towers Watson, 2015. Real rates are calculated based on data provided in the report on nominal interest rates and inflation.

33McKinsey Global Institute Diminishing returns: Why investors may need to lower their expectations
3.5 percent in real terms. Some of the difference between the expected return across countries is driven by the relative share of pension fund assets in fixed income vs. equities or other asset classes. For example, roughly 35 percent of US pension assets are held in fixed income, compared with 45 percent for the UK. These expected rates of return suggest that these plans may have already lowered their expectations for future returns, more so than public-sector defined-benefit pension schemes.
INSURERS COULD BENEFIT FROM A GRADUAL RISE IN INTEREST RATESAccording to the Federal Reserve, US insurance companies hold an estimated $2.2 trillion in equities and $4.1 trillion in fixed-income investments. This includes assets in both General and Separate Accounts. More than 90 percent of the corporate equities owned by life insurance companies are in their Separate Accounts (for example, those held in variable annuities, for which the insurance carrier has custody but the individual bears some of the risk). In contrast, about 90 percent of the fixed-income assets owned by life insurers are in General Accounts (for example, linked to guaranteed-rate products, where the carrier bears the risk).
European insurers also invest significantly in fixed-income, holding roughly 55 percent of their assets in fixed-income securities.63 As a result, insurance companies tend to be more sensitive to changes in interest rates than to equity returns. Most US and Western European insurers maintain sufficient capital to cover various forms of risk (including interest rate risk), and are required to do so by regulation. The new Solvency II regulations in Europe require assets to be marked to market, which may put pressure on capital ratios if interest rates rise rapidly. In general, however, solvency for insurers is less of a risk than it is for defined-benefit pension funds.
Nevertheless, the low interest rate environment of the past few years has put pressure on insurance companies, and leaves them with some difficult strategic options for ensuring future returns.64
Life insurers tend to follow a “hold-to-maturity” strategy on their fixed-income investments. As rates have fallen to ultra-low levels, life insurers, particularly those that have a heavy mix of fixed-rate policies (such as annuities), have been squeezed between the returns they have guaranteed and the low rates of return they are receiving from their investments. This is especially true in continental Europe, where guaranteed rate plans can make up more than 80 percent of life insurance premiums written (vs. 45 percent in the United States). The decline in rates has put pressure both on outstanding guarantees life insurers have made, and on their ability to attract new business. As many life policies are of long duration (40 or 50 years), insurers may not be able to find fixed-income assets to match the duration of the policy perfectly. They are therefore exposed to falling interest rates, as bonds mature and assets need to be reinvested.
63 European insurance in figures, statistics number 50, Insurance Europe, December 2014. 64 QE and ultra-low interest rates: Distributional effects and risks, McKinsey Global Institute, November 2013.
The trend to defined-contribution private pension plans has shifted the risk of lower returns to households.

34 McKinsey Global Institute Diminishing returns: Why investors may need to lower their expectations
Falling interest rates have also made it difficult for life insurance companies to create value from new business, given that guaranteed yields to customers are low. As an example, the guaranteed rate offered by German life insurers at the end of 2015 was 1.25 percent, above the ten-year government bond rate of 0.5 percent but well below the average guaranteed rate on existing products of 3.1 percent. Similarly, guaranteed rates on new individual life policies of Swiss insurers also stand at 1.25 percent today, well above the ten-year government bond rate, which stood at -0.07 percent in 2015.
In general, life insurers would benefit from a rise in interest rates, allowing them to better meet their guarantees and offer customers more attractive products, with higher guaranteed rates. Some life insurance products such as variable annuities (particularly popular in the United States) are also closely linked with the performance of equity markets. If equity returns were to decline significantly, this could impact the ability of insurers to meet their guarantees to customers even for these variable annuity products, or it would require them to reduce the level of guarantee they can provide customers.
A continuing environment of low interest rates and low returns could lead life insurers to re-examine their investment strategies. The goal would be to reduce their exposure and spread risk, even as they continue to attract new business. They could, for example, look toward longer-dated and less liquid assets with a higher expected return, such as infrastructure investments, or commercial real estate (particularly given recent reductions in Solvency II risk charges for such investments). Life insurance companies might also want to place greater emphasis on alternate products with less exposure to investment returns, such as standalone health insurance products.
Property and casualty (P&C) insurers in general are less at risk than life insurers from a continuing low interest rate environment. They do not have a large block of guaranteed rate products, and typically tend to have shorter duration liabilities. They can re-price their products more quickly than life insurers, and thus react more quickly to changing interest rates. Nonetheless, if interest rates rise rapidly, P&Cs may find their balance sheets, which are marked to market, diminish temporarily due to capital losses on their assets. This could potentially be the case in our growth-recovery scenario. However, in the long run, P&C insurers, like life insurers, could benefit from the higher investment income that increased interest rates would produce.
Ultimately, the pressures faced by insurers could be passed on to households. If carriers reprice their products—for example, their guaranteed rate products or long-term care products—they will generate less income for households.
ASSET MANAGERS MAY HAVE TO REVIEW INVESTMENT STRATEGIESAlongside these groups likely to suffer from a change in equities and fixed-income returns, other stakeholders, notably asset managers, will face an indirect impact. They need to find ways of boosting returns.
McKinsey’s asset management practice research shows that investment flows are increasingly moving away from active investment in equities, and toward passive equities, active or passive fixed income, or to alternatives and multi-asset products. For example, there was a net global outflow of €2.36 trillion ($2.66 trillion) from active equities between 2009 and 2014, compared with a net inflow of €1.43 trillion ($1.61 trillion) and €1.06 trillion ($1.19 trillion) into multi-asset and alternatives respectively.65 It is important to note that some alternative investments are a zero-sum game, in which one investor’s gains are another’s losses.
65 McKinsey Global Performance Lens Growth Cube analysis. See also New heights demand increasing agility: Global Asset Management overview, Financial Services Practice, McKinsey & Company, June 2015.

35McKinsey Global Institute Diminishing returns: Why investors may need to lower their expectations
This trend could be exacerbated by low returns. Investors may seek to bolster returns or invest in products with much lower charges, thus continuing the trend toward alternative assets and passive, low-cost investments. In a low-return era, the proportion of returns given up to management fees in a high-return period becomes less acceptable.
To confront this, asset managers may have to rethink their investment offerings. One option would be for them to include more alternative assets such as infrastructure and hedge funds in the portfolios they manage. Such alternative assets already account for about 15 percent of assets under management globally today. Flows into such alternative investments have outpaced flows into more traditional assets by three to six times. Institutional investors remain positive about growth prospects of alternatives, and asset managers serving them may consider boosting their exposure to these investments.66 Asset managers will also need to look at their organizational capabilities and processes to ensure that they have the skills to implement these alternate investment approaches.
Another approach could be to enhance capabilities for active management. For example, while average returns in the next 20 years could be lower, our prior research reveals that corporate profits are increasingly shifting from asset-heavy sectors to idea-intensive ones such as pharmaceuticals, media, and information technology, which have among the highest margins. Within these sectors too, firms are developing a winner-takes-all dynamic, with a wide gap between the most profitable firms and others. In such a world, active managers who can successfully identify the winners could see outsize returns.67 However, only a limited number of active managers is able to produce consistently superior returns to passively managed funds, and any shift by asset managers into more active management would need to be supported by truly distinctive capabilities.
POLICY MAKERS WILL FACE CHALLENGING SOCIAL, POLITICAL, AND ECONOMIC CHOICESInvestment returns affect policy makers both directly and indirectly. As we have discussed, a future of low returns could create even larger gaps in public pension funding, and—more broadly—put millions of households under financial and economic pressure. One of the trends of the past few years, in particular through defined-contribution pension plans, is that financial risk has been transferred from institutions to individuals, whose investments tend to be relatively short term and often cash-heavy. At the same time, people in developed countries are living longer after they retire. A prolonged era of low returns could be a toxic mixture, and potentially leave government at all levels—national but also local—facing rising demands for social services and even income support at a time when public finances are already under pressure.
Endowments, non-profits, and foundations which rely on investment returns to help fund expenditures may also be affected. Annual payouts from endowments are usual set to a fraction of the value the assets, approximately 4 percent.68 While such a rule may have been appropriate in the returns environment of the past 30 years, where real asset returns
66 Pooneh Baghai, Onur Erzan, and Ju-Hon Kwek, “The $64 trillion question: Convergence in asset management,” McKinsey on Investing, number 1, winter 2014–15.
67 Playing to win: The new global competition for corporate profits, McKinsey Global Institute, September 2015.68 “The low-return world,” Elroy Dimson, Paul Marsh, and Mike Staunton, Credit Suisse Global Investment
Returns Yearbook 2013.
Asset managers may have to rethink their investment strategies. One option would be for them to include more alternative assets in the portfolios they manage.

36 McKinsey Global Institute Diminishing returns: Why investors may need to lower their expectations
could keep pace with such payouts, it may need to be reconsidered going forward in order to maintain the real value of the endowment assets. The National Centre for Education Statistics estimates the total endowment for US colleges at about $425 billion at the end of 2012. A 3 percentage point lower return could mean about $13 billion less for US colleges.69 This could put pressure on the government for greater subsidies.
A sustained period of low returns could also have a broader economic and political impact. If households in both the United States and Western Europe were to raise their savings rate substantially to make up for the shortfall in investment returns, for instance, this could depress demand, placing an additional drag on growth and exacerbating the effects of low returns. Governments are also facing pressure when the low rates are a result of quantitative easing and monetary policies. In some European countries, especially Germany, low interest rates for savers have become a political issue, with growing public complaints being picked up and echoed by government leaders, despite efforts by the European Central Bank to rebut the arguments.70
Governments are not powerless in the face of a sustained period of lower rates, although implementing structural reforms can be difficult. Policy makers and business leaders on both sides of the Atlantic could do more to enable future generations of workers to continue working longer if they so choose. For many, the prospect of working longer to supplement savings in a low-return environment may be attractive. Above all, stronger productivity growth that could compensate for demographic changes would boost GDP growth, which in turn could help fuel higher returns. Governments have an arsenal of measures at their disposal to raise productivity and GDP growth, ranging from removing barriers to competition, especially in service sectors, investing in physical and digital infrastructure, incentivizing innovation, and boosting labor-market participation among women, older people, and other groups.71
•••
“Past performance is not necessarily indicative of future results,” reads a standard disclaimer that money managers and mutual funds routinely put on all their communications with potential investors. Based on the underlying factors behind the exceptional performance in equity and fixed-income markets in the United States and Western Europe over the past three decades, it is a caveat that professional investors, governments, and households could be well advised to note and act upon in the future. Predicting short-term market movements is inherently difficult, and no investor should exclude that the future, too, may bring with it a new set of exceptional circumstances. But viewed with a long-term perspective, stock and bond returns cannot divorce themselves entirely from the underlying business and economic fundamentals that drive them. A sustained period of lower returns would have implications for a wide swath of society. Households would need to save more, retire later or accept a lower standard of living. Public and private pension funds would need to rethink their investment strategy, increase contributions or reduce liabilities. Insurers would need to manage uncertainty on interest rates, and asset managers may have to revisit their strategy and fees. Governments may have to rethink retirement policies and identify strategies to boost growth. These all amount to difficult choices. Resetting expectations for less bountiful times, with less stellar returns than the past three decades, is the essential starting point.
69 US Department of Education, National Center for Education Statistics, Digest of Education Statistics, 2013 (NCES 2015-011), 2015.
70 Stefan Wagstyl, “Germany blames Mario Draghi for rise of rightwing AfD party,” Financial Times, April 10, 2016; for the ECB response, see Benoît Coeuré, “Savers aren’t losing out,” Handelsblatt, November 11, 2013.
71 See Global growth: Can productivity save the day in an aging world? McKinsey Global Institute, January 2015.

37McKinsey Global Institute Diminishing returns: Why investors may need to lower their expectations
© Getty Images

38 McKinsey Global Institute Diminishing returns: Why investors may need to lower their expectations
© Getty Images

This appendix has three sections. In the first, we summarize the data sources we used to construct the historical returns for equities and fixed income, dating back a century. In the second, we detail our approach to identify the individual drivers of these historical returns, including inflation and price-to-earnings ratios. In the third section, we describe the key assumptions we used in our two scenarios for future returns, and our approach to calculate future returns.
1. SUMMARY OF DATA SOURCES FOR HISTORICAL RETURNSAs a starting point, we created a baseline for historical returns, primarily using data from the Dimson-Marsh-Staunton (DMS) Global Returns database. We chose this database because it contains long-run total returns indexes for equities and fixed income for the United States and several Western European nations. The one exception was data for fixed income for the United States, for which we instead used data available from both the DMS and Damodaran databases.72
The DMS database constructs a view of long-run indexes by choosing what it considers the best available index for each time period.73 The indexes measure “total returns,” which include reinvested gross (pretax) cash income such as interest and dividends and any impact from capital gains or losses. The bond indexes used in the DMS database are based on government bonds. For the United Kingdom, the bond index in the DMS database has a maturity of 20 years, with the exception of 1900−55. The index in this period is based on perpetual bonds with no maturity date, which dominated the market in terms of liquidity until 1955. For all other countries, the DMS database targets 20-year bonds but uses either perpetuals or shorter maturity bonds where 20-year bonds are not available. For the United States, we primarily used an alternate data source for fixed income, available from the Damodaran database, rather than the DMS database. This Damodaran database contains data on ten-year government bonds, available from 1927 on. To construct a fixed-income index between 1914 and 1927, we used data available from the DMS database.
To construct an average index for Europe, we considered countries in the EU-15 and Switzerland. However, the DMS database does not contain data for two countries in the EU-15, Greece and Luxembourg. This left us with a sample of 14 countries in Western Europe: Austria, Belgium, Denmark, Finland, France, Germany, Ireland, Italy, the Netherlands, Portugal, Spain, Sweden, Switzerland, and the United Kingdom. To create a consolidated index for Europe, we used real returns available in local currency from the DMS database and constructed a weighted-average index based on each year’s Geary-Khamis purchasing power parity GDP; GDP data for 1950 and on is based on the Total Economy database of the Conference Board, while GDP data before that time period is based on the Angus
72 Based on Aswath Damodaran database, NYU Stern School of Business.73 Based on DMS data methodological notes. For a detailed view of the methodology used to construct the
indexes in the DMS database, please refer to the following sources: Elroy Dimson, Paul Marsh, and Mike Staunton, Triumph of the optimists: 101 years of global investment returns, Princeton University Press, 2002, as updated in Elroy Dimson, Paul Marsh, and Mike Staunton, Credit Suisse global investment returns sourcebook 2014, Credit Suisse, February 2014. Additional information is in Elroy Dimson, Paul Marsh, and Mike Staunton, “The worldwide equity risk premium: A smaller puzzle,” in Handbook of the equity risk premium, Rajnish Mehra, ed., Elsevier, 2008.
TECHNICAL APPENDIX

40 McKinsey Global Institute Diminishing returns: Why investors may need to lower their expectations
Maddison historical time series.74 To remove distortions of starting and ending points, we based our returns on three-year average index values for both the starting and ending year. For example, to calculate the average 50-year return, we calculated an average starting index value between 1962 and 1964, followed by an average ending index value between 2012 and 2014. We then calculated the return as a geometric mean between the two averages.
The inflation measure used here is based on the consumer price index for each country, again available from the DMS database (see further details below). We do not include Austria, Italy, and Germany in the calculation of 100-year European equity and bond returns due to large movements, particularly in bond index values, in the early decades of this century.
2. DECOMPOSING DRIVERS OF HISTORICAL RETURNSTo decompose the drivers of historical US equity returns, we used data from McKinsey’s Corporate Performance Analytics database (CPAT, a McKinsey solution). This includes data from financial reporting of public companies, aggregated to create an economy-wide view of financial metrics. We used a sample consisting of non-financial institutions in the S&P 500. Total equity returns for the United States were decomposed on an annual basis using the tree framework discussed in Exhibit 3. We calculated elements in the tree using data from CPAT, or using data from external sources for economic indicators. For our analysis of equity returns we used aggregate values, rather than values per share. This removed the impact of any buybacks on price per share. The following is a brief description of the methodology to calculate each driver:
� We calculated nominal equity returns, market capitalization, revenue growth, and net income growth on an annual basis using aggregated company data from their financial reporting, as captured in the CPAT database. Cash yield for each year was also calculated from company reporting captured in the CPAT data, using data on dividends, share issuances, and share repurchases. Average values over the 50- or 30-year period were then calculated based on a geometric mean of annual data.
� Inflation was calculated based on data from the DMS database for each country. Inflation in this database is based on the consumer price index (CPI) for each country, though the database uses the wholesale price index for a few time periods and countries when CPI data is not available. This measure of inflation was used because a long-run time series across regions was available from the DMS database, while serving as a good representation of the basket of goods purchased by a typical consumer. Real returns are calculated using the formula: (1 + real returns) = (1 + nominal returns) ÷ (1 + inflation). For ease of communication, inflation numbers are usually quoted in the text and in exhibits as the mathematical difference between nominal and real returns, i.e., nominal returns minus real returns.
� Price-to-earnings ratio was calculated using data on end-of-year market capitalization and earnings over the year from the CPAT database. Change in the PE ratio for each year was calculated based on the change from the prior year’s values. We used the geometric mean of annual values to calculate the average change over the 50- or 30-year period.
� Margin change was calculated based on the difference between revenue growth over the 30- or 50-year periods and net income growth over the same period. Both revenue and net income data are from company financial reports as described above.
74 Jutta Bolt and Jan Luiten van Zanden, The first update of the Maddison Project: Re-estimating growth before1820, Maddison Project working paper number 4, University of Groningen, January 2013.

41McKinsey Global Institute Diminishing returns: Why investors may need to lower their expectations
� Dilutive effect of acquisitions was calculated based on the difference between the market capitalization appreciation over the period, and the change in the PE ratio and net income growth over the period.
� Real GDP growth was calculated based on data on a weighted average between US and non-US GDP growth. We assume that US companies earn a share of their profits from overseas and are therefore affected by both US and non-US GDP growth. This is based on an analysis of the share of receipts less payments from the rest of the world to total corporate profits before tax, based on data from the Bureau of Economic Analysis. We used a sample consisting of G-19 countries (G-20 minus the Eurozone) and Nigeria as a proxy for global GDP.75 We created a weighted average GDP using the historical ratio of domestic and foreign corporate profits.
� Additional revenue on top of GDP growth was calculated based on the difference between revenue growth and nominal GDP growth (calculated based on the above real GDP growth and inflation).
� Payout ratio was calculated in two steps. First, we calculated an annual payout ratio based on each year’s cash yield and earnings yield. The earnings yield for each year is the net income for the year divided by market capitalization at the start of the year, or the inverse of the forward PE ratio. Then we calculated an average payout ratio over the 30- or 50-year periodsbased on a simple average of each year’s values over the period. Average earnings yield over the period was calculated as the average cash yield divided by the average payout ratio. In Exhibit 3, we have referred to this approach to construct an average earnings yield over a period by using the earnings yield in each year in the period as “f.” The earnings yield is the inverse of the annual forward PE ratio.
� Marginal return on equity was calculated as nominal net income growth divided by 1 minus the payout ratio. The return on equity in each year can be calculated as a function of the margin, capital productivity and a leverage effect (measured as the ratio of debt to the sum of debt and the book value of equity).
To decompose historical bond returns, we used data on nominal yields and inflation. We assumed a bond index value of 100 at the start of the period. At the end of each year, we calculated the return to the bondholder in two steps. First, we calculated the nominal yield due to the bondholder over the course of that year as the product of the bond value at the start of the year and the nominal yield on the bond at the time of purchase. Second, we calculated the new bond price at the end of the year, based on prevailing nominal yields at the end of the year. The difference between the bond value at the start and the end of the year gave us the impact from capital gains or losses (from changes in nominal yields) on bond returns. The return to the bond holder is the sum of the yield and the capital gain or loss.
To calculate returns over the following years, we assumed the sum of the new bond value at the end of the year and the yield were reinvested for the next year at prevailing yields. To calculate the impact over the course of the 30- or 50-year period, we used a geometric mean of annual values of returns. Lastly, to convert the nominal returns to real returns, we used average inflation over the entire period.
75 This sample makes up about 80 percent of global GDP and is therefore a good proxy for global GDP. For more details, see Global growth: Can productivity save the day in an aging world? McKinsey Global Institute, January 2015.

42 McKinsey Global Institute Diminishing returns: Why investors may need to lower their expectations
In the report we focused on 30-year returns for equities and fixed-income investments, but we also referenced 50-year returns for purposes of comparison. Exhibits A1 and A2 show the decomposed returns for the 50-year period from 1965 to 2014 for fixed-income and equity returns, respectively.
Exhibit A1
Drivers of fixed-income returns in the past 50 years
SOURCE: McKinsey Global Institute analysis
NOTE: Based on three-year average index at start and end years. Numbers may not sum due to rounding.
Contribution to fixed-income returns in the United States, 1965–2014, annualized%
Total real returns on 10-year US Treasury bonds2.5
Nominal returns
6.7
Ex-post inflation
4.3
Nominal capital gains (due to declining yields)0.2
Nominal yields
6.5
+–
Variables linked to economic conditions
Diminishing returns (investor implications)Appendixmc 0427

43McKinsey Global Institute Diminishing returns: Why investors may need to lower their expectations
Exhibit A2
Drivers of equity returns in the past 50 years
Contribution to equity returns in the United States, 1965–2014, annualized%
Total real returns on US equities
5.6
Nominal returns
9.9
Ex-post inflation
4.3
NOTE: The letter “f” denotes “function.” For more details, see Technical appendix. Numbers may not sum due to rounding.1 Calculated as the product of payout ratio and earnings yield.2 Acquisitions paid for by shares rather than cash. 3 Includes cross terms.4 Calculated as 1 – (nominal net income growth ÷ marginal return on equity).5 Based on weighted average US + non-US GDP growth. See Technical appendix for more details.6 Refers to 3-year average at start of period and 3-year average at end of period.7 Average capital productivity over the past 30 years.8 50-year average of total debt divided by the sum of total debt and the book value of equity.
SOURCE: McKinsey Corporate Performance Analytics; McKinsey Global Institute analysis
Nominal market capitalization appreciation
6.1
Marginal return on equity
16.8Cash yield, including dividends and net repurchases1
3.9
Dilutive effect of acquisitions paid by equities2
-1.6
Payout ratio, including dividends and net repurchases4
57.0
Earnings yield
6.8
PE ratio
15.4 to 14.86
Ex-post inflation
4.3
Real US and non-US GDP growth5
3.0
Additional revenue on top of GDP growth3
0.8
Margin change3
-0.7
Margin
7.3 to 10.16
Capital productivity
1.47
Leverage
0.48
Real cost of equity
7.0
Expectations of real net income growth3.1
Expectations of average return on equity13.7
Expectations of inflation
4.3
+
f
f
f
f
×
+
+
–
Variables linked to
Economic conditions
Investor expectations
Business conditions
Change in PE ratio
0.3
Nominal net income growth3
7.3

44 McKinsey Global Institute Diminishing returns: Why investors may need to lower their expectations
3. CONSTRUCTING SCENARIOS FOR FUTURE RETURNSWe project two scenarios for future returns in the United States and Western Europe. The first is a “slow-growth” scenario, which assumes that GDP growth is muted. Demographic changes result in slow employment growth, and productivity growth remains on a par with the past 50 years. As a consequence, GDP growth falls below the average of the past 50 years. Interest rates rise, but only slowly, and inflation remains low, below the 2 percent target of the Federal Reserve, for example.76 Competitive pressures result in declining margins.
In a second “growth-recovery” scenario, GDP growth picks up as the result of a productivity surge. Inflation rises rapidly, as do interest rates. In this scenario, companies are able to innovate and adapt to maintain their profit margins at today’s levels.
Here, we briefly describe the key assumptions used in each scenario.
� Employment growth. We assumed employment growth would be the same in both scenarios. Our estimates on employment were based on prior MGI work, which projected future employment growth based on population projections from the UN Population Division and historical labor-force participation and employment rates. These projections were made for four cohorts: youth aged 15 to 24, females aged 25 to 64, males aged 25 to 64, and older population aged 65 and above.77 For our analysis for US companies, we used employment projections for the United States, and, separately, projections for the remaining 18 G-20 countries (excluding the Eurozone) and Nigeria. Similarly, for our projections for Western European countries, we used employment projections for four Western European countries—France, Germany, Italy, and the United Kingdom, or EU-4—and the remaining G-19 countries and Nigeria.78
� Productivity growth. We define productivity as output per employee. For our slow-growth scenario, we assumed that productivity growth would remain on a par with long-term historical averages between 1965 and 2014. We estimated historical productivity using historical GDP divided by employment for each country. We obtained historical GDP and employment data from the Total Economy Database of the Conference Board. For the growth-recovery scenario, we assumed that productivity growth would rise and fully offset the impact of changing demographic trends, such that GDP growth would be on a par with that in the past 50 years. As with employment, we calculated productivity growth for the United States and the rest of the world separately for the scenarios for the United States, and for the EU-4 countries and the rest of the world separately for the scenarios for Western Europe.
� GDP growth. We calculated GDP growth in both scenarios as the sum of productivity and employment growth (the impact of cross terms was small and ignored here). For our analysis of US companies in each scenario, we estimated GDP growth in the United States and outside the United States. As a triangulation, we also compared our GDP growth projections for the United States and the rest of the world with consensus forecasts available from other agencies such as the International Monetary Fund, the Economist Intelligence Unit, and IHS Global Insight. In general, we found that our scenarios represented the upper and lower bounds of such forecasts. To calculate revenue growth for US companies, we used a weighted average of GDP for the United States and the rest of the world, based on the share of corporate profits from domestic
76 This target refers to personal consumption expenditure inflation. As discussed above, we have calculated inflation based on the consumer price index, which is typically about 0.4 percentage point above PCE inflation.
77 For more details, see Global growth: Can productivity save the day in an aging world? McKinsey Global Institute, January 2015.
78 The G-19 countries and Nigeria collectively make up about 80 percent of global GDP. The EU-4 countries collectively make up about 70 percent of the GDP of the EU-15 countries and Switzerland.

45McKinsey Global Institute Diminishing returns: Why investors may need to lower their expectations
and foreign sources today and adjusting this share going forward based on relative GDP growth. A similar approach was followed for Western European countries, to calculate GDP growth for the EU-4 countries collectively, and for the rest of the world, and to estimate revenue growth as a weighted average of the two based on share of corporate profits. We assume that GDP growth transitions from today’s values to the above ending values over an adjustment period of ten to 20 years.
� Inflation. Our inflation measure was based on the consumer price index. For our slow-growth scenario in the United States, we used an inflation path projection based on Treasury inflation-protected securities (TIPS), which are indexed to inflation. We obtained data for five-, ten-, and 20-year maturity TIPS and used that to create an annual inflation projection for the next 20 years, assuming a smooth increase of annual inflation. In this scenario, inflation increases from 1.3 percent in 2016 to 1.8 percent over the next 20 years, averaging 1.6 percent over the entire period. For our growth-recovery scenario, we used the March 2016 economic projections of the Federal Reserve Board members and the Federal Reserve Bank presidents. This provides an expectation for personal consumption expenditure (PCE) inflation out to 2018, as well as a longer run inflation projection. We converted the PCE inflation to the consumer price index using historical spreads between the two (typically 0.4 percent points). In this scenario, inflation increases from 1.6 percent in 2016 to 2.4 percent in 2018 and remains at that level through 2035. We also triangulated the inflation path in these two scenarios with estimates from the Philadelphia Federal Reserve’s survey of professional forecasters from the first quarter of 2016, which estimated that inflation would average from 1.6 to 3.1 percent over the next ten years, with a median forecast of 2.1 percent. For inflation projections for Western Europe, we used consensus projections for individual countries (for fixed-income returns) and the European Union as a whole (for equity returns) based on the International Monetary Fund, triangulated based on projections from the Economist Intelligence Unit and and the OECD. These projections for the most part projected a rapid increase of inflation to 1.5 to 2 percent by 2020 (specific inflation values varied by country), and we assumed such a trajectory would hold for the growth-recovery scenario. For the slow-growth scenario, we assumed that the consumer price index would eventually reach the values estimated by consensus projections but over a longer adjustment period of ten years.
� Ten-year nominal interest rates. For both scenarios, we first calculated inflation as described above. We then added a real yield to this inflation path based on historical data. The historical real yield is defined as the difference between the nominal yield at the end of a year and the inflation that year. For the slow-growth scenario, we used the range of real yield roughly over the preceding ten years and the preceding 15 years to provide a range for the nominal interest rate (exact time frames varied slightly for each country, based on specific trends of the historical real yield in the country). For the growth-recovery scenario, we used the range of real yield over the past 30 or so years and the median between approximately 1990 and 2005 to provide a range (here too, the specific time frames varied slightly for each region, based on specific trends in the country region). The resulting values for nominal yields were triangulated across consensus projections to arrive at the final ranges used in each scenario for nominal interest rates. In the United States, we used the Philadelphia Federal Reserve’s survey of professional forecasters from the first quarter of 2016, in which estimates of average nominal US ten-year Treasury yields over the next ten years ranged from 2 percent to 4.8 percent, with a median value of 3.4 percent. In Western Europe, we compared our results against consensus projections from the Economist Intelligence Unit, International Monetary Fund, and the OECD.

46 McKinsey Global Institute Diminishing returns: Why investors may need to lower their expectations
� Corporate profitability. For the slow-growth scenario, we assumed that profit margins (measured as net operating profit less adjusted taxes, or NOPLAT) decline due to a set of disruptions. These include pressure from emerging-market firms; technology disruptions brought about by growing use of digital platforms; higher productivity-adjusted labor costs; and higher effective tax rates.79 We assumed that margins would transition from today’s levels to their final values over an adjustment period of ten to 20 years, for both NOPLAT and EBITA. For the growth-recovery scenario, we assumed that margins would remain close to levels they have been in the recent past, based on a 2012 to 2014 average. To range NOPLAT margins in both scenarios, we varied the degree of disruption due to the effective tax rate.
� Other variables and assumptions. To project equity returns, we also needed to consider the path of a few other variables. We assumed that the real cost of equity remains constant at 7 percent, in line with historical trends.80 We assumed that 2012 to 2014 averages of debt-to-EBITA (earnings before interest, taxes, and amortization) continue going forward at 2.3 for the United States. We assumed in both scenarios that cash-to-EBITA would decline from today’s values of 1.0 (based on a 2012 to 2014 average) to 0.5, in line with longer-term historical averages, over an adjustment period of ten to 20 years. We assumed the same path for starting values and path forward for debt-to-EBITA and cash-to-EBITA ratios in Western Europe. We assumed that capital productivity remains constant at today’s values. Lastly, we assumed that revenue grows in line with GDP, and there is no additional revenue growth over and above GDP growth.
To project returns in each scenario, we used the same framework used to decompose historical equity and fixed-income returns described above.
For equity returns, in addition to the scenario variables describe above, we estimated the path of PE ratios. We did this using the equation below:
where
� P/E = PE ratio
� g = nominal earnings growth
� ROE = return on equity
� ke = nominal cost of equity
79 For a detailed discussion of these disruptions and the impact on margins, see Playing to win: The new global competition for corporate profits, McKinsey Global Institute, September 2015.
80 For more details, see the “Estimating the cost of capital,” in Tim Koller, Marc Goedhart, and David Wessels, Valuation: Measuring and managing the value of companies, sixth edition, Wiley and Sons, 2015.
Exhibit A5
EquationPE
=
gROE
1 −
ke − g

47McKinsey Global Institute Diminishing returns: Why investors may need to lower their expectations
We calculated the PE ratio in year 20 and assumed a smooth linear transition in between today’s values to the 20-year ending value. To calculate return on equity, we first calculated the path of cash, debt, and invested capital. Equity was calculated as cash plus invested capital minus debt, and return on equity was calculated as earnings divided by equity. We calculated cash and debt in each year based on ratios of cash-to-EBITA and debt-to-EBITA and projections on EBITA. Invested capital was calculated based on earnings and the return on invested capital (ROIC). ROIC is the product of NOPLAT margin and capital productivity. We also ran a sensitivity analysis to identify which variables most influenced the returns. Returns were found to be especially sensitive to assumptions on NOPLAT margins. This was therefore the key variable chosen to range returns in the slow-growth and recovery scenarios. In addition, the adjustment period over which economic and business conditions change is difficult to predict, and we therefore chose that as a second variable to range within each scenario, varying from ten to 20 years.
Exhibits A3 and A4 show a detailed comparison between the returns in each of the two scenarios going forward and the historical returns over the past 30 years.
Exhibit A3
Nominal yields account for most of the difference in bond returns between the two scenarios for the United States
Contribution to fixed-income returns in the United States, 2016–35, annualized%
Historical 30-year returns,
1985–2014
Slow-growth
scenario
Growth-recovery scenario
Total real returns on 10-year US Treasury bonds
5.0 0 to 1.0 1.0 to 2.0
Nominal returns 7.9 2.0 to 2.5 3.5 to 4.0
Nominal capital gains (due to declining yields)
2.0 -0.5 to 0 -1.5 to -1.0
Nominal yields 5.9 2.0 to 3.0 4.5 to 6.0
Inflation 2.9 1.6 2.4
SOURCE: McKinsey Global Institute analysis
NOTE: Numbers may not sum due to rounding.

48 McKinsey Global Institute Diminishing returns: Why investors may need to lower their expectations
Exhibit A4
PE ratios and margins account for most of the difference in equity returns between the two scenarios for the United States
SOURCE: McKinsey Corporate Performance Analytics; McKinsey Global Institute analysis
1 Acquisitions paid for by shares rather than cash.2 Includes cross terms.3 Based on weighted average US + non-US GDP growth.4 Calculated as the product of payout ratio and earnings yield.5 Calculated as 1 – (nominal net income growth ÷ marginal return on equity).NOTE: Numbers may not sum due to rounding.
Contribution to equity returns in the United States, 2016–35, annualized%
Historical 30-year returns,
1985–2014
Slow-growth
scenario
Growth-recovery scenario
Total real returns on US equities 8.9 4.0 to 5.0 5.5 to 6.5
Nominal returns 11.8 6.0 to 6.5 8.0 to 9.0
Nominal market capitalization appreciation 7.8 1.5 to 2.0 4.0 to 5
Dilutive effect of acquisitions paid by equities1 -1.8 - -
Change in price earnings ratio 2.9 ~ -1.0 -0.5 to 0
Nominal net income growth2 6.8 2.5 to 3.0 4.5 to 5.0
Inflation 2.9 1.6 2.4
Real US + non-US GDP growth3 2.7 ~2.0 2.5 to 3.0
Additional revenue on top of GDP growth2 0.8 - -
Margin change2 0.4 ~ -1.0 -0.5 to 0
Cash yield, including dividends and net repurchases4 4.0 ~4.5 ~4.0
Payout ratio, Including dividends and net repurchases5 67 ~80 70 to 75
Marginal return on equity 20.4 10 to 15 15 to 20
Earnings yield 5.9 ~5.5 5.0 to 5.5
Inflation 2.9 1.6 2.4

RELATED MGIAND MCKINSEY RESEARCH
Playing to win: The new global competition for corporate profits (September 2015) A 30-year period of unprecedented corporate-profit growth could be drawing to a close. Competition is intensifying as emerging-market companies go global and technology and technology-enabled firms make rapid moves into new sectors.
Debt and (not much) deleveraging (February 2015) Global debt has grown by $57 trillion and no major economy has decreased its debt-to-GDP ratio since 2007. High government debt in advanced economies, mounting household debt, and the rapid rise of China’s debt are areas of potential concern.
Global growth: Can productivity save the day in an aging world? (January 2015) Without action, global economic growth will almost halve in the next 50 years. This MGI report offers a solution: a dramatic improvement in productivity.
QE and ultra-low interest rates: Distributional effects and risks (November 2013) Ultra-low interest rates, in part as a result of central-bank policies since 2007, have had a very different distributional impact on governments, corporations, financial institutions, and households.
The emerging equity gap: Growth and stability in the new investor landscape (December 2011) This report looks at the decisive action that can help eliminate an emerging “equity gap” to ensure that equity markets continue to provide capital for growth and the returns that investors need to meet their goals.
Farewell to cheap capital? The implications of long-term shifts in global investment and saving (December 2010) In the year 2020, half of the world’s saving and investment will take place in emerging markets, and there will be a substantial gap between global investment demand and the world’s likely saving. This will put upward pressure on real interest rates and require adjustment by all parties.
www.mckinsey.com/mgi
E-book versions of selected MGI reports are available at MGI’s website, Amazon’s Kindle bookstore, and Apple’s iBooks Store.
Download and listen to MGI podcasts on iTunes or at www.mckinsey.com/mgi/publications/multimedia/
Cover image: © Getty Images.

McKinsey Global InstituteMay 2016Copyright © McKinsey & Company www.mckinsey.com/mgi
@McKinsey_MGI McKinseyGlobalInstitute