differential retention and utilization of dissolved organic carbon by bacteria in river sediments
TRANSCRIPT
Differential Retention and Utilization of Dissolved Organic Carbon by Bacteria in RiverSedimentsAuthor(s): Helmut Fischer, Anke Sachse, Christian E. W. Steinberg and Martin PuschSource: Limnology and Oceanography, Vol. 47, No. 6 (Nov., 2002), pp. 1702-1711Published by: American Society of Limnology and OceanographyStable URL: http://www.jstor.org/stable/3096543 .
Accessed: 14/06/2014 00:34
Your use of the JSTOR archive indicates your acceptance of the Terms & Conditions of Use, available at .http://www.jstor.org/page/info/about/policies/terms.jsp
.JSTOR is a not-for-profit service that helps scholars, researchers, and students discover, use, and build upon a wide range ofcontent in a trusted digital archive. We use information technology and tools to increase productivity and facilitate new formsof scholarship. For more information about JSTOR, please contact [email protected].
.
American Society of Limnology and Oceanography is collaborating with JSTOR to digitize, preserve andextend access to Limnology and Oceanography.
http://www.jstor.org
This content downloaded from 185.2.32.110 on Sat, 14 Jun 2014 00:34:19 AMAll use subject to JSTOR Terms and Conditions

Limnol. Oceanogr., 47(6), 2002, 1702-1711 ? 2002, by the American Society of Limnology and Oceanography, Inc.
Differential retention and utilization of dissolved organic carbon by bacteria in river sediments
Helmut Fischer, Anke Sachse, Christian E. W. Steinberg, and Martin Pusch Leibniz-Institute of Freshwater Ecology and Inland Fisheries, Miiggelseedamm 310, 12587 Berlin, Germany
Abstract
The differential ability of natural sediment biofilms to store and metabolize specific dissolved organic carbon (DOC) fractions was studied with a set of perfusion experiments that combined a chromatographic method for the analysis of several DOC fractions with the measurement of bacterial abundance and activity. High proportions of low-molecular-weight substances and polysaccharides and low but significant proportions of humic substances were retained in sediment cores after perfusion. Bacterial abundance and production in these cores were high (1.7-3.0 x 10⁹ cells cm-3 and 0.7-12.0 ,ig C cm-3 h-1, respectively). Bacterial abundance, production, and turnover times were correlated with the retention of various DOC fractions, especially polysaccharides, indicating a differential microbial utilization of DOC. Temperature as well as the quantity and quality of retained organic matter were the major factors that influenced bacterial production. However, particulate organic carbon represented the main energy source for sediment bacteria. It is concluded that certain fractions of DOC may be readily utilized for bacterial growth, irrespective of molecular size. Instead, the presence and abundance of specific chemical groups might be decisive. Hence, the processing of organic substrates by the microbial biofilm may largely influence the biogeo- chemistry of DOC in river waters.
Dissolved organic carbon (DOC), whatever its form or origin, either directly or indirectly represents the ultimate source of organic carbon for sustaining the metabolism of heterotrophic bacteria. Processes such as extracellular de- composition of organic macromolecules and selective con- sumption of specific DOC fractions enable bacteria to exert a considerable influence on quantity and quality of DOC in natural waters (e.g., Fiebig and Marxsen 1992; Findlay et al. 1993; Volk et al. 1997). On the other hand, the metabolic activity of bacteria can be affected by the ambient concen- tration and composition of DOC (e.g., Kaplan and Bott 1989; Amon and Benner 1996; Baker et al. 1999). Thus, in a number of ways, bacteria may exert an influence on the carbon biogeochemistry of aquatic ecosystems.
In running waters, sediments are the major site of bacterial metabolism (Fischer and Pusch 2001). Their large internal surface area promotes colonization of these sediments by bacterial biofilms (Lock 1993; Brunke and Fischer 1999; Fi- scher 2002). These biofilms are supplied with nutrients and oxygen by flowing interstitial water, which originates either from the overlying water column being forced into the sed- iment interstices by physical processes or from groundwater exfiltration (Brunke and Gonser 1997; Pusch et al. 1998). The hyporheic biofilms retain inorganic and organic solutes (e.g., Fischer 2002), and thus they can buffer the supply of organic substrates so that short-term changes in the quality and quantity of DOC need not have an immediate effect on biofilm metabolism (Freeman and Lock 1995; Fiebig 1997).
1 Corresponding author ([email protected]).
Acknowledgments We thank Douglas W. Fiebig and Matthias Brunke for discussions
and a critical review of the manuscript. We also appreciate the help- ful comments and suggestions of three anonymous reviewers. Tech- nical assistance in the field was provided by Jorg Siefert. This work was supported by the Deutsche Forschungsgemeinschaft grant PU 136/2.
Unraveling the functioning of the DOC metabolism in the biofilm is difficult because of the methodological problems encountered in measuring microbial activity and in the chemical fractionation of DOC. One particular problem is the difficulty in relating microbial activity to concomitant bacterial DOC utilization. Some recent studies stressed that there are differences in the availability of DOC originating from various sources for bacterial growth or respiration (Bat- tin et al. 1999; Wiegner and Seitzinger 2001). However, it has so far been problematic to make an instantaneous dis- tinction between DOC fractions that may support significant growth of heterotrophic bacteria and the more refractory DOC fractions that do not. Amon and Benner (1996) hy- pothesized that DOC availability was largely indicated by molecule size, with the larger molecules being more rapidly turned over.
Bacterial production in hyporheic sediments has so far been measured in only very few studies (Findlay and Sob- czak 2000). Bacterial productivity in sediments is assumed to be at least a partial function of the amount of sediment organic matter. Whereas a correlation between particulate or- ganic matter and bacterial production has been revealed for river sediments (Brunke and Fischer 1999; Findlay and Sob- czak 2000; Fischer et al. 2002), a causal relationship be- tween DOC retention and bacterial production in situ still remains an open question.
In order to reveal relationships between the occurrence and retention of various fractions of DOC in sediments of a lowland river, and concomitant bacterial growth, we char- acterized DOC in interstitial water and at the same time es- timated bacterial abundance and production in the sediments through which this water flowed. We performed these mea- surements using the natural bacterial community on their indigenous substrate. Thus, we could address the following questions. (1) Does the passage of interstitial water through sediments and the concomitant bacterial activity within these sediments substantially change the quality of DOC? If so,
1702
This content downloaded from 185.2.32.110 on Sat, 14 Jun 2014 00:34:19 AMAll use subject to JSTOR Terms and Conditions
Bacterial production and DOC retention
60
^ 50
4 40
30 % 30
I 20
0
25
20
a 15 I--
10 O )
5 4 B o o
0 M A t Nov
Feb Mar Apr May Jun Jul Aug Sep Oct Nov
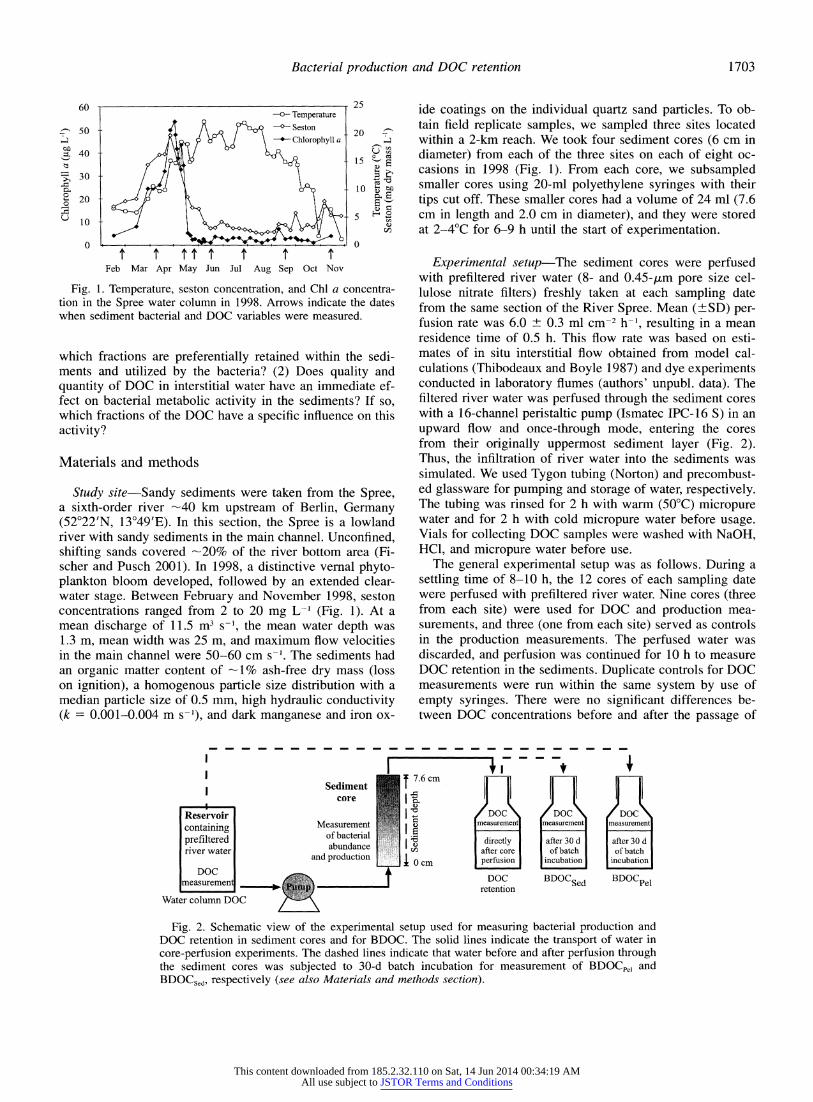
Fig. 1. Temperature, seston concentration, and Chl a concentra- tion in the Spree water column in 1998. Arrows indicate the dates when sediment bacterial and DOC variables were measured.
which fractions are preferentially retained within the sedi- ments and utilized by the bacteria? (2) Does quality and quantity of DOC in interstitial water have an immediate ef- fect on bacterial metabolic activity in the sediments? If so, which fractions of the DOC have a specific influence on this activity?
Materials and methods
Study site-Sandy sediments were taken from the Spree, a sixth-order river -40 km upstream of Berlin, Germany (52?22'N, 13?49'E). In this section, the Spree is a lowland river with sandy sediments in the main channel. Unconfined, shifting sands covered -20% of the river bottom area (Fi- scher and Pusch 2001). In 1998, a distinctive vernal phyto- plankton bloom developed, followed by an extended clear- water stage. Between February and November 1998, seston concentrations ranged from 2 to 20 mg L-1 (Fig. 1). At a mean discharge of 11.5 m3 s-1, the mean water depth was 1.3 m, mean width was 25 m, and maximum flow velocities in the main channel were 50-60 cm s-'. The sediments had an organic matter content of -1% ash-free dry mass (loss on ignition), a homogenous particle size distribution with a median particle size of 0.5 mm, high hydraulic conductivity (k = 0.001-0.004 m s-'), and dark manganese and iron ox-
Sediment core
Reservoir containing prefiltered river water
DOC measurement D O
Water column DOC
Measurement of bacterial abundance
and production
ide coatings on the individual quartz sand particles. To ob- tain field replicate samples, we sampled three sites located within a 2-km reach. We took four sediment cores (6 cm in diameter) from each of the three sites on each of eight oc- casions in 1998 (Fig. 1). From each core, we subsampled smaller cores using 20-ml polyethylene syringes with their tips cut off. These smaller cores had a volume of 24 ml (7.6 cm in length and 2.0 cm in diameter), and they were stored at 2-4?C for 6-9 h until the start of experimentation.
Experimental setup-The sediment cores were perfused with prefiltered river water (8- and 0.45-p/m pore size cel- lulose nitrate filters) freshly taken at each sampling date from the same section of the River Spree. Mean (+SD) per- fusion rate was 6.0 ? 0.3 ml cm-2 h-~, resulting in a mean residence time of 0.5 h. This flow rate was based on esti- mates of in situ interstitial flow obtained from model cal- culations (Thibodeaux and Boyle 1987) and dye experiments conducted in laboratory flumes (authors' unpubl. data). The filtered river water was perfused through the sediment cores with a 16-channel peristaltic pump (Ismatec IPC-16 S) in an upward flow and once-through mode, entering the cores from their originally uppermost sediment layer (Fig. 2). Thus, the infiltration of river water into the sediments was simulated. We used Tygon tubing (Norton) and precombust- ed glassware for pumping and storage of water, respectively. The tubing was rinsed for 2 h with warm (50?C) micropure water and for 2 h with cold micropure water before usage. Vials for collecting DOC samples were washed with NaOH, HC1, and micropure water before use.
The general experimental setup was as follows. During a settling time of 8-10 h, the 12 cores of each sampling date were perfused with prefiltered river water. Nine cores (three from each site) were used for DOC and production mea- surements, and three (one from each site) served as controls in the production measurements. The perfused water was discarded, and perfusion was continued for 10 h to measure DOC retention in the sediments. Duplicate controls for DOC measurements were run within the same system by use of empty syringes. There were no significant differences be- tween DOC concentrations before and after the passage of
DC reter
In F-
)C\ DOC\ DOC rement measurement measurement
ctly after 30 d after 30 d core of batch of batch ision incubation incubation
:C BDOCSed BDOCpe ition
Fig. 2. Schematic view of the experimental setup used for measuring bacterial production and DOC retention in sediment cores and for BDOC. The solid lines indicate the transport of water in core-perfusion experiments. The dashed lines indicate that water before and after perfusion through the sediment cores was subjected to 30-d batch incubation for measurement of BDOCpe, and BDOCsed, respectively (see also Materials and methods section).
1703
I
I I
This content downloaded from 185.2.32.110 on Sat, 14 Jun 2014 00:34:19 AMAll use subject to JSTOR Terms and Conditions

Fischer et al.
river water through the tubing and the empty syringes (paired t-test, p = 0.55, n = 11). Subsequently, bacterial production was measured for 12 h as described below. All incubations were made at in situ temperatures ranging 7- 22?C (+1?C), except on 26 May 1998. On that date, the incubation temperature was 18?C, which was 3?C higher than the in situ temperature but was the same temperature as in the previous and following measurements. Thus, bac- terial activities during the algal bloom and the clear-water stage could be compared under the same thermal conditions.
DOC analysis-DOC in the river water before and after perfusion through the sediment cores was quantified and characterized by liquid chromatography followed by organic carbon detection (LC-OCD; Huber and Frimmel 1994; Hesse and Frimmel 1999; Sachse et al. 2001). This method com- bines size-exclusion chromatography via stainless steel col- umns (250 X 20 mm) packed with TSK HW-50S resin (Toy- opearl), ultraviolet (UV) detection of the spectral absorption coefficient at a wavelength of 254 nm, and infrared (IR) detection of the eluting carbon fractions after UV oxidation of DOC at wavelength of 185 nm in a cylindrical UV thin- film reactor (Granzel; Huber and Frimmel 1991). Phosphate buffer (0.029 mol L-1, pH 6.5) was used as the mobile phase. The flow rate was 1 ml min-', and the sample injection vol- ume was 2 ml.
Polysaccharides (PS), humic substances (HS), low-molec- ular-weight acids (LMWA), and two groups of low-molec- ular-weight substances (LWS, representing amino acids, mono- and disaccharides) were fractionated, oxidized, and subsequently quantified by IR detection. The fraction of PS shows no absorption in the UV range. HS include humic and fulvic polyelectrolytic acids that are UV active because of aromatic groups. LMWA are defined as low-molecular- weight carboxylic acids such as several metabolites in bio- logical and chemical processes. Fractions were identified by use of standards (humic and fulvic acid standards from the IHSS) and simple compounds of different origin, and by characterizing the biological availability of each fraction (Sachse et al. 2001). For molecular-weight calibration, sac- charides (raffinose, maltose, glucose, glycerin, and methanol from Merck) and polydextranes (Mp = 830, 4,400, 9,900, 21,400, and 43,500 g mol-1 from Polymer Standards Ser- vice) were used. The calibration curve was obtained by plot- ting the retention times of the standards against the logarithm of their molecular weights by use of the program "Geltreat" (I. Perminova unpubl. data). Molecular weights of HS in the water samples were calculated by comparing their retention times with the calibration curve. Total DOC was quantified by IR detection after UV oxidation, bypassing the chro- matographic unit.
DOC retention and biodegradable DOC (BDOC)-We defined DOC retention in sediments and BDOC as indicators of bacterial DOC utilization in sediments and the water col- umn. These variables were calculated from differences in DOC between the river water and the perfused and/or in- cubated water (Fig. 2). (1) DOC retention in sediment cores was calculated from changes in DOC concentrations before and after perfusion through sediment cores. This fraction
corresponds to BDOC sensu Kaplan and Newbold (1995). (2) BDOCsed was defined as the amount of DOC consumed during core perfusion and subsequent 30 d of batch incu- bation of the perfused water. (3) BDOCp,, was defined as the amount of DOC consumed after 30 d of batch incubation of river water (BDOC sensu Servais et al. 1989). Batch incu- bations for the measurements of BDOCpe, and BDOCSed were made with 150-ml samples in precombusted glass flasks. Samples were inoculated with 1.5 ml of prefiltered (2-/um pore size) river water and incubated for 30 d at 20?C in the dark. After the incubation, concentration and composition of DOC were measured (Servais et al. 1989) (see Fig. 2).
Bacterial abundance and production-Bacterial produc- tion in the perfused sediment cores was estimated from leu- cine incorporation rates into bacterial protein (Kirchman 1993). After sampling for DOC measurements, we added L- [U-'4C]leucine (Amersham; specific activity 11.3 GBq mmol-1) and unlabeled L-leucine to the perfusion water in order to achieve a final concentration of 50 ,uM and a final specific activity of 7 Bq nmol-1. The cores were perfused with leucine for 12 h and then fixed by a 4-h perfusion of 5% formaldehyde in prefiltered river water. Leucine uptake in the perfusion water can be neglected in this setup. Only a small amount of pore water was later sampled with the sediments, and biomass and production of bacteria in the sediments exceed those in the river water by factors of 500- 1,000 per volume, respectively (Fischer and Pusch 2001). Three control cores-one from each site-were perfused with a mixture of L-[U-'4C]leucine, unlabeled L-leucine, and 5% formaldehyde. The number of controls was later reduced, because activity in controls was low (always <8% of the activity in living sediments). The leucine-incorporation method had previously been tested in a similar experimental setup for linearity of uptake over long time intervals (36 h), for isotope dilution, and for substrate saturation (Marxsen 1996; Fischer and Pusch 1999).
On the next day, the sediment was carefully removed from the cores and divided into depth layers of 0-1.9, 1.9-3.8, 3.9-5.7, and 5.7-7.6 cm. These layers are referred to in the results as 1-, 3-, 5-, and 7-cm depths. The sediment from each layer was mixed, and a 0.5-cm3 aliquot was used to determine bacterial abundance and production, as described elsewhere (Fischer and Pusch 1999, 2001). In brief, subsam- ples used for bacterial cell counts were taken after a 10-min sonication step and diluted with a sterile filtered aqueous solution of 3.5% formaldehyde, 0.85% NaCl, and 1 mM py- rophosphate. Bacteria were stained with the use of 4',6- diamidino-2-phenylindol at a final concentration of 10 mg L-1. After 40 min of dark incubation, bacteria were filtered onto black polycarbonate filters (Nuclepore, pore size 0.2 /um). At least 200 bacteria within at least 10 microscopic fields were directly counted by epifluorescence microscopy.
Protein was extracted from the remaining samples with the use of hot trichloroacetic acid at 5% final concentration. The precipitate was filtered onto 0.2-/Lm pore size polyester filters (Oxyphen). Filters were thoroughly rinsed with deion- ized water and then put into 4-ml scintillation pico-vials, completely dissolved in 0.5-ml solvent (Soluene; Packard Instruments) and mixed with 2.5 ml of scintillation fluid
1704
This content downloaded from 185.2.32.110 on Sat, 14 Jun 2014 00:34:19 AMAll use subject to JSTOR Terms and Conditions

Bacterial production and DOC retention
that characterizes temperature dependence as the bacterial production divided by bacterial cell number.
1 Low-molecular- weight substances
E3 Polysaccharides
El Humic substances
[1 not identified
k 4 40 t A \ 9 i
Fig. 3. Composition of DOC in the Spree water column in 1998.
(Hionic Fluor; Packard). Radioactive decays were measured in a Canberra Packard 1900 scintillation counter. Bacterial carbon production was calculated from leucine incorporation rates under the assumption of 7.3 mol % leucine in total protein and a carbon: protein ratio of 0.86 (Simon and Azam 1989). Isotope dilution was low (1.1-1.3; Fischer and Pusch 1999) and was therefore disregarded in the production esti- mates. Turnover times of bacterial carbon were estimated by dividing bacterial biomass by carbon production assuming a biomass of 22 fg C for a single bacterium (Fischer and Pusch 2001).
Qlo values-The metabolic rates of bacteria generally in- crease with temperature, within certain physiological limits. The magnitude of this increase can be characterized by the ratio of rates measured across a temperature increase of 10?C (Qlo; Lampert 1984). To evaluate the effect of temperature on bacterial production, we calculated (1) the "ecosystem effective Q0o" of bacterial production per unit of sediment volume, which includes the effect of seasonally changing bacterial abundances, and (2) a "community-specific Q0o"
A
44
Se
X OCD
Cl) 'S. '
Data analysis-In total, 69 sediment cores were used for the experiments. These divide into eight sampling dates with three sites each and three replicate cores per site. In February 1998, only two sites were sampled, and bacterial abundance was not determined. We performed calculations and statistics on three levels of data aggregation. (1) Bacterial production, abundance, and turnover times were first estimated for single samples (four depth layers from each core, n = 276 for production, n = 252 for abundance and turnover) to examine their vertical distribution within the sediment cores. (2) Bac- terial variables were then aggregated by adding the results of the different depth layers of each core. This was done to compare bacterial variables with DOC retention and BDOCSed, which were also determined for the entire cores (n = 69). (3) Temperature, DOC before incubation, and BDOCpeI differed only by sampling date. Therefore, these comparisons were made between sampling dates (n = 8), which include measurements from the river water on the respective sampling date as well as data from nine sediment cores each and bacterial data from four depth layers of each core. Data were analyzed with the software SPSS (release 6.0; SPSS) by use of nonparametric tests. Spearman rank correlations were used to reveal the relationships of bacterial data with DOC amount and composition. Kruskal-Wallis tests were performed to test the effects of sediment depth on bacterial abundance and production.
Results
DOC-Total DOC in the studied time period ranged from 5,920 to 7,400 /jg L-1. DOC composition showed a similar pattern throughout the year with HS > PS > LWS (Fig. 3). Despite the low variability in total DOC concentrations, there were marked seasonal changes in the PS and LWS fractions. Among the fractions detectable by chromatogra- phy (Fig. 4A), PS peaked first (mean elution time, 25.6 min)
20 40 60 80 0 20 40 60 Retention time (minutes) Retention time (minutes)
Fig. 4. (A) LC-OCD elution diagram of the DOC composition in the Spree water column, 12 May 1998. Upper line, OCD; lower line, UV detection at 254 nm. (B) LC-OCD elution diagrams of the DOC composition in Spree water, 12 May 1998, before perfusion through river sediments (upper line, 1), after perfusion (central line, 2), and after core perfusion and subsequent 30 d of batch incubation (BDOCSed, lower line, 3).
100%
90%
80%
70%
60%
50%
40%
30%
20%
10%
0%
cv1
1705
This content downloaded from 185.2.32.110 on Sat, 14 Jun 2014 00:34:19 AMAll use subject to JSTOR Terms and Conditions

Fischer et al.
and made up 4.5%-11.5% of the total DOC. PS concentra- tions were highest in May, during the peak algal bloom (854 /Ltg L-l), and lowest in February (269 ,ug L-1). HS were the major DOC fraction, accounting for 59%-68% of the total DOC (mean elution time, 38.2 min). LMWA only occurred at low concentrations (up to 160 jug C L-l in February; mean elution time, 45.5 min) and were not detected during spring or summer. Typically, one or two additional peaks occurred in the river water after mean elution times of 55.1 and 61.9 min, respectively (Fig. 4A). This fraction was not UV active. It is referred to as LWS, is made up of sugars and amino acids (A.S. and I. Perminova unpubl. data), and made up -4.6% of the total DOC (Fig. 3). The concentration of these substances ranged 22-289 ,ug L-~ and was quantified only when distinct peaks occurred. Other DOC eluting after >50 min and not showing any distinct peaks consisted of other low-molecular-weight aliphatic substances, which could not be assigned to a specific DOC fraction. This mixture con- tributed 11.7%-16.7% to total DOC. A proportion of 3.8%- 17.7% of the total DOC was hydrophobic and was therefore not chromatographable. The mean (+SD) spectral absorption coefficient measured at 254 nm was 8.5 + 1.0 m-1 for the humic fraction and close to zero for the other fractions iden- tified, indicating a substantial proportion of aromatic struc- tures in the humic fraction of the DOC only.
Vertical distribution of bacterial abundance and activi- ty-Bacteria were relatively homogenously distributed in space and time within the sandy habitats (Fig. 5A). However, we observed a slight decrease of bacterial abundance with increasing sediment depth (Kruskal-Wallis test, X2 = 14.5, p < 0.01, n = 252). Mean (?SD) abundance was 2.66 + 0.26 X 10⁹ bacteria cm-3 in 1-cm sediment depth and 2.17 + 0.38 X 10⁹ bacteria cm-3 in 7-cm sediment depth.
Bacterial production varied more strongly in space and time than bacterial abundance (Fig. 5B). Mean (+SD) pro- duction ranged from 0.70 + 0.28 $,g C cm-3 h-l in February at 7-cm depth to 12.0 + 2.3 Aug C cm-3 h-1 in July at 1-cm depth. The production was highest in the upper sediment layer and decreased significantly with increasing sediment depth (Kruskal-Wallis test, X2 = 137, p < 0.001, n = 270), so that production at 7-cm sediment depth was always less than one-third of the production measured at 1-cm sediment depth. Production did not differ significantly between the sampling sites (Kruskal-Wallis test, X2 = 0.91, p = 0.63, n = 270).
Turnover times of bacterial carbon were in a range of 3.5- 220 h, which is equivalent to specific growth rates of 6.9- 0.11 d-1. The variation in turnover times of bacterial carbon was primarily driven by bacterial production; therefore, sim- ilar statistical relationships with sediment depth applied. We thus found the shortest turnover times of 4.8 + 0.9 h in the uppermost sediment layer in July at 22?C and the longest turnover times of 76 + 47 h in the lowermost layer in No- vember at 7?C (Fig. 5C). Mean cell-specific bacterial pro- duction was in a range of 0.4-4.4 fg C h-1.
Retention efficiencies for DOC fractions-Retention char- acteristics differed markedly for the various DOC fractions (Figs. 4B, 6). A total mean (+ SD) of 898 + 429 ,ug DOC
n E CO)
a 0 Ce
0
crh
o
4.0
3.0-
2.0-
1.0-
0
CC,
S 0 C-) a
0 0
a 0
14-
12-
10-
8 -
A
Feb Mar Apr May Jun Jul Aug Sep Oct Nov
B Sediment depth
--n-- 1 cm --*-- 3 cm --A- - 5 cm --v-- 7 cm
6
4.
2
0
120.
100.
0 S a) H
Feb Mar Apr May Jun Jul Aug Sep Oct Nov Feb Mar Apr May Jun Jul Aug Sep Oct Nov
C
80.
60.
40.
Temperature > 15 ?C
20-
n
I- i [------- B
Feb Mar Apr May Jun Jul Aug Sep Oct Nov
Fig. 5. (A) Bacterial abundance, (B) production, and (C) turnover times of bacterial carbon (C) in four depth layers of sediments of the River Spree, 1998. Means + SD, n = 9, (n = 6 in February). Symbols from each sampling date have been spread to improve clarity.
L-1 (14% of the input DOC) was retained in the cores. Re- tention was most effective in May during the peak algal bloom, with 1,500 Aug DOC retained per liter of perfused water (20% of the total DOC), when total DOC in the river
? ? ? ? ? ? ?~~I I
U .
.. ..
I
1706
T - I _:- --
.- m '--- \ 8, v
S
This content downloaded from 185.2.32.110 on Sat, 14 Jun 2014 00:34:19 AMAll use subject to JSTOR Terms and Conditions
Bacterial production and DOC retention
5000 A -r Initial DOC
-- -_- E Retained DOC
--r-- -
._r r
2l7 i6 lI 6 1 15 Se 9 27 Feb 6Apr 12 May 26 May 17 Jun 28 Jul 15Sep 9Nov
u :=L
C) ID
E
4000 ?
3000 -
2000 ?
1000
B
- - r r d
0
27Feb 6Apr 12 May 26 May 17Jun 28 Jul 15Sep 9Nov
1000 C
800 - - 1,
? 600 - '~ "L'r
e- - -ir -
a 400 -
CO)
' 200 -
2012 27Feb 6Apr I2May 26May 7Jun 28Ju 1 Sep 9Novi
27 Feb 6Apr 12 May 26 May 17 Jun 28 Jul 15Sep 9Nov
-
24
1r- cn O u
a-
-o C)
en
0 3L
0
I-
300
250
200
150
100
50
0
27Feb 6Apr 12 May 26 May 17Jun 28 Jul 15Sep 9Nov
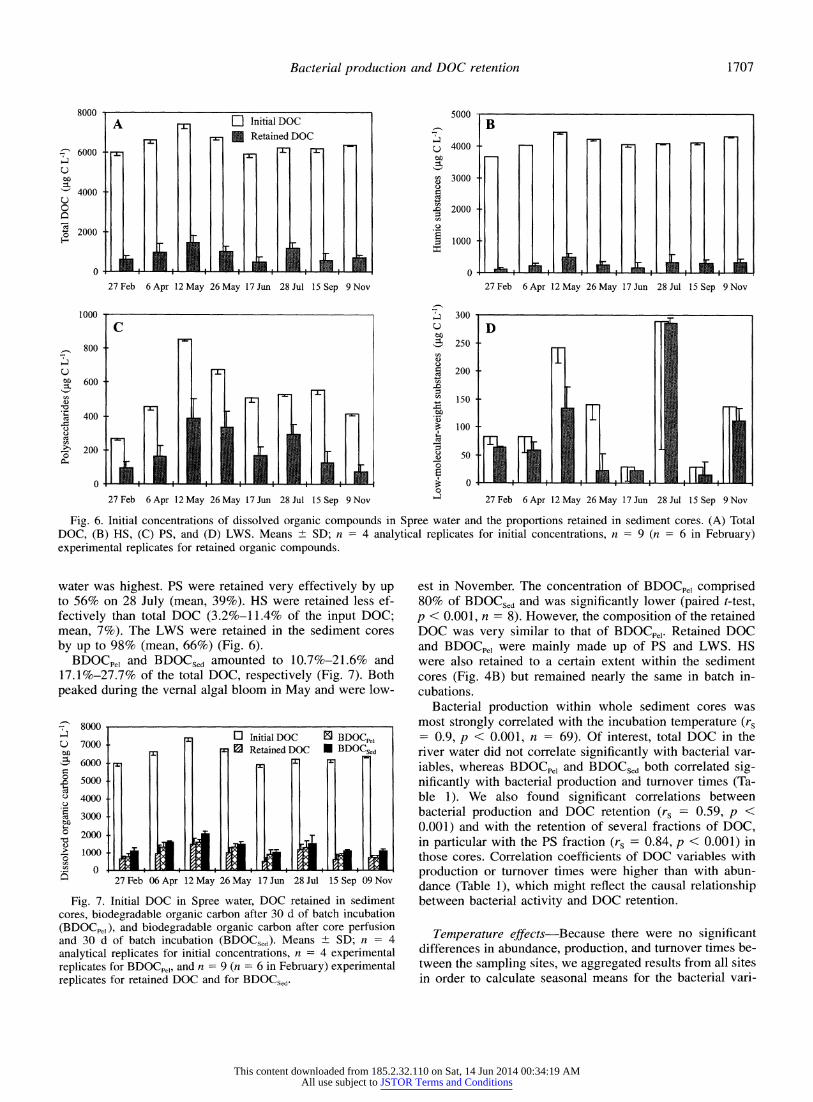
Fig. 6. Initial concentrations of dissolved organic compounds in Spree water and the proportions retained in sediment cores. (A) Total DOC, (B) HS, (C) PS, and (D) LWS. Means ? SD; n = 4 analytical replicates for initial concentrations, n = 9 (n = 6 in February) experimental replicates for retained organic compounds.
water was highest. PS were retained very effectively by up to 56% on 28 July (mean, 39%). HS were retained less ef- fectively than total DOC (3.2%-11.4% of the input DOC; mean, 7%). The LWS were retained in the sediment cores by up to 98% (mean, 66%) (Fig. 6).
BDOCpeI and BDOCSed amounted to 10.7%-21.6% and 17.1%-27.7% of the total DOC, respectively (Fig. 7). Both peaked during the vernal algal bloom in May and were low-
8000
7000 ?
6000 ?
5000 ?
4000 ?
3000 ?
2000
1000 .
0
Tr InitialDOC E BDOCpe, r :-r 0 RetainedDOC * BDOCSed ra i i i 4 n 4
i l 1l ^1 A l Bl ta
27Feb 06Apr 12May 26May 17 Jun 28 Jul 15 Sep 09 Nov
Fig. 7. Initial DOC in Spree water, DOC retained in sediment cores, biodegradable organic carbon after 30 d of batch incubation (BDOCp,,,), and biodegradable organic carbon after core perfusion and 30 d of batch incubation (BDOCsed). Means + SD; n = 4 analytical replicates for initial concentrations, n = 4 experimental replicates for BDOCpe,, and n = 9 (n = 6 in February) experimental replicates for retained DOC and for BDOC,ed.
est in November. The concentration of BDOCpel comprised 80% of BDOCSed and was significantly lower (paired t-test, p < 0.001, n = 8). However, the composition of the retained DOC was very similar to that of BDOCpe,. Retained DOC and BDOCp,e were mainly made up of PS and LWS. HS were also retained to a certain extent within the sediment cores (Fig. 4B) but remained nearly the same in batch in- cubations.
Bacterial production within whole sediment cores was most strongly correlated with the incubation temperature (rs = 0.9, p < 0.001, n = 69). Of interest, total DOC in the river water did not correlate significantly with bacterial var- iables, whereas BDOCpe, and BDOCSCd both correlated sig- nificantly with bacterial production and turnover times (Ta- ble 1). We also found significant correlations between bacterial production and DOC retention (rs = 0.59, p < 0.001) and with the retention of several fractions of DOC, in particular with the PS fraction (rs = 0.84, p < 0.001) in those cores. Correlation coefficients of DOC variables with production or turnover times were higher than with abun- dance (Table 1), which might reflect the causal relationship between bacterial activity and DOC retention.
Temperature effects-Because there were no significant differences in abundance, production, and turnover times be- tween the sampling sites, we aggregated results from all sites in order to calculate seasonal means for the bacterial vari-
8000
6000 4 U r_D e0
4000 O 0
- 2000
0
1707
u
0
tlo
u cu
o
o
C)
a
C)
.,.
' I I I I t
I m I I~' I I I I _1
rAVr _ LI. v_ .
Eff _ a vW, AM a _L
. a i i
b
This content downloaded from 185.2.32.110 on Sat, 14 Jun 2014 00:34:19 AMAll use subject to JSTOR Terms and Conditions
Fischer et al.
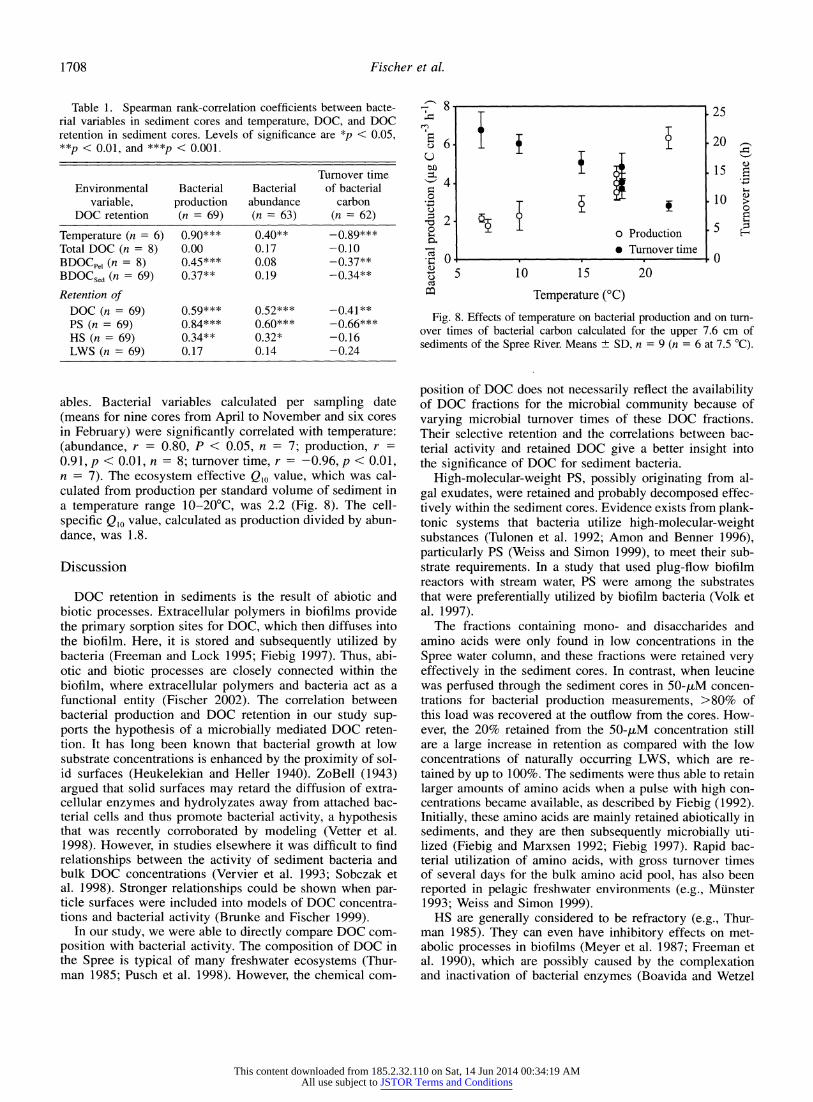
Table 1. Spearman rank-correlation coefficients between bacte- rial variables in sediment cores and temperature, DOC, and DOC retention in sediment cores. Levels of significance are *p < 0.05, **p < 0.01, and ***p < 0.001.
Turnover time Environmental Bacterial Bacterial of bacterial
variable, production abundance carbon DOC retention (n = 69) (n = 63) (n = 62)
Temperature (n = 6) 0.90*** 0.40** -0.89*** Total DOC (n = 8) 0.00 0.17 -0.10 BDOCpe, (n = 8) 0.45*** 0.08 -0.37**
BDOCsed (n = 69) 0.37** 0.19 -0.34**
Retention of DOC (n = 69) 0.59*** 0.52*** -0.41** PS (n = 69) 0.84*** 0.60*** -0.66*** HS (n = 69) 0.34** 0.32* -0.16 LWS (n = 69) 0.17 0.14 -0.24
ables. Bacterial variables calculated per sampling date (means for nine cores from April to November and six cores in February) were significantly correlated with temperature: (abundance, r = 0.80, P < 0.05, n = 7; production, r =
0.91, p < 0.01, n = 8; turnover time, r = -0.96, p < 0.01, n = 7). The ecosystem effective Q,0 value, which was cal- culated from production per standard volume of sediment in a temperature range 10-20?C, was 2.2 (Fig. 8). The cell- specific Qlo value, calculated as production divided by abun- dance, was 1.8.
Discussion
DOC retention in sediments is the result of abiotic and biotic processes. Extracellular polymers in biofilms provide the primary sorption sites for DOC, which then diffuses into the biofilm. Here, it is stored and subsequently utilized by bacteria (Freeman and Lock 1995; Fiebig 1997). Thus, abi- otic and biotic processes are closely connected within the biofilm, where extracellular polymers and bacteria act as a functional entity (Fischer 2002). The correlation between bacterial production and DOC retention in our study sup- ports the hypothesis of a microbially mediated DOC reten- tion. It has long been known that bacterial growth at low substrate concentrations is enhanced by the proximity of sol- id surfaces (Heukelekian and Heller 1940). ZoBell (1943) argued that solid surfaces may retard the diffusion of extra- cellular enzymes and hydrolyzates away from attached bac- terial cells and thus promote bacterial activity, a hypothesis that was recently corroborated by modeling (Vetter et al. 1998). However, in studies elsewhere it was difficult to find relationships between the activity of sediment bacteria and bulk DOC concentrations (Vervier et al. 1993; Sobczak et al. 1998). Stronger relationships could be shown when par- ticle surfaces were included into models of DOC concentra- tions and bacterial activity (Brunke and Fischer 1999).
In our study, we were able to directly compare DOC com- position with bacterial activity. The composition of DOC in the Spree is typical of many freshwater ecosystems (Thur- man 1985; Pusch et al. 1998). However, the chemical com-
-
Cc)
c)
0
0 -a
ct
,.
8
6 i
4T
2T- 1 o Production * Turnover time
0
5 10 15 20
Temperature (?C)
25
20
15
10
5
q)
E
C)
0 a
i ;
0
Fig. 8. Effects of temperature on bacterial production and on turn- over times of bacterial carbon calculated for the upper 7.6 cm of sediments of the Spree River. Means + SD, n = 9 (n = 6 at 7.5 ?C).
position of DOC does not necessarily reflect the availability of DOC fractions for the microbial community because of varying microbial turnover times of these DOC fractions. Their selective retention and the correlations between bac- terial activity and retained DOC give a better insight into the significance of DOC for sediment bacteria.
High-molecular-weight PS, possibly originating from al- gal exudates, were retained and probably decomposed effec- tively within the sediment cores. Evidence exists from plank- tonic systems that bacteria utilize high-molecular-weight substances (Tulonen et al. 1992; Amon and Benner 1996), particularly PS (Weiss and Simon 1999), to meet their sub- strate requirements. In a study that used plug-flow biofilm reactors with stream water, PS were among the substrates that were preferentially utilized by biofilm bacteria (Volk et al. 1997).
The fractions containing mono- and disaccharides and amino acids were only found in low concentrations in the Spree water column, and these fractions were retained very effectively in the sediment cores. In contrast, when leucine was perfused through the sediment cores in 50-,uM concen- trations for bacterial production measurements, >80% of this load was recovered at the outflow from the cores. How- ever, the 20% retained from the 50-/,M concentration still are a large increase in retention as compared with the low concentrations of naturally occurring LWS, which are re- tained by up to 100%. The sediments were thus able to retain larger amounts of amino acids when a pulse with high con- centrations became available, as described by Fiebig (1992). Initially, these amino acids are mainly retained abiotically in sediments, and they are then subsequently microbially uti- lized (Fiebig and Marxsen 1992; Fiebig 1997). Rapid bac- terial utilization of amino acids, with gross turnover times of several days for the bulk amino acid pool, has also been reported in pelagic freshwater environments (e.g., Mtinster 1993; Weiss and Simon 1999).
HS are generally considered to be refractory (e.g., Thur- man 1985). They can even have inhibitory effects on met- abolic processes in biofilms (Meyer et al. 1987; Freeman et al. 1990), which are possibly caused by the complexation and inactivation of bacterial enzymes (Boavida and Wetzel
1708
This content downloaded from 185.2.32.110 on Sat, 14 Jun 2014 00:34:19 AMAll use subject to JSTOR Terms and Conditions
Bacterial production and DOC retention
1998). In other studies, HS were at least partly bioavailable to the bacterial community (e.g., Tranvik 1990; Volk et al. 1997), but they supported fourfold less bacterial production per unit of carbon than nonhumic substances from the same environment (Moran and Hodson 1990). In the present study, approximately equal amounts (but a much lower percentage) of HS and PS were retained in the sediment cores (Fig. 6B,C), which could potentially be utilized by bacteria. Prob- ably, the varying degree of utilization of HS by bacteria is related not only to the enzymatic properties of bacteria but also to differences in the chemical structures of their sub- strates. Carbohydrates and amino acids can be bound chem- ically to HS in significant amounts and thereby enhance the apparent availability of HS. These labile components made up 30% of the utilized "humic substances" in a biofilm re- actor study (Volk et al. 1997). Because of their coupling to HS, these labile substances would have been included in the analysis of the HS pool in our study and thus increase the apparent retention of this DOC fraction.
The average amount of biodegradable organic carbon (BDOCpe, and BDOCSed) in the Spree water column was low- er than in Belgian rivers studied by Servais et al. (1989). In particular, BDOC as a proportion of total DOC was lower than in most other studies on BDOC in rivers (Servais et al. 1989), a calcareous stream (Volk et al. 1997), riverine hy- porheic interstices (e.g., Claret et al. 1998), and a riverine wetland (Mann and Wetzel 1995). This is probably due to efficient utilization of DOC in the Spree, so that the river water was already depleted in labile DOC at the time of sampling because of intense microbial metabolism in situ. Our results from May and June 1998 support this assump- tion: during spring, algae from the water column may be an important source of labile DOC, especially PS. Correspond- ingly, BDOC was highest on the sampling date 12 May. In the middle of May, the chlorophyll a content, as an indicator of algal biomass, decreased dramatically (Fig. 1). Concom- itantly, the amount (Fig. 6C,D) and proportion (Fig. 3) of labile substances decreased strongly in the river water. It is therefore concluded that this change in riverine DOC com- position was caused mainly by bacteria, analogous to the bacterial decomposition of DOC in the laboratory incuba- tions.
Despite the good correlation between DOC retention and bacterial production, DOC retained in the sediment cores accounted for only 11% (June) to 33% (February) of the carbon required for bacterial production. This paradox can be explained as follows. Particulate organic matter (POM) was the primary carbon source for sediment bacteria, as was also suggested for interstitial bacteria in the riparian zone of the alpine Enns River (Brugger et al. 2001). The Spree is rich in seston and nutrients, which could fuel a level of high bacterial production when transported into the sediments via infiltrating river water. Including the hyporheic biofilm, POM built up a standing stock within the sediments of -8.2 mg C cm-3 sediment volume. If this POM was the sole car- bon source for bacteria and if the growth efficiency of bac- teria was 30% (Meyer et al. 1987), this carbon would be turned over by bacteria in only 8.6 d in July (at 1-cm sedi- ment depth), but in 147 d in February (at 7-cm sediment depth). Thus, the sedimentary bacterial community was
highly dependent on the continuous input of fresh organic matter, both as POC and DOC. In part, DOC may be leached from POM because of cell lysis and bacterial extracellular enzymes, and bacteria may release DOC during anabolic processes. Thus, certain DOC fractions may be cycled rap- idly within the sediments, and their contribution to bacterial metabolism could be higher than calculated via the apparent DOC retention (Fiebig 1992).
Bacterial abundance and production in the Spree sedi- ments were high compared with other running waters, prob- ably because of the high surface area of the shifting sand substratum and a good supply with oxygen and nutrients in the uppermost sediment layer (Fischer et al. 2002). The sed- iments here act as a fixed-film reactor, providing a "hot spot" of bacterial activity within the river ecosystem. Pro- duction in the upper sediment layer was significantly higher than in the lower layers, probably because of the enhanced availability of labile organic matter. Furthermore, the bio- chemical composition of POM also strongly influences bac- terial activity in river sediments (Brunke and Fischer 1999; Fischer et al. 2002). Thus, besides temperature, the supply of high-quality POM and DOC seem to determine bacterial production in river sediments.
Our results show that bacterial activity can be controlled by naturally occurring changes in DOC quality. Although DOC of various size classes was immobilized in sediments, high-molecular-weight PS and, if present, LWS were re- tained most efficiently. Both PS and LWS were also quickly degraded in batch incubations. This contrasts with the "size- reactivity continuum model" (Amon and Benner 1996), ac- cording to which most high-molecular-weight DOC would be more reactive than most low-molecular-weight DOC. In our study, high-molecular-weight DOC was utilized to a greater extent than the LWS on account of the higher con- centration of the high-molecular-weight DOC. However, be- cause LWS were present in much lower concentrations, their utilization by bacteria may have resulted in a more rapid turnover. The obvious contradiction of our results with the "size-reactivity continuum model" can thus be explained with the presence of diagenetically young, highly reactive LWS in the River Spree, whereas LWS in oceans are sup- posed to be the oxidized products of humification processes and are diagenetically extremely old (Amon and Benner 1996). As can be seen by the spectral adsorption coefficient (Fig. 4A), the HS from the River Spree prevailed in the fraction with retention times <40 min, which represents mo- lecular weights >1 kDa. This medium-molecular-weight or- ganic matter clearly was least retained by hyporheic sedi- ments and was most refactory in batch incubations, whereas DOC low and high in molecular weight was retained in the river sediments during a short residence time of 0.5 h. After subsequent 30 d of batch incubation, the quality of the DOC was further changed from a relatively wide molecular-weight spectrum to a narrower spectrum mainly composed of HS. This means that certain compounds of DOC may be readily utilized for bacterial growth irrespective of the molecular weight. We hypothesize that the availability of DOC for bac- teria is rather controlled by the presence, abundance, and steric accessibility of specific chemical functional groups than by molecular size.
1709
This content downloaded from 185.2.32.110 on Sat, 14 Jun 2014 00:34:19 AMAll use subject to JSTOR Terms and Conditions

Fischer et al.
These findings also have implications for our knowledge of the microbial metabolism of organic matter on the eco- system level. Most water enters rivers via exfiltrating groundwater, which passes the river sediments. Also, flowing river water temporarily infiltrates into sediments at ripple and dune structures. When the river water passes the sedi- ments, the compounds mentioned above will be stripped off by a combination of physical retention and microbial deg- radation. About two thirds of the Spree sediments are open- framed, permeable sediments in which bacteria can exhibit high metabolic rates (Fischer and Pusch 2001). This per- meable share of the river bottom thus makes up 16,650 m2 within 1 river km, with half of it to be assumed to be infil- tration and exfiltration areas, respectively. On the basis of the infiltration rate used here, this results in an infiltration rate of 140 L s-~. Hence, the average river discharge of 11.5 m3 s-' would be infiltrated each 82 km, which means roughly every 2 d at an average flow velocity of 0.4 m s-l. Because we found 900 /xg C L-I to be retained in the sediments, this would result in the retention of 1.3 g DOC m-2 d-' in infil- tration zones or 10.8 kg DOC km-' d-~. These values are in a realistic scale compared with DOC sources from primary production and groundwater exfiltration (Fischer and Pusch 2001).
Thus, the riverbed sediments serve as a highly effective sink for organic matter, and the activity of the sedimentary biofilm largely influences the organic carbon biogeochem- istry in the river water. The importance of that "liver" func- tion of the river sediments will be greatest in rivers with a diverse channel morphology, including dynamic sediment structures that favor the exchange of river water with the bottom sediments.
References
AMON, R. M. W., AND R. BENNER. 1996. Bacterial utilization of different size classes of dissolved organic matter. Limnol. Oceanogr. 41: 41-51.
BAKER, M. A., C. N. DAHM, AND H. M. VALETT. 1999. Acetate retention and metabolism in the hyporheic zone of a mountain stream. Limnol. Oceanogr. 44: 1530-1539.
BATTIN, T. J., BUTTURINI, A., AND F SABATER. 1999. Immobiliza- tion and metabolism of dissolved organic carbon by natural sediment biofilms in a Mediterranean and temperate stream. Aquat. Microb. Ecol. 19: 297-305.
BOAVIDA, M.-J., AND R. G. WETZEL. 1998. Inhibition of phospha- tase activity by dissolved humic substances and hydrolytic re- activation by natural ultraviolet light. Freshw. Biol. 40: 285- 293.
BRUGGER, A., B. WETT, I. KOLAR, B. REITNER, AND G. J. HERNDL. 2001. Immobilization and bacterial utilization of dissolved or- ganic carbon entering the riparian zone of the alpine Enns Riv- er, Austria. Aquat. Microb. Ecol. 24: 129-142.
BRUNKE, M., AND H. FISCHER. 1999. Hyporheic bacteria-relation-
ships to environmental gradients and invertebrates in a preal- pine stream. Arch. Hydrobiol. 146: 189-217.
, AND T. GONSER. 1997. The ecological significance of ex- change processes between rivers and groundwater. Freshw. Biol. 37: 1-33.
CLARET, C., P. MARMONIER, AND J.-P. BRAVARD. 1998. Seasonal dynamics of nutrient and biofilm in interstitial habitats of two
contrasting riffles in a regulated large river. Aquat. Sci. 60: 33-55.
FIEBIG, D. M. 1992. Fates of dissolved free amino acids in ground- water discharged through stream bed sediments. Hydrobiologia 235/236: 311-319.
. 1997. Microbiological turnover of amino acids immobi- lized from groundwater discharged through hyporheic sedi- ments. Limnol. Oceanogr. 42: 763-768.
, AND J. MARXSEN. 1992. Immobilization and mineralization of dissolved free amino acids by stream-bed biofilms. Freshw. Biol. 28:129-140.
FINDLAY, S., AND W. V. SOBCZAK. 2000. Microbial communities in
hyporheic sediments, p. 287-306. In J. B. Jones and P J. Mul- holland [eds.], Streams and ground waters. Academic.
, D. STRAYER, C. GOUMBALA, AND K. GOULD. 1993. Me- tabolism of streamwater dissolved organic carbon in the shal- low hyporheic zone. Limnol. Oceanogr. 38: 1493-1499.
FISCHER, H. 2002. The role of biofilms in the uptake and transfor- mation of DOM, p. 285-313. In S. Findlay and R. L. Sinsa- baugh [eds.], Aquatic ecosystems: Interactivity of dissolved or- ganic matter. Academic.
, AND M. PUSCH. 1999. Use of the ['4C]leucine incorporation technique to measure bacterial production in river sediments and the epiphyton. Appl. Environ. Microbiol. 65: 4411-4418.
, AND . 2001. Bacterial production in sediments, epi- phyton and the pelagic zone of a lowland river. Freshw. Biol. 46: 1335-1348.
, S. C. WANNER, AND M. PUSCH. 2002. Bacterial abundance and production in river sediments as related to the biochemical composition of particulate organic matter (POM). Biogeo- chemistry 61: 37-55.
FREEMAN, C., AND M. A. LOCK. 1995. The biofilm polysaccharide matrix: A buffer against changing organic substrate supply? Limnol. Oceanogr. 40: 273-278.
, J. MARXSEN, AND S. E. JONES. 1990. Inhibitory effects of high molecular weight dissolved organic matter upon metabolic processes in biofilms from contrasting rivers and streams. Freshw. Biol. 24: 159-166.
HESSE, S., AND F H. FRIMMEL. 1999. Biochemical characterization of refractory organic substances. Acta Hydrochim. Hydrobiol. 27: 94-97.
HEUKELEKIAN, H., AND A. HELLER. 1940. Relation between food concentration and surface for bacterial growth. J. Bacteriol. 40: 547-558.
HUBER, S. A., AND F H. FRIMMEL. 1991. Flow injection analysis of organic carbon in the low-ppb range. Anal. Chem. 63: 2122-2130.
, AND . 1994. Direct gel chromatographic character- ization and quantification of marine dissolved organic carbon using high-sensitivity DOC detection. Environ. Sci. Technol. 28: 1194-1197.
KAPLAN, L. A., AND T. L. BOTT. 1989. Diel fluctuations in bacterial activity on streambed substrata during vernal algal blooms: Ef- fects of temperature, water chemistry, and habitat. Limnol. Oceanogr. 34: 718-733.
,AND J. D. NEWBOLD. 1995. Measurement of streamwater biodegradable dissolved organic carbon with a plug-flow bio- reactor. Water Res. 29: 2696-2706.
KIRCHMAN, D. L. 1993. Leucine incorporation as a measure of bio- mass production by heterotrophic bacteria, p. 509-512. In P. F Kemp, B. F Sherr, and E. B. Sherr [eds.], Handbook of meth- ods in aquatic microbial ecology. Lewis.
LAMPERT, W. 1984. The measurement of respiration, p. 413-468. In J. A. Downing and F H. Rigler [eds.], A manual on methods for the assessment of secondary productivity in fresh waters. Blackwell.
1710
This content downloaded from 185.2.32.110 on Sat, 14 Jun 2014 00:34:19 AMAll use subject to JSTOR Terms and Conditions
Bacterial production and DOC retention
LOCK, M. A. 1993. Attached microbial communities in rivers, p. 113-138. In T. E. Ford [ed.], Aquatic microbiology: An eco- logical approach. Blackwell.
MANN, C. J., AND R. G. WETZEL. 1995. Dissolved organic carbon and its utilization in a riverine wetland ecosystem. Biogeo- chemistry 31: 99-120.
MARXSEN, J. 1996. Measurement of bacterial production in stream- bed sediments via leucine incorporation. FEMS Microbiol. Ecol. 21: 313-325.
MEYER, J. L., R. T EDWARDS, AND R. RISLEY. 1987. Bacterial
growth on dissolved organic carbon from a blackwater river. Microb. Ecol. 13: 13-29.
MORAN, M. A., AND R. E. HODSON. 1990. Bacterial production on humic and nonhumic components of dissolved organic carbon. Limnol. Oceanogr. 35: 1744-1756.
MONSTER, U. 1993. Concentrations and fluxes of organic carbon substrates in the aquatic environment. Antonie Leeuwenhoek 63: 243-274.
PUSCH, M., AND OTHERS. 1998. The role of micro-organisms in the ecological connectivity of running waters. Freshw. Biol. 40: 453-495.
SACHSE, A., D. BABENZIEN, G. GINZEL, J. GELBRECHT, AND C. E. W. STEINBERG. 2001. Characterization of dissolved organic car- bon (DOC) in a dystrophic lake and an adjacent fen. Biogeo- chemistry 54: 279-296.
SERVAIS, P., A. ANZIL, AND C. VENTRESQUE. 1989. Simple method for determination of biodegradable dissolved organic carbon in water. Appl. Environ. Microbiol. 55: 2732-2734.
SIMON, M., AND F AZAM. 1989. Protein content and protein syn- thesis rates of planktonic marine bacteria. Mar. Ecol. Prog. Ser. 51: 201-213.
SOBCZAK, W. V., L. O. HEDIN, AND M. J. KLUG. 1998. Relationships between bacterial productivity and organic carbon at a soil- stream interface. Hydrobiologia 386: 45-53.
THIBODEAUX, L. J., AND J. D. BOYLE. 1987. Bedform-generated convective transport in bottom sediment. Nature 325: 341-343.
THURMAN, E. M. 1985. Organic geochemistry of natural waters. Nijhoff/Junk.
TRANVIK, L. 1990. Bacterioplankton growth on fractions of dis- solved organic carbon of different molecular weights from hu- mic and clear waters. Appl. Environ. Microbiol. 56: 1672- 1677.
TULONEN, T., K. SALONEN, AND L. ARVOLA. 1992. Effects of dif- ferent molecular weight fractions of dissolved organic matter on the growth of bacteria, algae and protozoa from a highly humic lake. Hydrobiologia 229: 239-252.
VERVIER, P., M. DOBSON, AND G. PINAY. 1993. Role of interaction zones between surface and ground waters in DOC transport and processing: Considerations for river restoration. Freshw. Biol. 29: 275-284.
VETTER, Y. A., J. W. DEMING, P. A. JUMARS, AND B. B. KRIEGER- BROCKETT. 1998. A predictive model of bacterial foraging by means of freely released extracellular enzymes. Microb. Ecol. 36: 75-92.
VOLK, C. J., C. B. VOLK, AND L. A. KAPLAN. 1997. Chemical com- position of biodegradable dissolved organic matter in stream- water. Limnol. Oceanogr. 42: 39-44.
WEISS, M., AND M. SIMON. 1999. Consumption of labile dissolved organic matter by limnetic bacterioplankton: The relative sig- nificance of amino acids and carbohydrates. Aquat. Microb. Ecol. 17: 1-12.
WIEGNER, T. N., AND S. P. SEITZINGER. 2001. Photochemical and microbial degradation of external dissolved organic matter in- puts to rivers. Aquat. Microb. Ecol. 24: 27-40.
ZOBELL, C. E. 1943. The effect of solid surfaces upon bacterial activity. J. Bacteriol. 46: 39-56.
Received: 30 October 2001 Amended: 11 August 2002 Accepted: 15 August 2002
1711
This content downloaded from 185.2.32.110 on Sat, 14 Jun 2014 00:34:19 AMAll use subject to JSTOR Terms and Conditions