dietary self-efficacy predicts ahei diet quality in women with previous gestational diabetes
TRANSCRIPT
http://tde.sagepub.com/The Diabetes Educator
http://tde.sagepub.com/content/early/2014/06/18/0145721714539735The online version of this article can be found at:
DOI: 10.1177/0145721714539735
published online 18 June 2014The Diabetes EducatorGuo and Sandra B. Dunbar
Erin Poe Ferranti, K. M. Venkat Narayan, Carolyn M. Reilly, Jennifer Foster, Marjorie McCullough, Thomas R. Ziegler, YingDietary Self-Efficacy Predicts AHEI Diet Quality in Women With Previous Gestational Diabetes
Published by:
http://www.sagepublications.com
On behalf of:
American Association of Diabetes Educators
can be found at:The Diabetes EducatorAdditional services and information for
http://tde.sagepub.com/cgi/alertsEmail Alerts:
http://tde.sagepub.com/subscriptionsSubscriptions:
http://www.sagepub.com/journalsReprints.navReprints:
http://www.sagepub.com/journalsPermissions.navPermissions:
What is This?
- Jun 18, 2014OnlineFirst Version of Record >>
at University of Missouri-Columbia on August 26, 2014tde.sagepub.comDownloaded from at University of Missouri-Columbia on August 26, 2014tde.sagepub.comDownloaded from
Self-Efficacy and Diet Quality in Women With pGDM
Ferranti et al
1
Erin Poe Ferranti, PhD, MPH, RN
K. M. Venkat Narayan, MD, MSc, MBA
Carolyn M. Reilly, PhD, RN, FAHA
Jennifer Foster, CNM, MPH, PhD, FACNM
Marjorie McCullough, ScD, RD
Thomas R. Ziegler, MD
Ying Guo, PhD
Sandra B. Dunbar, RN, PhD, FAAN, FAHA
From the Nell Hodgson Woodruff School of Nursing, Emory University, Atlanta, Georgia (Dr Ferranti, Dr Reilly, Dr Foster, Dr Dunbar); the Rollins School of Public Health and School of Medicine, Emory University, Atlanta, Georgia (Dr Narayan, Dr Guo); the American Cancer Society, Atlanta, Georgia (Dr McCullough); and the School of Medicine, Emory University, Atlanta, Georgia (Dr Ziegler).
Correspondence to Erin Poe Ferranti, PhD, MPH, RN, Emory University, Nell Hodgson Woodruff School of Nursing, 1520 Clifton Road, NE, Atlanta, GA 30322, USA ([email protected]).
Acknowledgment: This work was supported by an award from the American Heart Association. Research reported in this publication was also supported by the National Institute of Nursing Research of the National Institutes of Health under Award No. 1F31NR012605-01. The content is solely the responsibility of the authors and does not necessarily represent the official views of the National Institutes of Health.
DOI: 10.1177/0145721714539735
© 2014 The Author(s)
Purpose
The purpose of this study was to examine the association of intrapersonal influences of diet quality as defined by the Health Belief Model constructs in women with recent histories of gestational diabetes.
Methods
A descriptive, correlational, cross-sectional design was used to analyze relationships between diet quality and intrapersonal variables, including perceptions of threat of type 2 diabetes mellitus development, benefits and barri-ers of healthy eating, and dietary self-efficacy, in a con-venience sample of 75 community-dwelling women (55% minority; mean age, 35.5 years; SD, 5.5 years) with previous gestational diabetes mellitus. Diet quality was defined by the Alternative Healthy Eating Index (AHEI). Multiple regression was used to identify predic-tors of AHEI diet quality.
Results
Women had moderate AHEI diet quality (mean score, 47.6; SD, 14.3). Only higher levels of education and self-efficacy significantly predicted better AHEI diet quality, controlling for other contributing variables.
539735 TDEXXX10.1177/0145721714539735Self-Efficacy and Diet Quality in Women With pGDMFerranti et alresearch-article2014
Dietary Self-Efficacy Predicts AHEI Diet Quality in Women With Previous Gestational Diabetes
The Diabetes Educator OnlineFirst, published on June 18, 2014 as doi:10.1177/0145721714539735
at University of Missouri-Columbia on August 26, 2014tde.sagepub.comDownloaded from
Volume XX, Number X, Month/Month 2014
The Diabetes EDUCATOR
2
Conclusions
There is a significant opportunity to improve diet quality in women with previous gestational diabetes mellitus. Improving self-efficacy may be an important component to include in nutrition interventions. In addition to iden-tifying other important individual components, future studies of diet quality in women with previous gesta-tional diabetes mellitus are needed to investigate the scope of influence beyond the individual to potential family, social, and environmental factors.
The incidence of gestational diabetes mellitus (GDM) has more than doubled in the past decade1 and affects at least 7% of all preg-nancies, or 200,000 women per year in the United States.2,3 GDM is the most common
complication of pregnancy, with incidence paralleling that of type 2 diabetes mellitus (T2DM) prevalence in the general population.4 Women with previous GDM (pGDM) are at elevated risk for cardiovascular disease5 and have a 7-fold increased chance of developing T2DM,6 most commonly within 5 years of delivery.7 Despite intensive dietary counseling8 for women with GDM during pregnancy, there is poor adherence to gen-eral dietary recommendations following delivery. Fruit and vegetable consumption is low in this population,9 with only 5% consuming at least 5 servings per day of fruits or vegetables.10
Intensive lifestyle interventions with a combined focus on diet and physical activity aimed at moderate weight loss resulted in a 53% reduction in T2DM risk among the cohort of women with pGDM in the Diabetes Prevention Program trial.11 Furthermore, more recent studies have shown that adherence to healthy dietary pat-terns alone provides protection for T2DM risk in the pGDM population.12,13 Despite demonstrating the risk reduction of healthy dietary adherence, few studies have examined intrapersonal influences of diet quality in the pGDM population. The purpose of this study was to examine the association between the intrapersonal fac-tors of sociodemographics, depressive symptoms, per-ceptions of T2DM risk, benefits and barriers to healthy eating, and self-efficacy with diet quality in women within 5 years of a GDM pregnancy.
Theoretical Framework
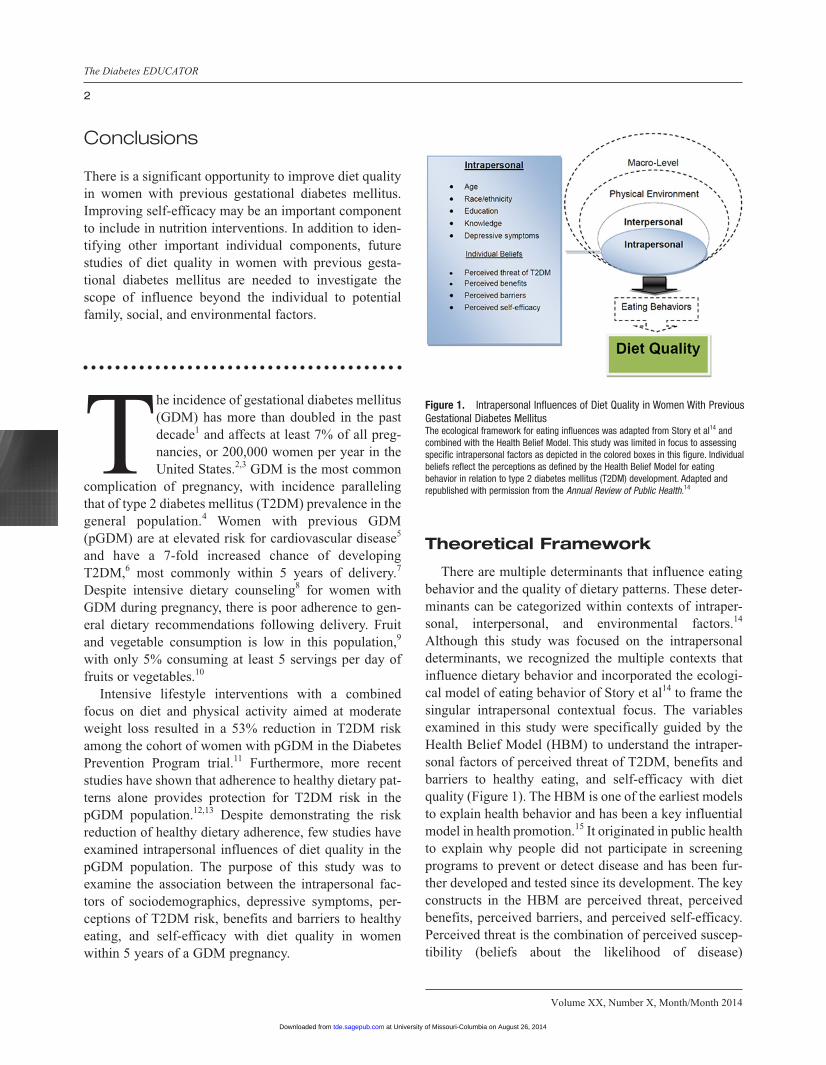
There are multiple determinants that influence eating behavior and the quality of dietary patterns. These deter-minants can be categorized within contexts of intraper-sonal, interpersonal, and environmental factors.14 Although this study was focused on the intrapersonal determinants, we recognized the multiple contexts that influence dietary behavior and incorporated the ecologi-cal model of eating behavior of Story et al14 to frame the singular intrapersonal contextual focus. The variables examined in this study were specifically guided by the Health Belief Model (HBM) to understand the intraper-sonal factors of perceived threat of T2DM, benefits and barriers to healthy eating, and self-efficacy with diet quality (Figure 1). The HBM is one of the earliest models to explain health behavior and has been a key influential model in health promotion.15 It originated in public health to explain why people did not participate in screening programs to prevent or detect disease and has been fur-ther developed and tested since its development. The key constructs in the HBM are perceived threat, perceived benefits, perceived barriers, and perceived self-efficacy. Perceived threat is the combination of perceived suscep-tibility (beliefs about the likelihood of disease)
Figure 1. Intrapersonal Influences of Diet Quality in Women With Previous Gestational Diabetes MellitusThe ecological framework for eating influences was adapted from Story et al14 and combined with the Health Belief Model. This study was limited in focus to assessing specific intrapersonal factors as depicted in the colored boxes in this figure. Individual beliefs reflect the perceptions as defined by the Health Belief Model for eating behavior in relation to type 2 diabetes mellitus (T2DM) development. Adapted and republished with permission from the Annual Review of Public Health.14
at University of Missouri-Columbia on August 26, 2014tde.sagepub.comDownloaded from
Self-Efficacy and Diet Quality in Women With pGDM
Ferranti et al
3
and perceived severity (beliefs about the seriousness of disease). Perceived benefits and barriers are defined as the positive and negative aspects of health actions to reduce disease threat. Finally, self-efficacy is defined as the conviction that behavior can be successfully enacted to produce outcomes.16
Individual influences on healthy eating have been widely studied among many populations, and multiple intrapersonal factors have been associated with diet qual-ity. As depicted in Story et al’s14 ecological framework of the multiple influences of eating behavior, the intraper-sonal influences include cognitions, skills and behavior, lifestyle, biological factors, and demographics. Sociodemographic factors influence diet quality, with most studies concluding that increased age, higher edu-cation, higher income, and nonminority race/ethnicity are associated with higher diet quality.17-19 Knowledge and self-efficacy are important predictors of diet quality in postpartum women and those with pGDM.10,18,20 Depression has also been associated with lower diet quality,21 with some recent studies suggesting that poor diet quality may predict depressive symptoms, especially in women of childbearing age.22,23
We hypothesized that women with pGDM who had higher perceptions of the threat of T2DM, along with greater perceived self-efficacy and benefits of healthy eating and lower perceptions of healthy eating barriers would have higher Alternative Healthy Eating Index (AHEI) diet quality, controlling for sociodemographics, dietary knowledge, and depressive symptoms.
Methods
Study Design, Setting, and Participants
This was a cross-sectional, descriptive, quantitative study conducted from August 2011 through December 2012. Participants were recruited from the community and through the women’s health clinics of an academic health center, an inner-city public hospital, and a public health department. Eligible participants were women who (1) were within 5 years of a GDM pregnancy, (2) were aged 18 to 45 years, (3) were fluent in English or Spanish, (4) had no histories of polycystic ovary syn-drome and no development of T2DM, (5) were not cur-rently pregnant or breastfeeding, (6) were not following prescriptive or weight-loss diets, and (7) had no more than moderate depressive symptoms (score ≥ 20 on the
Patient Health Questionnaire–9 [PHQ-9]). The study pro-tocol was approved by the Emory University Institutional Review Board and by the clinic sites where recruitment occurred.
Measurements
Demographics and basic, pertinent medical history were collected on a form designed for this study and included age, race/ethnicity, education, income, delivery date of the most recent GDM pregnancy, and current medications.
Block food-frequency questionnaire. Participants completed the Block 2005 110-item, semiquantitative, paper-format food-frequency questionnaire (FFQ) to assess usual dietary intake in the past year. The FFQ asks participants to recall the frequency and amounts of spe-cific food and drink items, aided by a picture reference page for serving size accuracy. Food and drink items include typical breakfast foods, fruits, vegetables, meat and seafood, breads, fruit juices, and alcoholic bever-ages. It also qualifies the food items further by assessing the attributes of specific items. For example, if a partici-pant indicated that cheese was consumed, he or she was asked to identify whether it was usually low fat or not. The Block FFQ was designed and tested by Dr Gladys Block and is administered in a paper or electronic format by Dr Block’s company, NutritionQuest (http://nutrition quest.com).24 The paper version is an 8-page binded questionnaire that can be self- or interviewer-adminis-tered. The Block FFQ has been validated among other major FFQs and has been found to be comparable.25 Energy-adjusted correlation coefficients for specific macro- and micronutrients in women between the Block and 24-hour dietary recalls ranged from 0.19 to 0.80, with most >0.50 in one validity study,25 and ranged from 0.11 to 0.76 in another study.26 Dietary analyses of the FFQ were provided by NutritionQuest (Berkeley, California) and included average daily intake of macro-nutrient, micronutrient, food group, and drink servings on the basis of the US Department of Agriculture Food and Nutrient Database for Dietary Studies.24
AHEI. The AHEI was the dietary pattern chosen to define diet quality because it had previously been associ-ated with a 57% lower risk for T2DM development over a mean follow-up time of 16 years in women with
at University of Missouri-Columbia on August 26, 2014tde.sagepub.comDownloaded from
Volume XX, Number X, Month/Month 2014
The Diabetes EDUCATOR
4
pGDM in the Nurses’ Health Study II.12 The AHEI dietary index evolved from the Healthy Eating Index as an alternative dietary index to better predict chronic dis-ease risk.27 The Healthy Eating Index was first created in 1995 to quantitatively reflect adherence to the federal dietary guidelines.28 When developed in 2002, the AHEI was created to incorporate more detailed dietary guide-lines associated with beneficial chronic disease protec-tion, such as increasing intake of fish, poultry, and whole grains.27 In addition to the T2DM risk reduction associ-ated with AHEI adherence in women with pGDM, the AHEI dietary pattern has been associated with decreased risk for diabetes,12,29 lower risk for cardiovascular dis-ease30 and cancer,31 and the reversal of metabolic syn-drome in other populations.32
Dietary data from the Block FFQ analyses were used to compute the AHEI score. AHEI scores range from 2.5 to 87.5, with greater concordance (better diet quality) reflected by higher scores. Eight of the 9 AHEI compo-nents are scored from 0 (recommendations were not met) to 10 (recommendations were met fully), with intermedi-ate intakes scored proportionately between 0 and 10. For example, to receive the full 10 points for vegetable intake, a participant would have to consume 5 vegetable servings per day. Any intake >0 servings and <5 servings would receive a proportionate score between 1 and 9 points. The final component of multivitamin use is scored dichoto-mously as 2.5 points for no use and 7.5 points for use.27 Therefore, a participant could score a minimum of 2.5 if no AHEI recommendations were met and a maximum of 87.5 if all recommendations were met.
Risk Perception Survey for Developing Diabetes (RPS-DD). Perceived threat of T2DM was assessed with a 23-item questionnaire incorporating 3 subscales (Personal Control, Optimistic Bias, Knowledge, and an additional 7 items addressing risk perception and life-style behaviors) of the RPS-DD, developed for the Diabetes Prevention Program trial33 and adapted for women with pGDM.34 Cronbach α coefficients for the pGDM population ranged from .65 to .72.34 In this study sample, subscale reliability coefficients were as follows: Personal Control, .62; Worry, .81; and Optimistic Bias, .73. The subscale scores were calculated by reverse-coding specific items, summing the items, and then aver-aging to compute a subscale score for a score range of 0 to 4. For each subscale, a higher score is equivalent to a higher level of that component. Beliefs about the benefits
of diet and exercise and individual risk perception with an additional 7 items on the RPS-DD were assessed, replicating the assessment of risk perception in women with pGDM as conducted by Kim et al.34
Perceived benefits of healthy eating scale for adults at risk for cardiometabolic diseases. Perceived benefits of healthy eating were assessed with a 9-item, 5-point, Likert-type instrument designed specifically for this study. At the time this study was being designed, there were no published instruments examining the concept of healthy eating benefits, especially in a population at risk for cardiometabolic diseases. Content validity of the scale was established with an expert review panel, and the scale was then pilot-tested in a convenience sample (n = 91) of adults who had any cardiometabolic risk fac-tors. Items address benefits such as healthy eating: “can help prevent diabetes,” “can help control my weight,” and “can help me feel better.” Scores range from 9 to 45, with higher scores indicating greater perceived benefits. The Cronbach α coefficient in the unpublished pilot study was acceptable at .88 and in this sample was .92.
Barriers to Healthy Eating Scale. Perceived barriers to healthy eating were assessed with the Barriers to Healthy Eating Scale, a 16-item scale originally developed to assess healthy eating barriers in pregnant women.35 It addresses areas related to unavailability of food, expense, inconve-nience, preferences, and inability to engage in healthy eat-ing. The first 5 items are reverse coded, and then all 16 items are summed for a total score ranging from 16 to 80. Higher scores indicate greater perceived barriers to healthy eating. Assessment of test-retest reliability for the Barriers to Healthy Eating Scale resulted in a Pearson correlation coefficient of 0.79, and internal consistency was deter-mined with Cronbach α coefficients of .71 and .77.35 In this study sample, the reliability coefficient was .67.
Cardiac Diet Self-Efficacy Scale. The 16-item Cardiac Diet Self-Efficacy Scale was used to measure self-efficacy related to healthy eating. It is a 5-level, Likert-type scale assessing confidence levels in adopting healthy eating behavior.36 Scores can range from 12 to 60, with higher scores indicative of greater self-efficacy. In other samples, Cronbach α coefficients ranged from .89 to .92, and the test-retest correlation coefficient was 0.86.36 In this study, sample, the Cronbach α reliability coefficient was .92.
at University of Missouri-Columbia on August 26, 2014tde.sagepub.comDownloaded from
Self-Efficacy and Diet Quality in Women With pGDM
Ferranti et al
5
Dietary Knowledge Questionnaire. Nutrition knowl-edge influences dietary quality in women of childbearing age.18 Dietary knowledge was assessed with an 11-item questionnaire (10 knowledge questions and 1 Likert-type question for perceived level of dietary knowledge) to assess awareness of the 2010 Dietary Guidelines for Americans. This instrument was adapted from a survey designed to test knowledge of the 2005 Dietary Guidelines for Americans from a study with community health advi-sors.37 For this study, an adapted and updated version of the questionnaire to reflect the 2010 guidelines specifi-cally for women aged 18 to 45 years was used.38 The knowledge questions are each 4-item multiple-choice items that test participants’ understanding of recom-mended daily calories and daily servings of grain, fruits and vegetables, dairy, protein, fiber, sodium, and amount and types of fat. Knowledge of diabetes risk factors was assessed with the Knowledge subscale of the RPS-DD.
PHQ-9. Depressive symptoms are associated with dietary quality in women of childbearing age.23 The 9-item PHQ-9 was used to measure depressive symp-toms. It has been tested in multiple samples, including women of childbearing age,39 and deemed a reliable and valid measure of depression severity. Sensitivity was 88%, and specificity was also 88% for identifying major depression.39 Furthermore, the PHQ-9 has been tested and validated for use in telephone screening, with internal consistency coefficients of 0.79 to 0.85 and test-retest correlations ranging from 0.90 to 0.95.40 Telephone administration was used in this study, resulting in a reli-ability coefficient of 0.79. Scores range from 0 to 27, with higher scores indicating greater depressive symptoms.
Procedures
Upon receiving a study letter of invitation or seeing or hearing an advertisement, interested women contacted the lead researcher or bilingual research assistant by e-mail or telephone. The study was fully explained, ini-tial verbal telephone consent was completed, and eligibil-ity criteria were determined. English-speaking women who chose to enroll were mailed the questionnaire packet. Enrolled Spanish-speaking women completed question-naires in an interview format with the bilingual research assistant. The research staff members met participants in the settings chosen by the participants, usually the home or workplace. Questionnaire completion time ranged
from 1 to 2 hours. Participants were compensated with a $25 gift card and presented with individualized cardio-metabolic health and nutrition education materials for their participation in the study.
Data Analyses
Data were analyzed with IBM SPSS version 20.0 (IBM, Armonk, New York). Descriptive statistics were used to review sample characteristics and check underly-ing distribution assumptions. Race and ethnicity data were dichotomized into categories of non-Hispanic Caucasian women (n = 34) and minority women (n = 41). The minority group consisted of 24 African American, 11 Hispanic, 2 Asian, and 4 multiracial/multiethnic women. Bivariate correlation analyses were used to determine significant associations (P ≤ .05) between the contribut-ing and independent variables with diet quality. Mean differences in diet quality were examined with 2-sample t tests by race, education status, and level of risk percep-tion. Multiple linear regression modeling was used to examine the contribution of the independent and contrib-uting variables to the variance in diet quality. The control variables of age, race, dietary knowledge, educational attainment, and depressive symptoms were held constant in the model testing. Each independent variable was indi-vidually added to the model to be examined for contribu-tion and significance in predicting diet quality. Independent variables that did not remain significant (P > .05) were excluded from the final model.
Results
The sample included 75 women (45% Caucasian, 55% minority [32% African American, 15% Hispanic]), with a mean age of 35.5 years (SD, 5.5 years), a mean of 2.6 years (SD, 1.6 years) since their last GDM delivery, and mean parity of 2.7 (SD, 2.1). Most were married (73%). More than half (58%) had bachelor’s degrees or higher, and 52% were employed full-time. During their pregnan-cies, the majority of women (63%) were managed with lifestyle interventions, and 24% were also treated with insulin (Table 1).
AHEI scores indicated an average level of diet quality (mean, 47.6; SD, 14.3), with a range of scores from 20.5 to 77.5. No participant fully met the AHEI recommenda-tions. The dietary components with the poorest scores included alcohol consumption and ratio of red to white
at University of Missouri-Columbia on August 26, 2014tde.sagepub.comDownloaded from
Volume XX, Number X, Month/Month 2014
The Diabetes EDUCATOR
6
meat, indicating that most women were consuming less than the suggested moderate alcohol intake of 0.5 to 1.5 servings per day and that red meat intake was higher than that of poultry and fish (Table 2).
Half of the participants (49%) believed that they had a moderate to high chance of developing diabetes in the next 10 years, whereas the other half perceived their risk to be none or slight (Table 3). There was no difference in diet quality between those with none or slight perception of risk and those with moderate or high perception of risk (t = −0.23, P = .82). Nearly everyone (97%) believed that regular exercise and diet could prevent T2DM develop-ment. Although 83% believed that doing regular exercise and following a diet required a lot of effort, 81% also believed that the benefits outweighed the effort. Participants reported high levels of personal control for
preventing diabetes (mean, 3.2; SD, 0.5) and a moderate amount of worry about future T2DM development (mean, 2.7; SD, 0.8). Participants, on average, did not feel that they were any more or less susceptible to the development T2DM or other serious diseases compared with other women, with a mean Optimistic Bias score of 2.1 (SD, 0.7).
Barriers to healthy eating were low (mean, 27.3; SD, 6.5), with items related to distance >2 miles for food and fresh fruits and vegetables as the more commonly reported barriers. Participants also reported high levels of perceived benefit to healthy eating (mean, 42.2; SD, 3.1) and had relatively high levels of dietary self-efficacy (mean, 51.9; SD, 12.7).
Despite a high level of education among participants, knowledge of dietary guidelines was rather poor, with an average test score of 42.2% (SD, 24.6%). Although 89% of the participants recognized that having had GDM increased their risk for T2DM, overall risk knowledge was moderate, with a mean test score of 60.7% (SD, 18.4%). Most participants reported minimal depressive symptoms (68%), with scores ranging from 0 to 15 (mean, 4.1; SD, 4.1).
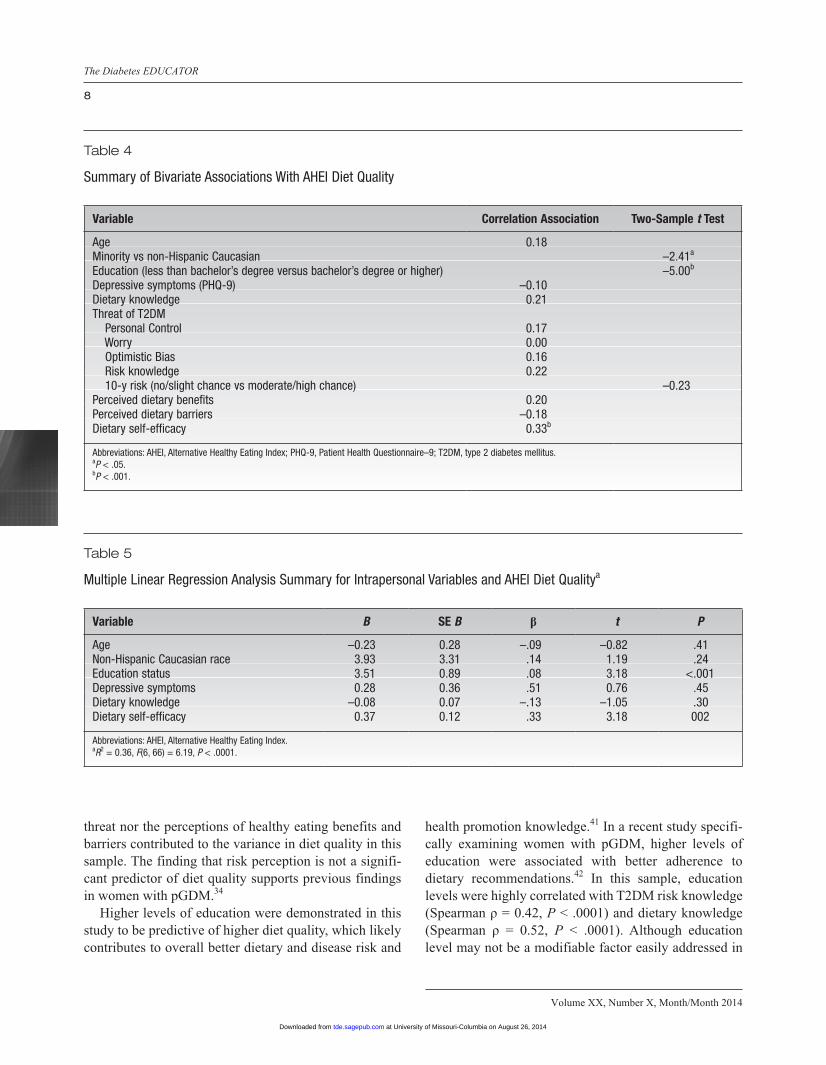
Bivariate associations were examined between diet quality, demographics, dietary knowledge, depressive symptoms, and perceived beliefs. Non-Hispanic Caucasian race, higher level of education, and higher self-efficacy were all significantly associated with higher levels of diet quality (Table 4).
Non-Hispanic Caucasian women had higher AHEI scores compared with minority women (t = −2.4, P = .02). The greatest mean difference in diet quality was between women with bachelor’s degrees or higher and those who did not complete college (t = −5.0, P < .0001), with a mean AHEI score difference of 14.5 points.
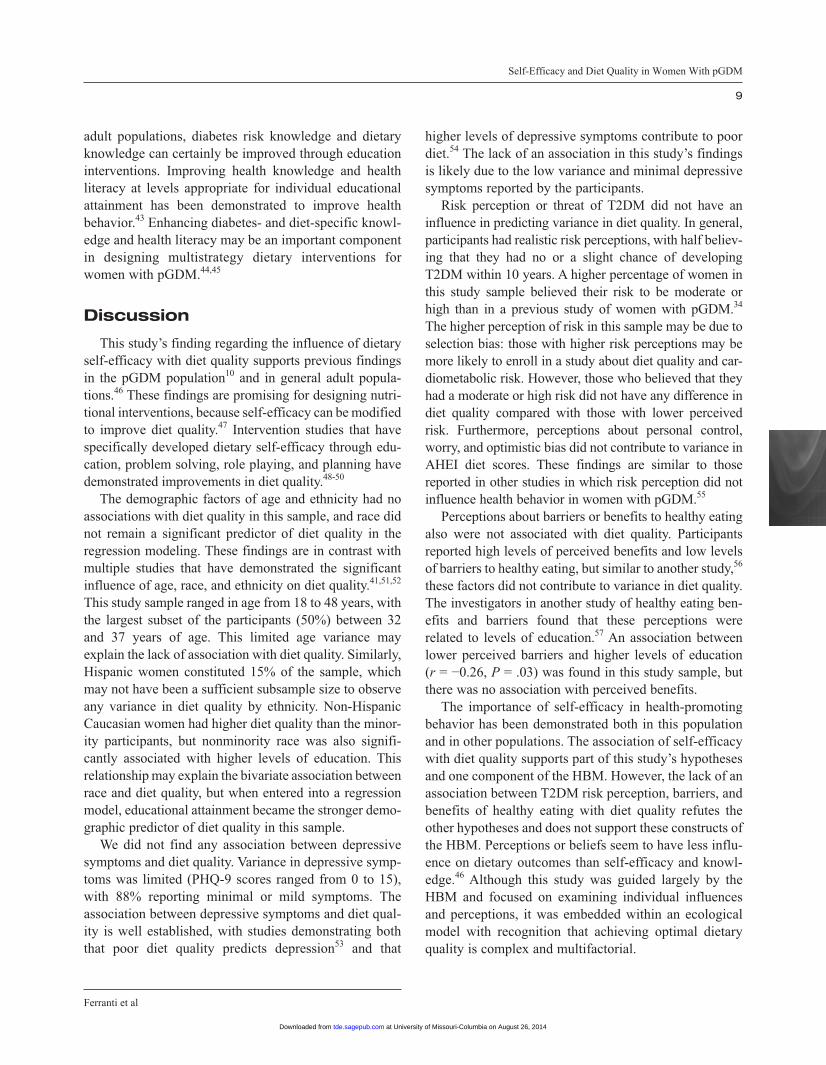
Each of the 7 independent variables (RPS-DD Personal Control, Worry, and Optimistic Bias subscale scores, diabetes risk knowledge score, perceived benefit score, perceived barrier score, and dietary self-efficacy score) were entered individually into a multiple regression model with all 4 control variables (race, education status, depressive symptoms, and dietary knowledge). Personal Control, Worry, Optimistic Bias, diabetes risk knowl-edge, perceived benefits, and barriers did not contribute to variance in diet quality. Controlling for all other vari-ables, only higher levels of self-efficacy significantly predicted better AHEI diet concordance (R2 = 0.36, F[6, 66] = 6.19, P < .0001). The final model with education
Table 1
Characteristics of the Sample (n = 75)
Characteristic Value
Age, mean (SD), y 35.5 (5.5)Race/ethnicity, % Non-Hispanic Caucasian 45.0 Minority 55.0 African American 32.0 Hispanic 15.0 Asian 3.0 Multiracial 5.0Education, % <4 y college 41.3 Bachelor’s degree or higher 58.7Marital status, % Married 73.3Employment status, % Unemployed 33.0 Employed part-time 16.0 Employed full-time 51.0Family history of T2DM, % 35.0Family history of CVD, % 64.0Current smoker, % 12.0Time since last GDM pregnancy, mean (SD), y 2.6 (1.6)Parity, mean (SD) 2.7 (2.1)GDM pregnancy treatment, % Lifestyle 63.0 Oral medication 13.0 Insulin 24.0
Abbreviations: CVD, cardiovascular disease; GDM, gestational diabetes mellitus; T2DM, type 2 diabetes mellitus.
at University of Missouri-Columbia on August 26, 2014tde.sagepub.comDownloaded from
Self-Efficacy and Diet Quality in Women With pGDM
Ferranti et al
7
status and self-efficacy as significant predictors explained 36% of the variance in diet quality. The parameter esti-mates of the predictors in the regression model further suggest that education status was the strongest predictor of AHEI diet quality (Table 5).
Implications
Diet quality in this sample of women with pGDM was moderate, with a substantial opportunity to improve intake to be consistent with protective diets such as the AHEI diet. Inadequate diet quality in the pGDM popula-tion has been reported previously,9,10 with one other study examining AHEI dietary concordance in women with pGDM.12 The increasingly beneficial T2DM risk reduc-tion demonstrated along the continuum of AHEI scores by Tobias et al12 suggests the significant need to improve diet quality in women with pGDM. Identifying the impor-tant factors that predict diet quality is an important next step in designing diet improvement interventions. The findings of this study highlight the importance of educa-tional attainment and dietary self-efficacy in promoting better diet quality, supporting components of the study hypotheses. However, neither the perceptions of T2DM
Table 2
AHEI Scoring Method and Total Scoresa
ComponentCriterion for
Minimum Scoreb
Criterion for Maximum Scoreb
Participant AHEI Score, Mean (SD), Points
Vegetables, servings/d 0 5 5.41 (2.84)Fruit, servings/d 0 4 4.96 (2.38)Nuts and soy protein, servings/d 0 1 6.00 (4.93)Ratio of white to red meat 0 4 2.44 (2.57)Cereal fiber, g/d 0 15 8.08 (2.74)Trans fat, % of energy >4 <0.5 7.49 (1.19)Ratio of polyunsaturated to saturated fat <0.1 >1.0 7.29 (1.83)Duration of multivitamin use, yc <5 >5 3.77 (2.19)Alcohol, servings/d 0 or >2.5 0.5-1.5 2.13 (3.95)Total score 2.5 87.5 47.58 (14.25)
Abbreviations: AHEI, Alternative Healthy Eating Index.aThe 9 components are summed for a minimum score of 2.5 and a maximum score of 87.5.bThe minimum score is 0 points and the maximum score is 10 points for all components except multivitamin use. Intermediate intakes of each component except multivitamin use were scored proportionately between 0 and 10.cMultivitamin intake is dichotomously scored with a minimum of 2.5 points for <5 years’ duration of intake and 7.5 points for >5 years’ duration of intake.
Table 3
Participant Scores on Intrapersonal Measures
Instrument Value
10-y risk perception Almost no/slight chance, % 50.7 Moderate/high chance, % 49.3RPS-DD Personal Control, mean (SD) 3.15 (0.5) Worry, mean (SD) 2.73 (0.75) Optimistic Bias, mean (SD) 2.10 (0.65)Barriers to healthy eating, mean (SD) 27.29 (6.52)Benefits to healthy eating, mean (SD) 42.23 (3.07)Dietary self-efficacy, mean (SD) 51.89 (12.72)Knowledge Diabetes risk, mean (SD) 60.96 (18.43) Dietary guidelines, mean (SD) 42.23 (24.64)Depressive symptoms (PHQ-9), mean (SD) 4.08 (4.06) Minimal, % 68.0 Mild, % 20.0 Moderate, % 10.7 Moderately severe, % 1.3
Abbreviations: PHQ-9 = Patient Health Questionnaire–9; RPS-DD = Risk Perception Survey for Developing Diabetes.
at University of Missouri-Columbia on August 26, 2014tde.sagepub.comDownloaded from
Volume XX, Number X, Month/Month 2014
The Diabetes EDUCATOR
8
threat nor the perceptions of healthy eating benefits and barriers contributed to the variance in diet quality in this sample. The finding that risk perception is not a signifi-cant predictor of diet quality supports previous findings in women with pGDM.34
Higher levels of education were demonstrated in this study to be predictive of higher diet quality, which likely contributes to overall better dietary and disease risk and
health promotion knowledge.41 In a recent study specifi-cally examining women with pGDM, higher levels of education were associated with better adherence to dietary recommendations.42 In this sample, education levels were highly correlated with T2DM risk knowledge (Spearman ρ = 0.42, P < .0001) and dietary knowledge (Spearman ρ = 0.52, P < .0001). Although education level may not be a modifiable factor easily addressed in
Table 4
Summary of Bivariate Associations With AHEI Diet Quality
Variable Correlation Association Two-Sample t Test
Age 0.18Minority vs non-Hispanic Caucasian –2.41a
Education (less than bachelor’s degree versus bachelor’s degree or higher) –5.00b
Depressive symptoms (PHQ-9) –0.10Dietary knowledge 0.21Threat of T2DM Personal Control 0.17 Worry 0.00 Optimistic Bias 0.16 Risk knowledge 0.22 10-y risk (no/slight chance vs moderate/high chance) –0.23Perceived dietary benefits 0.20Perceived dietary barriers –0.18Dietary self-efficacy 0.33b
Abbreviations: AHEI, Alternative Healthy Eating Index; PHQ-9, Patient Health Questionnaire–9; T2DM, type 2 diabetes mellitus.aP < .05.bP < .001.
Table 5
Multiple Linear Regression Analysis Summary for Intrapersonal Variables and AHEI Diet Qualitya
Variable B SE B β t P
Age –0.23 0.28 –.09 –0.82 .41Non-Hispanic Caucasian race 3.93 3.31 .14 1.19 .24Education status 3.51 0.89 .08 3.18 <.001Depressive symptoms 0.28 0.36 .51 0.76 .45Dietary knowledge –0.08 0.07 –.13 –1.05 .30Dietary self-efficacy 0.37 0.12 .33 3.18 002
Abbreviations: AHEI, Alternative Healthy Eating Index.aR2 = 0.36, F(6, 66) = 6.19, P < .0001.
at University of Missouri-Columbia on August 26, 2014tde.sagepub.comDownloaded from
Self-Efficacy and Diet Quality in Women With pGDM
Ferranti et al
9
adult populations, diabetes risk knowledge and dietary knowledge can certainly be improved through education interventions. Improving health knowledge and health literacy at levels appropriate for individual educational attainment has been demonstrated to improve health behavior.43 Enhancing diabetes- and diet-specific knowl-edge and health literacy may be an important component in designing multistrategy dietary interventions for women with pGDM.44,45
Discussion
This study’s finding regarding the influence of dietary self-efficacy with diet quality supports previous findings in the pGDM population10 and in general adult popula-tions.46 These findings are promising for designing nutri-tional interventions, because self-efficacy can be modified to improve diet quality.47 Intervention studies that have specifically developed dietary self-efficacy through edu-cation, problem solving, role playing, and planning have demonstrated improvements in diet quality.48-50
The demographic factors of age and ethnicity had no associations with diet quality in this sample, and race did not remain a significant predictor of diet quality in the regression modeling. These findings are in contrast with multiple studies that have demonstrated the significant influence of age, race, and ethnicity on diet quality.41,51,52 This study sample ranged in age from 18 to 48 years, with the largest subset of the participants (50%) between 32 and 37 years of age. This limited age variance may explain the lack of association with diet quality. Similarly, Hispanic women constituted 15% of the sample, which may not have been a sufficient subsample size to observe any variance in diet quality by ethnicity. Non-Hispanic Caucasian women had higher diet quality than the minor-ity participants, but nonminority race was also signifi-cantly associated with higher levels of education. This relationship may explain the bivariate association between race and diet quality, but when entered into a regression model, educational attainment became the stronger demo-graphic predictor of diet quality in this sample.
We did not find any association between depressive symptoms and diet quality. Variance in depressive symp-toms was limited (PHQ-9 scores ranged from 0 to 15), with 88% reporting minimal or mild symptoms. The association between depressive symptoms and diet qual-ity is well established, with studies demonstrating both that poor diet quality predicts depression53 and that
higher levels of depressive symptoms contribute to poor diet.54 The lack of an association in this study’s findings is likely due to the low variance and minimal depressive symptoms reported by the participants.
Risk perception or threat of T2DM did not have an influence in predicting variance in diet quality. In general, participants had realistic risk perceptions, with half believ-ing that they had no or a slight chance of developing T2DM within 10 years. A higher percentage of women in this study sample believed their risk to be moderate or high than in a previous study of women with pGDM.34 The higher perception of risk in this sample may be due to selection bias: those with higher risk perceptions may be more likely to enroll in a study about diet quality and car-diometabolic risk. However, those who believed that they had a moderate or high risk did not have any difference in diet quality compared with those with lower perceived risk. Furthermore, perceptions about personal control, worry, and optimistic bias did not contribute to variance in AHEI diet scores. These findings are similar to those reported in other studies in which risk perception did not influence health behavior in women with pGDM.55
Perceptions about barriers or benefits to healthy eating also were not associated with diet quality. Participants reported high levels of perceived benefits and low levels of barriers to healthy eating, but similar to another study,56 these factors did not contribute to variance in diet quality. The investigators in another study of healthy eating ben-efits and barriers found that these perceptions were related to levels of education.57 An association between lower perceived barriers and higher levels of education (r = −0.26, P = .03) was found in this study sample, but there was no association with perceived benefits.
The importance of self-efficacy in health-promoting behavior has been demonstrated both in this population and in other populations. The association of self-efficacy with diet quality supports part of this study’s hypotheses and one component of the HBM. However, the lack of an association between T2DM risk perception, barriers, and benefits of healthy eating with diet quality refutes the other hypotheses and does not support these constructs of the HBM. Perceptions or beliefs seem to have less influ-ence on dietary outcomes than self-efficacy and knowl-edge.46 Although this study was guided largely by the HBM and focused on examining individual influences and perceptions, it was embedded within an ecological model with recognition that achieving optimal dietary quality is complex and multifactorial.
at University of Missouri-Columbia on August 26, 2014tde.sagepub.comDownloaded from
Volume XX, Number X, Month/Month 2014
The Diabetes EDUCATOR
10
In addition to the potential social and environmental influences that were beyond the investigative scope of this study, there may be other important individual influ-ences that affect diet quality in women with pGDM. Time constraints, fatigue, work obstacles, and childcare duties have been identified as major barriers to diet and exercise activities in a qualitative investigation with women with pGDM.58 These identified barriers require further study to test their contribution to diet outcomes. Additionally, dietary restraint,59 perceived stress,60 and sleep quality61 have been associated with diet quality in other populations of women but have not been investi-gated in women with pGDM.
Limitations
There were a few limitations of this study that are worth noting. First, because it was a cross-sectional study, only associations could be identified between the variables, but no causality could be determined. Longitudinal studies in women with pGDM are needed to identify and understand the directionality of potential influences of diet quality. Second, although this sample size was adequate to determine the effect size of individ-ual perceptions on diet quality, it was too small to detect differences by specific sociodemographic characteristics. The convenience sampling approach should be consid-ered when generalizing the study findings to other studies in women with pGDM.
Strengths
This study had several strengths as well. It is one of few studies to examine overall diet quality in women with pGDM in addition to investigating associated sociodemographic and intrapersonal beliefs. Inadequate diet quality in women with pGDM has been established in previous studies, but little was known about what might influence dietary adherence in this population. This study suggests that self-efficacy and education in particular may be important predictors of diet quality in pGDM women. Although a convenience sample, the study participants were recruited from multiple commu-nity and health care settings, which resulted in a sociode-mographically diverse group of women. This diversity enhances the generalizability of these findings to women with pGDM of multiple races, Hispanic ethnicity, and a wide range of education and income levels.
Conclusions
Level of education and dietary self-efficacy are impor-tant predictors of AHEI diet quality in women with pGDM. Interventions aimed at improving diet quality in these high-risk women should address strategies to increase dietary self-efficacy and address dietary knowl-edge and T2DM risk knowledge appropriate to individual health literacy and education levels. There is a consider-able need to improve diet quality in women with pGDM, as this study supports previous work confirming that these at-risk women are not adhering fully to protective diets to prevent T2DM development. In addition to phys-ical activity, a healthful diet is a critical component in preventing the progression to T2DM in at-risk popula-tions. Future studies of diet quality among women with pGDM should investigate intrapersonal influences of diet quality with a longitudinal design and expand the scope of influence beyond the individual to potential family, social, and environmental factors.
References
1. Barbour LA, McCurdy CE, Hernandez TL, Kirwan JP, Catalano PM, Friedman JE. Cellular mechanisms for insulin resistance in normal pregnancy and gestational diabetes. Diabetes Care. 2007;30:S112-S119.
2. Nicholson WK, Wilson LM, Witkop CT, et al. Therapeutic man-agement, delivery, and postpartum risk assessment and screening in gestational diabetes. Evid Rep Technol Assess (Full Rep). 2008;162:1-96.
3. American Diabetes Association. Gestational diabetes mellitus. Diabetes Care. 2003;26:S103-S105.
4. Hunt KJ, Schuller KL. The increasing prevalence of diabetes in pregnancy. Obstet Gynecol Clin North Am. 2007;34(2):173-199.
5. Bentley-Lewis R. Late cardiovascular consequences of gesta-tional diabetes mellitus. Semin Reprod Med. 2009;27(4):322-329.
6. Bellamy L, Casas JP, Hingorani AD, Williams D. Type 2 diabetes mellitus after gestational diabetes: a systematic review and meta-analysis. Lancet. 2009;373(9677):1773-1779.
7. Kim C, Newton KM, Knopp RH. Gestational diabetes and the incidence of type 2 diabetes: a systematic review. Diabetes Care. 2002;25(10):1862-1868.
8. Bantle JP, Wylie-Rosett J, Albright AL, et al. Nutrition recom-mendations and interventions for diabetes: a position statement of the American Diabetes Association. Diabetes Care. 2008;31(Suppl 1):S61-S78.
9. Kieffer EC, Sinco B, Kim C. Health behaviors among women of reproductive age with and without a history of gestational diabe-tes mellitus. Diabetes Care. 2006;29(8):1788-1793.
10. Zehle K, Smith BJ, Chey T, McLean M, Bauman AE, Cheung NW. Psychosocial factors related to diet among women with recent gestational diabetes: opportunities for intervention. Diabetes Educ. 2008;34(5):807-814.
at University of Missouri-Columbia on August 26, 2014tde.sagepub.comDownloaded from
Self-Efficacy and Diet Quality in Women With pGDM
Ferranti et al
11
11. Ratner RE, Christophi CA, Metzger BE, et al. Prevention of dia-betes in women with a history of gestational diabetes: effects of metformin and lifestyle interventions. J Clin Endocrinol Metab. 2008;93(12):4774-4779.
12. Tobias DK, Hu FB, Chavarro J, Rosner B, Mozaffarian D, Zhang C. Healthful dietary patterns and type 2 diabetes mellitus risk among women with a history of gestational diabetes mellitus. Arch Intern Med. 2012;172(20):1566-1572.
13. Shyam S, Arshad F, Abdul Ghani R, et al. Low glycaemic index diets improve glucose tolerance and body weight in women with previous history of gestational diabetes: a six months randomized trial. Nutr J. 2013;12:68.
14. Story M, Kaphingst KM, Robinson-O’Brien R, Glanz K. Creating healthy food and eating environments: policy and environmental approaches. Annu Rev Public Health. 2008;29:253-272.
15. Roden J. Revisiting the Health Belief Model: nurses applying it to young families and their health promotion needs. Nurs Health Sci. 2004;6(1):1-10.
16. Champion VL, Skinner CS. The Health Belief Model. In: Glanz K, Rimer BK, Viswanath K, eds. Health Behavior and Health Education. 4th ed. San Francisco, CA: Jossey-Bass; 2008:45-62.
17. Rifas-Shiman SL, Rich-Edwards JW, Kleinman KP, Oken E, Gillman MW. Dietary quality during pregnancy varies by mater-nal characteristics in Project Viva: a US cohort. J Am Diet Assoc. 2009;109(6):1004-1011.
18. Nuss H, Freeland-Graves J, Clarke K, Klohe-Lehman D, Milani TJ. Greater nutrition knowledge is associated with lower 1-year postpartum weight retention in low-income women. J Am Diet Assoc. 2007;107(10):1801-1806.
19. Barker M, Lawrence W, Crozier S, et al. Educational attainment, perceived control and the quality of women’s diets. Appetite. 2009;52(3):631-636.
20. Campbell MK, McLerran D, Turner-McGrievy G, et al. Mediation of adult fruit and vegetable consumption in the National 5 a Day for Better Health community studies. Ann Behav Med. 2008;35(1):49-60.
21. Jacka FN, Pasco JA, Mykletun A, et al. Association of western and traditional diets with depression and anxiety in women. Am J Psychiatry. 2010;167(3):305-311.
22. Leung BM, Kaplan BJ. Perinatal depression: prevalence, risks, and the nutrition link—a review of the literature. J Am Diet Assoc. 2009;109(9):1566-1575.
23. Bodnar LM, Wisner KL. Nutrition and depression: implications for improving mental health among childbearing-aged women. Biol Psychiatry. 2005;58(9):679-685.
24. NutritionQuest. Assessment Tools and Analysis Services. Available at: http://www.nutritionquest.com/assessment/. Accessed December 12, 2013.
25. Subar AF, Thompson FE, Kipnis V, et al. Comparative validation of the Block, Willett, and National Cancer Institue food frequency questionnaires. Am J Epidemiol. 2001;154(12):1089-1099.
26. Boucher B, Cotterchio M, Kreiger N, Nadalin V, Block T, Block G. Validity and reliability of the Block98 food-frequency ques-tionnaire in a sample of Canadian women. Public Health Nutr. 2006;9(1):84-93.
27. McCullough ML, Feskanich D, Stampfer MJ, et al. Diet quality and major chronic disease risk in men and women: moving toward improved dietary guidance. Am J Clin Nutr. 2002;76(6):1261-1271.
28. US Department of Agriculture. Healthy Eating Index. Available at: http://www.cnpp.usda.gov/healthyeatingindex.htm. Accessed December 16, 2013.
29. Fung TT, McCullough M, van Dam RM, Hu FB. A prospective study of overall diet quality and risk of type 2 diabetes in women. Diabetes Care. 2007;30(7):1753-1757.
30. Belin RJ, Greenland P, Allison M, et al. Diet quality and the risk of cardiovascular disease: the Women’s Health Initiative. Am J Clin Nutr. 2011;94(1):49-57.
31. Reedy J, Mitrou PN, Krebs-Smith SM, et al. Index-based dietary patterns and risk of colorectal cancer: the NIH-AARP Diet and Health Study. Am J Epidemiol. 2008;168(1):38-48.
32. Akbaraly TN, Singh-Manoux A, Tabak AG, et al. Overall diet history and reversibility of the metabolic syndrome over 5 years: the Whitehall II prospective cohort study. Diabetes Care. 2010;33(11):2339-2341.
33. Walker EA, Fisher E, Marrero DG, McNabb W. Comparative risk judgements among participants in the Diabetes Prevention Program [abstract]. Diabetes. 2001;50:A397.
34. Kim C, McEwen LN, Piette JD, Goewey J, Ferrara A, Walker EA. Risk perception for diabetes among women with histories of ges-tational diabetes mellitus. Diabetes Care. 2007;30(9):2281-2286.
35. Fowles ER, Feucht J. Testing the barriers to healthy eating scale. West J Nurs Res. 2004;26(4):429-443.
36. Hickey ML, Owen SV, Froman RD. Instrument development: car-diac diet and exercise self-efficacy. Nurs Res. 1992;41(6):347-351.
37. Zoellner J, Bounds W, Connell C. Community health advisors’ perceptions of the 2005 dietary guidelines and MyPyramid. J Extension. 2009;47(2):20.
38. US Department of Agriculture, US Department of Health and Human Services. Dietary Guidelines for Americans, 2010. 7th ed. Washington, DC: US Government Printing Office; 2010.
39. Kroenke K, Spitzer RL, Williams JB. The PHQ-9: validity of a brief depression severity measure. J Gen Intern Med. 2001;16(9):606-613.
40. Pinto-Meza A, Serrano-Blanco A, Penarrubia MT, Blanco E, Haro JM. Assessing depression in primary care with the PHQ-9: can it be carried out over the telephone? J Gen Intern Med. 2005;20(8):738-742.
41. Hiza HA, Casavale KO, Guenther PM, Davis CA. Diet quality of Americans differs by age, sex, race/ethnicity, income, and educa-tion level. J Acad Nutr Diet. 2012;113(12):297-306.
42. Morrison MK, Koh D, Lowe JM, et al. Postpartum diet quality in Australian women following a gestational diabetes pregnancy. Eur J Clin Nutr. 2012;66(10):1160-1165.
43. Taggart J, Williams A, Dennis S, et al. A systematic review of interventions in primary care to improve health literacy for chronic disease behavioral risk factors. BMC Fam Pract. 2012;13:49.
44. Dickson-Spillmann M, Siegrist M. Consumers’ knowledge of healthy diets and its correlation with dietary behaviour. J Hum Nutr Diet. 2011;24(1):54-60.
45. Baptiste-Roberts K, Gary TL, Beckles GL, et al. Family history of diabetes, awareness of risk factors, and health behaviors among African Americans. Am J Public Health. 2007;97(5):907-912.
46. Shaikh AR, Yaroch AL, Nebeling L, Yeh MC, Resnicow K. Psychosocial predictors of fruit and vegetable consumption in adults: a review of the literature. Am J Prev Med. 2008;34(6):535-543.
47. Wright K, Norris K, Newman Giger J, Suro Z. Improving healthy dietary behaviors, nutrition knowledge, and self-efficacy among
at University of Missouri-Columbia on August 26, 2014tde.sagepub.comDownloaded from
Volume XX, Number X, Month/Month 2014
The Diabetes EDUCATOR
12
underserved school children with parent and community involve-ment. Child Obes. 2012;8(4):347-356.
48. Shin H, Shin J, Liu PY, Dutton GR, Abood DA, Ilich JZ. Self-efficacy improves weight loss in overweight/obese postmeno-pausal women during a 6-month weight loss intervention. Nutr Res. 2011;31(11):822-828.
49. Kreausukon P, Gellert P, Lippke S, Schwarzer R. Planning and self-efficacy can increase fruit and vegetable consumption: a randomized controlled trial. J Behav Med. 2012;35(4):443-451.
50. Luszczynska A, Tryburcy M, Schwarzer R. Improving fruit and vegetable consumption: a self-efficacy intervention compared with a combined self-efficacy and planning intervention. Health Educ Res. 2007;22(5):630-638.
51. Ervin RB. Healthy Eating Index—2005 total and component scores for adults aged 20 and over: National Health and Nutrition Examination Survey, 2003-2004. Natl Health Stat Report. 2011(44):1-9.
52. Shannon J, Shikany JM, Barrett-Connor E, et al. Demographic factors associated with the diet quality of older US men: baseline data from the Osteoporotic Fractures in Men (MrOS) study. Public Health Nutr. 2007;10(8):810-818.
53. Akbaraly TN, Brunner EJ, Ferrie JE, Marmot MG, Kivimaki M, Singh-Manoux A. Dietary pattern and depressive symptoms in middle age. Br J Psychiatry. 2009;195(5):408-413.
54. Appelhans BM, Whited MC, Schneider KL, et al. Depression severity, diet quality, and physical activity in women with obesity and depression. J Acad Nutr Diet. 2012;112(5):693-698.
55. Kaiser B, Razurel C. Determinants of postpartum physical activ-ity, dietary habits and weight loss after gestational diabetes mel-litus. J Nurs Manag. 2013;21(1):58-69.
56. Pawlak R, Colby S. Benefits, barriers, self-efficacy and knowl-edge regarding healthy foods; perception of African Americans living in eastern North Carolina. Nutr Res Pract. 2009;3(1):56-63.
57. Holgado B, de Irala-Estevez J, Martinez-Gonzalez MA, Gibney M, Kearney J, Martinez JA. Barriers and benefits of a healthy diet in Spain: comparison with other European member states. Eur J Clin Nutr. 2000;54(6):453-459.
58. Nicklas JM, Zera CA, Seely EW, Abdul-Rahim ZS, Rudloff ND, Levkoff SE. Identifying postpartum intervention approaches to prevent type 2 diabetes in women with a history of gestational diabetes. BMC Pregnancy Childbirth. 2011;11:23.
59. Mumford SL, Siega-Riz AM, Herring A, Evenson KR. Dietary restraint and gestational weight gain. J Am Diet Assoc. 2008;108(10):1646-1653.
60. Fowles ER, Bryant M, Kim S, et al. Predictors of dietary quality in low-income pregnant women: a path analysis. Nurs Res. 2011;60(5):286-294.
61. Haghighatdoost F, Karimi G, Esmaillzadeh A, Azadbakht L. Sleep deprivation is associated with lower diet quality indi-ces and higher rate of general and central obesity among young female students in Iran. Nutrition. 2012;28(11-12): 1146-1150.
For reprints and permission queries, please visit SAGE’s Web site at http://www.sagepub.com/journalsPermissions.nav.
at University of Missouri-Columbia on August 26, 2014tde.sagepub.comDownloaded from