dietary exposure assessment of toxic chemicals lecture material - food safety budi widianarko -...
TRANSCRIPT
DIETARY EXPOSURE ASSESSMENT of Toxic Chemicals
Lecture Material - Food SafetyBudi Widianarko - UNIKA SOEGIJAPRANATA
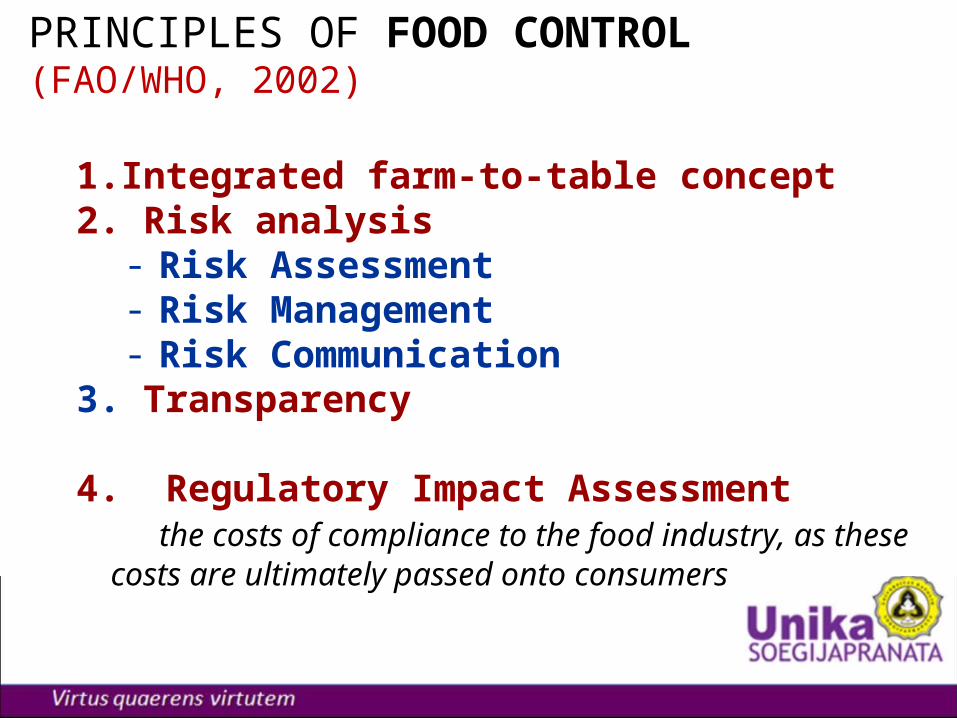
PRINCIPLES OF FOOD CONTROL(FAO/WHO, 2002)
1.Integrated farm-to-table concept2. Risk analysis
- Risk Assessment- Risk Management- Risk Communication
3. Transparency
4. Regulatory Impact Assessment the costs of compliance to the food industry, as these
costs are ultimately passed onto consumers
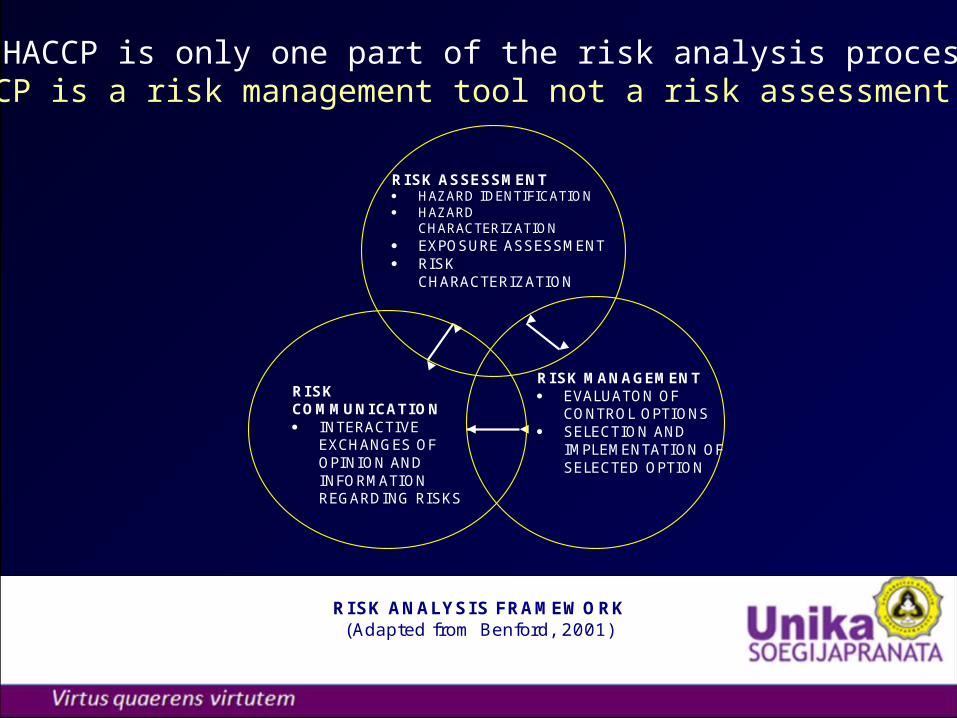
HACCP is only one part of the risk analysis processHACCP is a risk management tool not a risk assessment tool
RISK ANALYSIS FRAMEWORK (Adapted from Benford, 2001)
RISK ASSESSMENT HAZARD IDENTIFICATION HAZARD
CHARACTERIZATION EXPOSURE ASSESSMENT RISK
CHARACTERIZATION
RISK MANAGEMENT EVALUATON OF
CONTROL OPTIONS SELECTION AND
IMPLEMENTATION OF SELECTED OPTION
RISK COMMUNICATION INTERACTIVE
EXCHANGES OF OPINION AND INFORMATION REGARDING RISKS
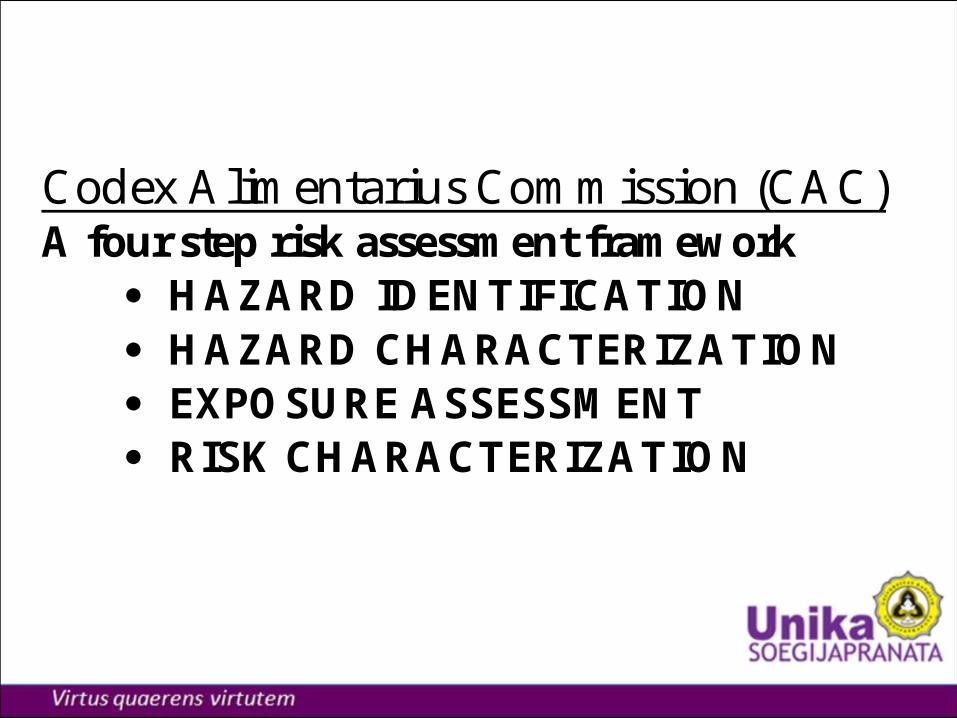
Codex Alimentarius Commission (CAC) A four step risk assessment framework
HAZARD IDENTIFICATION HAZARD CHARACTERIZATION EXPOSURE ASSESSMENT RISK CHARACTERIZATION
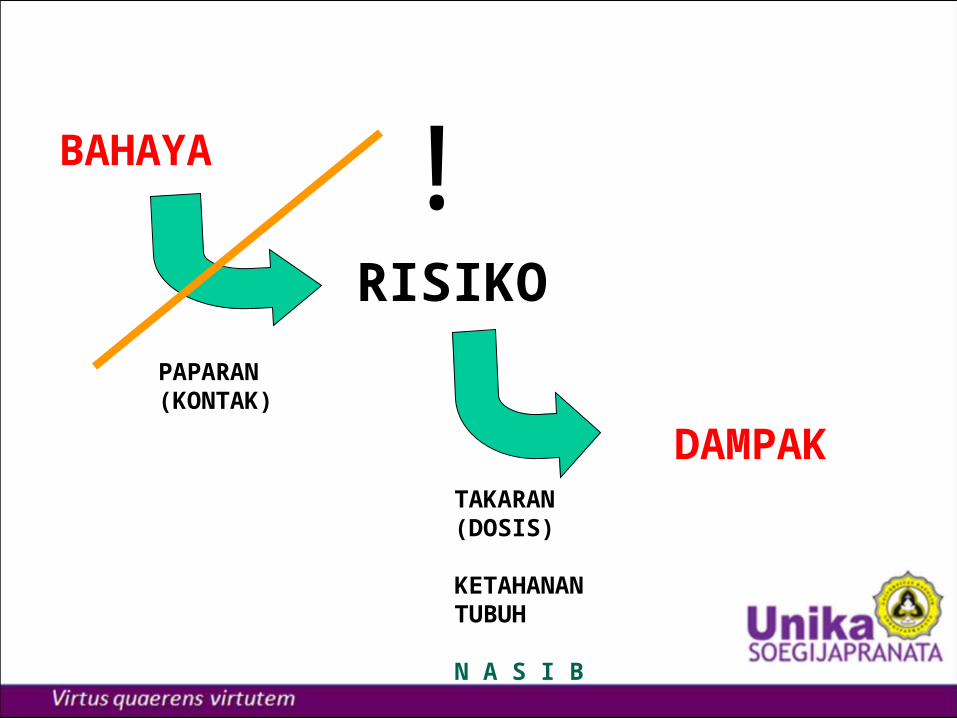
BAHAYA
RISIKO
DAMPAK
PAPARAN(KONTAK)
TAKARAN(DOSIS)
KETAHANANTUBUH
N A S I B
!
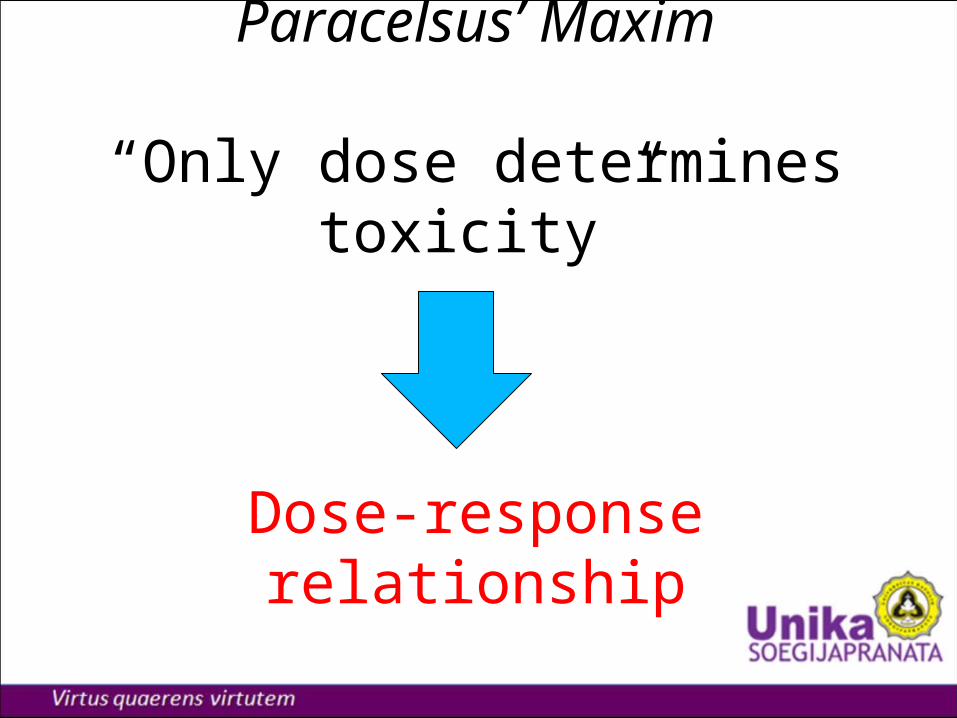
Paracelsus’ Maxim
“Only dose determines toxicity”
Dose-response relationship
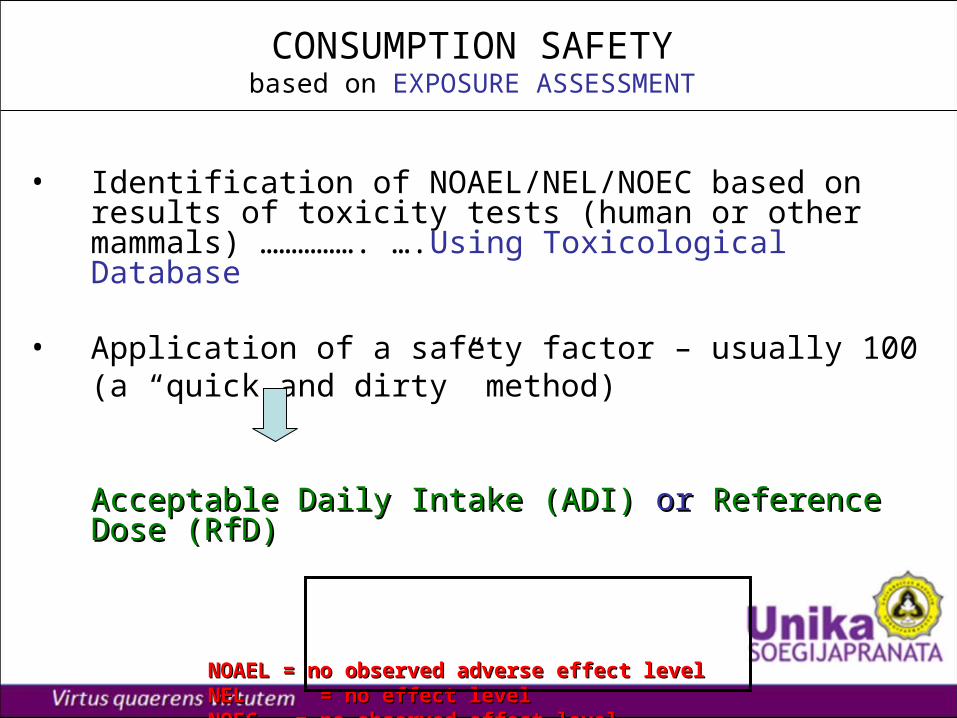
CONSUMPTION SAFETYbased on EXPOSURE ASSESSMENT
• Identification of NOAEL/NEL/NOEC based on results of toxicity tests (human or other mammals) ……………. ….Using Toxicological Database
• Application of a safety factor – usually 100(a “quick and dirty” method)
Acceptable Daily Intake (ADI) Acceptable Daily Intake (ADI) or or Reference Dose (RfD)Reference Dose (RfD)
NOAEL = no observed adverse effect levelNOAEL = no observed adverse effect levelNEL = no effect levelNEL = no effect levelNOEC = no observed effect levelNOEC = no observed effect level
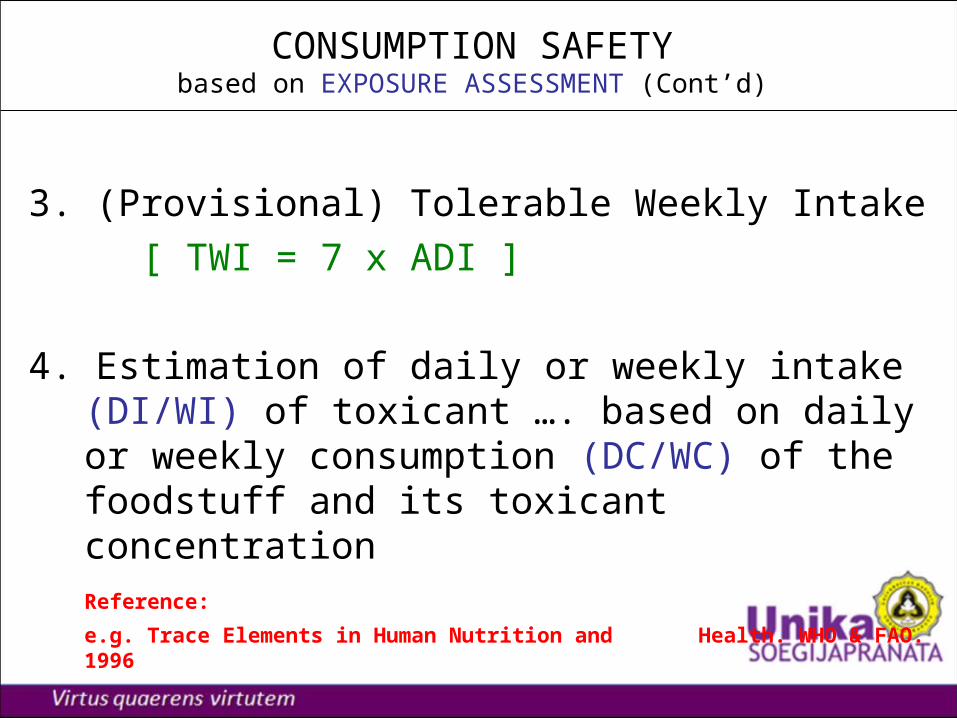
CONSUMPTION SAFETYbased on EXPOSURE ASSESSMENT (Cont’d)
3. (Provisional) Tolerable Weekly Intake
[ TWI = 7 x ADI ]
4. Estimation of daily or weekly intake (DI/WI) of toxicant …. based on daily or weekly consumption (DC/WC) of the foodstuff and its toxicant concentration
Reference:
e.g. Trace Elements in Human Nutrition and Health. WHO & FAO. 1996
CONSUMPTION SAFETYbased on EXPOSURE ASSESSMENT (Cont’d)
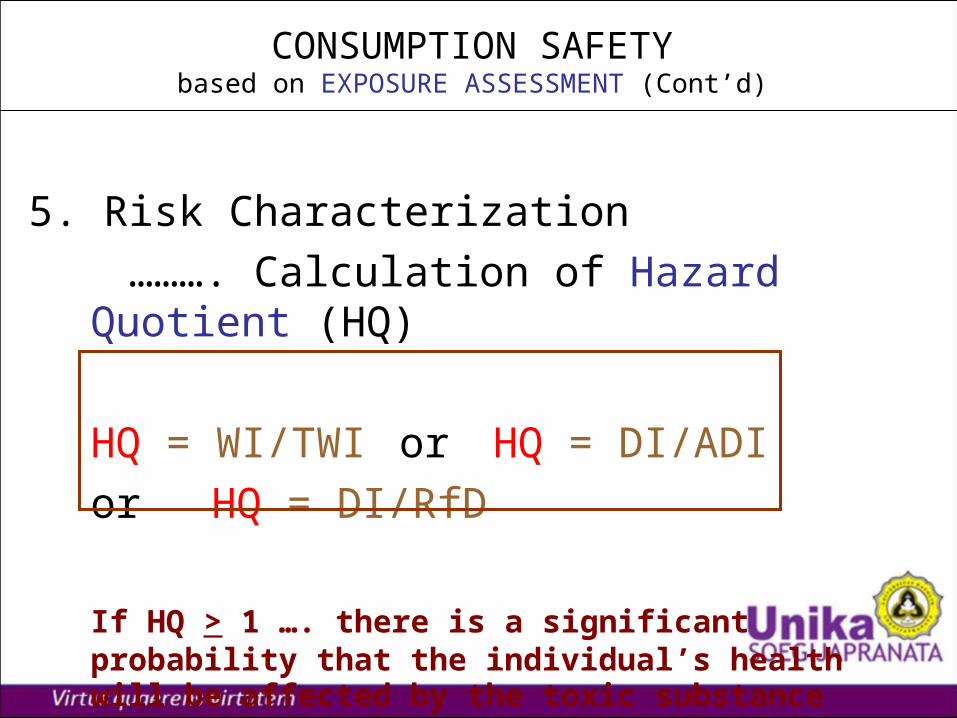
5. Risk Characterization
………. Calculation of Hazard Quotient (HQ)
HQ = WI/TWI or HQ = DI/ADI
or HQ = DI/RfD
If HQ > 1 …. there is a significant probability that the individual’s health will be affected by the toxic substance
CONSUMPTION SAFETYbased on EXPOSURE ASSESSMENT (Cont’d)
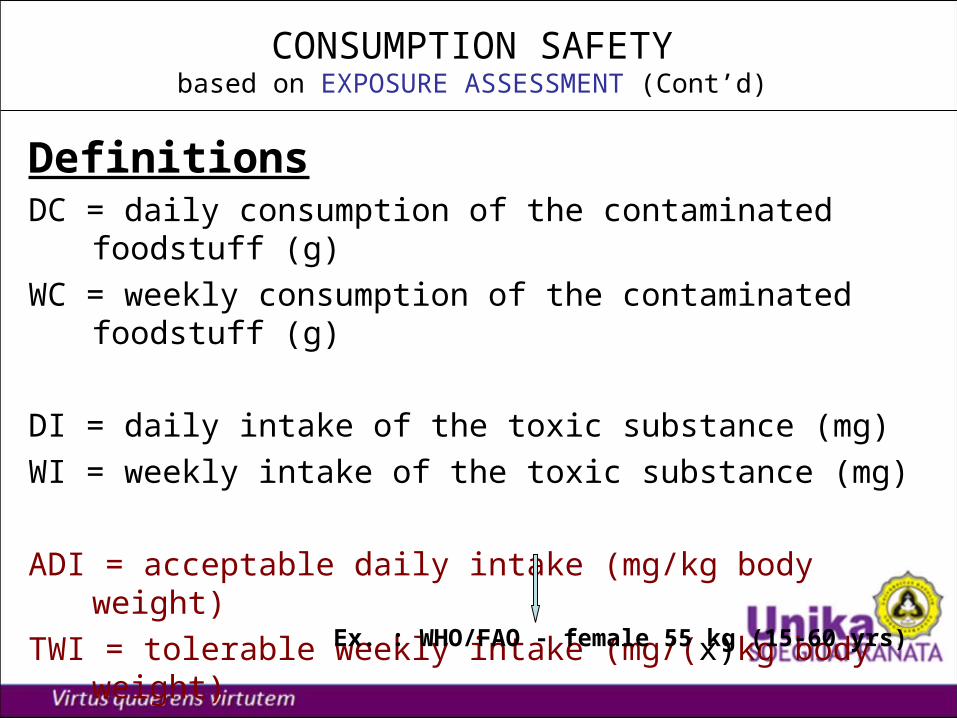
DefinitionsDC = daily consumption of the contaminated foodstuff (g)
WC = weekly consumption of the contaminated foodstuff (g)
DI = daily intake of the toxic substance (mg)
WI = weekly intake of the toxic substance (mg)
ADI = acceptable daily intake (mg/kg body weight)
TWI = tolerable weekly intake (mg/(x)kg body weight)
Ex. : WHO/FAO - female 55 kg (15-60 yrs)
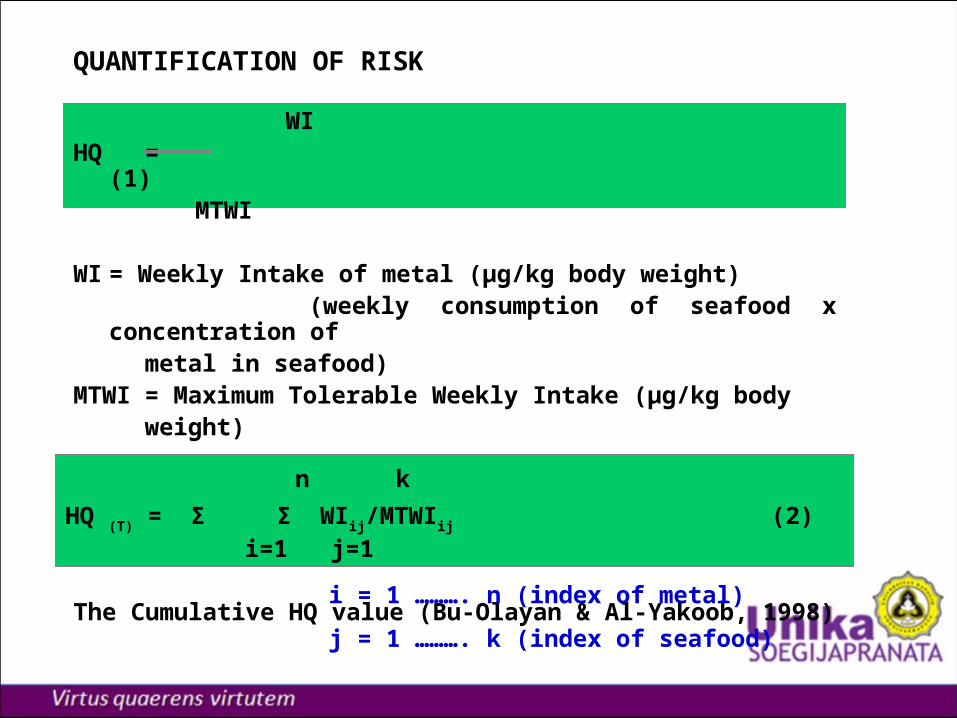
QUANTIFICATION OF RISK
WIHQ = (1)
MTWI
WI = Weekly Intake of metal (μg/kg body weight) (weekly consumption of seafood x concentration of
metal in seafood) MTWI = Maximum Tolerable Weekly Intake (μg/kg body
weight)
(WHO, 1996; Cu & Zn: Upper Limit of The Safe Range)
The Cumulative HQ value (Bu-Olayan & Al-Yakoob, 1998)
n k
HQ (T) = Σ Σ WIij/MTWIij (2) i=1 j=1
i = 1 ………. n (index of metal)
j = 1 ………. k (index of seafood)
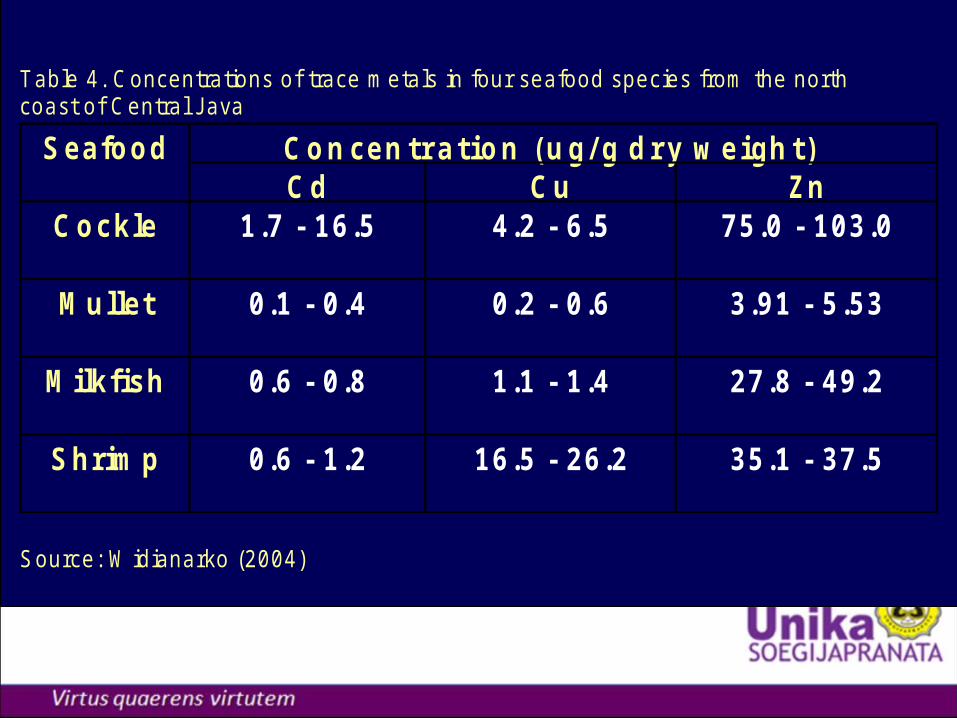
T ab le 4 . C oncen tra tions o f trace m eta ls in fou r sea food spec ies from the no rth coast o f C en tra l Java
S ource : W id ianarko (2004)
S e a fo o d Concentration (ug/ g dry w eight)C d C u Z n
C o c k le 1 .7 - 1 6 .5 4 .2 - 6 .5 7 5 .0 - 1 0 3 .0
M u lle t 0 .1 - 0 .4 0 .2 - 0 .6 3 .9 1 - 5 .5 3
M ilk fis h 0 .6 - 0 .8 1 .1 - 1 .4 2 7 .8 - 4 9 .2
S h rim p 0 .6 - 1 .2 1 6 .5 - 2 6 .2 3 5 .1 - 3 7 .5
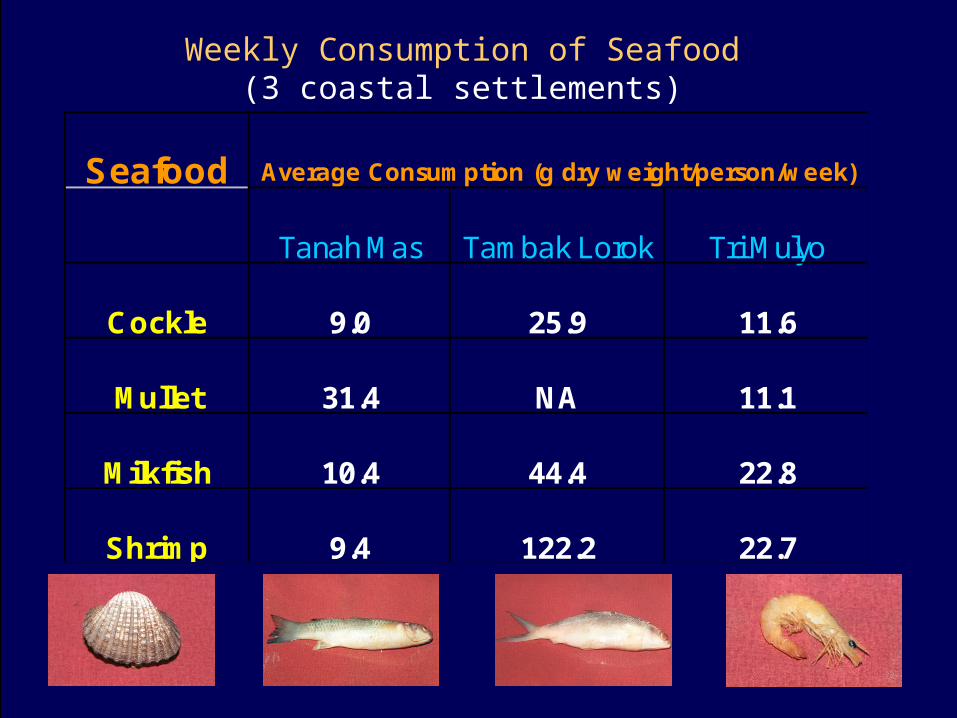
Seafood Average Consumption (g dry weight/person/week)
Tanah Mas Tambak Lorok Tri Mulyo
Cockle 9.0 25.9 11.6
Mullet 31.4 NA 11.1
Milkfish 10.4 44.4 22.8
Shrimp 9.4 122.2 22.7
Weekly Consumption of Seafood(3 coastal settlements)
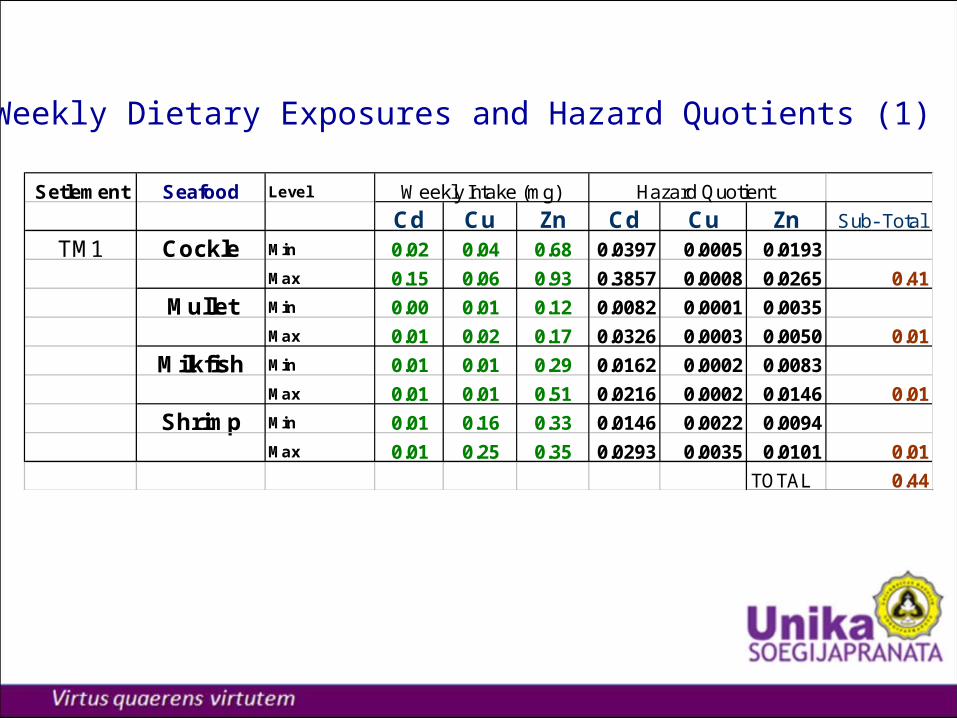
Setlement Seafood Level Weekly Intake (mg) Hazard Quotient
Cd Cu Zn Cd Cu Zn Sub- Total
TM1 Cockle Min 0.02 0.04 0.68 0.0397 0.0005 0.0193
Max 0.15 0.06 0.93 0.3857 0.0008 0.0265 0.41
Mullet Min 0.00 0.01 0.12 0.0082 0.0001 0.0035
Max 0.01 0.02 0.17 0.0326 0.0003 0.0050 0.01
Milkfish Min 0.01 0.01 0.29 0.0162 0.0002 0.0083
Max 0.01 0.01 0.51 0.0216 0.0002 0.0146 0.01
Shrimp Min 0.01 0.16 0.33 0.0146 0.0022 0.0094
Max 0.01 0.25 0.35 0.0293 0.0035 0.0101 0.01
TOTAL 0.44
Weekly Dietary Exposures and Hazard Quotients (1)
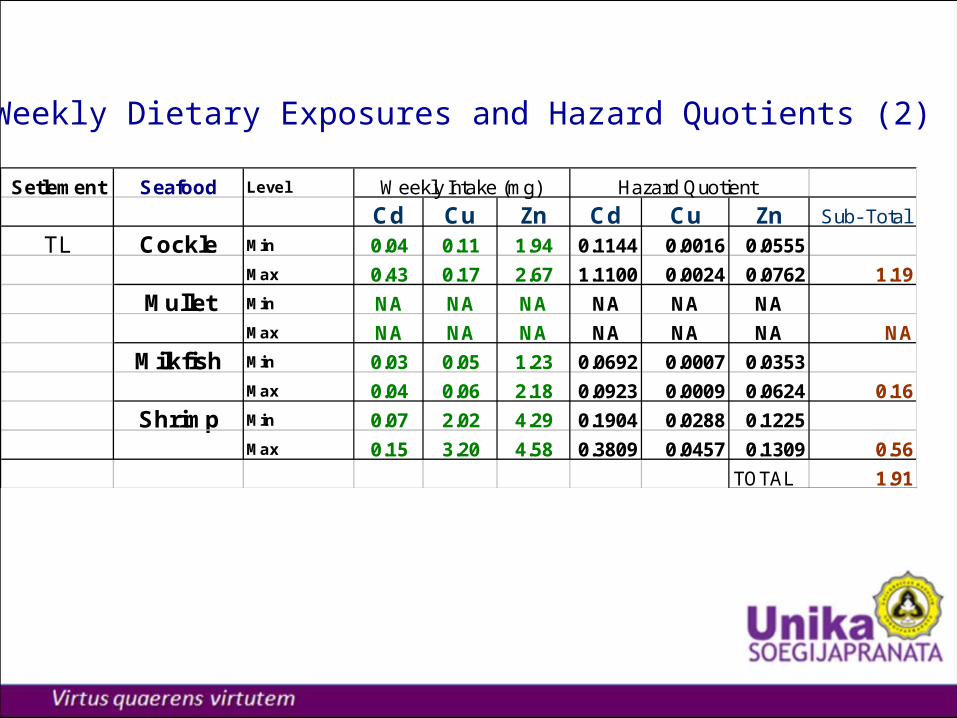
Setlement Seafood Level Weekly Intake (mg) Hazard Quotient
Cd Cu Zn Cd Cu Zn Sub- Total
TL Cockle Min 0.04 0.11 1.94 0.1144 0.0016 0.0555
Max 0.43 0.17 2.67 1.1100 0.0024 0.0762 1.19
Mullet Min NA NA NA NA NA NA
Max NA NA NA NA NA NA NA
Milkfish Min 0.03 0.05 1.23 0.0692 0.0007 0.0353
Max 0.04 0.06 2.18 0.0923 0.0009 0.0624 0.16
Shrimp Min 0.07 2.02 4.29 0.1904 0.0288 0.1225
Max 0.15 3.20 4.58 0.3809 0.0457 0.1309 0.56
TOTAL 1.91
Weekly Dietary Exposures and Hazard Quotients (2)
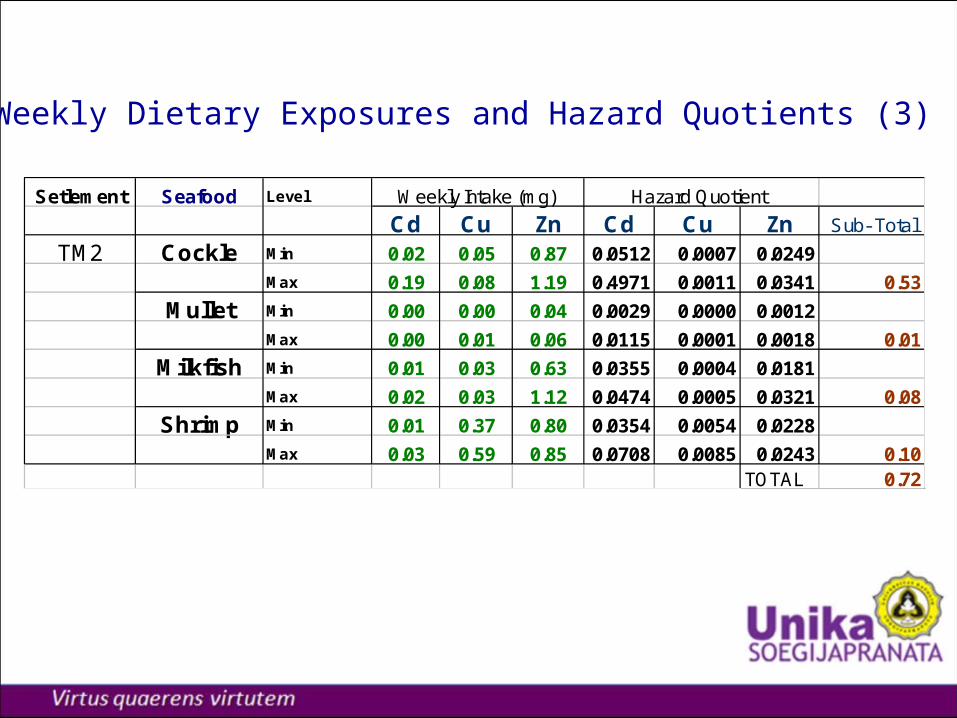
Setlement Seafood Level Weekly Intake (mg) Hazard Quotient
Cd Cu Zn Cd Cu Zn Sub- Total
TM2 Cockle Min 0.02 0.05 0.87 0.0512 0.0007 0.0249
Max 0.19 0.08 1.19 0.4971 0.0011 0.0341 0.53
Mullet Min 0.00 0.00 0.04 0.0029 0.0000 0.0012
Max 0.00 0.01 0.06 0.0115 0.0001 0.0018 0.01
Milkfish Min 0.01 0.03 0.63 0.0355 0.0004 0.0181
Max 0.02 0.03 1.12 0.0474 0.0005 0.0321 0.08
Shrimp Min 0.01 0.37 0.80 0.0354 0.0054 0.0228
Max 0.03 0.59 0.85 0.0708 0.0085 0.0243 0.10TOTAL 0.72
Weekly Dietary Exposures and Hazard Quotients (3)
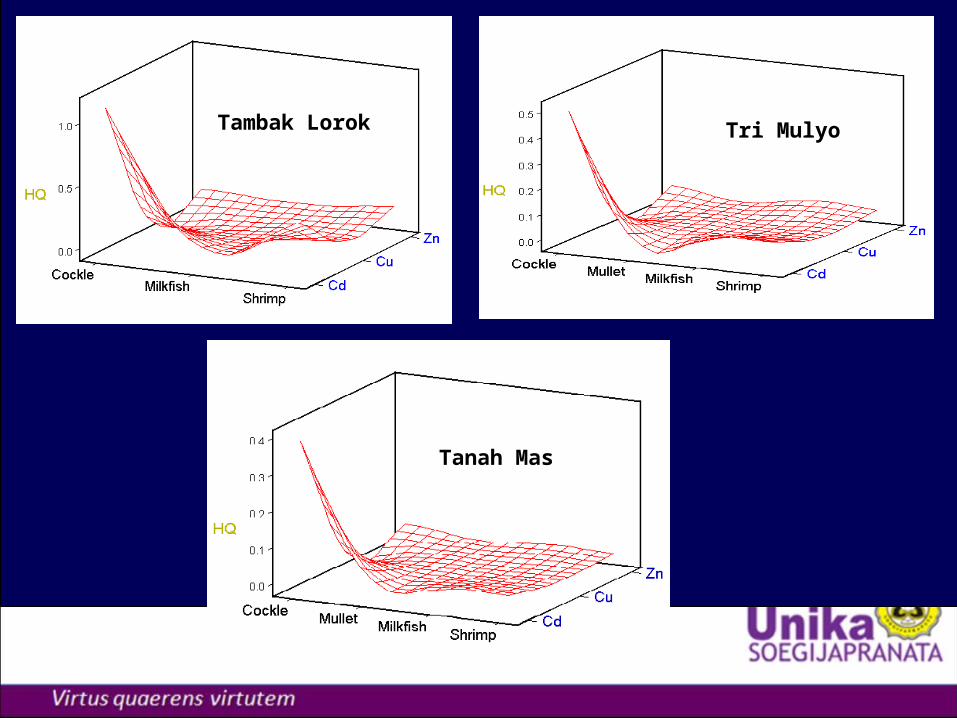
Tambak Lorok Tri Mulyo
Tanah Mas
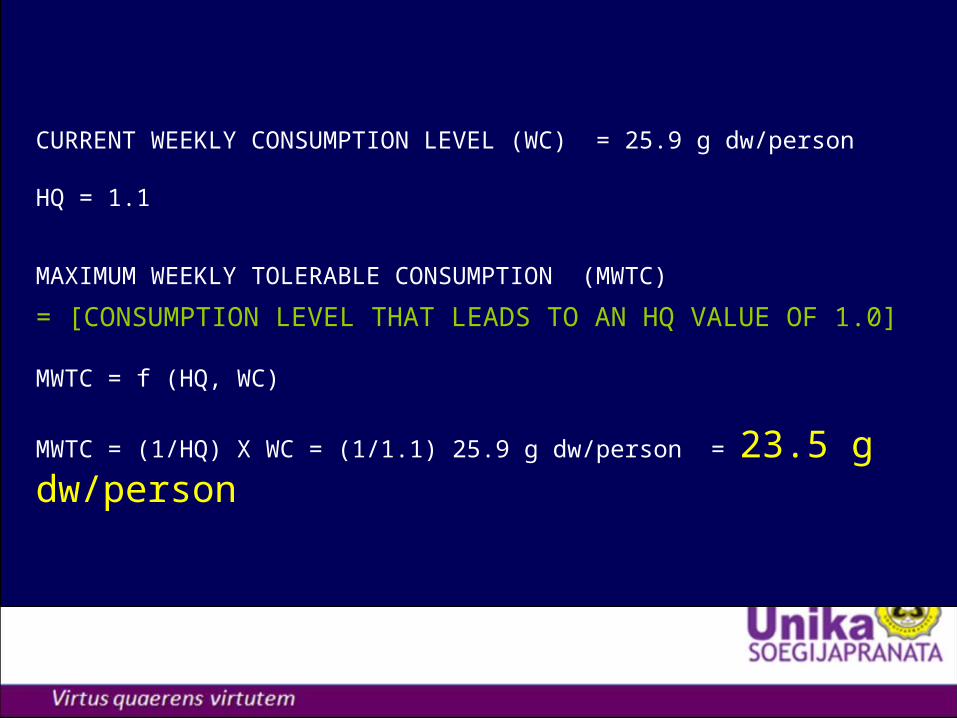
CURRENT WEEKLY CONSUMPTION LEVEL (WC) = 25.9 g dw/person
HQ = 1.1
MAXIMUM WEEKLY TOLERABLE CONSUMPTION (MWTC)
= [CONSUMPTION LEVEL THAT LEADS TO AN HQ VALUE OF 1.0]
MWTC = f (HQ, WC)
MWTC = (1/HQ) X WC = (1/1.1) 25.9 g dw/person = 23.5 g dw/person
• THE MELAMINE CASE
• In summary, excluding infant formula and assuming that 50% of the diet is contaminated at a level of 2.5 ppm melamine and its analogs, there is a 1000-fold difference between the estimated dietary exposure (intake) and the level of melamine that does not cause toxicity in animals (NOAEL). Thus, levels of melamine and its analogues below 2.5 ppm in foods other than infant formula do not raise public health concerns.
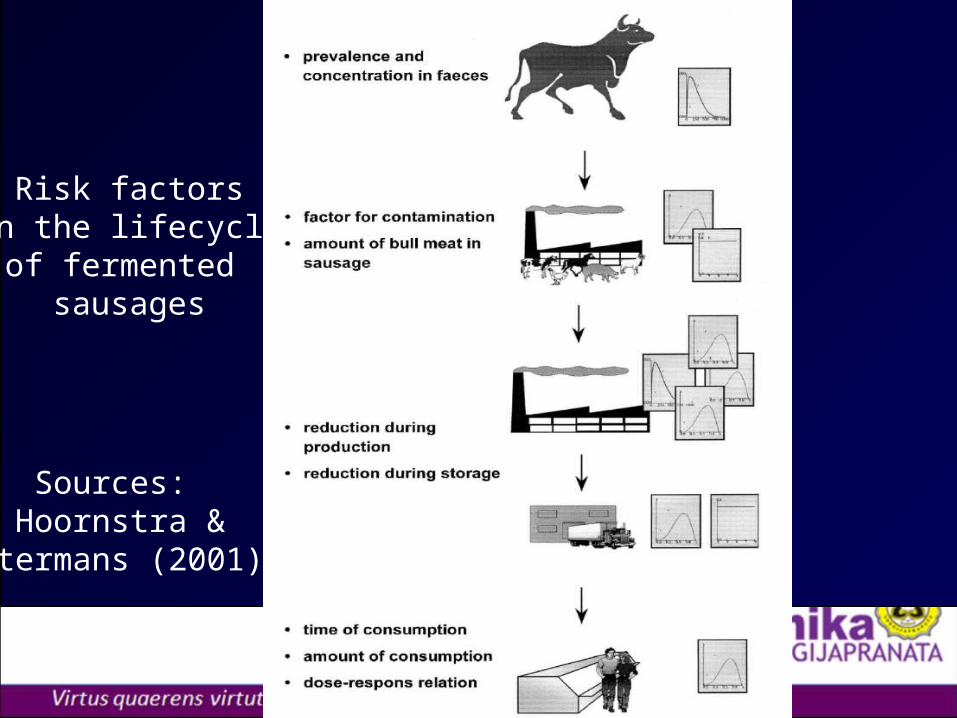
Sources: Hoornstra &
Notermans (2001)
Risk factorsin the lifecycleof fermented
sausages
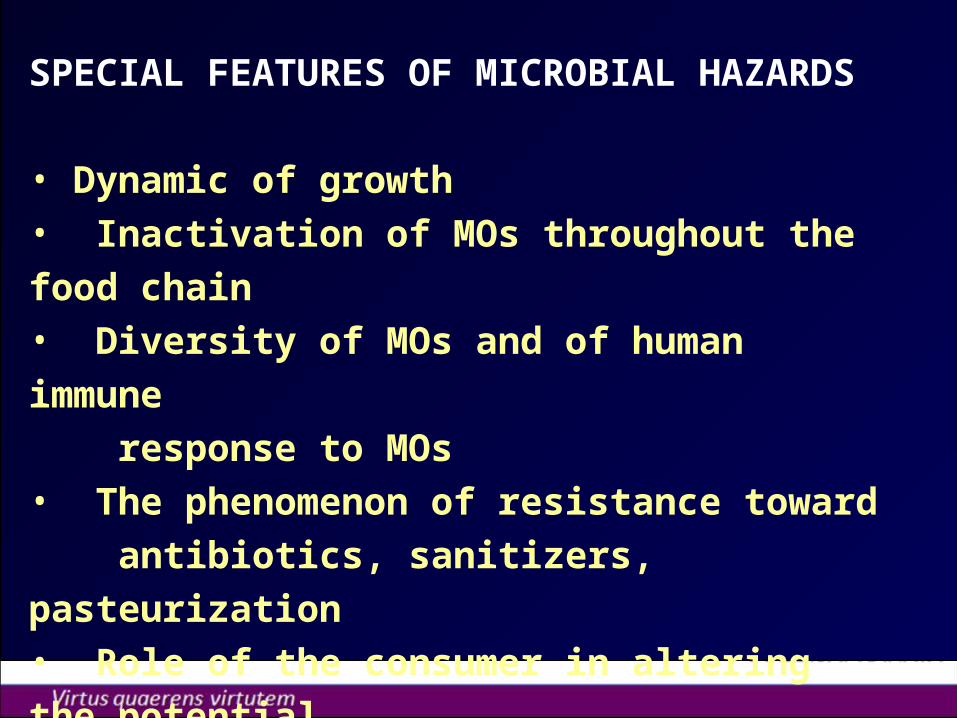
SPECIAL FEATURES OF MICROBIAL HAZARDS
• Dynamic of growth• Inactivation of MOs throughout the food chain• Diversity of MOs and of human immune response to MOs• The phenomenon of resistance toward antibiotics, sanitizers, pasteurization• Role of the consumer in altering the potential risk outcome through food handling and preparation
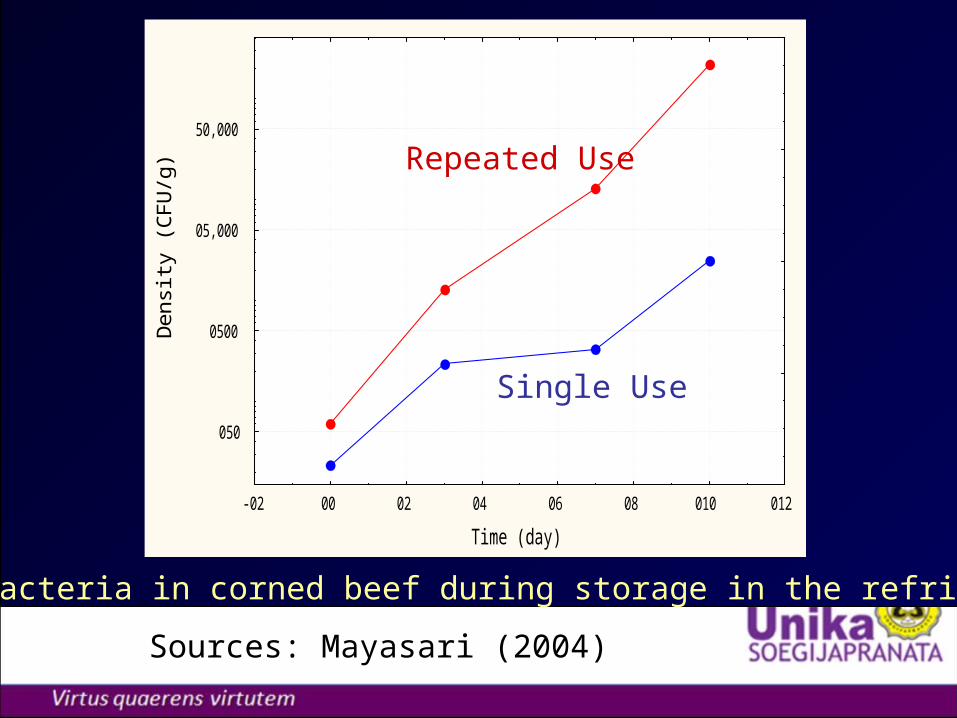
Growth of bacteria in corned beef during storage in the refrigerator
-02 00 02 04 06 08 010 012
Time (day)
050
0500
05,000
50,000
Den
sity
(C
FU/g
)
Single Use
Repeated Use
Sources: Mayasari (2004)
BUZZ GROUPS