diet composition and feeding habits of common fishes in long island bays, new york
TRANSCRIPT

BioOne sees sustainable scholarly publishing as an inherently collaborative enterprise connecting authors, nonprofit publishers,academic institutions, research libraries, and research funders in the common goal of maximizing access to critical research.
Diet Composition and Feeding Habits of Common Fishes in LongIsland Bays, New YorkAuthor(s): Skyler R. Sagarese, Robert M. Cerrato and Michael G. FriskSource: Northeastern Naturalist, 18(3):291-314. 2011.Published By: Eagle Hill InstituteDOI: http://dx.doi.org/10.1656/045.018.0304URL: http://www.bioone.org/doi/full/10.1656/045.018.0304
BioOne (www.bioone.org) is a nonprofit, online aggregation of core research in thebiological, ecological, and environmental sciences. BioOne provides a sustainable onlineplatform for over 170 journals and books published by nonprofit societies, associations,museums, institutions, and presses.
Your use of this PDF, the BioOne Web site, and all posted and associated content indicatesyour acceptance of BioOne’s Terms of Use, available at www.bioone.org/page/terms_of_use.
Usage of BioOne content is strictly limited to personal, educational, and non-commercialuse. Commercial inquiries or rights and permissions requests should be directed to theindividual publisher as copyright holder.
NORTHEASTERN NATURALIST2011 18(3):291–314
Diet Composition and Feeding Habits of Common Fishes in Long Island Bays, New York
Skyler R. Sagarese1,*, Robert M. Cerrato1, and Michael G. Frisk1
Abstract - Developing models in support of ecosystem-based management requires knowledge of trophic dynamics of ecologically important species. A paucity of data on these dynamics for Long Island fi nfi sh is hindering development of ecosystem models required by recent legislation. In this study, we analyzed stomach contents of common fi shes collected from Port Jefferson Harbor, Great South Bay, and Shinnecock Bay be-tween May and October of 2007 and 2008. General diet composition was described by percent by number (%N), percent by weight (%W), percent frequency of occurrence (%O), and percent index of relative importance (%IRI) for seven species: Paralichthys dentatus (Summer Flounder), young-of-the-year (YOY) Pomatomus saltatrix (Bluefi sh), Prionotus evolans (Striped Searobin), Stenotomus chrysops (Scup), Scophthalmus aquo-sus (Windowpane Flounder), Raja eglanteria (Clearnose Skate), and Morone saxatilis(Striped Bass). Temporal diet composition was estimated for the consistently abundant YOY Bluefi sh, Summer Flounder, and Scup, where most nseason > 25. Subsampling of large catches of YOY Bluefi sh and Scup led to investigation of diet composition by cluster sampling. Important prey included Crangon sp. (sand shrimp), Cancer irroratus(Rock Crab), and forage fi shes. Pseudopleuronectes americanus (Winter Flounder), once a common prey item in stomachs of piscivorous Long Island fi shes, contributed 6.7 %O and 1.6 %W to the diets of Summer Flounder, Striped Searobin, Striped Bass, and YOY Bluefi sh. These changes may be due to shifts in the abundance of prey items or changes in spatial overlap of predator and prey.
Introduction
Ecosystem-based management of fi sh stocks using multispecies models has gained favor in recent decades. This approach yields information about sustain-ability while incorporating the effects of ecological processes such as predation among interacting populations (Latour et al. 2003, Link 2002). The complexity of multispecies models poses several challenges to managers and scientists, including greater parameterization and additional data requirements (Latour et al. 2003). A quantitative understanding of piscivorous predation on fi shes is paramount in understanding trophic dynamics and constructing food-web models utilized by ecosystem-based management (Pauly et al. 2000, Steimle et al. 2000). The State of New York has recently invested signifi cant resources into develop-ing ecosystem models and infrastructure to support development of ecosystem management for Long Island’s bays and estuaries (New York Ocean and Great Lakes Ecosystem Conservation Act 2006). Presently, there is a need to conduct trophic analyses in support of these activities and to report indices in a consistent manner so that estimates of predator and prey relationships are comparable both spatially and temporally (Cortés 1997).
1School of Marine and Atmospheric Sciences, Stony Brook University, Stony Brook, NY 11794. *Corresponding author - [email protected].
Northeastern Naturalist Vol. 18, No. 3292
Trophic interactions and feeding habits of fi shes have been described in detail for most mid-Atlantic estuaries and bays, with the exception of Long Island, NY, waters. With more than 30 bays and 450 km of coastline surrounding Long Island (Engers and Buckner 2000), trophic interactions among fi shes have received far less attention than in the neighboring Hudson-Raritan estuary of New York and New Jersey (Buckel and Conover 1997; Buckel et al. 1999; Gardinier and Hoff 1982; Hurst and Conover 2001; Juanes et al. 1993, 1994; Mancini and Able 2005; Stehlik and Meise 2000; Steimle et al. 2000). The few studies that have examined feeding habits of predatory fi shes in Long Island bays over the last 50 years fo-cused solely on species collected from Great South Bay, including Paralichthys dentatus L. (Summer Flounder; Poole 1964), young-of-the-year (YOY) Pomato-mus saltatrix L. (Bluefi sh; Juanes and Conover 1995, Juanes et al. 1994), and Prionotus evolans L. (Striped Searobin; Schreiber 1973) or from western Long Island bays (Manhasset, Jamaica, and Little Neck bays) including Morone saxa-tilis Walbaum (Striped Bass) and YOY Bluefi sh (Buckel and McKown 2002). A lack of data concerning trophic interactions of fi shes in Long Island systems has hampered a shift towards ecosystem-based fi sheries management in the State of New York as mandated by the New York Ocean and Great Lakes Ecosystem Conservation Act (ECL Article 14). This recent legislation “encourages scientifi c research and information sharing that will inform ecosystem-based manage-ment decisions and enhance ecosystem management capabilities” in New York’s Coastal Waters (New York Ocean and Great Lakes Ecosystem Conservation Act 2006). The purpose of this paper is to provide an understanding of general and temporal diet composition of common fi shes present in Long Island waters. Gen-eral diet composition is reported in standard indices and is examined assuming simple random sampling, while diet composition via cluster sampling provides population-level diet composition when appropriate. The presented diet composi-tion is discussed relative to intermittent historical studies to elucidate long-term change in the trophic dynamics of Long Island bays.
Materials and Methods
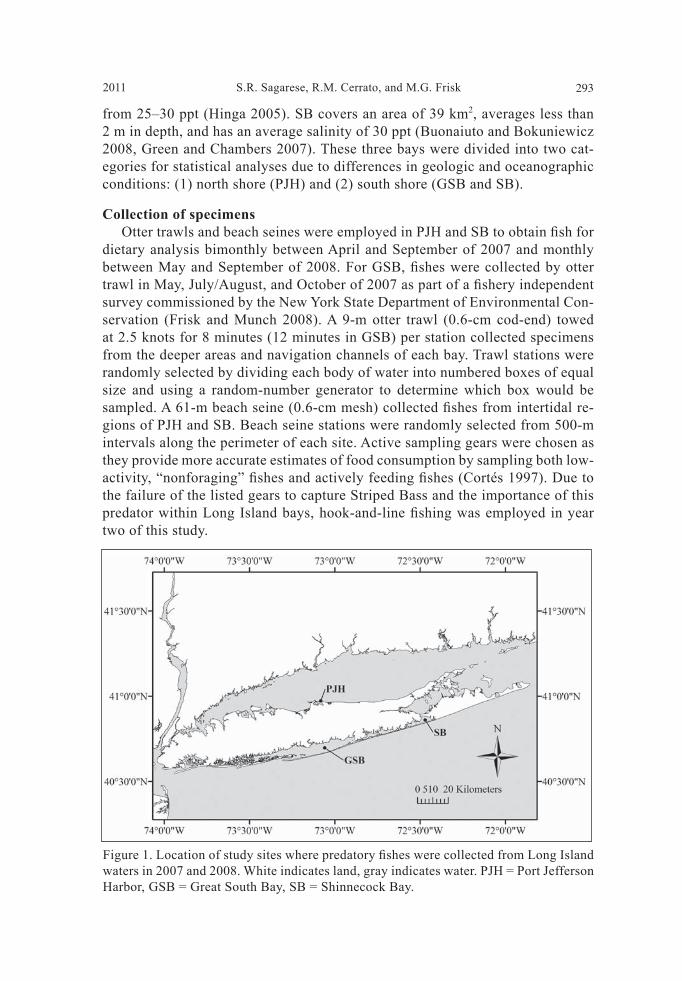
Study sites Specimens were collected from three bodies of water around Long Island, NY: Port Jefferson Harbor (PJH), Great South Bay (GSB), and Shinnecock Bay (SB) (Fig. 1). PJH, located on the rocky north shore, contains many deep, cool channels and connects to Long Island Sound through a narrow inlet. It covers an area of approximately 4 km2, has an average depth of 4.4 m, and experienced an average salinity of 26 ppt during our 2007 trawl survey (Gross et al. 1972, Sagarese 2009, USFWS 1997). In contrast, GSB and SB, both situated on the sandy south shore, are shallow barrier beach and lagoonal estuaries with abundant salt marshes and tidal fl ats and direct connections to the Atlantic Ocean through inlets. GSB is the largest saltwater bay in New York State, covering an area of 235 km2 with an average depth of 1.3 m (Hinga 2005, Wilson et al. 1991). GSB is infl uenced by heavy riverine and groundwater fl ow and is characterized by salinity ranging
S.R. Sagarese, R.M. Cerrato, and M.G. Frisk2011 293
from 25–30 ppt (Hinga 2005). SB covers an area of 39 km2, averages less than 2 m in depth, and has an average salinity of 30 ppt (Buonaiuto and Bokuniewicz 2008, Green and Chambers 2007). These three bays were divided into two cat-egories for statistical analyses due to differences in geologic and oceanographic conditions: (1) north shore (PJH) and (2) south shore (GSB and SB).
Collection of specimens Otter trawls and beach seines were employed in PJH and SB to obtain fi sh for dietary analysis bimonthly between April and September of 2007 and monthly between May and September of 2008. For GSB, fi shes were collected by otter trawl in May, July/August, and October of 2007 as part of a fi shery independent survey commissioned by the New York State Department of Environmental Con-servation (Frisk and Munch 2008). A 9-m otter trawl (0.6-cm cod-end) towed at 2.5 knots for 8 minutes (12 minutes in GSB) per station collected specimens from the deeper areas and navigation channels of each bay. Trawl stations were randomly selected by dividing each body of water into numbered boxes of equal size and using a random-number generator to determine which box would be sampled. A 61-m beach seine (0.6-cm mesh) collected fi shes from intertidal re-gions of PJH and SB. Beach seine stations were randomly selected from 500-m intervals along the perimeter of each site. Active sampling gears were chosen as they provide more accurate estimates of food consumption by sampling both low-activity, “nonforaging” fi shes and actively feeding fi shes (Cortés 1997). Due to the failure of the listed gears to capture Striped Bass and the importance of this predator within Long Island bays, hook-and-line fi shing was employed in year two of this study.
Figure 1. Location of study sites where predatory fi shes were collected from Long Island waters in 2007 and 2008. White indicates land, gray indicates water. PJH = Port Jefferson Harbor, GSB = Great South Bay, SB = Shinnecock Bay.
Northeastern Naturalist Vol. 18, No. 3294
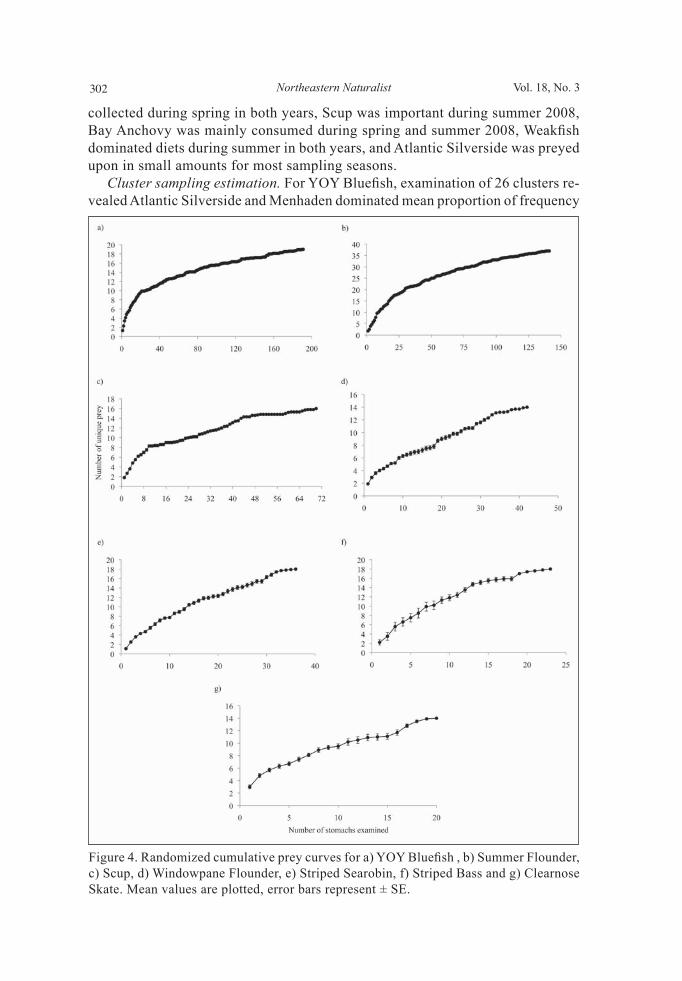
Diet composition Simple random sampling. Diets of fi shes captured throughout the sampling seasons of 2007–2008 were evaluated under the assumption that each fi sh in the population was an independent sampling unit with equal probability of capture in our sampling regime (Cochran 1977). Upon capture, specimens were measured for total length (TL, to the nearest mm), immediately put on ice, returned to the laboratory, and frozen as soon as possible. Fishes were later thawed and weighed (to the nearest g), and their stomachs were extracted and weighed (to the near-est mg). To determine the stomach content weight for each specimen, extracted stomachs were weighed both before and after emptying their contents. Intensity of feeding for each predatory fi sh was measured via a stomach fullness index (SFI) (Hureau 1969): SFI = (stomach content weight [g] / fi sh weight [g]) x 100. SFI values were calculated for all specimens regardless of the presence or absence of stomach contents, to provide unbiased estimates of feeding inten-sity. Stomach contents were sorted, and items were identifi ed to the lowest taxa possible, enumerated, and weighed (to the nearest mg). For each prey item, standard indices were reported, including percent by number (%N), percent by weight (%W), and percent frequency of occurrence (%O), with seasonal values calculated when feasible (Chipps and Garvey 2007, Hyslop 1980). In addition, an index of relative importance (IRI; Pinkas et al. 1971) was calculated for each prey item and converted into a percentage to allow for comparisons to other studies (Cortés 1997). For Stenotomus chrysops L. (Scup), only %W and %O are reported because their dentition, which consists of hard plates for crushing prey, makes enumerating individual prey items diffi cult. The prey category “ma-rine plant matter” (MPM) consisted of unidentifi able algae and seaweed, while “terrestrial plant matter” (TPM) included tree branches and other fragments of terrestrial plants. The “nonliving matter” included plastic debris and rocks, while the “unknown” grouping consisted of unrecognizable organic matter. Cumulative prey curves were calculated for all species to determine whether an adequate number of specimens had been collected to describe the diet (Cor-tés 1997, Gelsleichter et al. 1999). The order in which stomach contents were analyzed was randomized ten times, and the mean number of new prey species (± standard error) was plotted against the cumulative number of fi sh examined (Gelsleichter et al. 1999). Graphically, sample size was deemed adequate once an asymptotic relationship was displayed.
Cluster sampling estimation. Large catches of fishes were subsampled when necessary and processed for diet composition utilizing cluster-sampling estimation (Buckel et al. 1999). Cluster sampling presents population-level diet data by factoring in the relative abundance of species during each sam-pling event and taking into account similarities in diet composition among individual fish (Bogstad et al. 1995, Buckel et al. 1999). We defined a “clus-ter” (Cochran 1977) as the diet composition of a fish species captured by tow (seine or trawl) and assumed each cluster represented an individual sampling
S.R. Sagarese, R.M. Cerrato, and M.G. Frisk2011 295
unit. For each cluster, an estimate of the mean proportion of stomachs contain-ing prey type k (Fk; specimens with empty stomachs were neglected in this calculation), an estimate of the mean proportional contribution of prey type k by weight (Wk), and estimators of variance were calculated as in Buckel et al. (1999). An intracluster correlation coefficient (ICC; ) was calculated for each prey item encountered in cluster sampling estimation. This parameter ranges from 0 to 1 and reflects the relationship of the variance within clusters (s2
w) to the variance between clusters (s2b) as described in Steel et al. (1997).
An ICC value of 0 is indicative of diverse stomach contents for fish within a cluster, resulting in greater variance within tows. In contrast, an ICC value of 1 occurs when stomach contents of fish within a cluster are identical, resulting in greater variance between tows. ICC values close to zero indicate simple ran-dom sampling is an appropriate measure of diet composition whereas as ICC approaches 1, cluster sampling estimation is necessary to accurately describe the diet due to the similarity of diet composition within tows.
Regional comparisons The diet compositions of fishes were compared between the north and south shores of Long Island to determine whether important prey items differed be-tween the two contrasting environments. The non-normal and heterogeneous nature of our data prevented parametric statistical testing despite transformation efforts. Instead, a one-way, non-parametric, multivariate analysis of covariance (NP-MANCOVA) for an unbalanced ANOVA design using Bray Curtis distanc-es on the weights (in g) of prey items was used to test for regional differences in diet composition, using the program DISTLM v.5 (Anderson 2001, Braccini et al. 2005). DISTLM tests for the multivariate null hypothesis of no relationship between a data matrix and a design matrix that codes for a particular term in the model and is achieved through multivariate regression analysis on a matrix of distance measures (McArdle and Anderson 2001, McKinnon et al. 2008). The test statistic is a multivariate analogue to Fisher's F-ratio and is calculated directly from a symmetric distance or dissimilarity matrix with the P-value ob-tained using permutations (Anderson 2001). For comparisons between sites for individual species, site was treated as a fixed factor, with the weights of each prey item as dependent variables and individual fish as replicates. Individual fish were used as replicates rather than clusters because cluster sampling es-timation was inappropriate for Summer Flounder and Scopthalmus aquosus Mitchill (Windowpane Flounder). Fish length was chosen as a covariate to control for its effect on the dependent variables. Significance was determined by 9999 permutations of the raw data. A significance level of = 0.05 was set a priori and used to test for differences in diet composition. We also performed a NP-MANOVA to test for differences in diet composition between species. For this analysis, species was treated as a fixed factor and coded as a design matrix within an input file (Anderson 2001). Individual weights of each prey item were the dependent variables, while individual fish represented replicates.
Northeastern Naturalist Vol. 18, No. 3296
Results
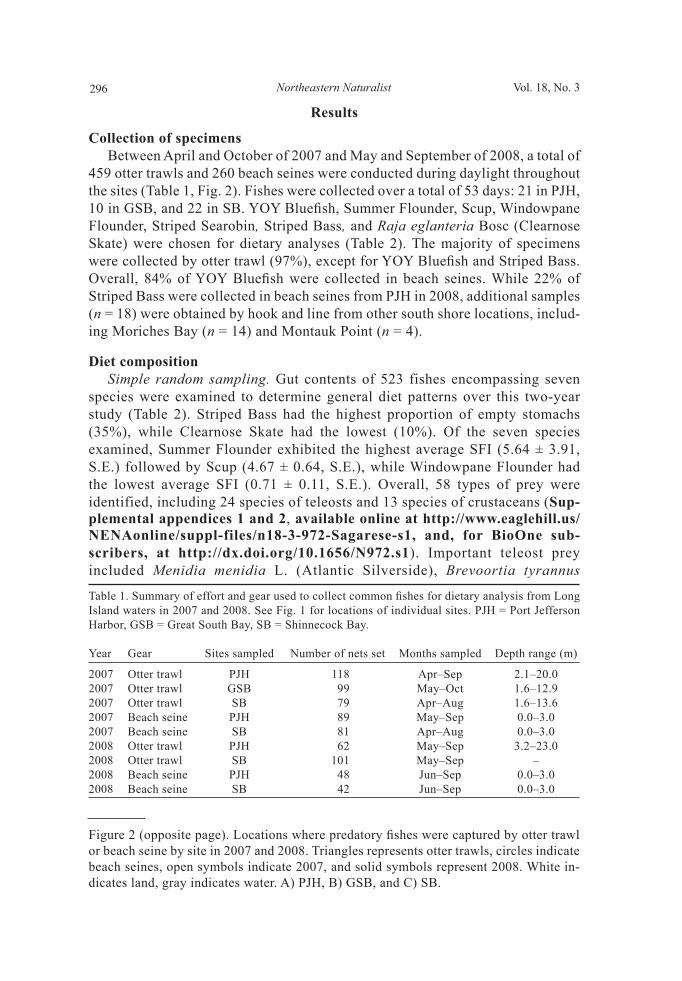
Collection of specimens Between April and October of 2007 and May and September of 2008, a total of 459 otter trawls and 260 beach seines were conducted during daylight throughout the sites (Table 1, Fig. 2). Fishes were collected over a total of 53 days: 21 in PJH, 10 in GSB, and 22 in SB. YOY Bluefi sh, Summer Flounder, Scup, Windowpane Flounder, Striped Searobin, Striped Bass, and Raja eglanteria Bosc (Clearnose Skate) were chosen for dietary analyses (Table 2). The majority of specimens were collected by otter trawl (97%), except for YOY Bluefi sh and Striped Bass. Overall, 84% of YOY Bluefi sh were collected in beach seines. While 22% of Striped Bass were collected in beach seines from PJH in 2008, additional samples (n = 18) were obtained by hook and line from other south shore locations, includ-ing Moriches Bay (n = 14) and Montauk Point (n = 4).
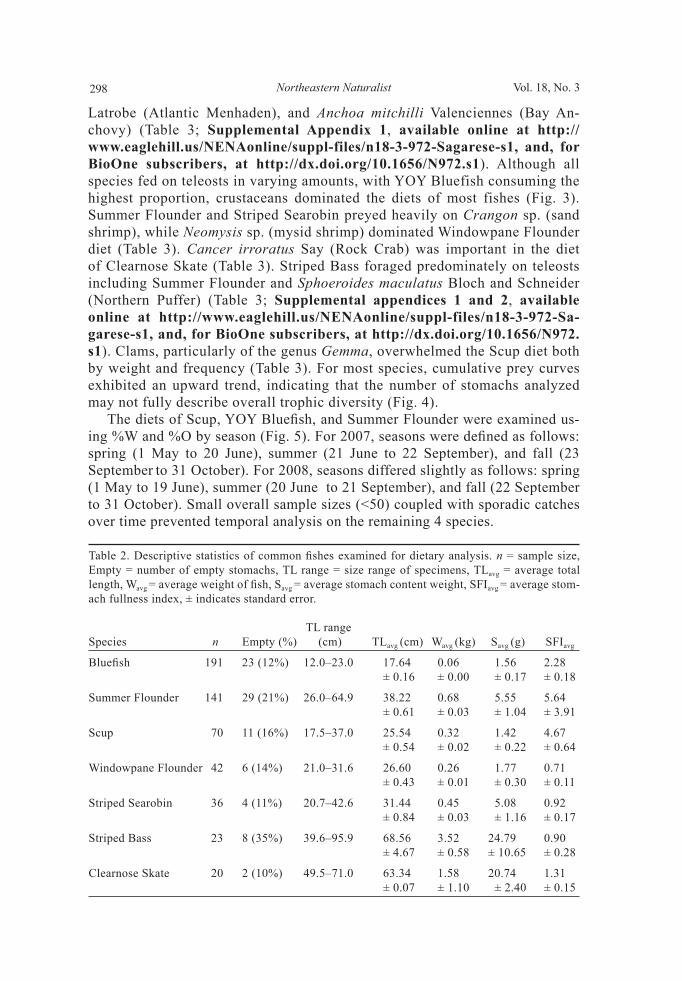
Diet composition Simple random sampling. Gut contents of 523 fishes encompassing seven species were examined to determine general diet patterns over this two-year study (Table 2). Striped Bass had the highest proportion of empty stomachs (35%), while Clearnose Skate had the lowest (10%). Of the seven species examined, Summer Flounder exhibited the highest average SFI (5.64 ± 3.91, S.E.) followed by Scup (4.67 ± 0.64, S.E.), while Windowpane Flounder had the lowest average SFI (0.71 ± 0.11, S.E.). Overall, 58 types of prey were identified, including 24 species of teleosts and 13 species of crustaceans (Sup-plemental appendices 1 and 2, available online at http://www.eaglehill.us/NENAonline/suppl-files/n18-3-972-Sagarese-s1, and, for BioOne sub-scribers, at http://dx.doi.org/10.1656/N972.s1). Important teleost prey included Menidia menidia L. (Atlantic Silverside), Brevoortia tyrannus
Table 1. Summary of effort and gear used to collect common fi shes for dietary analysis from Long Island waters in 2007 and 2008. See Fig. 1 for locations of individual sites. PJH = Port Jefferson Harbor, GSB = Great South Bay, SB = Shinnecock Bay.
Year Gear Sites sampled Number of nets set Months sampled Depth range (m)
2007 Otter trawl PJH 118 Apr–Sep 2.1–20.02007 Otter trawl GSB 99 May–Oct 1.6–12.92007 Otter trawl SB 79 Apr–Aug 1.6–13.62007 Beach seine PJH 89 May–Sep 0.0–3.02007 Beach seine SB 81 Apr–Aug 0.0–3.02008 Otter trawl PJH 62 May–Sep 3.2–23.02008 Otter trawl SB 101 May–Sep –2008 Beach seine PJH 48 Jun–Sep 0.0–3.02008 Beach seine SB 42 Jun–Sep 0.0–3.0
Figure 2 (opposite page). Locations where predatory fi shes were captured by otter trawl or beach seine by site in 2007 and 2008. Triangles represents otter trawls, circles indicate beach seines, open symbols indicate 2007, and solid symbols represent 2008. White in-dicates land, gray indicates water. A) PJH, B) GSB, and C) SB.
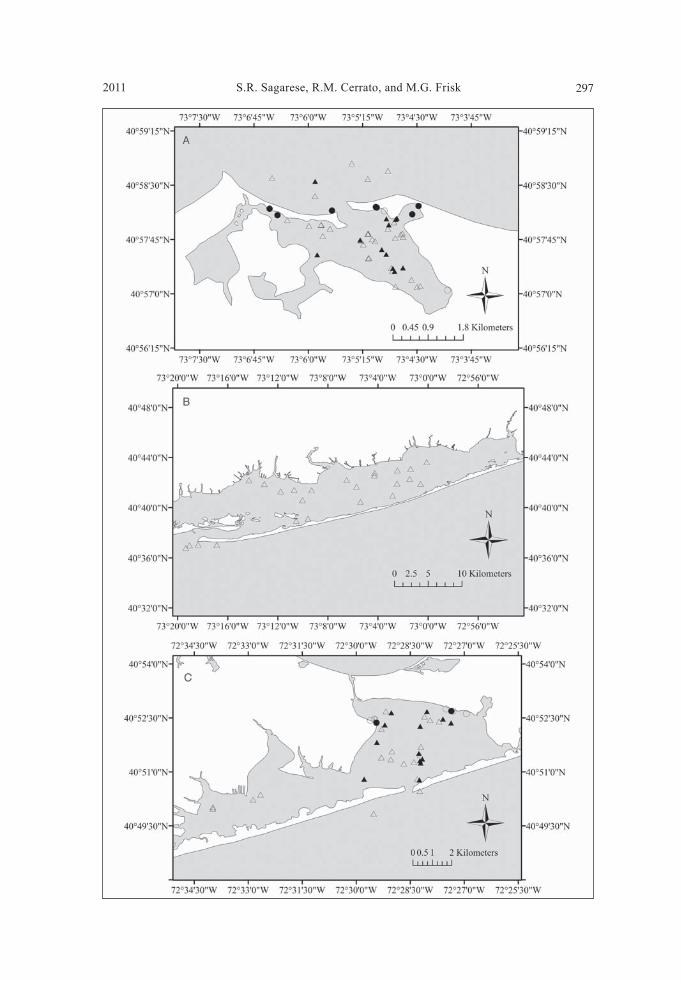
S.R. Sagarese, R.M. Cerrato, and M.G. Frisk2011 297
Northeastern Naturalist Vol. 18, No. 3298
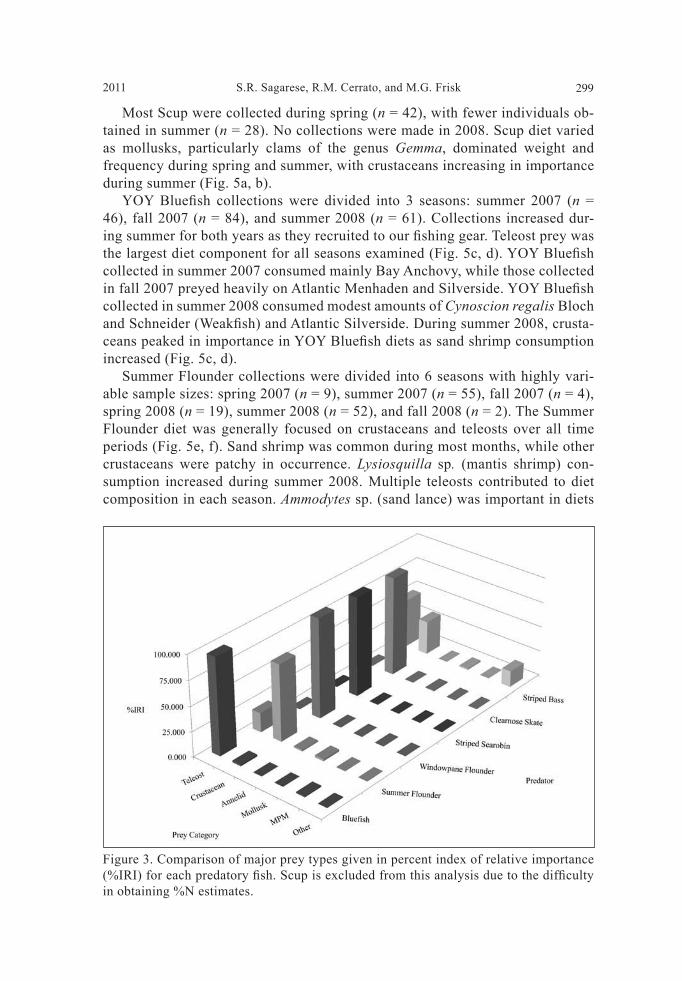
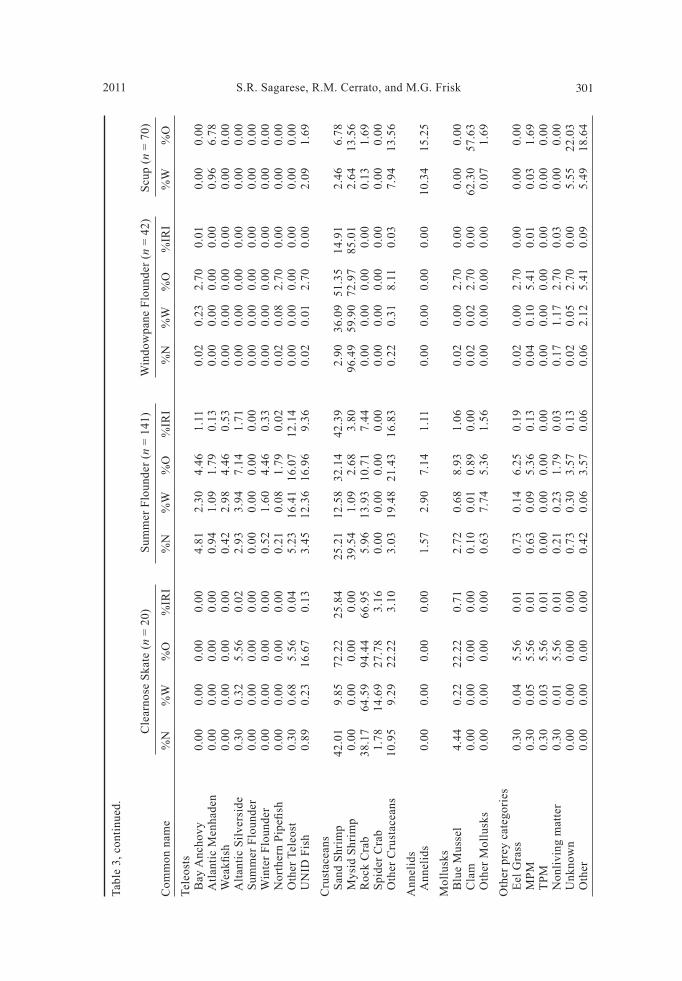
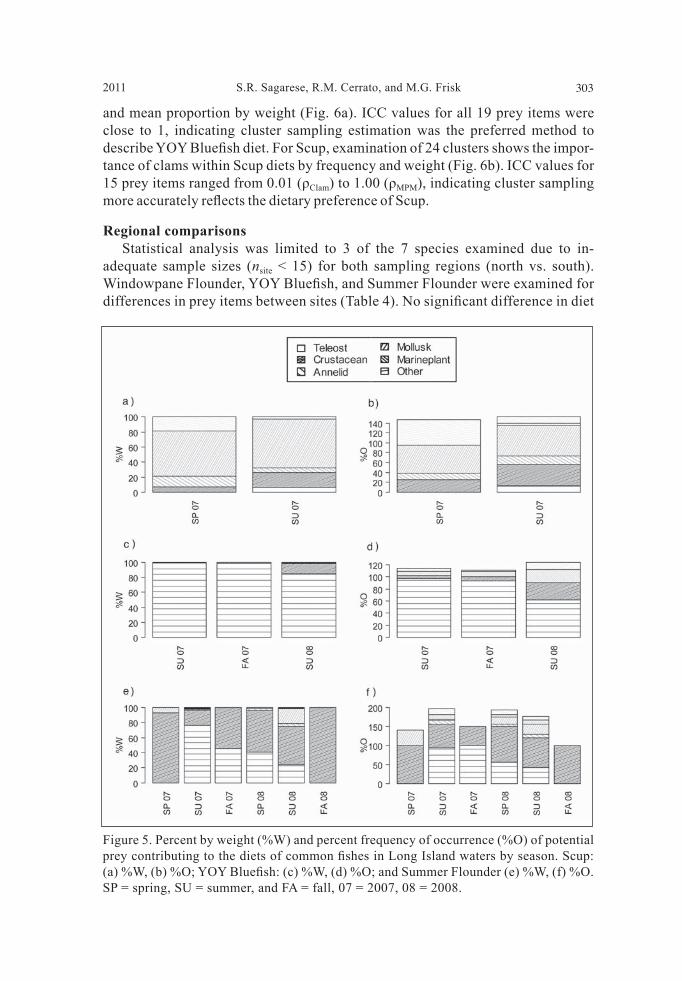
Latrobe (Atlantic Menhaden), and Anchoa mitchilli Valenciennes (Bay An-chovy) (Table 3; Supplemental Appendix 1, available online at http://www.eaglehill.us/NENAonline/suppl-files/n18-3-972-Sagarese-s1, and, for BioOne subscribers, at http://dx.doi.org/10.1656/N972.s1). Although all species fed on teleosts in varying amounts, with YOY Bluefish consuming the highest proportion, crustaceans dominated the diets of most fishes (Fig. 3). Summer Flounder and Striped Searobin preyed heavily on Crangon sp. (sand shrimp), while Neomysis sp. (mysid shrimp) dominated Windowpane Flounder diet (Table 3). Cancer irroratus Say (Rock Crab) was important in the diet of Clearnose Skate (Table 3). Striped Bass foraged predominately on teleosts including Summer Flounder and Sphoeroides maculatus Bloch and Schneider (Northern Puffer) (Table 3; Supplemental appendices 1 and 2, available online at http://www.eaglehill.us/NENAonline/suppl-files/n18-3-972-Sa-garese-s1, and, for BioOne subscribers, at http://dx.doi.org/10.1656/N972.s1). Clams, particularly of the genus Gemma, overwhelmed the Scup diet both by weight and frequency (Table 3). For most species, cumulative prey curves exhibited an upward trend, indicating that the number of stomachs analyzed may not fully describe overall trophic diversity (Fig. 4). The diets of Scup, YOY Bluefi sh, and Summer Flounder were examined us-ing %W and %O by season (Fig. 5). For 2007, seasons were defi ned as follows: spring (1 May to 20 June), summer (21 June to 22 September), and fall (23 September to 31 October). For 2008, seasons differed slightly as follows: spring (1 May to 19 June), summer (20 June to 21 September), and fall (22 September to 31 October). Small overall sample sizes (<50) coupled with sporadic catches over time prevented temporal analysis on the remaining 4 species.
Table 2. Descriptive statistics of common fi shes examined for dietary analysis. n = sample size, Empty = number of empty stomachs, TL range = size range of specimens, TLavg = average total length, Wavg = average weight of fi sh, Savg = average stomach content weight, SFIavg = average stom-ach fullness index, ± indicates standard error.
TL rangeSpecies n Empty (%) (cm) TLavg (cm) Wavg (kg) Savg (g) SFIavg
Bluefi sh 191 23 (12%) 12.0–23.0 17.64 0.06 1.56 2.28 ± 0.16 ± 0.00 ± 0.17 ± 0.18
Summer Flounder 141 29 (21%) 26.0–64.9 38.22 0.68 5.55 5.64 ± 0.61 ± 0.03 ± 1.04 ± 3.91
Scup 70 11 (16%) 17.5–37.0 25.54 0.32 1.42 4.67 ± 0.54 ± 0.02 ± 0.22 ± 0.64
Windowpane Flounder 42 6 (14%) 21.0–31.6 26.60 0.26 1.77 0.71 ± 0.43 ± 0.01 ± 0.30 ± 0.11
Striped Searobin 36 4 (11%) 20.7–42.6 31.44 0.45 5.08 0.92 ± 0.84 ± 0.03 ± 1.16 ± 0.17
Striped Bass 23 8 (35%) 39.6–95.9 68.56 3.52 24.79 0.90 ± 4.67 ± 0.58 ± 10.65 ± 0.28
Clearnose Skate 20 2 (10%) 49.5–71.0 63.34 1.58 20.74 1.31 ± 0.07 ± 1.10 ± 2.40 ± 0.15
S.R. Sagarese, R.M. Cerrato, and M.G. Frisk2011 299
Most Scup were collected during spring (n = 42), with fewer individuals ob-tained in summer (n = 28). No collections were made in 2008. Scup diet varied as mollusks, particularly clams of the genus Gemma, dominated weight and frequency during spring and summer, with crustaceans increasing in importance during summer (Fig. 5a, b). YOY Bluefi sh collections were divided into 3 seasons: summer 2007 (n = 46), fall 2007 (n = 84), and summer 2008 (n = 61). Collections increased dur-ing summer for both years as they recruited to our fi shing gear. Teleost prey was the largest diet component for all seasons examined (Fig. 5c, d). YOY Bluefi sh collected in summer 2007 consumed mainly Bay Anchovy, while those collected in fall 2007 preyed heavily on Atlantic Menhaden and Silverside. YOY Bluefi sh collected in summer 2008 consumed modest amounts of Cynoscion regalis Bloch and Schneider (Weakfi sh) and Atlantic Silverside. During summer 2008, crusta-ceans peaked in importance in YOY Bluefi sh diets as sand shrimp consumption increased (Fig. 5c, d). Summer Flounder collections were divided into 6 seasons with highly vari-able sample sizes: spring 2007 (n = 9), summer 2007 (n = 55), fall 2007 (n = 4), spring 2008 (n = 19), summer 2008 (n = 52), and fall 2008 (n = 2). The Summer Flounder diet was generally focused on crustaceans and teleosts over all time periods (Fig. 5e, f). Sand shrimp was common during most months, while other crustaceans were patchy in occurrence. Lysiosquilla sp. (mantis shrimp) con-sumption increased during summer 2008. Multiple teleosts contributed to diet composition in each season. Ammodytes sp. (sand lance) was important in diets
Figure 3. Comparison of major prey types given in percent index of relative importance (%IRI) for each predatory fi sh. Scup is excluded from this analysis due to the diffi culty in obtaining %N estimates.
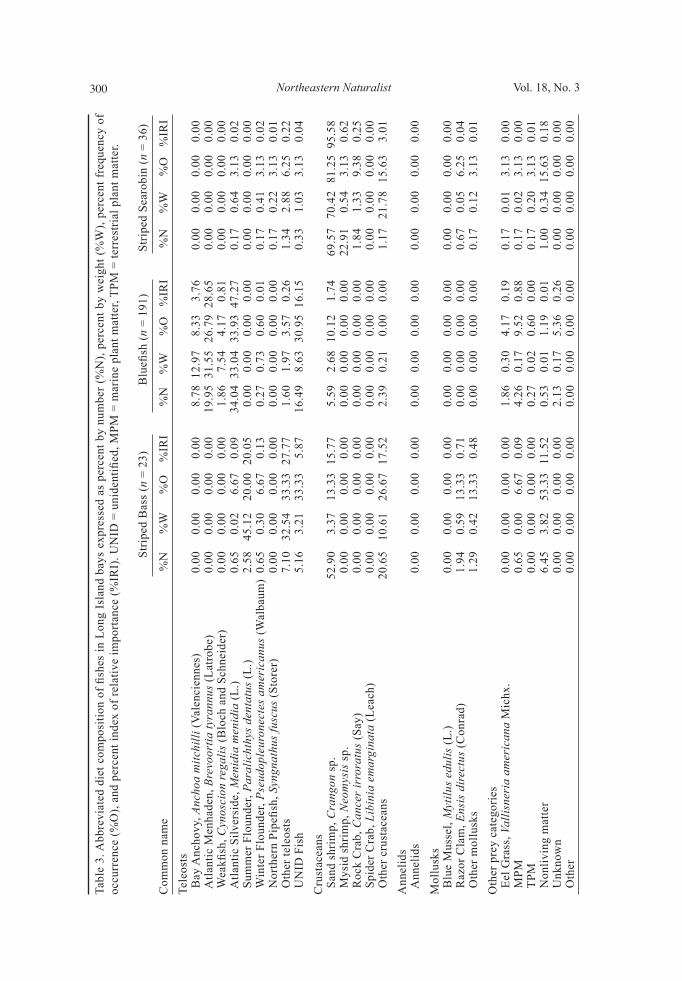
Northeastern Naturalist Vol. 18, No. 3300 Ta
ble
3. A
bbre
viat
ed d
iet c
ompo
sitio
n of
fi sh
es in
Lon
g Is
land
bay
s ex
pres
sed
as p
erce
nt b
y nu
mbe
r (%
N),
perc
ent b
y w
eigh
t (%
W),
perc
ent f
requ
ency
of
occu
rren
ce (%
O),
and
perc
ent i
ndex
of r
elat
ive
impo
rtanc
e (%
IRI)
. UN
ID =
uni
dent
ifi ed
, MPM
= m
arin
e pl
ant m
atte
r, TP
M =
terr
estri
al p
lant
mat
ter.
St
riped
Bas
s (n
= 2
3)
Blu
efi s
h (n
= 1
91)
Strip
ed S
earo
bin
(n =
36)
Com
mon
nam
e
%N
%
W
%O
%
IRI
%N
%
W
%O
%
IRI
%N
%
W
%O
%
IRI
Tele
osts
Bay
Anc
hovy
, Anc
hoa
mitc
hilli
(Val
enci
enne
s)
0.00
0.
00
0.00
0.
00
8.78
12.
97
8.33
3.
76
0.00
0.
00
0.00
0.
00 A
tlant
ic M
enha
den,
Bre
voor
tia ty
rann
us (L
atro
be)
0.00
0.
00
0.00
0.
00
19.9
5 31
.55
26.7
9 28
.65
0.00
0.
00
0.00
0.
00 W
eakfi
sh,
Cyn
osci
on r
egal
is (B
loch
and
Sch
neid
er)
0.00
0.
00
0.00
0.
00
1.86
7.
54
4.17
0.
81
0.00
0.
00
0.00
0.
00 A
tlant
ic S
ilver
side
, Men
idia
men
idia
(L.)
0.65
0.
02
6.67
0.
09
34.0
4 33
.04
33.9
3 47
.27
0.17
0.
64
3.13
0.
02 S
umm
er F
loun
der,
Para
licht
hys
dent
atus
(L.)
2.58
45
.12
20.0
0 20
.05
0.00
0.
00
0.00
0.
00
0.00
0.
00
0.00
0.
00 W
inte
r Flo
unde
r, Ps
eudo
pleu
rone
ctes
am
eric
anus
(Wal
baum
) 0.
65
0.30
6.
67
0.13
0.
27
0.73
0.
60
0.01
0.
17
0.41
3.
13
0.02
Nor
ther
n Pi
pefi s
h, S
yngn
athu
s fu
scus
(Sto
rer)
0.
00
0.00
0.
00
0.00
0.
00
0.00
0.
00
0.00
0.
17
0.22
3.
13
0.01
Oth
er te
leos
ts
7.10
32
.54
33.3
3 27
.77
1.60
1.
97
3.57
0.
26
1.34
2.
88
6.25
0.
22 U
NID
Fis
h 5.
16
3.21
33
.33
5.87
16
.49
8.63
30.
95 1
6.15
0.
33
1.03
3.
13
0.04
Cru
stac
eans
San
d sh
rimp,
Cra
ngon
sp.
52
.90
3.37
13
.33
15.7
7 5.
59
2.68
10.
12
1.74
69
.57
70.4
2 81
.25
95.5
8 M
ysid
shr
imp,
Neo
mys
is s
p.
0.00
0.
00
0.00
0.
00
0.00
0.
00
0.00
0.
00
22.9
1 0.
54
3.13
0.
62 R
ock
Cra
b, C
ance
r ir
rora
tus
(Say
) 0.
00
0.00
0.
00
0.00
0.
00
0.00
0.
00
0.00
1.
84
1.33
9.
38
0.25
Spi
der C
rab,
Lib
inia
em
argi
nata
(Lea
ch)
0.00
0.
00
0.00
0.
00
0.00
0.
00
0.00
0.
00
0.00
0.
00
0.00
0.
00 O
ther
cru
stac
eans
20
.65
10.6
1 26
.67
17.5
2 2.
39
0.21
0.
00
0.00
1.
17
21.7
8 15
.63
3.01
Ann
elid
s A
nnel
ids
0.00
0.
00
0.00
0.
00
0.00
0.
00
0.00
0.
00
0.00
0.
00
0.00
0.
00
Mol
lusk
s B
lue
Mus
sel,
Myt
ilus
edul
is (L
.) 0.
00
0.00
0.
00
0.00
0.
00
0.00
0.
00
0.00
0.
00
0.00
0.
00
0.00
Raz
or C
lam
, Ens
is d
irec
tus
(Con
rad)
1.
94
0.59
13
.33
0.71
0.
00
0.00
0.
00
0.00
0.
67
0.05
6.
25
0.04
Oth
er m
ollu
sks
1.29
0.
42
13.3
3 0.
48
0.00
0.
00
0.00
0.
00
0.17
0.
12
3.13
0.
01O
ther
pre
y ca
tego
ries
Eel
Gra
ss, V
allis
neri
a am
eric
ana
Mic
hx.
0.00
0.
00
0.00
0.
00
1.86
0.
30
4.17
0.
19
0.17
0.
01
3.13
0.
00 M
PM
0.65
0.
00
6.67
0.
09
4.26
0.
17
9.52
0.
88
0.17
0.
02
3.13
0.
00 T
PM
0.00
0.
00
0.00
0.
00
0.27
0.
02
0.60
0.
00
0.17
0.
20
3.13
0.
01 N
onliv
ing
mat
ter
6.45
3.
82
53.3
3 11
.52
0.53
0.
01
1.19
0.
01
1.00
0.
34 1
5.63
0.
18 U
nkno
wn
0.00
0.
00
0.00
0.
00
2.13
0.
17
5.36
0.
26
0.00
0.
00
0.00
0.
00 O
ther
0.
00
0.00
0.
00
0.00
0.
00
0.00
0.
00
0.00
0.
00
0.00
0.
00
0.00
S.R. Sagarese, R.M. Cerrato, and M.G. Frisk2011 301
Tabl
e 3,
con
tinue
d.
C
lear
nose
Ska
te (n
= 2
0)
Sum
mer
Flo
unde
r (n
= 14
1)
Win
dow
pane
Flo
unde
r (n
= 42
) Sc
up (n
= 7
0)
Com
mon
nam
e
%N
%
W
%O
%
IRI
%N
%
W
%O
%
IRI
%N
%
W
%O
%
IRI
%W
%
O
Tele
osts
Bay
Anc
hovy
0.
00
0.00
0.
00
0.00
4.
81
2.30
4.
46
1.11
0.
02
0.23
2.
70
0.01
0.
00
0.00
Atla
ntic
Men
hade
n 0.
00
0.00
0.
00
0.00
0.
94
1.09
1.
79
0.13
0.
00
0.00
0.
00
0.00
0.
96
6.78
Wea
kfi s
h 0.
00
0.00
0.
00
0.00
0.
42
2.98
4.
46
0.53
0.
00
0.00
0.
00
0.00
0.
00
0.00
Alta
ntic
Silv
ersi
de
0.30
0.
32
5.56
0.
02
2.93
3.
94
7.14
1.
71
0.00
0.
00
0.00
0.
00
0.00
0.
00 S
umm
er F
loun
der
0.00
0.
00
0.00
0.
00
0.00
0.
00
0.00
0.
00
0.00
0.
00
0.00
0.
00
0.00
0.
00 W
inte
r Flo
unde
r 0.
00
0.00
0.
00
0.00
0.
52
1.60
4.
46
0.33
0.
00
0.00
0.
00
0.00
0.
00
0.00
Nor
ther
n Pi
pefi s
h 0.
00
0.00
0.
00
0.00
0.
21
0.08
1.
79
0.02
0.
02
0.08
2.
70
0.00
0.
00
0.00
Oth
er T
eleo
st
0.30
0.
68
5.56
0.
04
5.23
16
.41
16.0
7 12
.14
0.00
0.
00
0.00
0.
00
0.00
0.
00 U
NID
Fis
h 0.
89
0.23
16
.67
0.13
3.
45
12.3
6 16
.96
9.36
0.
02
0.01
2.
70
0.00
2.
09
1.69
Cru
stac
eans
San
d Sh
rimp
42.0
1 9.
85
72.2
2 25
.84
25.2
1 12
.58
32.1
4 42
.39
2.90
36
.09
51.3
5 14
.91
2.46
6.
78 M
ysid
Shr
imp
0.00
0.
00
0.00
0.
00
39.5
4 1.
09
2.68
3.
80
96.4
9 59
.90
72.9
7 85
.01
2.64
13
.56
Roc
k C
rab
38.1
7 64
.59
94.4
4 66
.95
5.96
13
.93
10.7
1 7.
44
0.00
0.
00
0.00
0.
00
0.13
1.
69 S
pide
r Cra
b 1.
78
14.6
9 27
.78
3.16
0.
00
0.00
0.
00
0.00
0.
00
0.00
0.
00
0.00
0.
00
0.00
Oth
er C
rust
acea
ns
10.9
5 9.
29
22.2
2 3.
10
3.03
19
.48
21.4
3 16
.83
0.22
0.
31
8.11
0.
03
7.94
13
.56
Ann
elid
s A
nnel
ids
0.00
0.
00
0.00
0.
00
1.57
2.
90
7.14
1.
11
0.00
0.
00
0.00
0.
00
10.3
4 15
.25
Mol
lusk
s B
lue
Mus
sel
4.44
0.
22
22.2
2 0.
71
2.72
0.
68
8.93
1.
06
0.02
0.
00
2.70
0.
00
0.00
0.
00 C
lam
0.
00
0.00
0.
00
0.00
0.
10
0.01
0.
89
0.00
0.
02
0.02
2.
70
0.00
62
.30
57.6
3 O
ther
Mol
lusk
s 0.
00
0.00
0.
00
0.00
0.
63
7.74
5.
36
1.56
0.
00
0.00
0.
00
0.00
0.
07
1.69
Oth
er p
rey
cate
gorie
s E
el G
rass
0.
30
0.04
5.
56
0.01
0.
73
0.14
6.
25
0.19
0.
02
0.00
2.
70
0.00
0.
00
0.00
MPM
0.
30
0.05
5.
56
0.01
0.
63
0.09
5.
36
0.13
0.
04
0.10
5.
41
0.01
0.
03
1.69
TPM
0.
30
0.03
5.
56
0.01
0.
00
0.00
0.
00
0.00
0.
00
0.00
0.
00
0.00
0.
00
0.00
Non
livin
g m
atte
r 0.
30
0.01
5.
56
0.01
0.
21
0.23
1.
79
0.03
0.
17
1.17
2.
70
0.03
0.
00
0.00
Unk
now
n 0.
00
0.00
0.
00
0.00
0.
73
0.30
3.
57
0.13
0.
02
0.05
2.
70
0.00
5.
55
22.0
3 O
ther
0.
00
0.00
0.
00
0.00
0.
42
0.06
3.
57
0.06
0.
06
2.12
5.
41
0.09
5.
49
18.6
4
Northeastern Naturalist Vol. 18, No. 3302
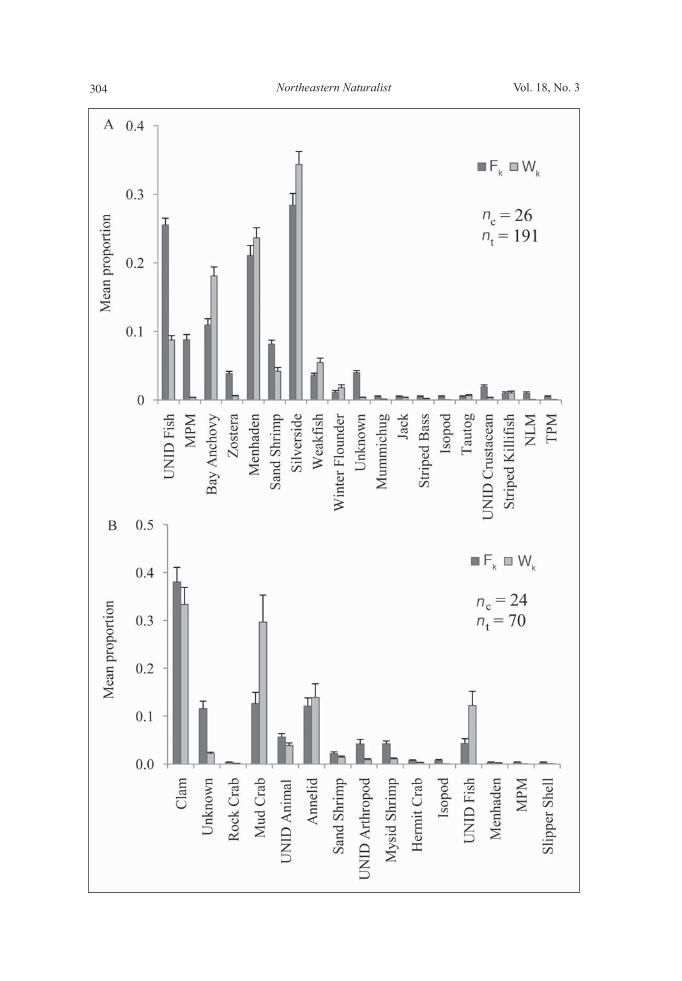
collected during spring in both years, Scup was important during summer 2008, Bay Anchovy was mainly consumed during spring and summer 2008, Weakfi sh dominated diets during summer in both years, and Atlantic Silverside was preyed upon in small amounts for most sampling seasons. Cluster sampling estimation. For YOY Bluefi sh, examination of 26 clusters re-vealed Atlantic Silverside and Menhaden dominated mean proportion of frequency
Figure 4. Randomized cumulative prey curves for a) YOY Bluefi sh , b) Summer Flounder, c) Scup, d) Windowpane Flounder, e) Striped Searobin, f) Striped Bass and g) Clearnose Skate. Mean values are plotted, error bars represent ± SE.
S.R. Sagarese, R.M. Cerrato, and M.G. Frisk2011 303
and mean proportion by weight (Fig. 6a). ICC values for all 19 prey items were close to 1, indicating cluster sampling estimation was the preferred method to describe YOY Bluefi sh diet. For Scup, examination of 24 clusters shows the impor-tance of clams within Scup diets by frequency and weight (Fig. 6b). ICC values for 15 prey items ranged from 0.01 ( Clam) to 1.00 ( MPM), indicating cluster sampling more accurately refl ects the dietary preference of Scup.
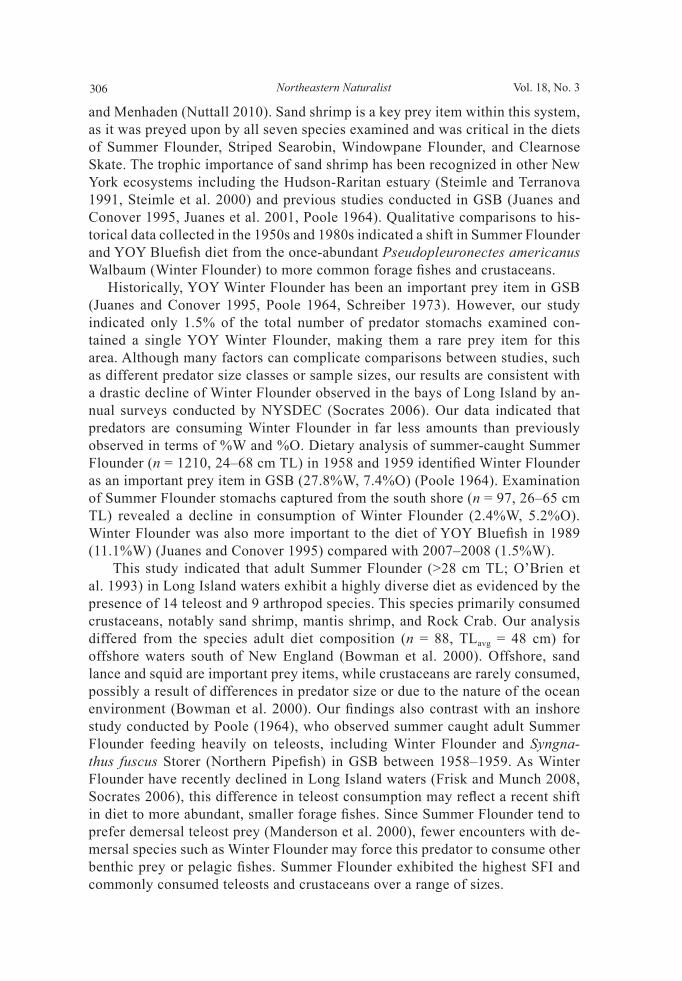
Regional comparisons Statistical analysis was limited to 3 of the 7 species examined due to in-adequate sample sizes (nsite < 15) for both sampling regions (north vs. south). Windowpane Flounder, YOY Bluefi sh, and Summer Flounder were examined for differences in prey items between sites (Table 4). No signifi cant difference in diet
Figure 5. Percent by weight (%W) and percent frequency of occurrence (%O) of potential prey contributing to the diets of common fi shes in Long Island waters by season. Scup: (a) %W, (b) %O; YOY Bluefi sh: (c) %W, (d) %O; and Summer Flounder (e) %W, (f) %O. SP = spring, SU = summer, and FA = fall, 07 = 2007, 08 = 2008.
Northeastern Naturalist Vol. 18, No. 3304
S.R. Sagarese, R.M. Cerrato, and M.G. Frisk2011 305
composition between sites was detected for Windowpane Flounder (P = 0.0694). In contrast, a signifi cant difference was detected in Bluefi sh (P = 0.0002) and Summer Flounder (P = 0.0043). Upon examination, YOY Bluefi sh in north shore waters consumed a greater mass of sand shrimp and Atlantic Silverside but less Bay Anchovy. Summer Flounder in north shore waters consumed a greater mass of Atlantic Silverside, sand lance, and squid. In addition, due to the large difference in sample size between sites, Summer Flounder diet from the south was much more diverse with 18 additional prey items identifi ed. The NP-MANOVA test for differences in the weights of prey items among all seven species pooled over sites revealed a signifi cant difference between the diet compositions of all predators (P = 0.0001).
Discussion
This study analyzed the trophic habits of important fi nfi sh for the inshore bays of Long Island, providing critical data for the development of ecosystem-based management for an understudied system. Cumulative prey curves indicated that the number of stomachs examined was suffi cient to identify important prey items; however, for some species, results of this study should be interpreted with cau-tion due to small overall sample sizes, which made quantifying overall trophic diversity unfeasible. Diet composition differed signifi cantly between species, with YOY Bluefi sh and Striped Bass consuming teleosts, Scup consuming bi-valves, and the remaining four fi sh species feeding heavily on crustaceans. The energetic demands of upper trophic fi nfi sh occurring in Long Island bays are met by crustaceans and, to a lesser extent, forage fi shes such as Atlantic Silverside
Figure 6 (opposite page). Mean proportion of stomachs containing prey type k (Fk) and mean proportional contribution of a prey type by weight (Wk) in the diets of common fi shes collected from Long Island waters in 2007 and 2008. A) YOY Bluefi sh, B) Scup. nc = total number of clusters collected, nt = total number of specimens. Standard error estimates, represented by error bars, were calculated from cluster sampling variance es-timates, and all were less than 0.06%. UNID = unidentifi ed, MPM = marine plant matter, TPM = terrestrial plant matter, NLM = nonliving matter.
Table 4. NP-MANCOVA testing for the effects of site (north versus south) on the weight of prey items in the diet of predatory fi shes while removing the effect of fi sh length. Site is treated as a fi xed factor, the weights of each prey item are the dependent variables, individual fi sh represent replicates, and fi sh length is used as a covariate. df = degrees of freedom, SS = sums of squares, P = probability, signifi cance level of = 0.05 set a priori.
Multivariate statisticsSample size by site Permutation Monte
Species North South Total df Total SS Pseudo-F P Carlo P
Windowpane Flounder 19 23 41 149488.3 1.9569 0.0694 0.0749Bluefi sh 97 94 190 824514.2 4.2334 0.0002 0.0001Summer Flounder 41 100 140 639663.1 2.5021 0.0043 0.0048
Northeastern Naturalist Vol. 18, No. 3306
and Menhaden (Nuttall 2010). Sand shrimp is a key prey item within this system, as it was preyed upon by all seven species examined and was critical in the diets of Summer Flounder, Striped Searobin, Windowpane Flounder, and Clearnose Skate. The trophic importance of sand shrimp has been recognized in other New York ecosystems including the Hudson-Raritan estuary (Steimle and Terranova 1991, Steimle et al. 2000) and previous studies conducted in GSB (Juanes and Conover 1995, Juanes et al. 2001, Poole 1964). Qualitative comparisons to his-torical data collected in the 1950s and 1980s indicated a shift in Summer Flounder and YOY Bluefi sh diet from the once-abundant Pseudopleuronectes americanus Walbaum (Winter Flounder) to more common forage fi shes and crustaceans. Historically, YOY Winter Flounder has been an important prey item in GSB (Juanes and Conover 1995, Poole 1964, Schreiber 1973). However, our study indicated only 1.5% of the total number of predator stomachs examined con-tained a single YOY Winter Flounder, making them a rare prey item for this area. Although many factors can complicate comparisons between studies, such as different predator size classes or sample sizes, our results are consistent with a drastic decline of Winter Flounder observed in the bays of Long Island by an-nual surveys conducted by NYSDEC (Socrates 2006). Our data indicated that predators are consuming Winter Flounder in far less amounts than previously observed in terms of %W and %O. Dietary analysis of summer-caught Summer Flounder (n = 1210, 24–68 cm TL) in 1958 and 1959 identifi ed Winter Flounder as an important prey item in GSB (27.8%W, 7.4%O) (Poole 1964). Examination of Summer Flounder stomachs captured from the south shore (n = 97, 26–65 cm TL) revealed a decline in consumption of Winter Flounder (2.4%W, 5.2%O). Winter Flounder was also more important to the diet of YOY Bluefi sh in 1989 (11.1%W) (Juanes and Conover 1995) compared with 2007–2008 (1.5%W). This study indicated that adult Summer Flounder (>28 cm TL; O’Brien et al. 1993) in Long Island waters exhibit a highly diverse diet as evidenced by the presence of 14 teleost and 9 arthropod species. This species primarily consumed crustaceans, notably sand shrimp, mantis shrimp, and Rock Crab. Our analysis differed from the species adult diet composition (n = 88, TLavg = 48 cm) for offshore waters south of New England (Bowman et al. 2000). Offshore, sand lance and squid are important prey items, while crustaceans are rarely consumed, possibly a result of differences in predator size or due to the nature of the ocean environment (Bowman et al. 2000). Our fi ndings also contrast with an inshore study conducted by Poole (1964), who observed summer caught adult Summer Flounder feeding heavily on teleosts, including Winter Flounder and Syngna-thus fuscus Storer (Northern Pipefi sh) in GSB between 1958–1959. As Winter Flounder have recently declined in Long Island waters (Frisk and Munch 2008, Socrates 2006), this difference in teleost consumption may refl ect a recent shift in diet to more abundant, smaller forage fi shes. Since Summer Flounder tend to prefer demersal teleost prey (Manderson et al. 2000), fewer encounters with de-mersal species such as Winter Flounder may force this predator to consume other benthic prey or pelagic fi shes. Summer Flounder exhibited the highest SFI and commonly consumed teleosts and crustaceans over a range of sizes.
S.R. Sagarese, R.M. Cerrato, and M.G. Frisk2011 307
Poole (1964) acknowledged the importance of sand and mysid shrimp in GSB during the 1950s. Our results for Summer Flounder provide supporting evidence that sand shrimp is an important prey item in GSB. Sand shrimp is a principal link in the nutrient cycle of many coastal ecosystems and its high abundance and growth rates during warm summer months make them ideal prey (Latour et al. 2008, Modlin 1980, Steimle et al. 2000, Wilcox and Jeffries 1973). Similar to Latour et al. (2008), who analyzed Summer Flounder diet (n = 3079, 12–73 cm TL) in Chesapeake Bay, we observed high sand shrimp predation in spring and summer. However, in our study, Summer Flounder diet shifted to other crustaceans, includ-ing Rock Crab and mantis shrimp, during late summer/fall, refl ecting a possible decline in sand shrimp abundance. The difference we found in diet composition be-tween north- and south-shore Summer Flounder may refl ect differences in regional abundances or spatial overlap between predator and prey. The examination of YOY Bluefi sh from Long Island waters proved different from other predators as this species mainly consumed teleosts, including Atlantic Silverside and Menhaden, and occasionally fed upon crustaceans. Bluefi sh and Atlantic Silversides are both present inshore in similar habitat during early spring and remain abundant during summer, making these forage fi sh available to YOY Bluefi sh (Juanes and Conover 1995). Our results agree with previous fi ndings for New York (Buckel and McKown 2002, Juanes and Conover 1995, Juanes et al. 2001) and New Jersey waters (Scharf et al. 2004). One unique observation from our study was that sand shrimp were rare in YOY Bluefi sh stomach contents with the exception of summer 2008. In contrast, other studies found sand shrimp im-portance to rival teleost in the late 1980s in GSB (Juanes and Conover 1995) and the Sandy Hook Bay estuary of New Jersey (Friedland et al. 1988). Consump-tion of shrimp depends on their relative abundance and size relative to fi sh prey (Juanes et al. 2001). Laboratory studies showed that YOY Bluefi sh selectively ingested fi sh compared with similarly-sized shrimp prey, which required added manipulation and longer handling times (Juanes et al. 2001). Ingesting teleost prey results in higher feeding and growth rates and improves YOY Bluefi sh body condition (Buckel et al. 1999, Friedland et al. 1988, Juanes and Conover 1994). Adult Striped Searobins (>22.1 cm fork length [FL], McEachran and Davis 1970) were collected between May and July, and therefore our results refl ect a spring/early summer diet. Striped Searobin displayed the most consistent diet by feeding almost exclusively on sand shrimp and rarely consuming teleosts. Partially buried sand shrimp are extremely vulnerable to bottom-feeding sear-obins, which use modifi ed pectoral fi ns to search and fl ush out prey items from the sediment (Manderson et al. 1999). A previous Long Island study reported a more diverse diet for Striped Searobin (n = 40) from GSB, with sand shrimp and Atlantic Silverside common in 1972 (Schreiber 1973). However, this differ-ence may be attributed to collection of specimens at different times of the year, as Schreiber (1973) does not report month of capture. A confl icting result was observed in Long Island Sound by Richards et al. (1979), who collected Striped Searobins (n = 390, 12–33 cm TL) over irregular intervals during 1971–1973 and 1976–1977 and concluded that crabs were more abundant in stomachs than sand
Northeastern Naturalist Vol. 18, No. 3308
shrimp. This difference may result from different hydrographic conditions of temperature, salinity, and circulation encountered in the deeper Sound compared to inshore bays or may refl ect an ontogenetic shift in diet. The dominance of sand shrimp in the diet of Striped Searobin agrees with observations from neighbor-ing estuaries. Within the lower Hudson-Raritan estuary, sand shrimp was the predominant prey item for specimens (n = 153, 4–47 cm TL) collected in 1996 and 1997 (Steimle et al. 2000). In the Navesink River/Sandy Hook Bay estuarine system, sand shrimp occurred in 81% of Striped Searobin stomachs (n = 78, 12–37 cm TL; Manderson et al. 1999). This study is the fi rst documentation of the diet of adult Scup (FL > 15.5 cm; O’Brien et al. 1993, Steimle et al. 1999) inhabiting inshore waters of Long Island. Bivalves and annelids were identifi ed as important prey items. Our results differ from reports of adult Scup diet (n = 111, TLavg = 16 cm) in offshore waters of south-ern New England, where animal remains and polychaetes made up a majority of the diet (Bowman et al. 2000). Between 1981 and 1990, dietary analysis of Scup (n = 330, 11–40 cm TL) revealed that annelids and amphipods were essential prey items, with mollusks of occasional importance (Steimle et al. 1999). The predomi-nance of bivalves in the diet of Scup was also absent from specimens collected inshore within the lower Hudson-Raritan estuary. Scup (n = 254, 8–24 cm FL) fed upon smaller prey items including unidentifi ed organic matter and mysid shrimp between July 1996 and November 1997 (Steimle et al. 2000). However, Steimle et al. (2000) chose to report Scup diet by pooling results from juveniles (<15.5 cm FL) and adult Scup (>15.5 cm FL), which may have masked differences between the diets of different life stages. High bivalve presence in Scup diet from Long Is-land bays during early summer followed by a drop off in late summer may parallel the abundance of these benthic organisms. The temporal trends in clam consump-tion may correspond to the abundance of YOY and juvenile clams during periods of high nutritive value of sediment that promotes benthic growth in early summer more effectively than later in the season (Cheng et al. 1993). Here we provide the first description of adult Windowpane Flounder (>21.2 cm TL; O’Brien et al. 1993) diet for bay waters of Long Island. Although the cumulative prey curve appeared close to an asymptote, a larger sample size would have enhanced descriptive power. This species primarily consumed mysid shrimp and to a lesser extent sand shrimp. Our results agree with diet composition for Windowpane Flounder (n = 132, TLavg = 26 cm) in offshore waters south of New England where crustaceans including sand and mysid shrimp were important prey items (Bowman et al. 2000). However, we found very little teleost consumption, whereas in the offshore environment, sand lance was classified as an important prey item (Bowman et al. 2000). The dominance of planktonic mysid shrimp has also been documented in neighboring waters. Between 1982 and 1985 in the New York Bight, the Windowpane Flounder diet (n = 131) predominantly consisted of mysid shrimp (Steimle and Terranova 1991). Similarly, Windowpane Flounder (n = 570, 2–35 cm TL) sampled from the Hudson-Raritan estuary in 1996 and 1997 fed heavily on mysid shrimp, while also consuming modest amounts of sand shrimp (Steimle et al. 2000).
S.R. Sagarese, R.M. Cerrato, and M.G. Frisk2011 309
Mysid shrimp cluster near the sea floor during daylight due to their negatively phototaxic nature and, as a result, are vulnerable to demersal predators like Windowpane Flounder (Steimle et al. 2000). In addition, Windowpane Floun-der have a small gape size (distance between the maxillary bones in the mouth interior), which favors the consumption of smaller prey such as mysid shrimp, as they only reach about 2 cm in length. Windowpane Flounder exhibited the lowest SFI due to the consistent consumption of minute crustaceans. The diet composition of late juvenile and adult (>59 cm TL; Sosebee 2005) Clearnose Skate reported in this study is the fi rst from Long Island waters. Skates were collected from Shinnecock Bay between June and August after making their annual northern migration (Frisk 2010, Sosebee 2005). While a small number of specimens were obtained, the cumulative prey curve indicates our sample size was suffi cient to identify major prey items. This species primarily consumed Rock Crab and sand shrimp. Our fi ndings contrast the diet composition for Clear-nose Skate (n = 36, TLavg = 53 cm) in offshore waters of the northwest Atlantic, where teleosts including Weakfi sh and fl atfi shes were important prey items in the oceanic environment (Bowman et al. 2000). Our results also differ with observa-tions that crabs (Rock Crab and Ovalipes ocellatus J.F.W. Herbst [Lady Crab]) are more important for Clearnose Skates under 60 cm TL (McEachran 2002). Seventy percent of our specimens contained Rock Crab in their stomach contents in varying quantities, possibly refl ecting a high abundance of Rock Crab in Long Island waters. Clearnose Skate diet (n = 96) in Delaware Bay during the summers of 1989–1994 showed Rock Crab and Ensis directus Conrad (Razor Clam) as dominant prey items (Steimle et al. 2000). In the lower Hudson-Raritan estuary during the summers of 1996 and 1997, Clearnose Skate diet (n = 71, 49–86 cm TL) consisted mostly of Rock Crab and sand shrimp (Steimle et al. 2000). One similarity between the present study and Steimle et al. (2000) is that most Clear-nose Skate analyzed had contents within their gut as is common for demersal carnivores (Wetherbee and Cortés 2004). The last predatory fi sh species we examined was Striped Bass, but because of small sample sizes, results are preliminary. Although a small sample size pre-vented in-depth examination of spatial and temporal trends, we chose to present our results because this species is currently an important predator in the system. Concurrent with an increase in Atlantic Striped Bass from 10 million fi sh in the early 1980s to over 50 million fi sh in recent years (ASMFC 2010, Hartman and Margraf 2003, Shepard 2006), increased abundance is refl ected in seine surveys conducted by New York State along the south shore of Long Island (Socrates 2006). Striped Bass primarily consumed teleosts including Summer Flounder and occasionally fed upon sand shrimp. This species exhibited the highest proportion of empty stomachs likely due to capture method, as passive gear such as hook and line tends to attract individuals in a population that are actively feeding (Cortés 1997, Wetherbee and Cortés 2004). Steimle et al. (2000) analyzed Striped Bass diet (n = 280, 13–65 cm TL) between 1996 and 1997 and identifi ed sand shrimp as the most important prey item, while observing some teleost consumption throughout the time period.
Northeastern Naturalist Vol. 18, No. 3310
Throughout our intensive sampling seasons, we were unable to obtain adequate sample sizes for in-depth study of all fi shes chosen for analysis. While our gear types proved capable of capturing predatory fi shes, with the exception of Striped Bass, additional sampling effort and supplementary gears such as gill nets may have increased sample sizes. In summary, the general diet composition results presented in this study are intended to provide a snapshot of the Long Island en-vironment, showing the role of each species within the food web of Long Island bays. The observed diet information for predatory fi shes has important implica-tions for ecosystem analysis and management of Long Island bays (Nuttall 2010). Development of ecosystem models of GSB have relied on data from neighboring ecosystems, which may result in inaccurate representation of the system’s trophic dynamics (Nuttall 2010). For example, in the case of Scup, utilization of previous diet-composition studies would have underrepresented the importance of bivalves and overrepresented the importance of annelids within GSB. This study provides diet information specifi c to the Long Island ecosystem and highlights regional dif-ferences in diet composition for adult Summer Flounder and YOY Bluefi sh. Our results for Windowpane Flounder, Clearnose Skate, and adult Scup are the fi rst reported diet composition within Long Island waters. Continued investigation of general, temporal, and ontogenetic diet shifts of fi shes should be undertaken to continue building a suffi cient diet-composition database for underrepresented fi shes in Long Island bays for use in multispecies models and by managers.
Acknowledgments
We thank graduate students M. Yencho, M. Nuttall, C. Martinez, and C. Hall, and many undergraduate students, especially A. Uhlich, for assisting with fi eld sampling. A. Jordaan provided comments to improve this manuscript. Also, we are grateful for the hard work of Captains M. Wiggins and D. Bowman from the Marine Science Research Center and D. Getz, R. McIntyre, and B. Gagliardi from the Stony Brook-Southampton Marine Station. Funding for this project was provided by the New York State Department of Environmental Conservation.
Literature Cited
Anderson, M.J. 2001. A new method for non-parametric multivariate analysis of vari-ance. Austral Ecology 26:32–46.
Bogstad, B., M. Pennington, and J.H. Volstad. 1995. Cost-effi cient survey designs for estimating food consumption by fi sh. Fisheries Research 23:37–46.
Bowman, R.E., C.E. Stillwell, W.L. Michaels, and M.D. Grosslein. 2000. Food of North-west Atlantic fi shes and two common species of squid. NOAA Technical Memoran-dum NMFS–F/NE–155. 138 pp.
Braccini, J.M., B.M. Gillanders, and T.I. Walker. 2005. Sources of variation in the feed-ing ecology of the Piked Spurdog (Squalus megalops): Implications for inferring predator-prey interactions from overall dietary composition. ICES Journal of Marine Science 62:1076–1094.
Buckel, J.A., and D.O. Conover. 1997. Movements, feeding periods, and daily ration of piscivorous young-of-the-year Bluefi sh (Pomatomus saltatrix) in the Hudson River estuary. Fishery Bulletin 95:665–679.

S.R. Sagarese, R.M. Cerrato, and M.G. Frisk2011 311
Buckel, J.A., and K.A. McKown. 2002. Competition between juvenile Striped Bass and Bluefi sh: Resource partitioning and growth rate. Marine Ecology Progress Series 234:191–204.
Buckel, J.A., D.O. Conover, N.D. Steinberg, and K.A. McKown. 1999. Impact of age-0 Bluefi sh (Pomatomus saltatrix) predation on age-0 fi shes in the Hudson River estu-ary: Evidence for density-dependent loss of juvenile Striped Bass (Morone saxatilis). Canadian Journal of Fisheries and Aquatic Sciences 56:275–287.
Buonaiuto, F.S., Jr., and H.J. Bokuniewicz. 2008. Hydrodynamic partitioning of a mixed energy tidal inlet. Journal of Coastal Research 24(5):1339–1348.
Cheng, I.J., J.S. Levinton, M. McCartney, D. Martinez, and M.J. Weissburg. 1993. A bioassay approach to seasonal variation in the nutritional value of sediment. Marine Ecology Progress Series 94:275–285.
Chipps, S.R., and J.E. Garvey. 2007. Assessment of diets and feeding patterns. Pp. 473–514, In C.S. Guy and M.L. Brown (Eds.). Analysis and Interpretation of Freshwater Fisheries Data. American Fisheries Society, Bethesda, MD. 961 pp.
Cochran, W.G. 1977. Sampling Techniques, 3rd Edition. John Wiley and Sons, New York, NY. 428 pp.
Cortés, E. 1997. A critical review of methods of studying fi sh feeding based on analysis of stomach contents: Application to elasmobranch fi shes. Canadian Journal of Fisher-ies and Aquatic Sciences 54:726–738.
Engers, J., and B. Buckner. 2000. The Great Book of Wildfowl Decoys, 1st Edition. Globe Pequot Press, Guilford, CT. 320 pp.
Friedland, K.D., G.C. Garman, A.J. Bejda, A.L. Studholme, and B. Olla. 1988. Interan-nual variation in diet and condition in juvenile Bluefi sh during estuarine residency. Transactions of the American Fisheries Society 117:474–479.
Frisk, M.G. 2010. Life-history strategies of batoids. Pp. 283–318, In J.C. Carrier, J.A. Musick, and M.R. Heithaus (Eds.). Sharks and their Relatives II: Biodiversity, Adap-tive Physiology, and Conservation. CRC Press, Boca Raton, FL. 736 pp.
Frisk, M.G., and S.B. Munch. 2008. Great South Bay fi shery independent survey. School of Marine and Atmospheric Sciences, Stony Brook University, Stony Brook, NY.
Gardinier, M.N., and T.B. Hoff. 1982. Diet of Striped Bass in the Hudson River Estuary. New York Fish and Game Journal 29(2):152–165.
Gelsleichter, J., J.A. Musick, and S. Nichols. 1999. Food habits of the Smooth Dogfi sh, Mustelus canis, Dusky Shark, Carcharhinus obscurus, Atlantic Sharpnose Shark, Rhizoprionodon terraenovae, and the Sand Tiger, Carcharias taurus, from the north-west Atlantic Ocean. Environmental Biology of Fishes 54:205–217.
Godwin, C., W. Laney, N. Meserve, S. Meyers, and G. Shepard. 2010. 2010 Review of the Atlantic States Marine Fisheries Commission Fishery Management Plan for At-lantic Striped Bass (Morone saxatilis), 2009 Fishing Year. A report prepared by the Atlantic Striped Bass Plan Review Team, [PROVIDE LOCATION]. 35 pp.
Green, B.S., and R.C. Chambers. 2007. Maternal effects vary between source popula-tions in the Atlantic Tomcod, Microgadus tomcod. Marine Ecology Progress Series 334:185–195.
Gross, M.G., D. Davies, P.M. Lin, and W. Loeffl er. 1972. Characteristics and environ-mental quality of six north shore bays, Nassau and Suffolk counties, Long Island, New York. Marine Sciences Research Center, State University of New York, Stony Brook, NY. Technical Report Series No. 14. 98 pp.
Hartman, K.J., and F.J. Margraf. 2003. US Atlantic coast Striped Bass: Issues with a recovered population. Fisheries Management and Ecology 10:309–312.
Northeastern Naturalist Vol. 18, No. 3312
Hinga, K.R. 2005. Water quality and ecology of Great South Bay (Fire Island National Seashore Science Synthesis Paper). Technical Report NPS/NER/NRTR—2005/019. National Park Service, Boston, MA.
Hureau, J.C. 1969. Biologie comparee de quelques poissons anarctiques (Nototheniidae). Bulletin of the Institut Oceanographique Monaco 68:1 44.
Hurst, T.P., and D.O. Conover. 2001. Diet and consumption rates of overwintering YOY Striped Bass, Morone saxatilis, in the Hudson River. Fisheries Bulletin 99:545–553.
Hyslop, E.J. 1980. Stomach contents analysis: A review of methods and the application. Journal of Fish Biology 17:411–429.
Juanes, F., and D.O. Conover. 1994. Rapid growth, high feeding rates, and early pi-scivory in young-of-the-year Bluefi sh, Pomatomus saltatrix. Canadian Journal of Fisheries and Aquatic Science 51:1752–1761.
Juanes, F., and D.O. Conover. 1995. Size-structured piscivory: Advection and the linkage between predator and prey recruitment in young-of-the-year Bluefi sh. Marine Ecol-ogy Progress Series 128:287 304.
Juanes, F., J.A. Buckel, and D.O. Conover. 1994. Accelerating the onset of piscivory: In-tersection of predation and prey phonologies. Journal of Fish Biology 45(Supplement A):41–54.
Juanes, F., R.E. Marks, K.A. McKown, and D.O. Conover. 1993. Predation by age-0 Bluefi sh on age-0 anadromous fi shes in the Hudson River estuary. Transactions of the American Fisheries Society 122:348–356.
Juanes, F., J.A. Buckel, and F.S. Scharf. 2001. Predatory behaviour and selectivity of a primary piscivore: Comparison of fi sh and non-fi sh prey. Marine Ecology Progress Series 217:157–165.
Latour, R.J., M.J. Brush, and C.F. Bonzek. 2003. Toward ecosystem-based fi sheries management: Strategies for multispecies modeling and associated data requirements. Fisheries 28:10–22.
Latour, R.J., J. Gartland, C.F. Bonzek, and R.A. Johnson. 2008. The trophic dynamics of Summer Flounder (Paralichthys dentatus) in Chesapeake Bay. Fishery Bulletin 106:47–57.
Link, J.S. 2002. Ecological considerations in fi sheries management: When does it mat-ter? Fisheries 27(4):10–17.
Mancini, F.T., III, and K.W. Able. 2005. Food habits of young-of-the-year estuarine fi shes in the middle Atlantic bight: A synthesis. Technical report. Institute of Marine and Coastal Sciences, Rutgers, The State of New Jersey, Tuckerton, NJ. 113 pp.
Manderson, J.P., B.A. Phelan, A.J. Bejda, L.L. Stehlik, and A.W. Stoner. 1999. Preda-tion by Striped Searobin (Prionotus evolans, Triglidae) on young-of-the-year Winter Flounder (Pseudopleuronectes americanus, Walbaum): Examining prey size selection and prey choice using fi eld observations and laboratory experiments. Journal of Ex-perimental Marine Biology and Ecology 242:211 231.
Manderson, J.P., B.A. Phelan, A.W. Stoner, and J. Hilbert. 2000. Predator-prey rela-tions between age-1+ Summer Flounder (Paralichthys dentatus, Linnaeus) and age-0 Winter Flounder (Pseudopleuronectes americanus, Walbaum): Predator diets, prey selection, and effects of sediments and macrophytes. Journal of Experimental Marine Biology and Ecology 251:17–39.
McArdle, B.H., and M.J. Anderson. 2001. Fitting multivariate models to community data: A comment on distance-based redundancy analysis. Ecology 82:290–297.
McEachran, J.D. 2002. Skates. Family Rajidae. Pp. 60 75, In B.B. Collette and G. Klein-MacPhee (Eds.). Bigelow and Schroeder’s Fishes of the Gulf of Maine. 3rd Edition. Smithsonian Institution Press, Washington, DC. 748 pp.
S.R. Sagarese, R.M. Cerrato, and M.G. Frisk2011 313
McEachran, J.D., and J. Davis. 1970. Age and growth of the Striped Searobin. Transac-tions of the American Fisheries Society 99:343–352.
McKinnon, A.D., S. Duggan, J.H. Carleton, and R. Böttger-Schnack. 2008. Summer planktonic copepod communities of Australia's North West Cape (Indian Ocean) dur-ing the 1997–1999 El Nino/La Nina. Journal of Plankton Research 30(7):839–855.
Modlin, R.F. 1980. The life cycle and recruitment of the sand shrimp, Crangon septems-pinosa, in the Mystic River estuary, Connecticut. Estuaries and Coasts 3:1 10.
New York Ocean and Great Lakes Ecosystem Conservation Act. 2006. In New York State Environmental Conservation Law, Article 14.
Nuttall, M.A. 2010. Historical recount of the Great South Bay ecosystem, Long Island, New York, and a quantitative assessment of the ecosystem structure of Great South Bay using Ecopath. M.Sc. Thesis. Stony Brook University, Stony Brook, NY. 200 pp.
O’Brien, L., J. Burnett, and R.K. Mayo. 1993. Maturation of nineteen species of fi nfi sh off the Northeast coast of the United States, 1985–1990. NOAA Technical Report NMFS 113. National Marine Fisheries Service, Woods Hole, MA. 66 pp.
Pauly, D., V. Christensen, and C. Walters. 2000. Ecopath, ecosim, and ecospace as tools for evaluating ecosystem impacts of fi sheries. ICES Journal of Marine Science 57:697 706.
Pinkas, L., M.S. Oliphant, and I.L.K. Iverson. 1971. Food habits of Albacore, Bluefi n Tuna, and Bonito in California waters. California Department of Fish and Game Fish Bulletin 152:1–105.
Poole, J.C. 1964. Feeding habits of the Summer Flounder in Great South Bay. New York Fish and Game Journal 11:28 34.
Richards, S.W., J.M. Mann, and J.A. Walker. 1979. Comparison of spawning seasons, age, growth rates, and food of two sympatric species of searobins, Prionotus caroli-nus and Prionotus evolans, from Long Island Sound. Estuaries 2:255–268.
Sagarese, S.R. 2009. Inshore movements, residency, and abundance of adult Winter Flounder, Pseudopleuronectes americanus, and piscivorous predation on young-of-the-year Winter Flounder within coastal bays of Long Island and an investigation on the effect of temperature and photoperiod on vertebral band deposition in Little Skate, Raja erinacea. M.Sc. Thesis. Stony Brook University, Stony Brook, NY. 151 pp.
Scharf, F.S., J.P. Manderson, M.C. Fabrizio, J.P. Pessutti, J.E. Rosendale, R.J. Chant, and A.J. Bejda. 2004. Seasonal and interannual patterns of distribution and diet of Bluefi sh within a Middle Atlantic bight estuary in relation to abiotic and biotic fac-tors. Estuaries and Coasts 27(3):426–436.
Schreiber, R.A. 1973. The fi shes of Great South Bay. M.Sc. Thesis. State University of Stony Brook, Stony Brook, NY, 199 pp.
Shepard, G. 2006. Status of Fishery Resources off the Northeastern US: Atlantic Striped Bass. December 2006. Northeast Fisheries Science Center Resource Evaluation and Assessment Division. Available online at http://www.nefsc.noaa.gov/sos/spsyn/af/sbass/. Accessed August 2010.
Socrates, J.B. 2006. A study of the Striped Bass in the Marine District of New York State. New York State Department of Environmental Conservation, East Setauket, NY. Completion Report for Project AFC-30.
Sosebee, K.A. 2005. Maturity of skates in Northeast United States waters. Journal of Northwest Atlantic Fishery Science 35:141–153.
Steel, R.G.D., J.H. Torrie, and D.A. Dickey. 1997. Principles and Procedures of Statis-tics: A Biometrical Approach. 3rd Edition. McGraw-Hill, New York, NY.
Northeastern Naturalist Vol. 18, No. 3314
Stehlik, L.L., and C.J. Meise. 2000. Diet of Winter Flounder in a New Jersey estuary: Ontogenetic change and spatial variation. Estuaries 23(3):381–391.
Steimle, F.W., and R. Terranova. 1991. Trophodynamics of select demersal fi shes in the New York Bight. NOAA Technical Memorandum NMFS–F/NEC–84. National Ma-rine Fisheries Service, Woods Hole, MA. 11 pp.
Steimle, F.W., C.A. Zetlin, P.L. Berrien, D.L. Johnson, and S. Chang. 1999. Essential fi sh habitat source document: Scup, Stenotomus chrysops, life history and habitat charac-teristics. NOAA Technical Memorandum NMFS–NE–149. National Marine Fisheries Service, Woods Hole, MA. 39 pp.
Steimle, F.W., R.A. Pikanowski, D.G. McMillan, C.A. Zetlin, and S.J. Wilk. 2000. De-mersal fi sh and American Lobster diets in the lower Hudson-Raritan estuary. NOAA Technical Memorandum NMFS–NE161. National Marine Fisheries Service, Woods Hole, MA. 106 pp.
US Fish and Wildlife Service (USFWS). 1997. Northeast coastal areas study signifi cant coastal habitats site 4 (NY). In Signifi cant Habitats and Habitat Complexes of the New York Bight Watershed. Available online at http://library.fws.gov/Pubs5/necas/web_link/4_port%20jefferson.htm. Accessed 12 April 2010.
Wetherbee, B.M., and E. Cortés. 2004. Food consumption and feeding habits. Pp. 223–244, In J.C. Carrier, J.A. Musick, and M.R. Heithaus (Eds.). Biology of Sharks and their Relatives. CRC Press, Boca Raton, FL. 608 pp.
Wilcox, J.R., and H.P. Jeffries. 1973. Growth of the sand shrimp, Crangon septems-pinosa, in Rhode Island. Chesapeake Science 14(3):201 205.
Wilson, R.E., K.C. Wong, and H.H. Carter. 1991. Aspects of circulation and exchange in Great South Bay. Pp. 9–22, In J.R. Schubel, T.M. Bell, and H.H. Carter (Eds.). The Great South Bay. State University of New York Press, Stony Brook, NY. 107 pp.