diagnostic validity: personality assessment in the emuaz-ns.org/presentations/locke.pdf ·...
TRANSCRIPT

Diagnostic Validity:
Personality Assessment in the
EMU
Dona E.C. Locke, PhD, ABPP
Arizona Neuropsychological Society
3.16.2013

Learning Objectives
• Review of diagnostic validity concepts.
• Brief review of literature on personality
assessment measures in the EMU setting.
• Apply diagnostic validity concepts to
personality assessment in the EMU.

Diagnostic Validity
• Asking the right question
– Can we predict a person’s group membership
based on their test score?

Criterion:Best estimate of reality
(i.e., person has condition)
Yes No
Yes A B A+BTestPrediction No C D C+D
A+C B+D A+B+C+D
Sensitivity = A / (A+C) A+DHit Rate =
A+B+C+D
Specificity = D / (B+D)
Pos. Pred. Value = A / (A+B)Odds Ratio = AD / BC
(Complex Derivation)
Neg. Pred. Value = D / ((C+D)
Sensitivity A / (A+C)Likelihood Ratio =
1 - Specificity=
B / (B+D)
*Taken with permission from a previous presentation by Glenn Smith, PhD

Sensitivity/Specificity
• Sens/Spec:
– Proportion with the dx with a positive test
– Proportion without the dx with a negative test
– Are NOT base rate dependent
• Sp-in and Sn-out:
– High specificity means a positive result rules in the dx
– High sensitivity mean a negative result rules out the dx

Likelihood Ratios
• Likelihood Ratio
– LR+: probability of an individual with the dx having a positive test / probability of an individual without the dx having a positive test
Or: sensitivity / 1-specificity
– LR-: probability of an individual with the dx having a negative test / probability of an individual without the dx having a negative test
Or: 1-sensitivity / specificity

Likelihood Ratios
• Combines sensitivity/specificity information
– Examples:
• 80% sen; 50% spec: LR+ = .80 / 1-.50 = 1.6
LR- = 1-.80 / .50 = 0.4
• 80% sen; 90% spec: LR+ = .80 / 1-.90 = 8.0
LR- = 1-.80 / .90 = 0.22
• Is not a function of base rate
– 1 = no change in likelihood of COI
– >1 = increase in likelihood of COI
– <1 = decrease in likelihood of COI

Using LR to calculate post-test probability
of COI
• Pre-test odds = BR / 1-BR
• Post-test odds = LR * pretest odds
• Post-test probability = Post-test odds /
Post-test odds + 1

Using LR to calculate post-test probability
of COI
• Example: BR = 30%
– Pre-test odds = BR / 1-BR = .30 / .70 = .43
• 80% sen; 60% spec; LR+ = 1.6
– Post-test odds = LR * pre odds = 1.6 * .43 = 0.68
– Post-test probability = Post-test odds / Post-test
odds + 1 = 0.68 / 1.68 = 41%

Example 2
• Example: BR = 30%
– Pre-test odds = BR / 1-BR = .30 / .70 = .43
• 80% Sen; 90 % Spec; LR+ = 8.0
– Post-test odds = LR * pretest odds = 8 * .43 = 3.44
– Post-test probability = Post-test odds / Post-test
odds + 1 = 3.44 / 4.44 = 77%

Example 3
• Example: BR = 50%
– Pre-test odds = BR / 1-BR = .50 / .50 = 1
• 80% Sen; 90 % Spec; LR+ = 8.0
– Post-test odds = LR * pretest odds = 8 * 1 = 8.0
– Post-test probability = Post-test odds / Post-test
odds + 1 = 8 / 9 = 89%

Epilepsy Monitoring Unit
• Mayo Clinic Arizona EMU standard is routine neuropsychological evaluation during admission
• Role of Neuropsychology:
– Cognitive + Personality Assessment
– Most have cognitive complaints (regardless of eventual d/c dx)
– Patients with epilepsy have mood and anxiety disorders at a rate higher than the general population
– Neurology appreciates psychologist’s formulation for a patient with psychogenic spells

Personality Assessment
• Questions of Interest:
– 1. Is there evidence of “somatization”
– 2. Is there evidence of mood disorder
– 3. Is there evidence of anxiety disorder
– 4. Is there evidence of “axis II traits”
– ….
• Possible measures during 2008 decision making:
– MMPI-2, PAI, MMPI-2-RF

MMPI-2 vs PAI
• PAI
– Pros
• Shorter, lower reading level
• More straightforward scales
• At Mayo Arizona used
extensively outpatient
– Cons
• Historically not as much EMU
research (more now)
• MMPI-2
– Pros:
• Some research literature in
EMU
• Historical clinical use
– Cons:
• Long
• More complex decision rules:
“conversion V”
• Psychometric weaknesses

MMPI-2-RF
• Significant restructuring of MMPI-2
– Pros
• Much shorter (338)
• Improved psychometrics
• Can be rescored from existing MMPI-2 protocol (no
new items, but also no new norms)
– Cons
• Zero EMU research
• Considerably different from MMPI-2 especially Scale 3

MMPI-2 scales of interest• Scale 1: Hypochondriasis
– Dramatic and possibly bizarre somatic concerns
– Vague, nonspecific physical complaints
– Preoccupation with health problems
– Tendency to develop physical symptoms in response to stress; consider psychological component to illness in medical patients
– General pop (50T) < medical pts (60T) < somatoform (70-80T+)
• Scale 3: Hysteria– Perception of poor physical health
– Often feel overwhelmed and react to stress with increased physical symptoms
– General denial of (?lack of awareness of) emotional problems
– Naïve optimism about others
– General pop (50T) < medical pts (60T) < somatoform (70-80T+)
Graham JR (2006). MMP-2: Assessing personality and psychopathology. 4th ed

PAI scales of interest
• Somatic Complaints scale– Concerns about physical functioning and health
– Probable impairment from somatic concerns
– Marked elevations reflect multiple system complaints
• 3 subscales– Conversion: Impaired due to sensory/motor
dysfunction
– Somatization: High frequency and variety of complaints in addition to vague complaints
– Health Concern: Preoccupation with health and physical problems. Social interactions focus on health.
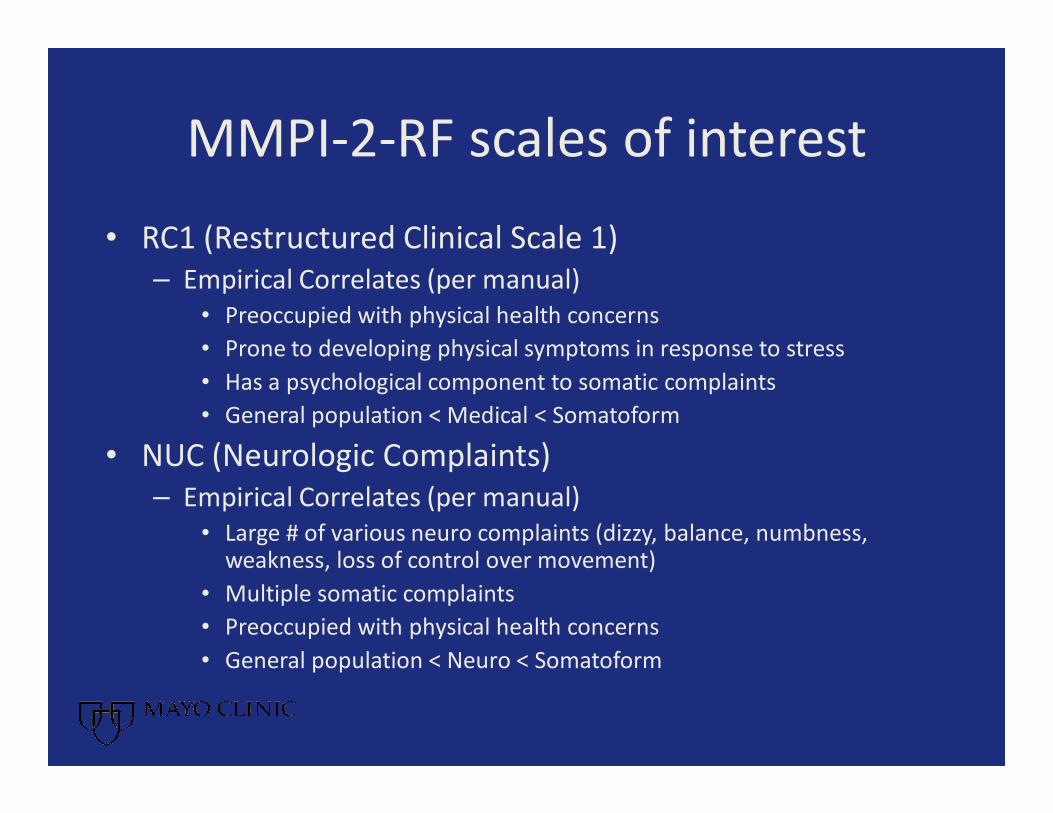
MMPI-2-RF scales of interest
• RC1 (Restructured Clinical Scale 1)
– Empirical Correlates (per manual)
• Preoccupied with physical health concerns
• Prone to developing physical symptoms in response to stress
• Has a psychological component to somatic complaints
• General population < Medical < Somatoform
• NUC (Neurologic Complaints)
– Empirical Correlates (per manual)
• Large # of various neuro complaints (dizzy, balance, numbness, weakness, loss of control over movement)
• Multiple somatic complaints
• Preoccupied with physical health concerns
• General population < Neuro < Somatoform

MMPI-2 in the EMU
• 2 sets of decision rules:
– Wilkus: 68% sen; 55% spec: LR = 1.5
– Derry & McLachlan: 48% sen; 58% spec: LR = 1.14
Cragar et al. (2003) JCEN, 25, 793-807

PAI in the EMU
• Somatic Complaints scale– SOM > 70
• 56% sens; 73% spec: LR = 2.1
– SOM-C > 70• 59% sens; 84% spec: LR = 3.7
– “NES Indicator”• SOM-C minus SOM-H (+ = NES; - = ES)
• 84% sens; 73% spec: LR = 3.1
Wagner et al. (2005). Epilepsy Behav, 7, 301-4;

Prior Research Summary:
• MMPI-2
– Decision rules with 1 and 3; “conversion v”
– LR = 1.1 – 1.5
• PAI
– SOM, SOM-C, NES Indicator
– LR = 2.1-3.7
• MMPI-2-RF
– nada

Mayo Arizona studies
• MMPI-2/PAI randomized trial (Locke et al. E&B, 2011, 21, 397-401)
• MMPI-2/MMPI-2-RF rescoring trial (Locke et al, E&B, 2010, 17,
252-258)
• Incorporating validity profile
– PAI (Purdom et al. E&B, 2012, 25, 534-538)
– MMPI-2-RF (Wershba & Locke, TCN, 2012, 26, 439)

Randomized Trial
• 2008-2010
• PAI/MMPI-2
• Randomly administered PAI or MMPI-2 during
EMU eval

Randomized Trial
• A priori indicators of interest:
• PAI– SOM > 70
– SOM-C > 70
– Stroup criteria (SOM-C > 70 or DEP-P > 70)
– Wagner NES indicator ( SOM-C minus SOM-H)
• MMPI-2– Derry & McLachlan
– Wilkus et al.
• Secondary: MMPI-2-RF rescoring– RC1
Locke, et al. (2011). E&B, 21, 397-401.

Randomized Trial
• Validity Exclusions:
– 5 PAIs
– 3 MMPI-2
– 2 MMPI-2-RF
Locke, et al. (2011). E&B, 21, 397-401.

Results


Considering Validity Profile: PAI
• 2010: Began full time administration of PAI on EMU
• Sample
– 78 PAIs from randomized trial
– 208 other PAIs (mostly since trial)
• Diagnoses
– 113 Epilepsy (39.5%)
– 86 PNES (30.1%)
– 29 other medical
– 3 both
– 55 indeterminate
Purdom et al. (2012) E&B, 25, 534-538.

Sample
• Content independent validity exclusions
– 12 protocols: INC > 73 and INF >75
– Final sample: 187 (106 ES; 81 PNES)
• Validity Categories
– High PIM (> 57; n=62)
– High NIM (< 73; n = 9)
– Neither (n=116)
Purdom et al. (2012) E&B, 25, 534-538.

ROC analysis: SOM
No difference in AUC for SOM with PIM (.76) or without bias (.77)

ROC analysis: SOM-C
No difference in AUC for SOM-C with PIM (.76) or without bias (.75)

Best Classification Rates
Scale Score SN SP HR LR
SOM +
PIM
72T 56% 91% 76% 6.2
SOM
no bias
70T 77% 69% 72% 2.5
SOM-C
+ PIM
59T
68T
85%
59%
57%
83%
69%
73%
2.0
3.5
SOM-C
no bias
77T 56% 88% 75% 4.6

Comparison:
SOM 70T (clinical cutoff); 30% base rate
• No bias
– 77% sn
– 69% sp
– 2.5 LR
– Post test prob 52%
• + PIM
– 59% sn
– 86% sp
– 4.2 LR
– Post test prob 64%
• Sp-in and Sn-out
– High specificity means a positive result rules in the dx
– High sensitivity mean a negative result rules out the
dx

Comparison #2:
SOM 80T; 30% base rate
• No bias
– 44% sn
– 88% sp
– 3.7 LR
– Post test prob 61%
• + PIM
– 19% sn
– 97% sp
– 6.5 LR
– Post test prob 73%

• Overall classification rates similar with and without PIM bias.
• Few in our sample with high NIM.
• BUT: sen/spec different at specific cut scores with PIM and without bias.
• With PIM, spec higher so PPP higher, but sens lower so NPP lower.
• Without PIM or NIM, sens higher so NPP higher, but spec lower so PPP lower.
Considering Validity Profile: PAI

U of M MMPI-2-RF rescoring grant
• Retrospective rescoring
• 2001-2009
• 653 full length MMPI-2s on EMU
– 214 epilepsy (33%)
– 215 PNES (33%)
– 24 both (3.5%)
– 34 other physiological dx (5.5%)
– 166 indeterminate (25%)
Locke et al. (2010). Epilepsy Behav. 17, 252-258.

MMPI-2-RF
• Pulled only confirmed ES or PNES
• Rescored to MMPI-2-F
– 214 ES
– 215 PNES
• Excluded invalid protocols
– missing items or random protocols
• Final sample:
– 196 ES
– 203 PNES

Diagnostic Utility RC1

Diagnostic Utility NUC

Specific Example
RC 1 T score = 74
• Base Rate = 33%– Pre-test odds = BR / 1-BR = .33 / .67 = .49
• 48% Sen; 81% Spec; LR+ = 2.5– Post-test odds = LR+ * pretest odds = 2.5 * .49 =
1.23
– Post-test probability = Post-test odds / Post-test odds + 1 = 1.23 / 2.23 = 55%

Specific Example
RC 1 T score = 90
• Base Rate = 33%– Pre-test odds = BR / 1-BR = .33 / .67 = .49
• 14% Sens, 97% Spec; LR+ = 4.5– Post-test odds = LR * pretest odds = 4.5 * .49 = 2.2
– Post-test probability = Post-test odds / Post-test odds + 1 = 2.2 / 3.2 = 69%

Considering Validity Profile:MMPI-2-RF
• MMPI-2-RF Validity Scales
– NIM: F-r, Fs
– PIM: L-r, K-r
– Aspects of both: FBS-r
• Moderation and suppression
– Moderation: Overall classification rate varies at different levels of bias
– Suppression: Optimal cut score varies at different levels of bias
Wershba R & Locke DE (2012). TCN, 26, 439.

Results
• No moderation (similar classification rates)
• RC1 & NUC: suppression with F-r, Fs, K-r, L-r
• With NIM indicators, optimal cut score
increased with higher levels of bias
• With PIM indicators, optimal cut score
decreased with higher levels of bias

• With higher NIM, best classification rate at higher cut score
• With higher PIM, best classification rate at lower cut score
• Sensitivity/Specificity

Comparison:
RC1 70T (clinical cutoff); 30% Base Rate
• Rescoring trial
– 64% sn
– 71% sp
– 2.2 LR
– Post test prob: 49%
• Wershba analysis
• High F-r (>79T)
– 82% sn
– 35% sp
– 1.3 LR
– Post test prob: 36%
• Low F-r (<55)
– 19% sn
– 93% sp
– 2.7 LR
– Post test prob: 54%

Comparison:
NUC 85T (best hit rate); 30% Base Rate
• Rescoring trial
– 53% sn
– 81% sp
– 2.8 LR
– Post test prob: 54%
• Wershba analysis
• High L-r (> 60)
– 36% sn
– 93% sp
– 5.1 LR
– Post test prob: 69%
• Low L-r (<50)
– 71% sn
– 77% sp
– 3.1 LR+
– Post test prob: 60%

Considering Validity Profile:MMPI-2-RF
• Again, classification accuracy similar with and
without bias.
• But, sens/spec quite different
• As NIM increases, sens higher so NPP higher,
but spec lower so PPP lower
• As PIM increases, spec higher so PPP higher,
but sens lower so NPP lower (same as we
found on PAI).

Considerations
• This only reviews somatoform risk indicators
• They get the gold standard anyway
• Multivariate analyses?
– Scale combinations
– Scales + medical history
• What about evaluation of mood disorders, anxiety disorders, etc?
• Impact of co-morbid functional somatic syndromes?
• Predictive of outcome?

Summary
• Diagnostic validity means moving beyond
sensitivity and specificity.
• Sens/Spec should be given for the range of
scores to be most clinically applicable.
• LR combined with your base rate gives you
relevant post-test probability information.
• On PAI and MMPI-2-RF, validity profile impacts
sens/spec

Summary
• Interesting that few pt. elevate NIM on the PAI
• On the PAI, SOM and SOM-C perform similarly
(70-75% correct classification)
• On MMPI-2-RF, RC1 and NUC perform
similarly (65-70% correct classification)
