development of prediction models of high temperature crumb rubber
TRANSCRIPT
Clemson UniversityTigerPrints
All Dissertations Dissertations
5-2008
DEVELOPMENT OF PREDICTION MODELSOF HIGH TEMPERATURE CRUMB RUBBERMODIFIED BINDERSCarl ThodesenClemson University, [email protected]
Follow this and additional works at: http://tigerprints.clemson.edu/all_dissertations
Part of the Civil Engineering Commons
This Dissertation is brought to you for free and open access by the Dissertations at TigerPrints. It has been accepted for inclusion in All Dissertations byan authorized administrator of TigerPrints. For more information, please contact [email protected].
Recommended CitationThodesen, Carl, "DEVELOPMENT OF PREDICTION MODELS OF HIGH TEMPERATURE CRUMB RUBBER MODIFIEDBINDERS" (2008). All Dissertations. Paper 196.
i
DEVELOPMENT OF PREDICTION MODELS OF HIGH TEMPERATURE CRUMB RUBBER MODIFIED BINDERS
A Dissertation Presented to
the Graduate School of Clemson University
In Partial Fulfillment of the Requirements for the Degree
Doctor of Philosophy Civil Engineering
by Carl Christian Thodesen
May 2008
Accepted by: Serji Amirkhanian, Committee Chair
William Bridges Bradley Putman
Prasad Rangaraju
ii
ABSTRACT
The purpose of this research was to identify and model critical elements of the
asphalt rubber matrix contributing to the crumb rubber modified (CRM) binder properties
as measured by Superpave testing procedures. Current models are neither applicable (due
to new testing procedures) nor practical (due to the difficulty of application or lack of
accuracy). Therefore, this research investigated the development of predictive models for
estimating binder properties within a specified range of accuracy.
Multiple crumb rubber sources were evaluated in order to gain an understanding
of the differences between the various crumb rubbers. This analysis permitted
identification of the important parameters, thus allowing for an accurate model to be
developed. Analysis of the crumb rubber particles involved the determination of the glass
transition temperature, chemical and visual analysis by scanning electron microscope.
Once the critical parameters were established, other test data was obtained from
research projects conducted at other labs. This allowed a broader model to be developed,
a model which would not be specific to one specific tester and lab facility. Ultimately a
total of 17 virgin binder sources from 10 separate regions were evaluated; a further 12
crumb rubber sources were used in conjunction with the various binder sources.
The nonlinear empirical models for estimation of CRM binder properties were
developed using the nonlinear least squares method. The accuracy of the various models
was evaluated by identifying 95% confidence intervals for the binder property estimation.
Validation of the models was performed using a fractional factorial design with
iii
previously untested CRM binders and this step confirmed the accuracy of the various
models.
Findings suggest that the effect of the crumb rubber in the binder tends to enhance
the effects of the base binder. This indicates that, for CRM binder, the properties of the
base binder typically have a greater influence on CRM binder properties than the
properties of the crumb rubber used in the matrix. It was possible to develop empirical
models depicting the changes in viscosities, G*/sinδ values, and failure temperatures. The
Rubber coefficient for viscosity (Rcv) and G*/sinδ (Rcg) were important parameters when
estimating CRM binder properties. These coefficients are representative of the effects of
the various crumb rubbers on the binders; generally, it was seen that ambient crumb
rubbers had higher Rcv and Rcg values than cryogenic rubbers.

iv
DEDICATION
I would like to dedicate this work to my family; I know that without their support
this would not have been possible.
v
ACKNOWLEDGMENTS
I would like to acknowledge everyone that has contributed to this dissertation.
Specifically, I would like to thank Dr. Serji Amirkhanian for his help and guidance over
the years. He allowed me to choose a direction of study and go with it, for better or
worse. I am fortunate to have had an advisor such as Serji, and can only hope that one
day my children will have a mentor like him.
Special thanks to my other committee members, Dr. Billy Bridges, Dr. Brad
Putman, and Dr. Prasad Rangaraju for their countless hours of advising and input into my
research. This research would not have been completed in as timely a manner had it not
been for their collective efforts.
Thanks to everyone at the Asphalt Rubber Technology Service (ARTS) and the
Clemson Civil Engineering Department for making my time here so enjoyable. I would
like to thank the Government of Norway and Laanekassen for funding my American
adventure. Also, I would like to acknowledge the Istituto Tecnico Guglielmo Marconi in
Asmara, Eritrea. This was where my interest in Civil Engineering started all those years
ago.
Mom, Dad, and Epi: thanks for always being there and giving me a sense of
direction. Finally, my deepest thanks to Bridget who had to deal with me on a daily basis;
without a personal cheerleader like you, I don’t know how I would have finished.
vi
TABLE OF CONTENTS
........................................................................................................................................ Page TITLE PAGE ....................................................................................................................... i ABSTRACT ........................................................................................................................ ii DEDICATION ................................................................................................................... iv ACKNOWLEDGMENTS .................................................................................................. v CHAPTER ONE INTRODUCTION .............................................................................................................. 1
Significance of Work ...................................................................................................... 3 Objectives ....................................................................................................................... 5 Scope ............................................................................................................................... 6 Organization of Dissertation ........................................................................................... 8
CHAPTER TWO
LITERATURE REVIEW ................................................................................................... 9
Background ..................................................................................................................... 9 SHRP Testing................................................................................................................ 15 Binder Property Models ................................................................................................ 19
CHAPTER THREE MATERIALS AND EXPERIMENTAL PROCEDURES ............................................... 24
Materials ....................................................................................................................... 24 Experimental Plan ......................................................................................................... 28 Methods......................................................................................................................... 36 Characterization of CRM .............................................................................................. 37 Viscosity Testing .......................................................................................................... 39 G*/sinδ Testing ............................................................................................................. 40
vii
Table of Contents (Continued) ........................................................................................................................................ Page CHAPTER FOUR
STATISTICAL ANALYSIS PROCEDURES ................................................................. 41
Analysis of Variance (ANOVA) ................................................................................... 41 Fisher’s Least Significant Difference (LSD) ................................................................ 43 Regression Analysis ...................................................................................................... 44 95% Confidence Interval .............................................................................................. 48 Fractional Factorial Design ........................................................................................... 49
CHAPTER FIVE MODEL DEVELOPMENT .............................................................................................. 52
Viscosity Model ............................................................................................................ 52 Failure Temperature Model .......................................................................................... 56 Universal Model ............................................................................................................ 61
CHAPTER SIX
EXPERIMENTAL RESULTS AND DISCUSSION ....................................................... 64
Task 1: Characterization of Crumb Rubber Properties ................................................. 64 Task 2: Effect of Crumb Rubber on Binder Properties ................................................. 68 Task 3: Viscosity Model Results .................................................................................. 82
Task 4: G*/sinδ and FT Model Results ........................................................................ 87 Task 5: Universal Model results ................................................................................... 93 Task 6: Verification Study .......................................................................................... 104
viii
Table of Contents (Continued) ........................................................................................................................................ Page CHAPTER SEVEN
SUMMARY, CONCLUSIONS, AND RECCOMENDATIONS FOR FUTURE RESEARCH .................................................................................................................... 112
Summary ..................................................................................................................... 112 Conclusions ................................................................................................................. 114 Recommendations ....................................................................................................... 117
APPENDICES ................................................................................................................ 119
Appendix A
Crumb Rubber Elemental Analysis Test Data ............................................................ 120
Appendix B
CRM Binder Viscosity Experimental Data ................................................................. 129
Appendix C
G*/sinδ results of CRM binder from binder Sources A and B ................................... 133
Appendix D
Experimental Drained CRM Binder Viscosity Data ................................................... 141
Appendix E
Experimental Drained G*/sinδ Data ........................................................................... 145
Appendix F Experimental Data for Failure Temperature ............................................................... 149
ix
Table of Contents (Continued) ........................................................................................................................................ Page
Appendix G
Experimental Data for Viscosity ................................................................................. 153 Appendix H
Experimental Data for G*/sinδ .................................................................................. 156
Appendix I Viscosity Verification Data ......................................................................................... 162
Appendix J
G*/sinδ Verification Data ........................................................................................... 167
Appendix K
Failure Temperature Verification Data ....................................................................... 188 REFERENCES ............................................................................................................... 192
x
LIST OF TABLES
Table Page
3.1 Description of binder used in this research study ..............................................25
3.2 (a) ADOT and (b) SCDOT gradations ...............................................................26
3.3 Description of crumb rubber used in this research study ...................................27
4.1 Example of an ANOVA table for a completely randomized design .....................................................................................42
4.2 Standard order approach for fractional factorial design ....................................51
6.1 Mean Rcv by Binder Source ................................................................................84
6.2 Rcv by Grinding Procedure .................................................................................84
6.3 Rcg by (a) Binder source, (b) Grinding procedure, and (c)
Crumb rubber source ..................................................................................92
6.4 Coefficients for ambient, cryogenic, and virgin binders ....................................94
A.1 Crumb rubber elemental analysis data for Carbon ...........................................120
A.2 Crumb rubber elemental analysis data for Oxygen ..........................................121
A.3 Crumb rubber elemental analysis data for Aluminum .....................................122
A.4 Crumb rubber elemental analysis data for Silicon ...........................................123
A.5 Crumb rubber elemental analysis data for Sulfur ............................................124
A.6 Crumb rubber elemental analysis data for Calcium .........................................125
A.7 Crumb rubber elemental analysis data for Chlorine ........................................126
A.8 Crumb rubber elemental analysis data for Iron ................................................127
A.9 Crumb rubber elemental analysis data for Zinc ...............................................128
xi
List of Tables (Continued) Table Page
B.1 CRM binder viscosity experimental data for CRM Source
1................................................................................................................129
B.2 CRM binder viscosity experimental data for CRM Source 2................................................................................................................130
B.3 CRM binder viscosity experimental data for CRM Source
3................................................................................................................131
B.4 CRM binder viscosity experimental data for CRM Source 4................................................................................................................132
C.1 G*/sinδ results of CRM binders made with CRM Source
1 tested at 64oC ........................................................................................133
C.2 G*/sinδ results of CRM binders made with CRM Source 1 tested at 76oC ........................................................................................134
C.3 G*/sinδ results of CRM binders made with CRM Source
2 tested at 64oC ........................................................................................135
C.4 G*/sinδ results of CRM binders made with CRM Source 2 tested at 76oC ........................................................................................136
C.5 G*/sinδ results of CRM binders made with CRM Source
3 tested at 64oC ........................................................................................137
C.6 G*/sinδ results of CRM binders made with CRM Source 3 tested at 76oC ........................................................................................138
C.7 G*/sinδ results of CRM binders made with CRM Source
4 tested at 64oC ........................................................................................139
C.8 G*/sinδ results of CRM binders made with CRM Source 4 tested at 76oC ........................................................................................140
D.1 Viscosity results of drained CRM binder made with CRM
Source 1 at 135oC.....................................................................................141
xii
List of Tables (Continued) Table Page
D.2 Viscosity results of drained CRM binder made with CRM
Source 2 at 135oC.....................................................................................142
D.3 Viscosity results of drained CRM binder made with CRM Source 3 at 135oC.....................................................................................143
D.4 Viscosity results of drained CRM binder made with CRM
Source 4 at 135oC.....................................................................................144
E.1 G*/sinδ results of drained CRM binder made with CRM Source 1 ...................................................................................................145
E.2 G*/sinδ results of drained CRM binder made with CRM
Source 2 ...................................................................................................146
E.3 G*/sinδ results of drained CRM binder made with CRM Source 3 ...................................................................................................147
E.4 G*/sinδ results of drained CRM binder made with CRM
Source 4 ...................................................................................................148
F.1 Experimental data for failure temperature for CRM Source 1 ...................................................................................................149
F.2 Experimental data for failure temperature for CRM
Source 2 ...................................................................................................150
F.3 Experimental data for failure temperature for CRM Source 3 ...................................................................................................151
F.4 Experimental data for failure temperature for CRM
Source 4 ...................................................................................................152
G.1 Viscosity results of CRM binders made with binder Source A tested at 135oC .........................................................................153
G.2 Viscosity results of CRM binders made with binder
Source B tested at 135oC..........................................................................154
xiii
List of Tables (Continued) Table Page
G.3 Viscosity results of CRM binders made with binder
Source C tested at 135oC..........................................................................155
H.1 G*/sinδ results of CRM binder made with binder Source A at 64oC ..................................................................................................156
H.2 G*/sinδ results of CRM binder made with binder Source
A at 76oC ..................................................................................................157
H.3 G*/sinδ results of CRM binder made with binder Source B at 64oC ..................................................................................................158
H.4 G*/sinδ results of CRM binder made with binder Source
B at 76oC ..................................................................................................159
H.5 G*/sinδ results of CRM binder made with binder Source C at 64oC ..................................................................................................160
H.6 G*/sinδ results of CRM binder made with binder Source
C at 76oC ..................................................................................................161
I.1 Viscosity results of CRM binder made with binder Source M ..............................................................................................................162
I.2 Viscosity results of CRM binder made with binder Source
N ...............................................................................................................163
I.3 Viscosity results of CRM binder made with binder Source O ...............................................................................................................164
I.4 Viscosity results of CRM binder made with binder Source
P ...............................................................................................................165
I.5 Viscosity results of CRM binder made with binder Source Q ...............................................................................................................166
J.1 G*/sinδ results of CRM binder made with binder Source
M at 64oC .................................................................................................167
xiv
List of Tables (Continued) Table Page
J.2 G*/sinδ results of CRM binder made with binder Source
M at 70oC .................................................................................................168
J.3 G*/sinδ results of CRM binder made with binder Source M at 76oC .................................................................................................169
J.4 G*/sinδ results of CRM binder made with binder Source
M at 82oC .................................................................................................170
J.5 G*/sinδ results of CRM binder made with binder Source M at 88oC .................................................................................................171
J.6 G*/sinδ results of CRM binder made with binder Source
N at 64oC ..................................................................................................172
J.7 G*/sinδ results of CRM binder made with binder Source N at 70oC ..................................................................................................173
J.8 G*/sinδ results of CRM binder made with binder Source
N at 76oC ..................................................................................................174
J.9 G*/sinδ results of CRM binder made with binder Source N at 82oC ..................................................................................................175
J.10 G*/sinδ results of CRM binder made with binder Source
N at 88oC ..................................................................................................176
J.11 G*/sinδ results of CRM binder made with binder Source O at 64oC ..................................................................................................177
J.12 G*/sinδ results of CRM binder made with binder Source
O at 70oC ..................................................................................................177
J.13 G*/sinδ results of CRM binder made with binder Source O at 76oC ..................................................................................................178
J.14 G*/sinδ results of CRM binder made with binder Source
O at 82oC ..................................................................................................178
xv
List of Tables (Continued) Table Page
J.15 G*/sinδ results of CRM binder made with binder Source
O at 88oC ..................................................................................................179
J.16 G*/sinδ results of CRM binder made with binder Source P at 64oC ..................................................................................................180
J.17 G*/sinδ results of CRM binder made with binder Source
P at 70oC ..................................................................................................180
J.18 G*/sinδ results of CRM binder made with binder Source P at 76oC ..................................................................................................181
J.19 G*/sinδ results of CRM binder made with binder Source
P at 82oC ..................................................................................................181
J.20 G*/sinδ results of CRM binder made with binder Source P at 88oC ..................................................................................................182
J.21 G*/sinδ results of CRM binder made with binder Source
Q at 64oC ..................................................................................................183
J.22 G*/sinδ results of CRM binder made with binder Source Q at 70oC ..................................................................................................184
J.23 G*/sinδ results of CRM binder made with binder Source
Q at 76oC ..................................................................................................185
J.24 G*/sinδ results of CRM binder made with binder Source Q at 82oC ..................................................................................................186
J.25 G*/sinδ results of CRM binder made with binder Source
Q at 88oC ..................................................................................................187
K.1 Failure temperature results of CRM binder made with binder Source M .......................................................................................188
K.2 Failure temperature results of CRM binder made with
binder Source N .......................................................................................189
xvi
List of Tables (Continued) Table Page
K.3 Failure temperature results of CRM binder made with
binder Source O .......................................................................................190
K.4 Failure temperature results of CRM binder made with binder Source P ........................................................................................190
K.5 Failure temperature results of CRM binder made with
binder Source Q .......................................................................................191
xvii
LIST OF FIGURES
Figure .............................................................................................................................. Page 2.1 Number of Landfills in the United States, 1988-2006 .......................................11 3.1 Step by step task list ...........................................................................................28 3.2 Task 1 - Characterization of crumb rubber particles .........................................29 3.3 Task 2 - Effect of crumb rubber on CRM binder
viscosity and G*/sinδ values ......................................................................31 3.4 Task 3&4 - Various crumb rubber variables considered
for model input ...........................................................................................32 3.5 Task 3&4 - Various binder variables considered for
model input ................................................................................................33 3.6 Task 6 - Verification study ................................................................................35 4.1 Observation space picture of nonlinear least squares
fitting ..........................................................................................................46 4.2 Variable space picture of the nonlinear least squares
fitting problem ...........................................................................................47 4.3 LCL and UCL for 95% Confidence Interval .....................................................49 5.1 Method of Rcv determination ..............................................................................54 5.2 Method of Rcg determination ..............................................................................58 6.1 SEM micrographs of (a) cryogenically and (b) ambient
Ground crumb rubber at 30x magnification ...............................................65 6.2 Elemental composition by weight ......................................................................66 6.3 DSC Profiles of a) Source 4 crumb rubber and b) Source
1 crumb rubber ...........................................................................................67 6.4 Viscosity data for (a) Binder A and (b) Binder B with
crumb rubber sources 1-4 ...........................................................................69
xviii
List of Figures (Continued)
Figure .............................................................................................................................. Page 6.5 Viscosity (a) Interaction Effect and (b) Particle Effect .....................................74 6.6 Failure temperature of (a) Binder A and (b) Binder B .......................................76 6.7 G*/sinδ of (a) Binder A and (b) Binder B .........................................................77 6.8 Failure temperature (a) Interaction Effect and (b) Particle
Effect ..........................................................................................................79 6.9 G*/sinδ (a) Interaction Effect and (b) Particle Effect ........................................80 6.10 Average Experimental and Predicted Values of Binder
Viscosity for (a) 135oC,(b) 140oC, (c) 160oC, (d)170oC, (e) 180oC, and (f) 190oC ............................................................86
6.11 Average experimental and predicted G*/sinδ values
with 95% confidence intervals for (a) 64oC, (b) 70oC, (c) 76oC, (d) 82oC, and (e) 88oC ......................................................89
6.12 Failure temperature fit for crumb rubber Sources (a) 1,
(b) 2, (c) 3, and (d) 4 ..................................................................................91 6.13 Average experimental values with average predicted
values for: (a) 64oC, (b)70oC, (c)76oC, (d)82oC, and (e) 88oC. .....................................................................................................96
6.14 Experimental and predicted G*/sinδ values .....................................................97 6.15 Comparison between observed and predicted average
values of failure temperature with 95% confidence interval. ......................................................................................................99
6.16 Experimental and predicted failure temperatures for the
universal model ........................................................................................100 6.17 Comparison between observed and predicted average
values of crumb rubber content with 95% confidence interval ...................................................................................102
xix
List of Figures (Continued)
Figure .............................................................................................................................. Page 6.18 Experimental and predicted crumb rubber percentages
(by weight of binder) ...............................................................................103 6.19 Verification of average viscosities vs. temperature for
viscosity equation.....................................................................................105 6.20 Verification of experimental vs. predicted viscosity ......................................105 6.21 Average Experimental and Predicted Values of G*/sinδ
using G* equation for (a) 5%, (b) 10%, (c) 15%, and (d) 20% crumb rubber ......................................................................107
6.22 Verification of Experimental vs. predicted failure
temperature for G* equation ....................................................................108 6.23 Verification of Experimental vs. predicted G*/sinδ for
G* equation ..............................................................................................108 6.24 Average Experimental and Predicted Values of G*/sinδ
using G* equation for (a) 5%, (b) 10%, (c) 15%, and (d) 20% crumb rubber (by weight of binder) ...................................109
6.25 Verification of experimental vs. predicted failure
temperature for universal equation .........................................................110 6.26 Verification of experimental vs. predicted G*/sinδ for
universal model ........................................................................................110 6.27 Verification of experimental vs. predicted crumb rubber for universal model ..................................................................................111
1
CHAPTER ONE
INTRODUCTION 1. one
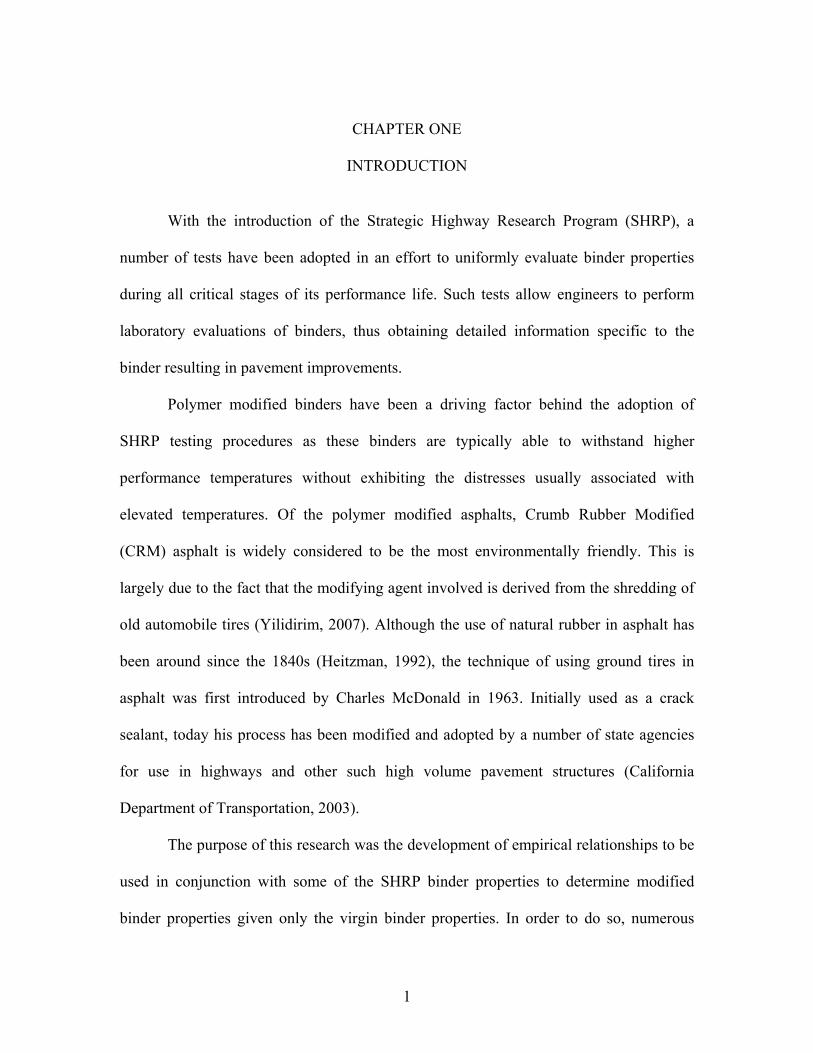
With the introduction of the Strategic Highway Research Program (SHRP), a
number of tests have been adopted in an effort to uniformly evaluate binder properties
during all critical stages of its performance life. Such tests allow engineers to perform
laboratory evaluations of binders, thus obtaining detailed information specific to the
binder resulting in pavement improvements.
Polymer modified binders have been a driving factor behind the adoption of
SHRP testing procedures as these binders are typically able to withstand higher
performance temperatures without exhibiting the distresses usually associated with
elevated temperatures. Of the polymer modified asphalts, Crumb Rubber Modified
(CRM) asphalt is widely considered to be the most environmentally friendly. This is
largely due to the fact that the modifying agent involved is derived from the shredding of
old automobile tires (Yilidirim, 2007). Although the use of natural rubber in asphalt has
been around since the 1840s (Heitzman, 1992), the technique of using ground tires in
asphalt was first introduced by Charles McDonald in 1963. Initially used as a crack
sealant, today his process has been modified and adopted by a number of state agencies
for use in highways and other such high volume pavement structures (California
Department of Transportation, 2003).
The purpose of this research was the development of empirical relationships to be
used in conjunction with some of the SHRP binder properties to determine modified
binder properties given only the virgin binder properties. In order to do so, numerous
2
binder sources need to be studied to provide a statistical platform upon which the
empirical relationship could be built. The establishment of such a model would prove
beneficial to the industry as well as to the scientific community as it would provide an
immediate reference from which binder properties may be estimated given only basic
starting parameters, such as base binder viscosity, base binder G*/sinδ, and crumb rubber
grinding procedure.
Similarly to other polymer modified asphalts, CRM asphalts tend to cost more
than their non modified counterparts. This cost increase is attributed to the addition of the
crumb rubber particles; therefore, there is a need to optimize the cost as much as possible.
The developed predictive model could be a useful tool to accomplish this. Asphalt
behavior is temperature dependent; as such, any subsequent relationship would be
required to consider the binder temperature as well as crumb rubber properties.
Preliminary studies indicated that such a relationship is present; findings suggest
that a clear relationship between various binder properties and crumb rubber
concentration exists. However, the difficulty lies in presenting a universal model that may
be used for all binders and crumb rubber types. In particular, this research focused on the
prediction of three binder properties: viscosity as determined by rotational viscometer,
high failure temperature as determined by dynamic shear rheometer (DSR), and the
rutting parameter G*/sinδ as determined by DSR.
Statistical analysis software, SAS, was used to develop the nonlinear relationship
present between crumb rubber concentration, temperature, and binder properties. Non
linear regressions were utilized in an effort to uniformly describe the behavior of rubber
3
modified binders at high temperatures. There are currently no predictive models for the
determination of properties of binders containing crumb rubber. Past studies have
attempted to correlate the viscosity of an asphalt binder with temperature; however,
SHRP procedures were not being used at that time (Puzinauskas, 1967).
Significance of Work
It is desirable in the construction business to have well-established relationships
for predicting the performance of various materials. Such relationships permit cost
estimates to be made well in advance allowing contractors to prepare the most
competitive bid while also giving some indication of the engineering properties of the
materials.
These relationships can be found in virtually every sub-sector of civil engineering
for which empirical equations are available. Such as calculating the compressive and
tensile strength of reinforced concrete, estimating the amount of friction head loss in a
pipe, predicting hydration products of concrete, and correlating wood grain orientation to
compressive and tensile strength of the wood, etc.
Such relationships provide a measure of security to the designer as they indicate
that the material is tried and tested, and as such can be, to some extent, trusted. To date,
no relationships exist for predicting the high temperature properties of asphalt binders
containing crumb rubber. Such relationships would not only provide an invaluable design
resource when estimating the amount of crumb required for a certain performance grade,
4
but they would also indicate that CRM binders are a consistent construction material for
which properties can be reliably predicted using well-established testing procedures.
Furthermore, given the temperature dependent viscoelastic nature of asphalt
binder, being able to predict the viscosity of an asphalt binder at certain temperatures
would also permit more accurate cost estimates of the required fuel costs for reaching the
desired pumping temperatures within the asphalt plant.
From an environmental standpoint, it is vital that CRM binders be recognized as a
reliable construction material. The EPA reports, “As the environmental impact of
buildings becomes more apparent, a new field called green building is gaining
momentum. Green or sustainable building is the practice of creating healthier and more
resource-efficient models of construction, renovation, operation, maintenance, and
demolition” (Environmental Protection Agency, 2007). Specifically the EPA targets six
main elements of green building, these include:
• Energy Efficiency and Renewable Energy,
• Water Stewardship,
• Environmentally Preferable Building Materials and Specifications,
• Waste Reduction,
• Toxics,
• Indoor Environment, and
• Smart Growth and Sustainable Development.
The addition of crumb rubber to asphalt binders results in an established
environmental building material which promotes sustainable development; additionally,
5
CRM binder reduces the amount of waste disposed in limited landfill space, as well as
eliminating potentially hazardous storage conditions (fire hazards and mosquito
breeding). It would appear that CRM binder is the ideal paving material given the
aforementioned issues, but to date, pavements incorporating CRM binder are still not the
norm in the US or around the world.
The improvements in engineering properties typical of rubberized asphalt
pavements are well-documented, however, many of these studies also discuss the
inconsistent effects of different crumb rubber types on different binder sources. It is
therefore vital that efforts be made to establish the consistency of CRM binder as a
construction material.
Objectives
The main objective of this study was the identification, quantification, and
subsequent estimation of the effects of crumb rubber in various CRM binders.
Specifically, the objectives may be summarized as follows:
1. Conducting an extensive literature review regarding the use, performance, and
estimation of SHRP properties of various CRM binders,
2. Evaluating the high temperature binder properties as per SHRP testing procedures
(RV and DSR),
3. Conducting statistical analysis of laboratory tested and published data, followed
by establishment of nonlinear empirical models for estimation of CRM binder
properties,
6
4. Conducting an error analysis of empirical models, performed by identifying 95%
confidence intervals for binder property estimation, and
5. Validating the models by follow up spot checks of binder properties on previously
untested binders.
Scope
This study will be concluded following the completion of the steps outlined
below:
1. Identification and analysis of previous studies used to evaluate SHRP binder
properties. A minimum of 25 unique CRM binders (combinations of at least: five
unique virgin binders and five unique crumb rubbers) was deemed the minimum
requirement for initial model development.
2. A total of 32 laboratory mixtures were prepared to supplement the literature data
for initial model development, specifically CRM binders in the laboratory
containing the following materials were prepared:
a. 5%, 10%, 15%, and 20% crumb rubber content by weight of virgin asphalt
binder,
b. Crumb rubber produced by cryogenic and ambient grinding processing
methods,
c. Crumb rubber derived from various tire sources (e.g., truck tire and
passenger car tire), and
7
d. Asphalt binders from two different sources (Venezuelan and an
unidentified blend) meeting PG 64-22 requirement. These binder sources
were selected as the Venezuelan source is a commonly used binder
throughout the US, while the blended source was used to provide data
about the effects of crumb rubber properties on blended virgin binders.
3. Laboratory evaluation of high temperature CRM binder properties as per SHRP
testing procedures:
a. Rotational viscometer (RV) (minimum of three repetitions per sample)
and
b. Dynamic shear rheometer (DSR) (minimum of two repetitions per
sample).
4. The SAS program was used to perform statistical analysis of literature and
research data:
a. Identification of appropriate model form,
b. Perform regression fit of collected data to model, and
c. Identification of 95 % confidence interval encapsulating predicted values.
Validation testing of model accuracy was accomplished by randomized testing of
SHRP binder properties using randomly selected CRM binder compositions of previously
untested binder source.
8
Organization of Dissertation
A literature review of related research is presented in Chapter 2. This review
discusses the use of scrap tires in asphalt as wet process CRM binder. SHRP testing
procedures are also discussed in detail, specifically the asphalt viscosity and high
temperature properties are explained. The literature review also reviews the earlier
predictive models used for the determination of binder properties. Chapter 3 includes
information regarding the materials and methods used to complete this study. The
statistical procedures used for this study are explained in detail in Chapter 4. Model
development for the various models is presented in Chapter 5. Experimental results and
discussion of the applied models are presented in Chapter 6. This study concludes with
Chapter 7, where a summary of the findings is presented along with conclusions and
recommendations for future related research.
9
CHAPTER TWO
LITERATURE REVIEW 2. two
To gain an understanding of testing procedures established by SHRP and how
they apply to rubberized asphalt, it is first necessary to properly introduce rubberized
asphalt and the specific tests developed by SHRP. Therefore, first CRM binder and its
components are introduced below, after which the SHRP tests are also presented along
with documented cases of such tests being performed in conjunction with CRM binder.
Background
The introduction of CRM binder as an engineering material has occurred due to
the occurrence of a number of events. The work done by Charles McDonald on asphalt
rubber as a crack sealant in Arizona has proved to be a precursor for the growing
environmental sustainability movement. Coupled with dwindling resources, increased
environmental problems, and the quest for improved paving materials, CRM binder has
emerged as an efficient and “green” alternative to conventional polymer modified
binders.
Waste Tire Problem
In 1999, lightning struck a tire dump in Westley, California; the resulting smoke
plume impacted nearby farming communities and caused widespread concern of potential
health effects from exposure to the smoke emissions (Environmental Protection Agency,
2007). The tire fire produced large quantities of pyrolitic oil which flowed off the slope
10
and into the drainage of a nearby stream. The pyrolitic oil was also ignited and caused
significant smoke emissions on the ground due to the raging oil fire. Local and state
agencies were unable to respond to the oil and tire fires, thus requiring the EPA regional
coordinator to intervene using the Oil Pollution Act of 1990. In the end, the tire fire lasted
for 30 days and the EPA response costs were estimated to be $3.5 million (Environmental
Protection Agency, 2007).
While tire fires are infrequent, they cause a serious concern to public safety as
well as being expensive to remedy. This danger becomes more apparent as it is estimated
that approximately 300 million scrap tires are generated annually (Rubber Manufacturers
Association, 2006). This places the generation of scrap tires at approximately one tire per
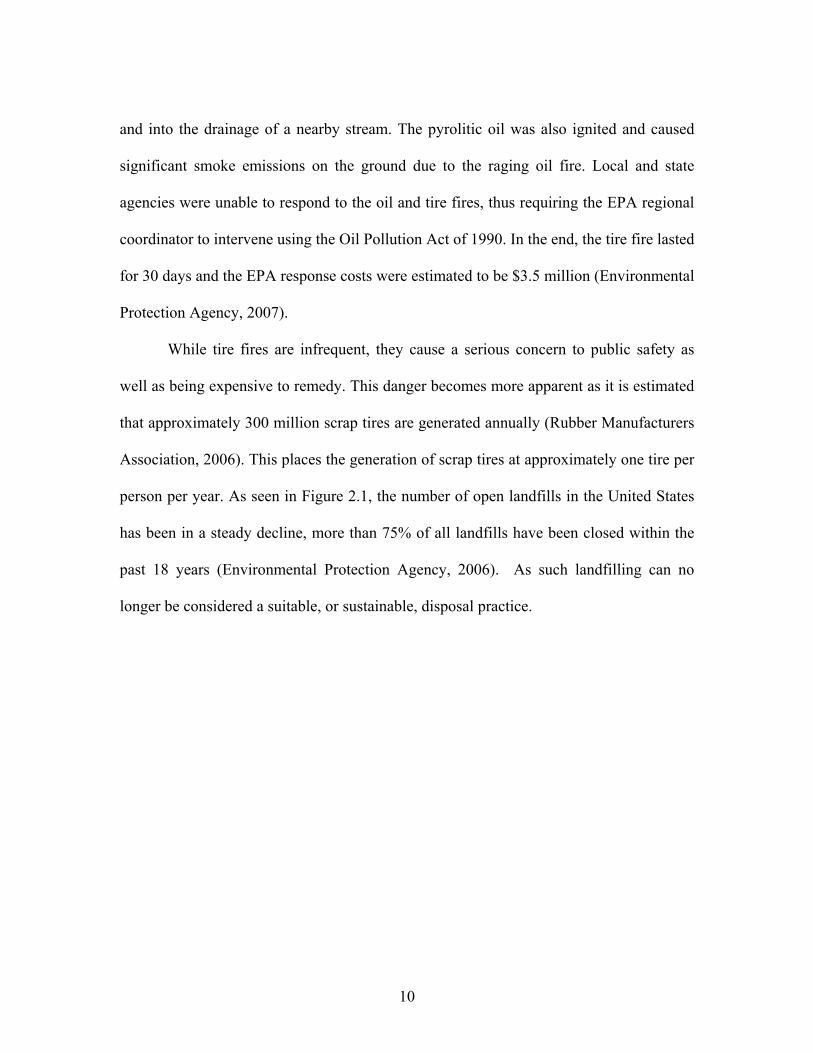
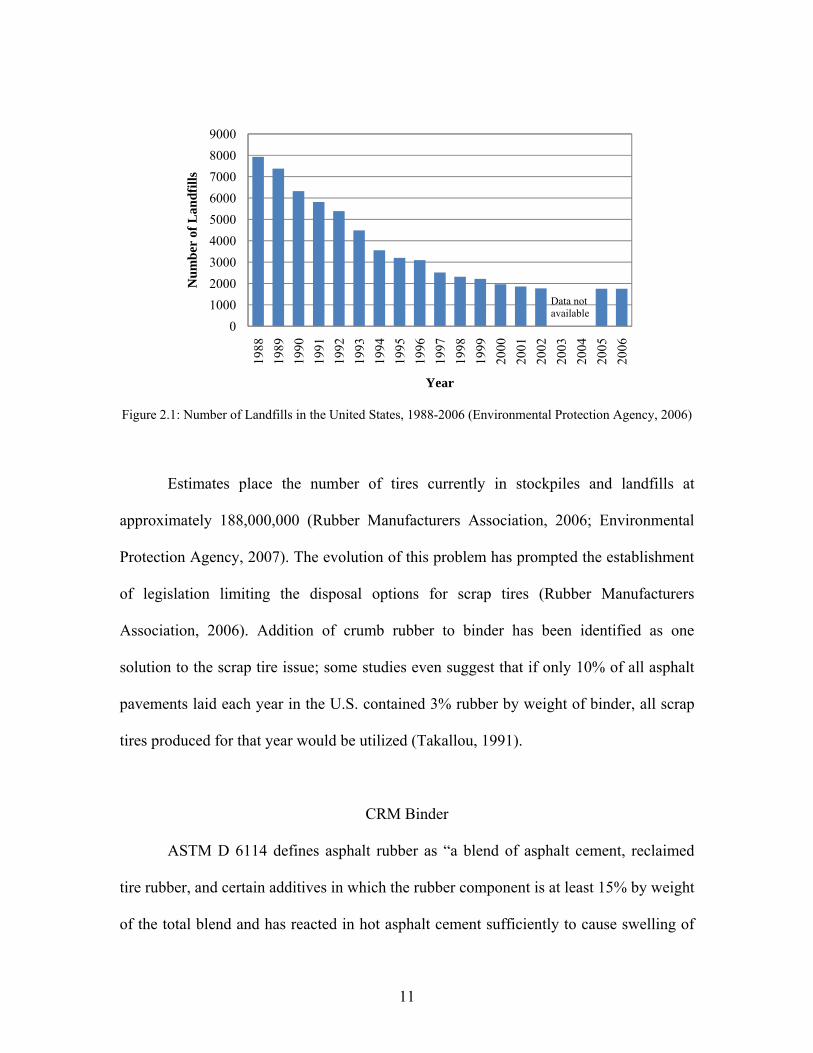
person per year. As seen in Figure 2.1, the number of open landfills in the United States
has been in a steady decline, more than 75% of all landfills have been closed within the
past 18 years (Environmental Protection Agency, 2006). As such landfilling can no
longer be considered a suitable, or sustainable, disposal practice.
11
Figure 2.1: Number of Landfills in the United States, 1988-2006 (Environmental Protection Agency, 2006)
Estimates place the number of tires currently in stockpiles and landfills at
approximately 188,000,000 (Rubber Manufacturers Association, 2006; Environmental
Protection Agency, 2007). The evolution of this problem has prompted the establishment
of legislation limiting the disposal options for scrap tires (Rubber Manufacturers
Association, 2006). Addition of crumb rubber to binder has been identified as one
solution to the scrap tire issue; some studies even suggest that if only 10% of all asphalt
pavements laid each year in the U.S. contained 3% rubber by weight of binder, all scrap
tires produced for that year would be utilized (Takallou, 1991).
CRM Binder
ASTM D 6114 defines asphalt rubber as “a blend of asphalt cement, reclaimed
tire rubber, and certain additives in which the rubber component is at least 15% by weight
of the total blend and has reacted in hot asphalt cement sufficiently to cause swelling of
0100020003000400050006000700080009000
1988
1989
1990
1991
1992
1993
1994
1995
1996
1997
1998
1999
2000
2001
2002
2003
2004
2005
2006
Num
ber
of L
andf
ills
Year
Data not available
12
the rubber particles” (American Society of Testing and Materials, 2001). Research has
shown that the addition of crumb rubber to virgin asphalt produces binders with
improved resistance to rutting , fatigue cracking, and thermal cracking (Dantas Neto et
al., 2003; Xiao et al., 2007) as well as reduces the thickness of asphalt overlays and
reflective cracking potential (Amirkhanian, 2003).
Research has shown that crumb rubber modification of asphalt binder has many
similar effects to polymer modification. The major changes noted by these researchers
are seen with the increase in the high temperature stiffness, these are often seen to exceed
levels normally achieved by polymer modification. Similarly it has been shown that
crumb rubber modifier also results in a reduction of dependency on temperature and
loading frequency. However, it has also been suggested that the main function of crumb
rubber is that of interactive filler as crumb rubber remains as a particulates even after
mixing (Lee & Mahboub, 2006). As the crumb rubber particles do not dissolve in the
asphalt, they have been shown to swell in the asphalt resulting in effective volumes that
are larger than their initial volume (Bahia & Davis, 1994; Oliver, 1982; Chehoveits et al.,
1982).
Tire Composition
Tires are composed of three main components: rubber, steel, and fiber. Rubber
contributes the greatest amount of material to the tire, contributing approximately 60% by
weight of the tire mass. Typically natural/isoprene rubber is used for both truck and
passenger car tires in the tread, sidewall, belt, carcass ply, and inner liner. Differences
arise in the amount of styrene butadiene rubber used; truck tires tend to contain higher
13
amounts of styrene butadiene rubber in the carcass ply and base tread. Higher amounts of
butadiene rubber may be found in the base tread of truck tires as well (Toyo Tires, 2001;
Ucar et al., 2005).
Crumb Rubber Grinding Procedures
In order for crumb rubber to be added to asphalt it must first be reduced in size;
this is generally undertaken by ambient or cryogenic grinding of the scrap tires. The
ambient method involves the use of medium to high speed granulators (100-1200 rpm)
which utilize a rotor in which fly knives are attached. Prior to being introduced to the fly
knives the tires are already ground to approximately 2.5-7.6 cm size. The fly knives move
within a close distance of stationary knives which cause a cutting and shearing motion.
The size of the ambient ground crumb rubber is controlled by a screen within the
machine. Once the material has been processed through primary granulator, it is then
passed through a magnetic separation system where a majority of the belt wire steel is
removed. The majority of the fiber is removed using an air gravity separation table
(Blumenthal, 1994).
The cryogenic process also starts with chunks of tire approximately 2.5-7.6 cm
size in size. These chunks are then chilled with liquid nitrogen and ground in a mill, this
is followed by the separation of the fiber, metal, and rubber. The ground crumb rubber is
then finally sorted according to size; typically 70 to 80% of the crumb rubber is finer than
10 mesh (2 mm) (Blumenthal, 1994).
14
The principal difference between rubber particles produced using the cryogenic
and ambient procedures lies in the shape of the resulting particle. Crumb rubber produced
using cryogenic means tends to exhibit a smooth surface, comparable to shattered glass.
Ambient grinding tends to yield particles with a rougher surface, thus producing greater
surface area than cryogenic particles (Blumenthal, 1994; Putman, 2005).
Mixing Procedure
The incorporation of crumb rubber into the asphalt mixtures is generally
performed using the dry process or the wet process. The dry process is characterized by
the use of coarse graded rubber as an aggregate with no opportunity for the asphalt and
rubber to react before mixing with aggregate. The wet process involves blending the
asphalt cement with the crumb rubber prior to the mixing operation. During this process,
the rubber reacts with the asphalt binder and changes the binder properties (California
Department of Transportation, 2003).
Today, the wet process is the most widely used method of crumb rubber
modification, reported advantages of using this procedure include (Amirkhanian, 2003):
• Increased pavement life
• Reduced reflective cracking
• Reduced permanent deformation (rutting)
• Reduced maintenance costs
• Reduced pavement noise generation
• Recycling of waste tires
15
However, a number of state highway agencies and studies have also suggested
that common problems associated with the use of the “wet” process include
(Amirkhanian, 2003):
• Higher initial cost: Some highway agencies claim an increase of approximately
25% to over 200% in the cost of the pavement;
• Higher viscosity than conventional asphalt;
• Increased mixing temperature: Asphalt cement and ground tire rubber should be
mixed at approximately 204oC to obtain uniform mixture and standard viscosity;
and
• There are modifications, in some cases, that may be incurred to the asphalt plant,
paving, and compacting equipment.
SHRP Testing
TRB special report 202: America’s Highways: Accelerating the Search for
Innovation first detailed the objectives of the Strategic Highway Research Program. They
were identified as follows: “To improve pavement performance through a research
program that will provide increased understanding of the chemical and physical
properties of asphalt cements and asphalt concretes. The research results would be used
to develop specifications and tests needed to achieve and control the pavement
performance desired” (Transportation Research Board, 1984).
Emphasis was placed on developing a specification that would be valid for both
modified and unmodified asphalt binders. The end product of the binder research
16
program was called Superpave. The binder specifications were outlined in order to
classify binders by performance criteria. Doing so allowed the binder to be evaluated
based on performance criteria specific to the application, thus permitting the designer to
anticipate the field conditions and ultimately design the pavement accordingly.
Binder Viscosity
AASHTO T 316 is the commonly used SHRP procedure for evaluating asphalt
binder viscosity. Achieving asphalt viscosity requirements is of utmost importance for
ease of pumping as asphalt is generally stored in asphalt plants at temperatures between
149oC and 177oC depending on the grade or viscosity (US Army Corps of Engineers,
2000). However, fulfilling these requirements becomes more difficult with the increasing
viscosity due to modification of the binder by crumb rubber (Stroup-Gardiner et al.,
1993) as well as the specifications established by SHRP indicating that asphalt viscosity
should not exceed 3.0 Pa-s at 135oC (Asphalt Institute, 2003).
Viscosity at any given temperature and shear rate is essentially the ratio of shear
stress to shear strain. At high temperatures such as 135oC, asphalt binders behave as
simple Newtonian fluids; that is, the ratio of shear stress to strain is constant. At low
temperatures, the ratio of shear stress to shear strain is not a constant, and the asphalt
binders behave like non-Newtonian liquids (Roberts et al., 1996).
Research has shown that rubberized asphalt viscosity increases as rubber
concentration is increased, regardless of rubber type. Non-Newtonian behavior of the
rubber modified binders was also shown to be more pronounced with increasing amounts
17
of rubber. The same study also concluded that lower viscosity asphalt increases the rate
of the modified binder reaction when compared to higher viscosity binders from the same
source (Lougheed & Pappagiannakis, 1996).
All combinations of rubber and binder produce a uniquely modified binder, and
the resulting viscosity increases occurring with the addition of crumb rubber are due to
the amount of aromatic oil absorption and rubber particle swelling. It has been shown that
the increase in rubber concentration yielded significant increase in viscosity (Lougheed &
Pappagiannakis, 1996). Viscosity of CRM binder is known to be dependent on crumb
rubber content (Stroup-Gardiner et al., 1993), particle size and processing method
(Putman, 2005), mixing temperature and duration (Abdelrahman M. , 2006), and rubber
type (passenger tire or truck tire) (Khalid & Artamendi, 2004).
G*/sinδ and Failure Temperature
Since the implementation of SHRP, the Dynamic Shear Rheometer has been used
for the determination of G*/sinδ values as well as the high failure temperature of the
binder. Results obtained from the DSR are vital to pavement performance when
determining its resistance to rutting (Asphalt Institute, 2003).
The complex shear modulus (G*) and phase angle (δ) are indicators of rutting
tendency in the pavement (G*/sinδ) at high temperatures and of fatigue cracking
(G*sinδ) at medium range temperatures. AASHTO TP 315 provides specifications and
procedures for obtaining experimental values of the complex shear modulus and phase
18
angle using the DSR (American Association of State Highway and Transportation
Officials, 2006).
Loading time and temperature applied on the asphalt binder are the key factors in
predicting binder behavior. Information retrieved from the DSR is based on these factors.
During the duration of the test, the asphalt binder is sandwiched between two plates,
whereby the lower plate is fixed, and the top plate oscillates at a frequency of 10 radians
per second.
As specified by previous studies, a gap height of 2 mm was used for testing CRM
binder samples, while virgin binders were tested using a 1 mm gap. The differences in
gap height were applied to account for the effect of the differing rubber particle sizes
present in the CRM binder. Previous studies have shown that if the binders are tested in
the linear viscoelastic region, the variation in the gap size will not have a significant
impact on the results. Another advantage to using this procedure was the decreased
variability noticed when the 2 mm gap data was compared to the 1 mm gap. It has been
suggested that the decreased variability of the 2 mm gap data was due to the fact that
there was a lower possibility of rubber particles coming in contact with the plates, thus
adversely affecting the rheological measurements of the sample (Putman, 2005; Bahia &
Davis, 1994; Bahia & Davies, 1996; Tayebali et al., 1990).
The high-temperature portion of the PG grade is determined by measuring the
temperature at which the unaged asphalt binder’s complex shear modulus divided by the
sine of the phase angle (G*/sinδ) is at least 1.0 kPa when measured at a frequency of 10
19
radian per second in accordance with AASHTO M 320 (Asphalt Institute, 2003; Roberts
et al., 1996; American Association of State Highway and Transportation Officials, 2005).
Studies have shown that the addition of crumb rubber to asphalt binder tends to
increase the G*/sinδ values of the CRM binder. Typically, the addition of crumb rubber
to binder is characterized by an increase in G* values and a decrease in phase angle, thus
resulting in an overall increased rutting parameter of G*/sinδ (Putman, 2005).
Binder Property Models
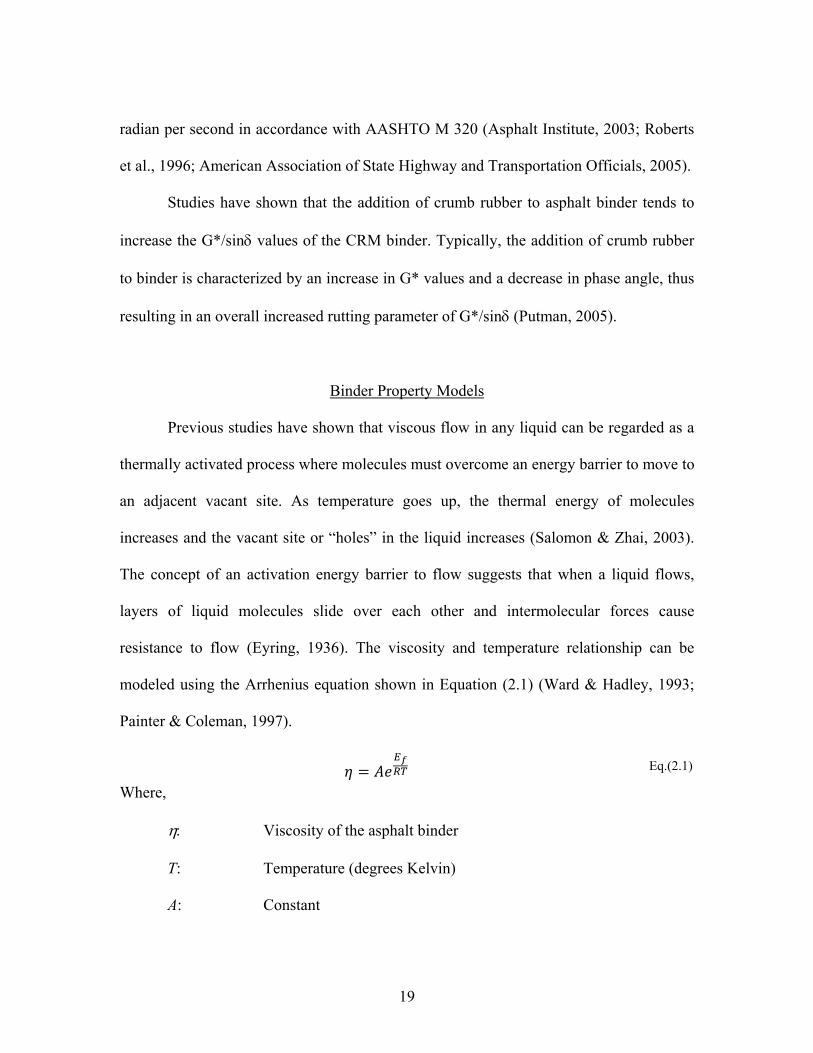
Previous studies have shown that viscous flow in any liquid can be regarded as a
thermally activated process where molecules must overcome an energy barrier to move to
an adjacent vacant site. As temperature goes up, the thermal energy of molecules
increases and the vacant site or “holes” in the liquid increases (Salomon & Zhai, 2003).
The concept of an activation energy barrier to flow suggests that when a liquid flows,
layers of liquid molecules slide over each other and intermolecular forces cause
resistance to flow (Eyring, 1936). The viscosity and temperature relationship can be
modeled using the Arrhenius equation shown in Equation (2.1) (Ward & Hadley, 1993;
Painter & Coleman, 1997).
Eq.(2.1)
Where,
η: Viscosity of the asphalt binder
T: Temperature (degrees Kelvin)
A: Constant
20
Ef: Activation energy for flow
R: Universal gas constant (8.314 J.mol-1.K-1)
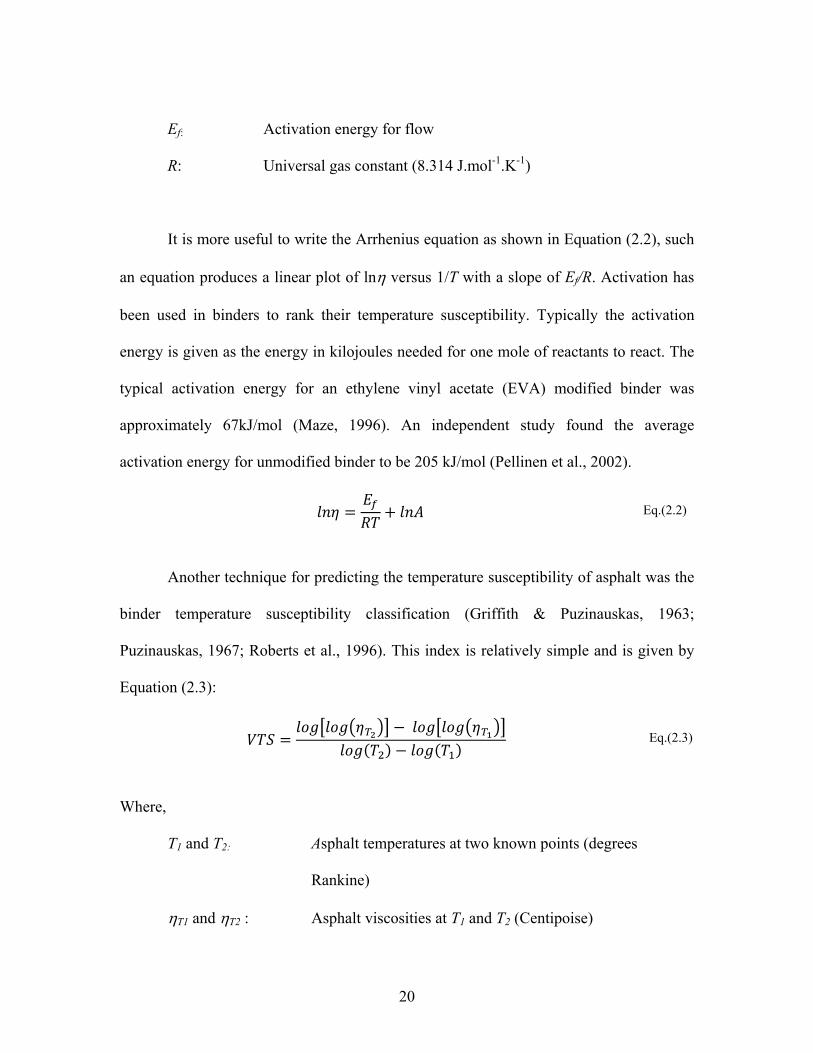
It is more useful to write the Arrhenius equation as shown in Equation (2.2), such
an equation produces a linear plot of lnη versus 1/T with a slope of Ef/R. Activation has
been used in binders to rank their temperature susceptibility. Typically the activation
energy is given as the energy in kilojoules needed for one mole of reactants to react. The
typical activation energy for an ethylene vinyl acetate (EVA) modified binder was
approximately 67kJ/mol (Maze, 1996). An independent study found the average
activation energy for unmodified binder to be 205 kJ/mol (Pellinen et al., 2002).
Eq.(2.2)
Another technique for predicting the temperature susceptibility of asphalt was the
binder temperature susceptibility classification (Griffith & Puzinauskas, 1963;
Puzinauskas, 1967; Roberts et al., 1996). This index is relatively simple and is given by
Equation (2.3):
Eq.(2.3)
Where,
T1 and T2: Asphalt temperatures at two known points (degrees
Rankine)
ηT1 and ηT2 : Asphalt viscosities at T1 and T2 (Centipoise)
21
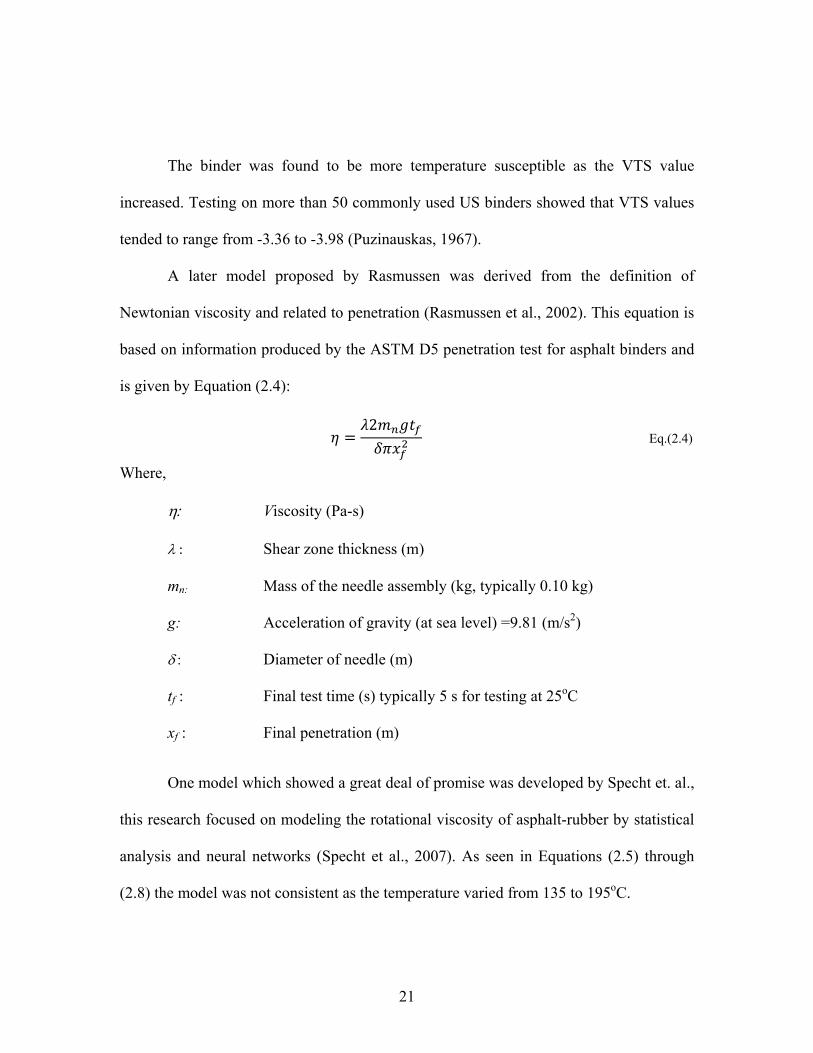
The binder was found to be more temperature susceptible as the VTS value
increased. Testing on more than 50 commonly used US binders showed that VTS values
tended to range from -3.36 to -3.98 (Puzinauskas, 1967).
A later model proposed by Rasmussen was derived from the definition of
Newtonian viscosity and related to penetration (Rasmussen et al., 2002). This equation is
based on information produced by the ASTM D5 penetration test for asphalt binders and
is given by Equation (2.4):
2 Eq.(2.4)
Where,
η: Viscosity (Pa-s)
λ : Shear zone thickness (m)
mn: Mass of the needle assembly (kg, typically 0.10 kg)
g: Acceleration of gravity (at sea level) =9.81 (m/s2)
δ : Diameter of needle (m)
tf : Final test time (s) typically 5 s for testing at 25oC
xf : Final penetration (m)
One model which showed a great deal of promise was developed by Specht et. al.,
this research focused on modeling the rotational viscosity of asphalt-rubber by statistical
analysis and neural networks (Specht et al., 2007). As seen in Equations (2.5) through
(2.8) the model was not consistent as the temperature varied from 135 to 195oC.
22
@135 0.72 1.80 1.07 0.830.72 0.58 0.57
Eq.(2.5)
@155 0.15 0.96 0.57 0.420.36 0.28 0.38
Eq.(2.6)
@175 0.0014 0.74 0.42 0.27 Eq.(2.7)
@195 0.40 0.80 0.40 0.30 Eq.(2.8)
Where,
η: Rotational Viscosity (Pa-s)
RT: Read Temperature (oC)
RC: Rubber Content (% rubber in relation to total mass)
MD: Mixing Duration (minutes)
MP: Mixing Temperature (oC)
SS: Rubber Specific Surface (m2/kN)
Another issue with this relationship is that it is not applicable for a number of
scenarios; this is because at these specified values the model produces negative values. It
is not physically possible to exhibit a negative viscosity, therefore additional research is
required to be undertaken in order to produce more realistic models.

23
While some merit has been found in a number of these relationships; they are not
representative of the current testing procedures outlined by SHRP, or only functional to a
certain degree. Furthermore, none of these methods takes into consideration the addition
of crumb rubber to the binder for predicting the G*/sinδ values of the CRM binder.
24
CHAPTER THREE
MATERIALS AND EXPERIMENTAL PROCEDURES 3. threeS
In this chapter the materials, experimental plan, and experimental methods used to
accomplish the research goals are discussed. The materials used in this study are listed as
well as any data relevant to the origin of the materials and their engineering properties.
The experimental plan is explained in detail, specifically, the goal of each section is
discussed as well as its relevance to the overall objectives of the study. Experimental
methods are provided and, when relevant, the standard procedure is identified.
Materials
Asphalt Binders
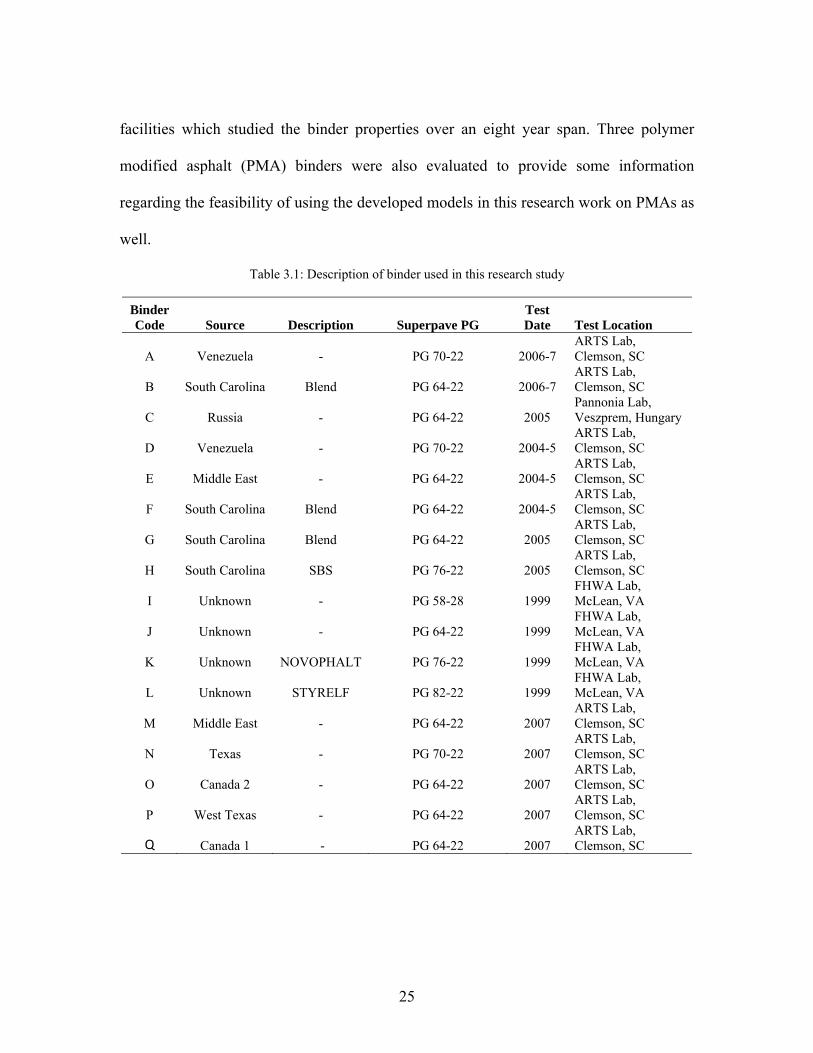
During the model development stage a total of twelve base asphalt binders were
evaluated. In addition, during verification five other asphalt binders were evaluated. The
binders were selected from many sources to determine the effects of geographic locations
of the binders. On some occasions, the same binder source was evaluated over several
months to determine if the binder properties were maintained over time. Table 3.1
provides a description of the binders used in this study. The test dates and test locations
are also given in order to provide a description of the various dates and locations the
binders were evaluated.
As shown in Table 3.1, binders from four different continents were tested;
furthermore, the information is a compilation of studies from three independent lab
25
facilities which studied the binder properties over an eight year span. Three polymer
modified asphalt (PMA) binders were also evaluated to provide some information
regarding the feasibility of using the developed models in this research work on PMAs as
well.
Table 3.1: Description of binder used in this research study
Binder Code Source Description Superpave PG
Test Date Test Location
A Venezuela - PG 70-22 2006-7 ARTS Lab, Clemson, SC
B South Carolina Blend PG 64-22 2006-7 ARTS Lab, Clemson, SC
C Russia - PG 64-22 2005 Pannonia Lab, Veszprem, Hungary
D Venezuela - PG 70-22 2004-5 ARTS Lab, Clemson, SC
E Middle East - PG 64-22 2004-5 ARTS Lab, Clemson, SC
F South Carolina Blend PG 64-22 2004-5 ARTS Lab, Clemson, SC
G South Carolina Blend PG 64-22 2005 ARTS Lab, Clemson, SC
H South Carolina SBS PG 76-22 2005 ARTS Lab, Clemson, SC
I Unknown - PG 58-28 1999 FHWA Lab, McLean, VA
J Unknown - PG 64-22 1999 FHWA Lab, McLean, VA
K Unknown NOVOPHALT PG 76-22 1999 FHWA Lab, McLean, VA
L Unknown STYRELF PG 82-22 1999 FHWA Lab, McLean, VA
M Middle East - PG 64-22 2007 ARTS Lab, Clemson, SC
N Texas - PG 70-22 2007 ARTS Lab, Clemson, SC
O Canada 2 - PG 64-22 2007 ARTS Lab, Clemson, SC
P West Texas - PG 64-22 2007 ARTS Lab, Clemson, SC
Q Canada 1 - PG 64-22 2007 ARTS Lab, Clemson, SC
26
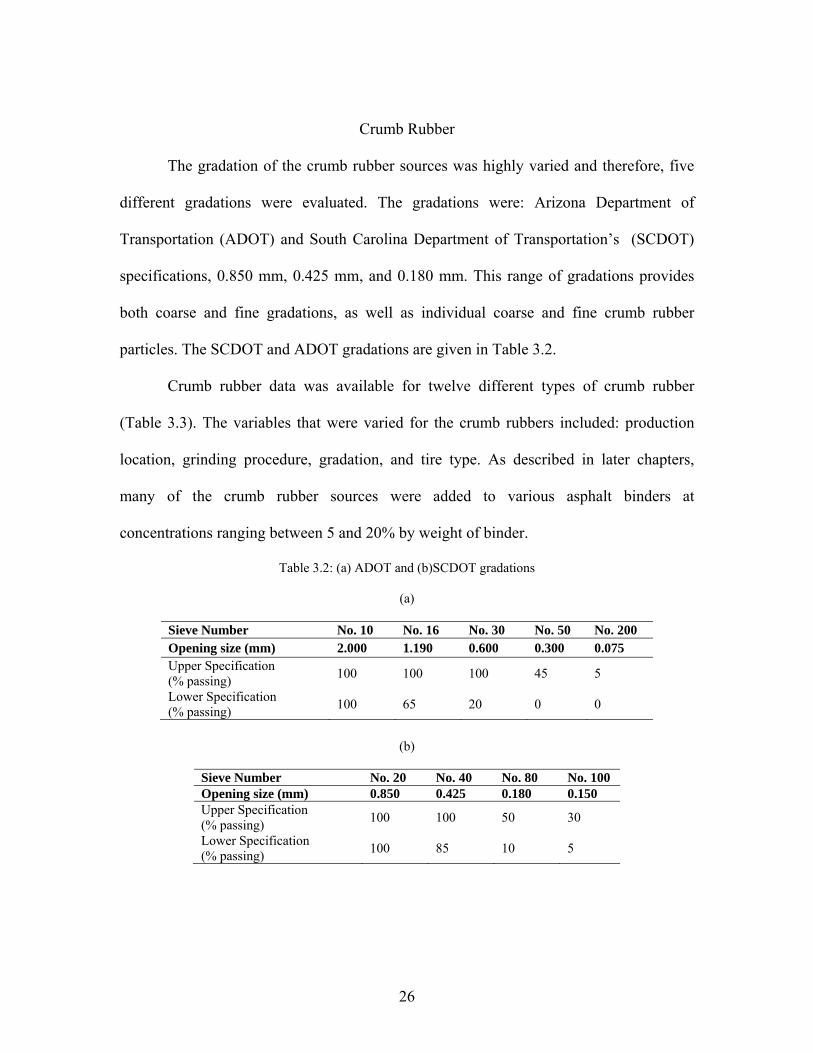
Crumb Rubber
The gradation of the crumb rubber sources was highly varied and therefore, five
different gradations were evaluated. The gradations were: Arizona Department of
Transportation (ADOT) and South Carolina Department of Transportation’s (SCDOT)
specifications, 0.850 mm, 0.425 mm, and 0.180 mm. This range of gradations provides
both coarse and fine gradations, as well as individual coarse and fine crumb rubber
particles. The SCDOT and ADOT gradations are given in Table 3.2.
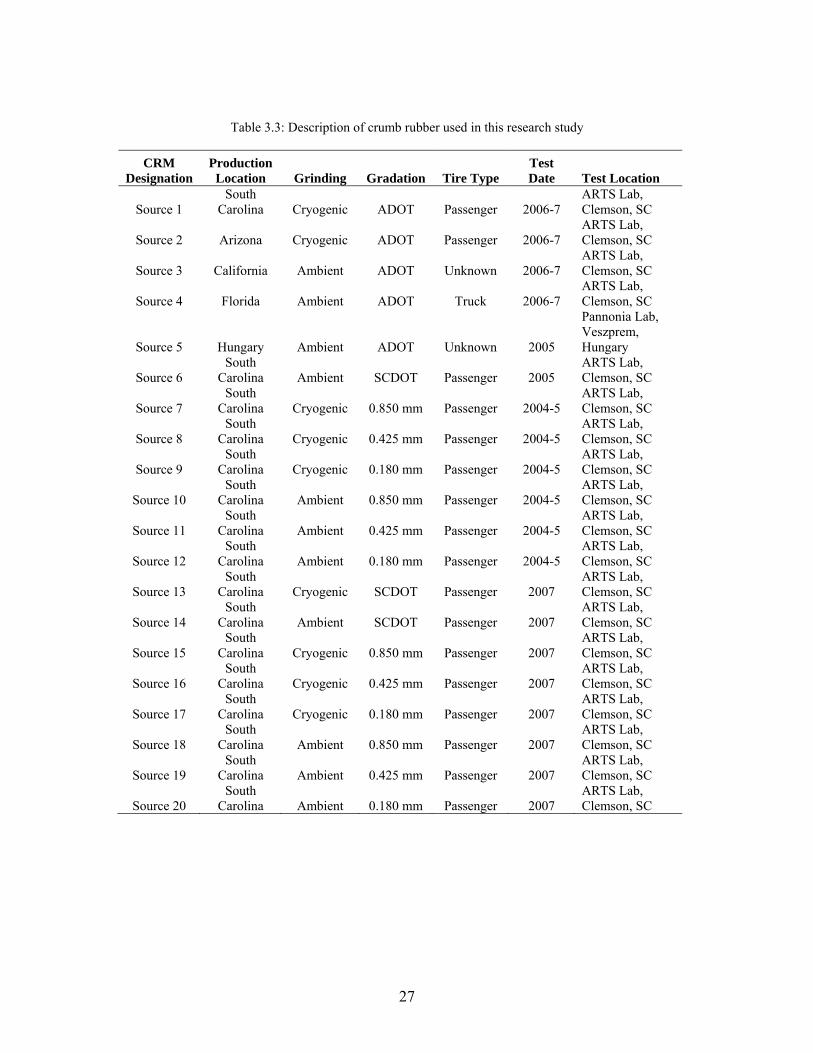
Crumb rubber data was available for twelve different types of crumb rubber
(Table 3.3). The variables that were varied for the crumb rubbers included: production
location, grinding procedure, gradation, and tire type. As described in later chapters,
many of the crumb rubber sources were added to various asphalt binders at
concentrations ranging between 5 and 20% by weight of binder.
Table 3.2: (a) ADOT and (b)SCDOT gradations
(a)
Sieve Number No. 10 No. 16 No. 30 No. 50 No. 200 Opening size (mm) 2.000 1.190 0.600 0.300 0.075 Upper Specification (% passing) 100 100 100 45 5
Lower Specification (% passing) 100 65 20 0 0
(b)
Sieve Number No. 20 No. 40 No. 80 No. 100 Opening size (mm) 0.850 0.425 0.180 0.150 Upper Specification (% passing) 100 100 50 30
Lower Specification (% passing) 100 85 10 5
27
Table 3.3: Description of crumb rubber used in this research study
CRM Designation
Production Location Grinding Gradation Tire Type
Test Date Test Location
Source 1 South
Carolina Cryogenic ADOT Passenger 2006-7 ARTS Lab, Clemson, SC
Source 2 Arizona Cryogenic ADOT Passenger 2006-7 ARTS Lab, Clemson, SC
Source 3 California Ambient ADOT Unknown 2006-7 ARTS Lab, Clemson, SC
Source 4 Florida Ambient ADOT Truck 2006-7 ARTS Lab, Clemson, SC
Source 5 Hungary Ambient ADOT Unknown 2005
Pannonia Lab, Veszprem, Hungary
Source 6 South
Carolina Ambient SCDOT Passenger 2005 ARTS Lab, Clemson, SC
Source 7 South
Carolina Cryogenic 0.850 mm Passenger 2004-5 ARTS Lab, Clemson, SC
Source 8 South
Carolina Cryogenic 0.425 mm Passenger 2004-5 ARTS Lab, Clemson, SC
Source 9 South
Carolina Cryogenic 0.180 mm Passenger 2004-5 ARTS Lab, Clemson, SC
Source 10 South
Carolina Ambient 0.850 mm Passenger 2004-5 ARTS Lab, Clemson, SC
Source 11 South
Carolina Ambient 0.425 mm Passenger 2004-5 ARTS Lab, Clemson, SC
Source 12 South
Carolina Ambient 0.180 mm Passenger 2004-5 ARTS Lab, Clemson, SC
Source 13 South
Carolina Cryogenic SCDOT Passenger 2007 ARTS Lab, Clemson, SC
Source 14 South
Carolina Ambient SCDOT Passenger 2007 ARTS Lab, Clemson, SC
Source 15 South
Carolina Cryogenic 0.850 mm Passenger 2007 ARTS Lab, Clemson, SC
Source 16 South
Carolina Cryogenic 0.425 mm Passenger 2007 ARTS Lab, Clemson, SC
Source 17 South
Carolina Cryogenic 0.180 mm Passenger 2007 ARTS Lab, Clemson, SC
Source 18 South
Carolina Ambient 0.850 mm Passenger 2007 ARTS Lab, Clemson, SC
Source 19 South
Carolina Ambient 0.425 mm Passenger 2007 ARTS Lab, Clemson, SC
Source 20 South
Carolina Ambient 0.180 mm Passenger 2007 ARTS Lab, Clemson, SC
28
Experimental Plan
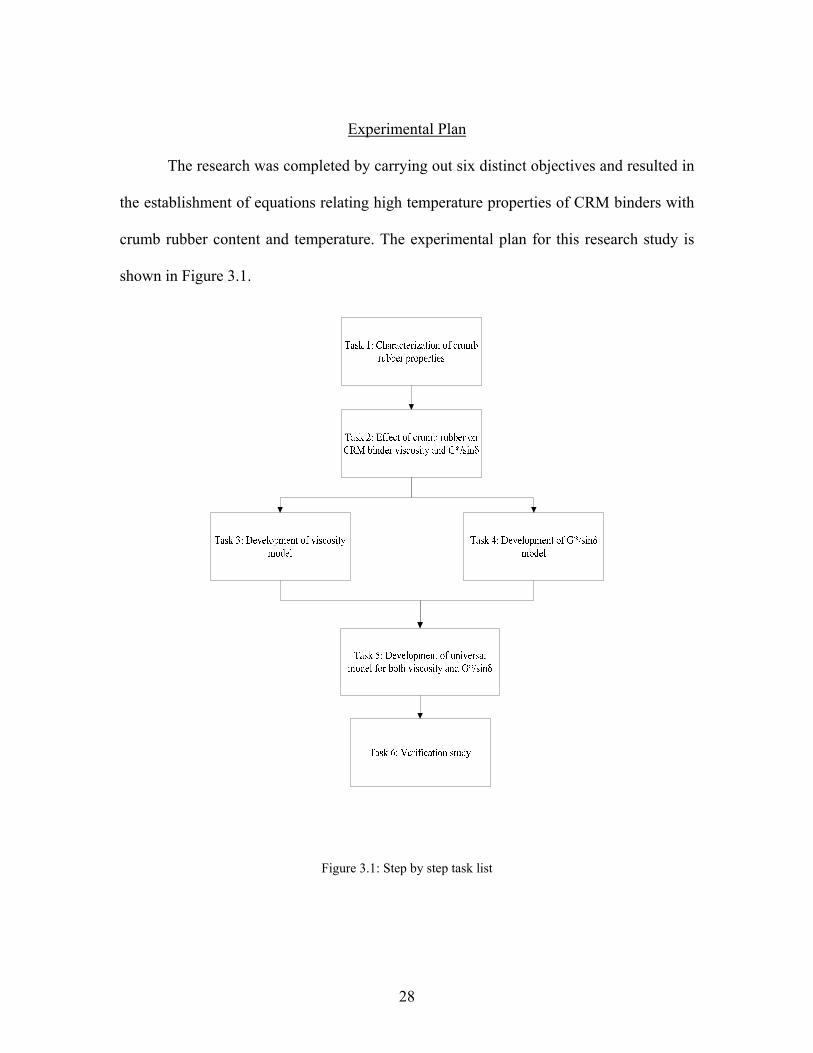
The research was completed by carrying out six distinct objectives and resulted in
the establishment of equations relating high temperature properties of CRM binders with
crumb rubber content and temperature. The experimental plan for this research study is
shown in Figure 3.1.
Figure 3.1: Step by step task list
29
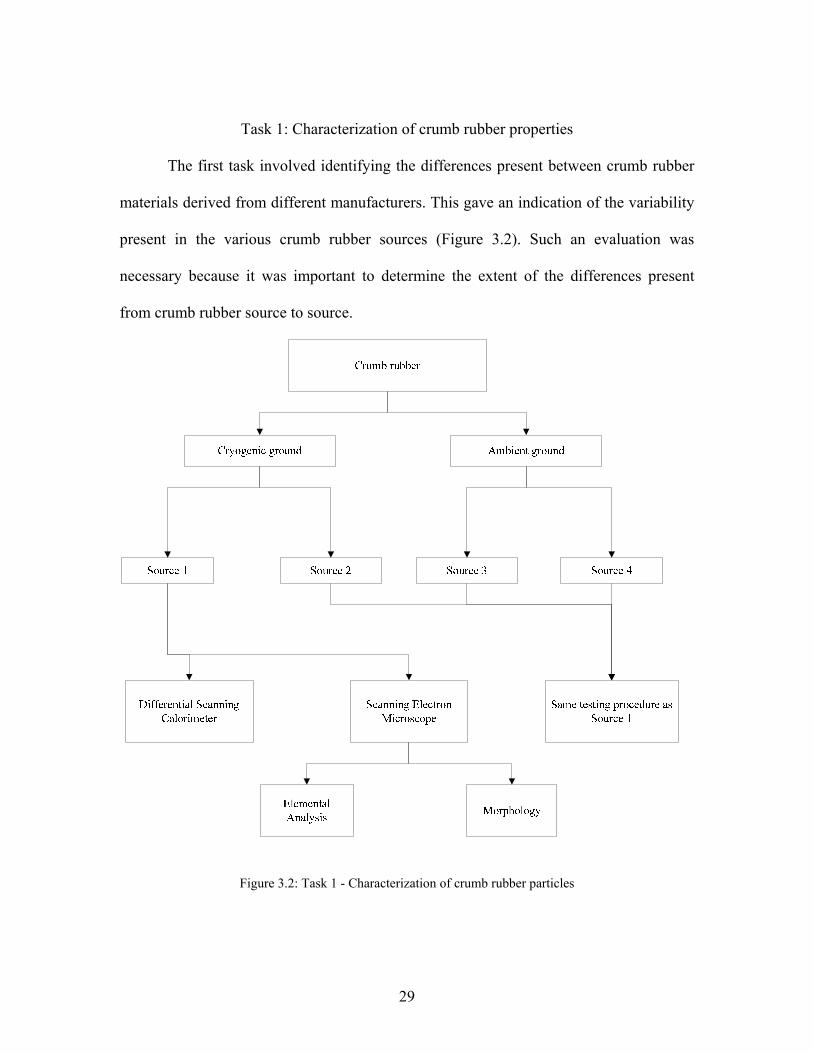
Task 1: Characterization of crumb rubber properties
The first task involved identifying the differences present between crumb rubber
materials derived from different manufacturers. This gave an indication of the variability
present in the various crumb rubber sources (Figure 3.2). Such an evaluation was
necessary because it was important to determine the extent of the differences present
from crumb rubber source to source.
Figure 3.2: Task 1 - Characterization of crumb rubber particles
30
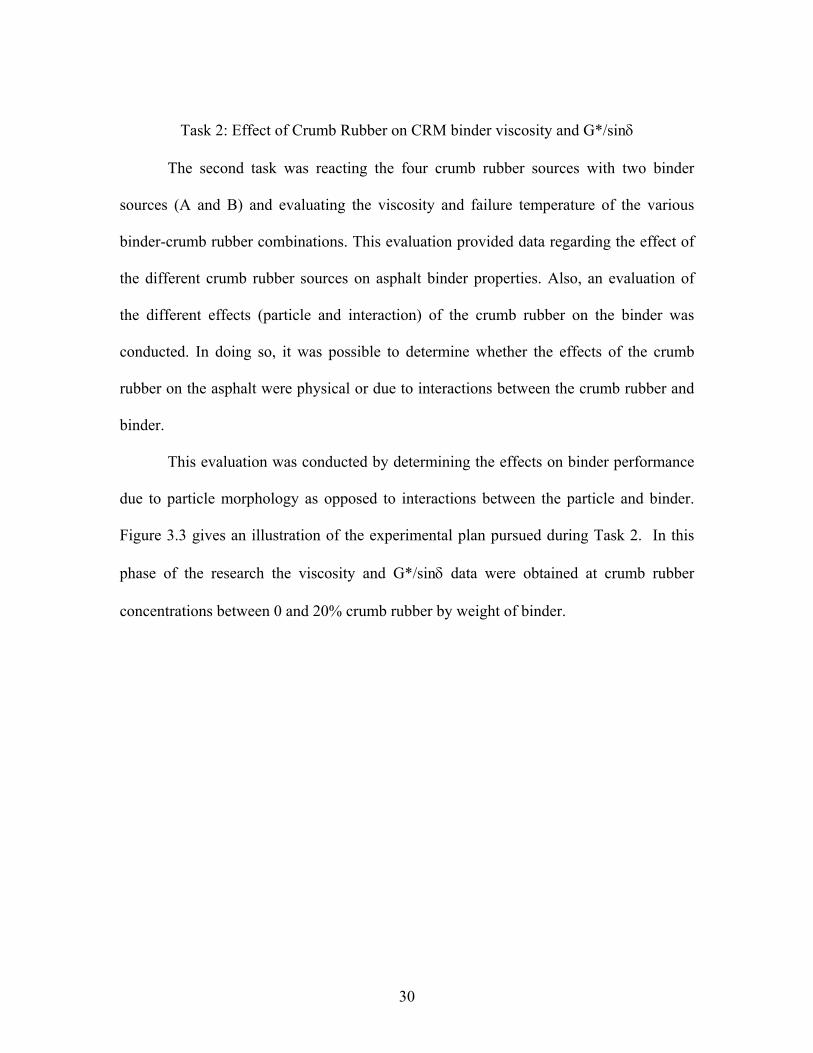
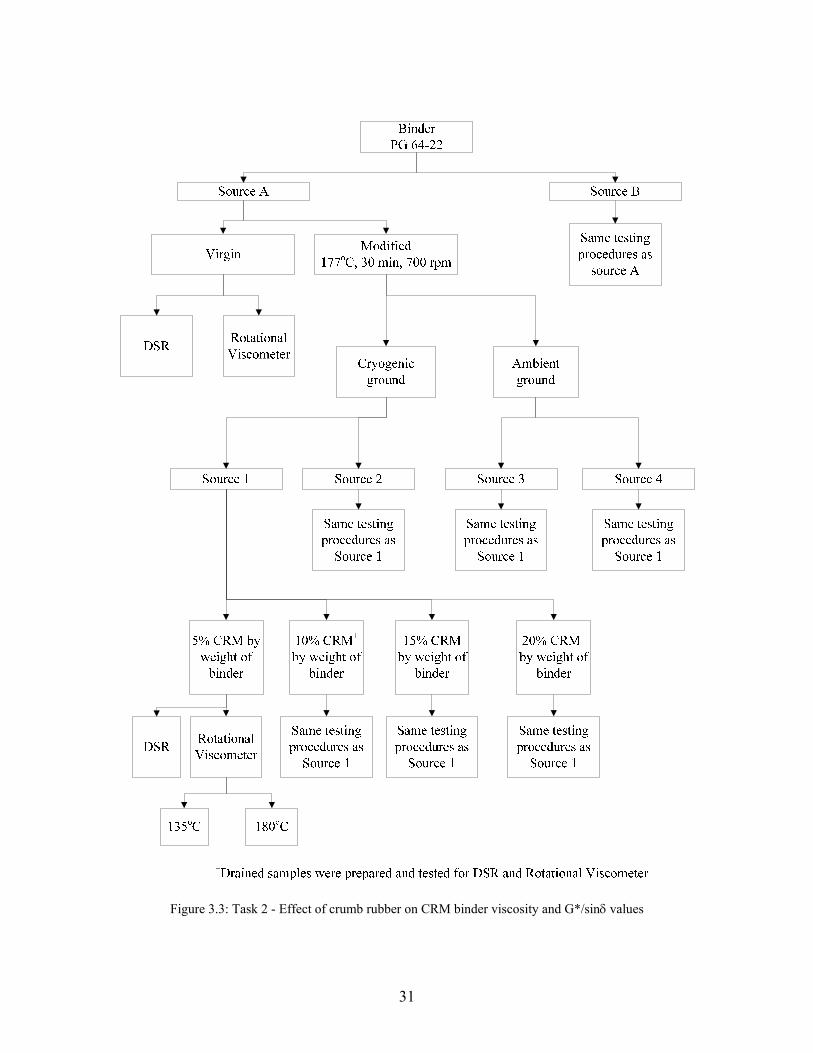
Task 2: Effect of Crumb Rubber on CRM binder viscosity and G*/sinδ
The second task was reacting the four crumb rubber sources with two binder
sources (A and B) and evaluating the viscosity and failure temperature of the various
binder-crumb rubber combinations. This evaluation provided data regarding the effect of
the different crumb rubber sources on asphalt binder properties. Also, an evaluation of
the different effects (particle and interaction) of the crumb rubber on the binder was
conducted. In doing so, it was possible to determine whether the effects of the crumb
rubber on the asphalt were physical or due to interactions between the crumb rubber and
binder.
This evaluation was conducted by determining the effects on binder performance
due to particle morphology as opposed to interactions between the particle and binder.
Figure 3.3 gives an illustration of the experimental plan pursued during Task 2. In this
phase of the research the viscosity and G*/sinδ data were obtained at crumb rubber
concentrations between 0 and 20% crumb rubber by weight of binder.
31
Figure 3.3: Task 2 - Effect of crumb rubber on CRM binder viscosity and G*/sinδ values
32
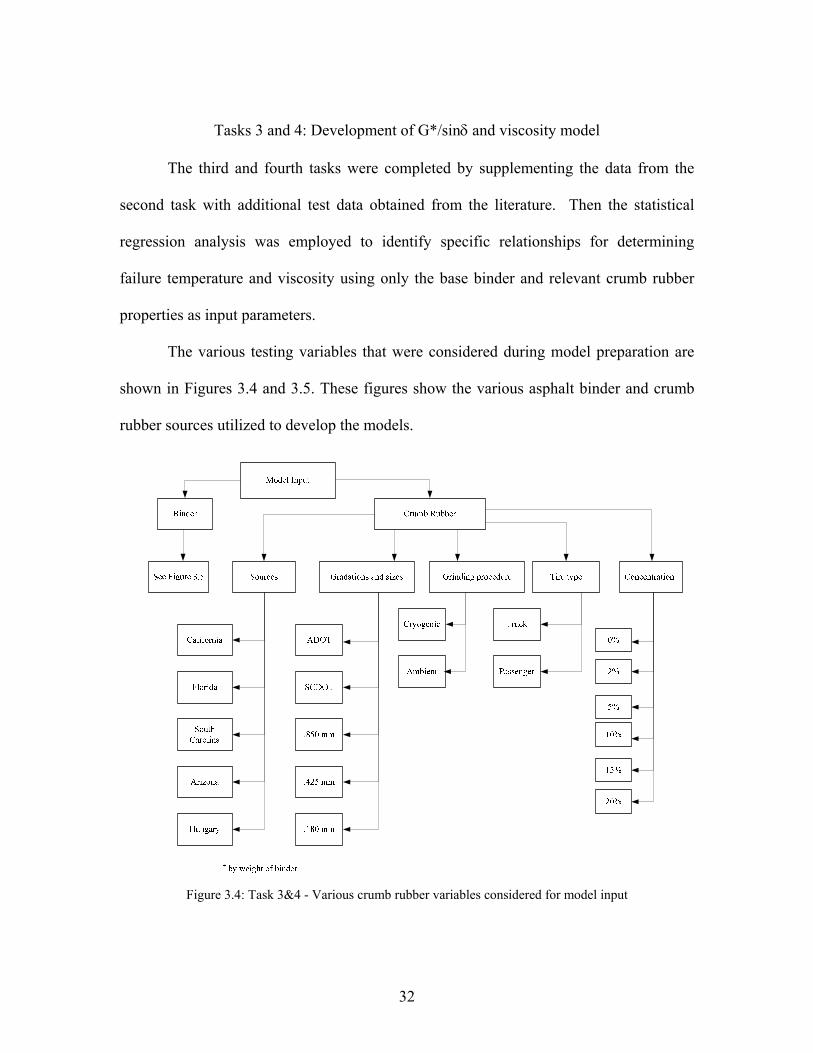
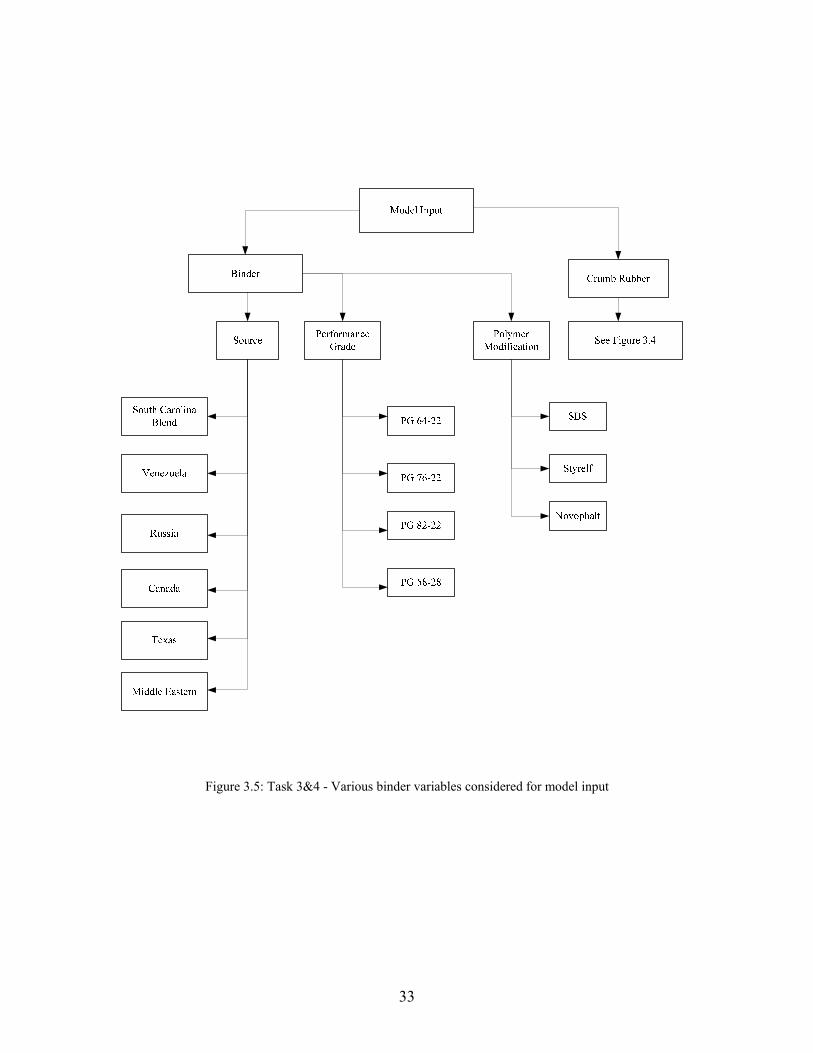
Tasks 3 and 4: Development of G*/sinδ and viscosity model
The third and fourth tasks were completed by supplementing the data from the
second task with additional test data obtained from the literature. Then the statistical
regression analysis was employed to identify specific relationships for determining
failure temperature and viscosity using only the base binder and relevant crumb rubber
properties as input parameters.
The various testing variables that were considered during model preparation are
shown in Figures 3.4 and 3.5. These figures show the various asphalt binder and crumb
rubber sources utilized to develop the models.
Figure 3.4: Task 3&4 - Various crumb rubber variables considered for model input
33
Figure 3.5: Task 3&4 - Various binder variables considered for model input
34
Task 5: Development of the universal model for both viscosity and G*/sinδ
Upon completion of the fifth task, a universal model relating the high temperature
performance grade of the CRM binder to the asphalt viscosity was developed. This
relationship permitted data regarding both the viscosity and the high temperature
performance grade of the binder to be obtained using a single equation.
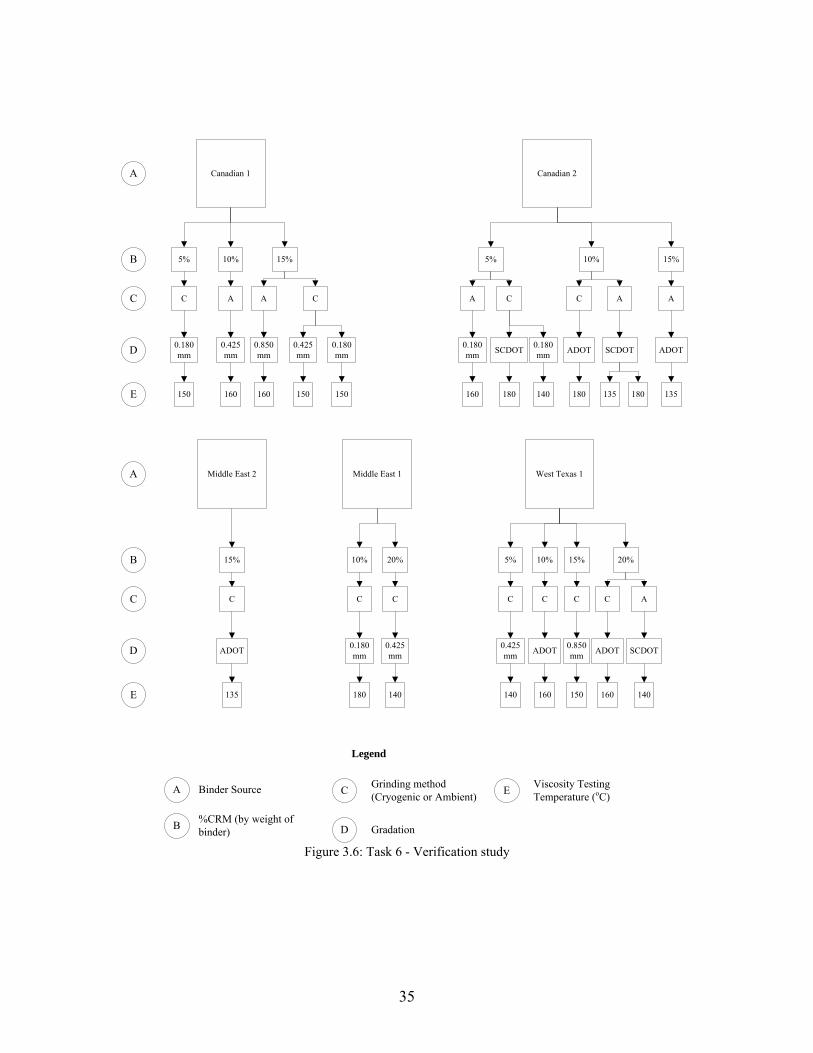
Task 6: Verification Study
Finally, the sixth task involved a follow-up study using previously untested
materials. This provided an evaluation of the various equations which were developed
over the course of the first five tasks. Specifically, the data from this task provided
validation of the models for a number of previously untested binders.
The untested materials consisted of many combinations of binder sources, crumb
rubber variables, crumb rubber concentrations, and temperatures. Obviously, it was not
possible to test all of the combinations of these factors. Instead of trying to test all the
possible combinations, a certain subset of the combinations was determined (called a
fractional factorial) that allowed a generalization of the results as if all the combinations
had been simulated. This generalized testing scheme is shown in Figure 3.6.
35
Canadian 1 Canadian 2
Middle East 2 Middle East 1 West Texas 1
5% 15%10% 5% 15%10%
15% 20%10% 5% 20%10%
A
A A CC A C C AA
C CC
15%
CCCC
SCDOT SCDOT
135
SCDOT
ADOT
180 180
ADOT
135
ADOT
135 140
ADOT ADOT
160 160
0.425mm
0.425mm
0.425mm
0.425mm
160 150
140 140
0.850mm
160
0.850mm
150
0.180mm
150
0.180mm
150
0.180mm
160
0.180mm
140180
0.180mm
180
A
B
C
D
E
A
B
C
D
E
A
B
C
D
EBinder Source
%CRM (by weight of binder)
Grinding method (Cryogenic or Ambient)
Gradation
Viscosity Testing Temperature (oC)
Legend
Figure 3.6: Task 6 - Verification study
36
An important step in the model validation was to check that the sample size of the
presented data was large enough to ensure that the models were accurately estimated.
The measure that was used for accuracy was the width of the interval estimated around
the models and the size of the standard errors of the estimated model coefficients. The
widths and sizes were based on three factors: 1) the amount of variation within the data,
2) the confidence levels of the intervals, and 3) the magnitude of the coefficients.
Statistical formulas are available that relate the sample size to these three factors. These
three factors were determined for this research and the formulas were used to estimate the
needed sample size. Further statistical tests are also available to confirm the validity of
the sample size selected.
Methods
Sample Preparation
The base binders prepared in the laboratory in this research were generally
delivered to the laboratory in 5 gallon buckets from the source. The samples were then
reduced to 600 g samples by heating the 5 gallon buckets of binder until the binder
flowed easily. The 600 g samples were stored in sealed individual quart cans at room
temperature until they were blended with the crumb rubber.
Prior to blending, the specified binder cans were placed in a 163oC oven for
approximately 75 minutes. The wet process was used when reacting the crumb rubber
with the binders. During blending the individual can of binder was placed on top of a hot
plate (maintained at approximately between 400-425oC) with a sand bath. The
37
mechanical mixer used was a high shear 50.8 mm diameter radial flow impellor; crumb
rubber concentrations of 5, 10, 15, and 20% by weight of binder were used to react the
materials using a reaction time of 30 minutes while maintaining a constant binder
temperature of 177oC and speed of 700 rpm. This temperature was selected as it is a
common temperature used to produce CRM binders in the field in South Carolina. Upon
completion of blending the crumb rubber with the binder, the can of CRM binder was
sealed and allowed to cool for 24 hours at room temperature prior to testing.
Drained binders were also prepared in order to study particle and interaction
effects of the crumb rubber on the binder. Separation of the binder from the crumb rubber
was done by heating the CRM binder to a temperature of 163oC in an oven, the binder
was then mixed thoroughly to ensure uniformity and 100 g of each binder was poured
into a 76.2 mm diameter 80 mesh (0.18 mm) sieve and allowed to drain for 30 minutes in
an oven maintained at 149oC. Binder recovered from this process was then subjected to
the same tests as the CRM binder.
Characterization of Crumb Rubber
Cryogenic processed particles are known to exhibit a crystalline shape as a result
of the fracturing occurring following the cryogenic freezing process, whereas ambient
ground crumb rubber display rougher edges as a result of the tearing action typical of the
ambient grinding procedure. Crumb rubber particles resulting from the two production
processes can be identified by magnified imagery. Additionally SEM was utilized to
38
conduct the elemental analysis of the crumb rubber particles to establish the elemental
compositions of the various crumb rubber sources studied.
The SEM analysis was done using a Hitachi S3500N SEM; 30x magnification
was selected, as this level of magnification permitted clear identification of the grinding
mechanism (ambient/cryogenic) used to reduce the scrap tire into crumb rubber. The
sample was prepared by attaching some crumb rubber particles to an aluminum specimen
tab with double sided carbon tape. Care was taken to ensure all the crumb rubber particles
were firmly attached to the tab; the SEM was calibrated using a copper sample.
In general, truck tires exhibit a higher concentration of natural rubber than
passenger car tires; however, the exact amounts of each component are proprietary as
well as possibly being varied from time to time or from manufacturer to manufacturer.
During the crumb rubber production process, in many cases, tires from numerous sources
are collected, shredded, and distributed without particular attention being paid to the
nature of each tire type. One of the points of interest for this research study was to
determine the effect of these elemental and physical inequalities on the CRM binder
properties.
A differential scanning calorimeter (DSC) was used to determine the presence of
various rubber compounds in the crumb rubber, by determining the number of glass
transition temperatures present. These corresponding temperatures were then used to
verify the presence of natural and synthetic rubber. The glass transition temperature of
natural rubber (NR) is approximately -70oC whereas the glass transition temperature of
synthetic rubber is approximately -108oC. Therefore, confirming the presence of such
39
glass transition temperatures would permit identification of various rubber types present
in the crumb rubber.
Samples were analyzed using a TA instruments Q1000 DSC, where a 7.5 mg
sample was enclosed in standard aluminum DSC sample pan and entered into the DSC.
The temperature was then varied from -150oC to 100oC at a rate of 20oC/minute, using a
N2 flow rate of 50cm3/min. The data was analyzed using Universal Analysis Software,
glass transition temperatures were obtained from the inflection point of the step function.
Viscosity Testing
AASHTO T316 was used when determining the viscosity at 135oC. During this
procedure 8.5 grams of asphalt binder is poured into a standard Brookfield Viscometer
test tube, the test tube and asphalt were then placed in temperature control device and the
desired temperature selected. The appropriate spindle was selected (#21 for virgin
binder), attached to the viscometer, and then submerged in the test tube to the specified
depth. The sample was then allowed to heat up for 20 minutes, followed by 10 minutes of
the spindle rotating at 20 RPM. Finally, three viscosity measurements are recorded at one
minute intervals (American Association of State Highway Officials, 2006).
It should be noted that when CRM binder samples were used 10.5 gram samples
were used instead of 8.5 grams samples, subsequently a smaller spindle size (#27) was
also selected. Careful attention was placed on ensuring that the CRM binder samples
were well mixed prior to pouring into the test tube.
40
G*/sinδ Testing
AASHTO T315 was used for the DSR testing (American Association of State
Highway and Transportation Officials, 2006). The complex shear modulus and phase
angle were measured using a Bohlin DSR. Following previous research, a 2 mm gap was
used for testing CRM binder samples in the DSR, while a 1 mm gap was used for the
virgin binder. Variations in gap were incorporated to take into account the effect of the
rubber particle size present in the CRM binder. Previous research suggests that the
variation in the gap size does not affect the comparison of results between the CRM
binder and the unmodified binder when binders are tested in the linear viscoelastic
region. It has been noticed that the 2 mm gap resulted in less variability of data when
compared to the 1 mm gap for CRM binders. This lower variability was attributed to the
fact that when the 2 mm gap was used there was less possibility of rubber particles
coming in contact with the plates, thus adversely affecting the rheological measurements
of the sample (Tayebali et al., 1990; Bahia & Davies, 1996; Bahia & Davis, 1994).
41
CHAPTER FOUR
STATISTICAL ANALYSIS PROCEDURES 4. four
This research project required the use of numerous statistical analysis procedures.
During Tasks 1 and 2 the ANOVA and LSD procedures were used to determine the
significant differences between the binder and crumb rubber property means among the
various sources. Tasks 3-5 dealt with the development of nonlinear regression models for
the proposed relationships between G*/sinδ, failure temperature, and viscosity, and 95%
confidence intervals were used to evaluate the precision of the various models. Finally,
the verification testing in Task 6 was performed by using a small subset of the many
factor combinations (i.e. a fractional factorial design). Each of these procedures is
introduced and expanded upon in this chapter; all relevant equations and notation are
included in the discussion.
Analysis of Variance (ANOVA)
The Analysis of Variance (ANOVA) is a method for comparing the means of
several populations, this method is an alternative to performing multiple t tests to test this
hypothesis (Fisher, 1949). This method permits the hypothesis of “multiple means being
equal” to be analyzed at a specified probability of Type I error (0.05 for example). The
ANOVA procedure is based on the following assumptions:
1. Independence of cases: Independent random samples from their respective
populations.
2. Normality: The distributions in each of the groups are normal.
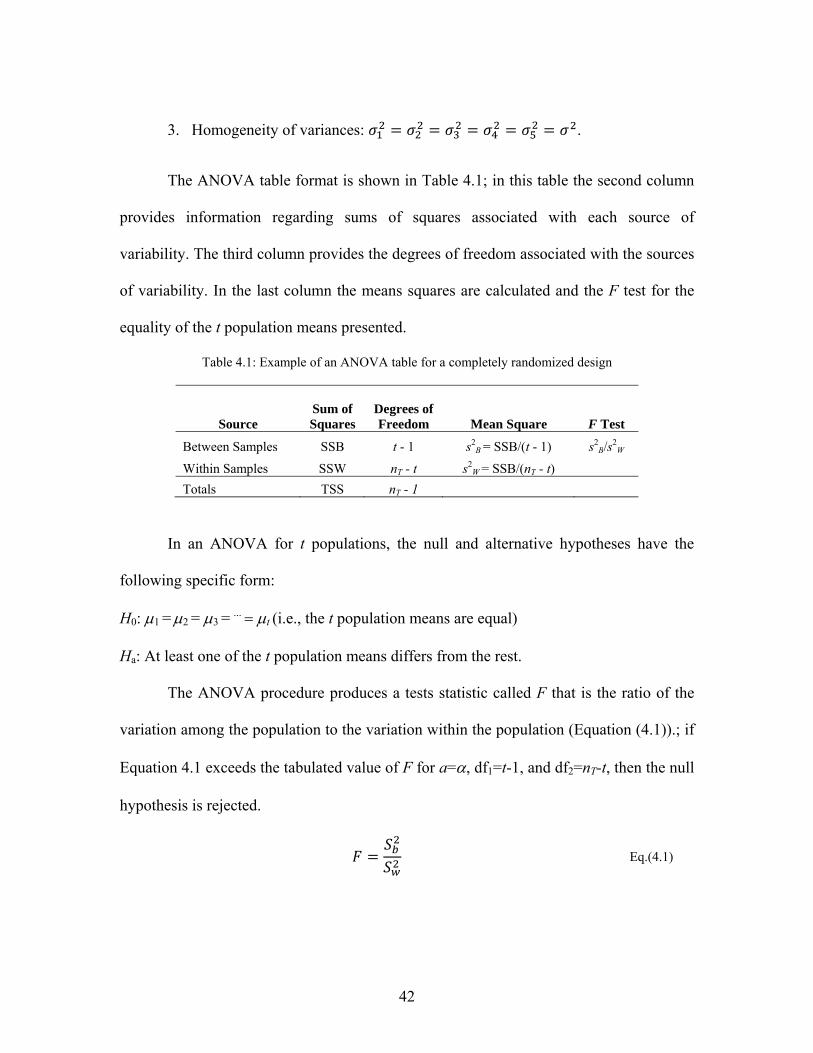
42
3. Homogeneity of variances: .
The ANOVA table format is shown in Table 4.1; in this table the second column
provides information regarding sums of squares associated with each source of
variability. The third column provides the degrees of freedom associated with the sources
of variability. In the last column the means squares are calculated and the F test for the
equality of the t population means presented.
Table 4.1: Example of an ANOVA table for a completely randomized design
Source Sum of Squares
Degrees of Freedom Mean Square F Test
Between Samples SSB t - 1 s2B = SSB/(t - 1) s2
B/s2W
Within Samples SSW nT - t s2W = SSB/(nT - t)
Totals TSS nT - 1
In an ANOVA for t populations, the null and alternative hypotheses have the
following specific form:
H0: μ1 = μ2 = μ3 = ... = μt (i.e., the t population means are equal)
Ha: At least one of the t population means differs from the rest.
The ANOVA procedure produces a tests statistic called F that is the ratio of the
variation among the population to the variation within the population (Equation (4.1)).; if
Equation 4.1 exceeds the tabulated value of F for a=α, df1=t-1, and df2=nT-t, then the null
hypothesis is rejected.
Eq.(4.1)
43
Fisher’s Least Significant Difference (LSD)
In this research the LSD procedure was used to make specific comparisons
between pairs of various CRM binder and crumb rubber properties. This procedure was
also developed by R.A Fisher in 1949, and is commonly used for making pairwise
comparisons among a set of t population means (Fisher, 1949). The Fisher LSD uses the
observed difference between two sample means as a test statistic for testing the null and
alternative hypothesis.
H0: μi = μj
Ha: μi μj
Research has shown that the error rate for the LSD test is controlled on an
experimentwise basis at a level approximately equal to the α-level for the F test (Cramer
& Swanson, 1973).
During this study the MEANS LSD command in the SAS program was used to
perform the various LSD tests; however, Ott and Longnecker provide the following step
by step procedure for performing Fisher’s LSD test (Ott & Longnecker, 2001):
1. Perform an ANOVA test to test H0: μ1 = μ2 = μ3 = ... = μt against the alternative
hypothesis that at least on of the means differs from the rest.
2. If there is insufficient evidence to reject H0 using F = MSB/MSW, proceed no
further.
3. If H0 is rejected, define the LSD to be the observed difference between the two
sample means necessary to declare the corresponding population means different.
44
4. The least significant difference for comparing μi to μj (at a specified value of α),
is computed using Equation (4.2):
/1 1
Eq.(4.2)
Where,
ni and nj: Sample size for population i and j, respectively
t: Critical t value for a=α/2
sw2: Mean square within samples
5. Next, all pairs of sample means are compared. If . . , , it is possible
to identity the corresponding population means μi and μj different.
6. It is necessary to note that the probability of a Type I error for each pairwise
comparison of population means is fixed at a specified value of α.
Regression Analysis
The method of nonlinear least squares was used to estimate the parameters in the
various CRM binder property equations, this is because they were nonlinear functions of
the parameters. The reason for using a nonlinear model is that often when attempting to
model real world phenomena, simple linear models are not accurate enough. According
to Jennrich, a nonlinear model is by definition a nonlinear family of functions. The
functions themselves may be linear or nonlinear; in simpler terms a nonlinear model is
one that is nonlinear in its parameters (Jennrich, 1995)
45
Jennrich maintains that the world is full of nonlinear models; this is because
almost all mathematical models in science are defined by differential equations, and
differential equations almost inevitably give rise to nonlinear models. Therefore, the
basic task in nonlinear regression involves fitting nonlinear models to data (Jennrich,
1995).
Generally, the nonlinear regression model may be written in the form given in
Equation (4.3).
, Eq.(4.3)
If we allow (x1,y1),…(xn,yn) to be a set of n observations of the dependent variable
y and the vector independent variables x in the nonlinear regression model (Equation
(4.4)). This leads to the data model:
, 1, … , Eq.(4.4)
A parameter vector in Θ is called a least squares estimate of θ if θ =
minimizes the least squares criterion (Equation (4.5)).
, Eq.(4.5)
over all θ in Θ. A least squares estimate need not exist and if it does, one seldom has
simple conditions for uniqueness like those in linear regression (Jennrich, 1995).
The observation space representation for the issue of minimizing Equation (4.5)
is given in Figure 4.1. In this case the objective is to select which minimizes the sum of
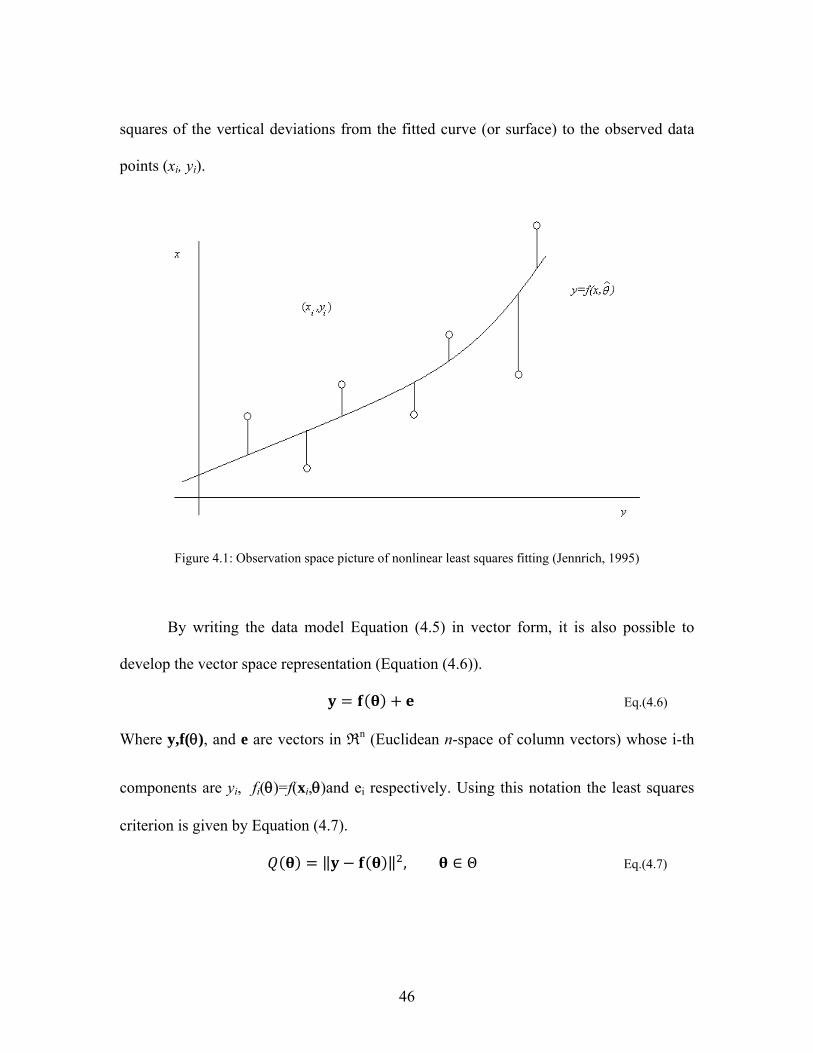
46
squares of the vertical deviations from the fitted curve (or surface) to the observed data
points (xi, yi).
Figure 4.1: Observation space picture of nonlinear least squares fitting (Jennrich, 1995)
By writing the data model Equation (4.5) in vector form, it is also possible to
develop the vector space representation (Equation (4.6)).
Eq.(4.6)
Where y,f(θ), and e are vectors in Rn (Euclidean n-space of column vectors) whose i-th
components are yi, fi(θ)=f(xi,θ)and ei respectively. Using this notation the least squares
criterion is given by Equation (4.7).
, Θ Eq.(4.7)
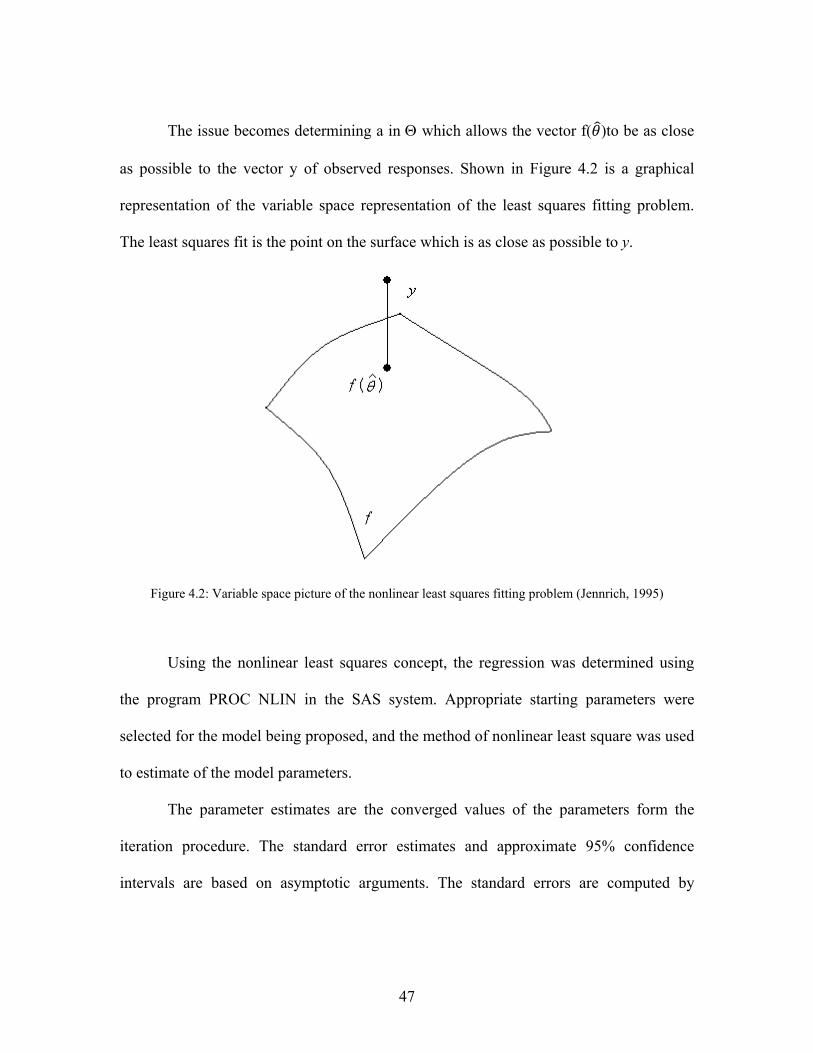
47
The issue becomes determining a in Θ which allows the vector f( )to be as close
as possible to the vector y of observed responses. Shown in Figure 4.2 is a graphical
representation of the variable space representation of the least squares fitting problem.
The least squares fit is the point on the surface which is as close as possible to y.
Figure 4.2: Variable space picture of the nonlinear least squares fitting problem (Jennrich, 1995)
Using the nonlinear least squares concept, the regression was determined using
the program PROC NLIN in the SAS system. Appropriate starting parameters were
selected for the model being proposed, and the method of nonlinear least square was used
to estimate of the model parameters.
The parameter estimates are the converged values of the parameters form the
iteration procedure. The standard error estimates and approximate 95% confidence
intervals are based on asymptotic arguments. The standard errors are computed by
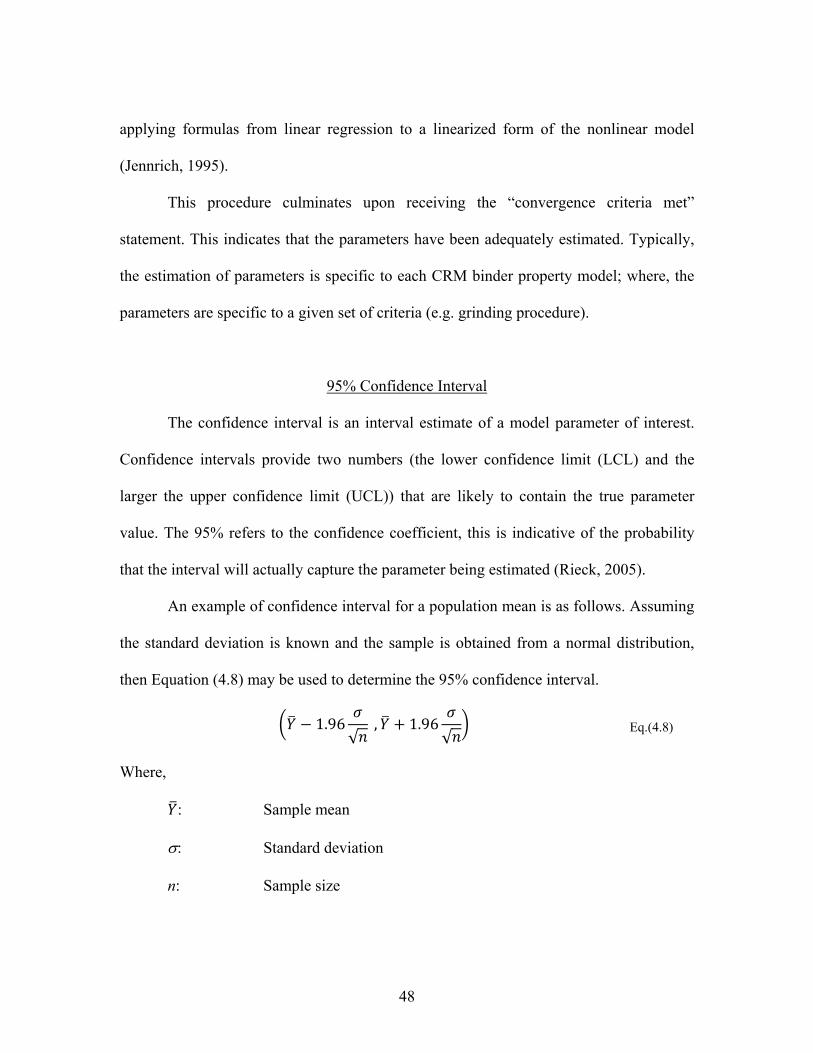
48
applying formulas from linear regression to a linearized form of the nonlinear model
(Jennrich, 1995).
This procedure culminates upon receiving the “convergence criteria met”
statement. This indicates that the parameters have been adequately estimated. Typically,
the estimation of parameters is specific to each CRM binder property model; where, the
parameters are specific to a given set of criteria (e.g. grinding procedure).
95% Confidence Interval
The confidence interval is an interval estimate of a model parameter of interest.
Confidence intervals provide two numbers (the lower confidence limit (LCL) and the
larger the upper confidence limit (UCL)) that are likely to contain the true parameter
value. The 95% refers to the confidence coefficient, this is indicative of the probability
that the interval will actually capture the parameter being estimated (Rieck, 2005).
An example of confidence interval for a population mean is as follows. Assuming
the standard deviation is known and the sample is obtained from a normal distribution,
then Equation (4.8) may be used to determine the 95% confidence interval.
1.96√
, 1.96√
Eq.(4.8)
Where,
: Sample mean
σ: Standard deviation
n: Sample size
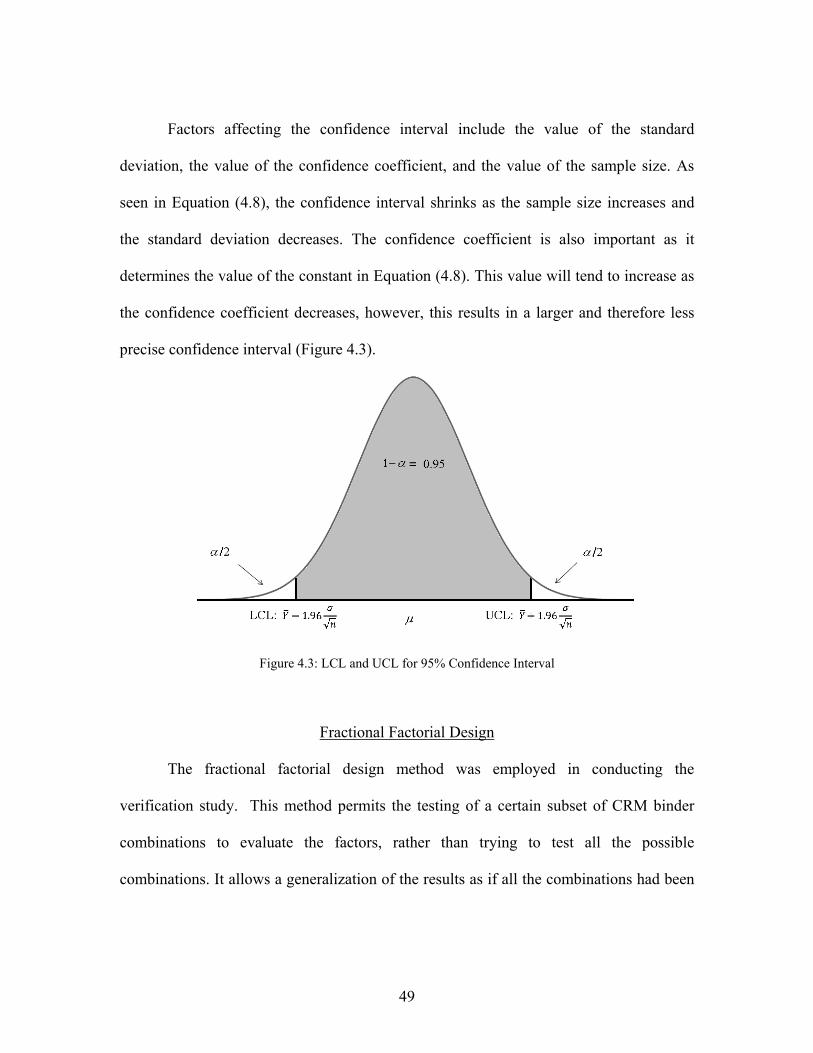
49
Factors affecting the confidence interval include the value of the standard
deviation, the value of the confidence coefficient, and the value of the sample size. As
seen in Equation (4.8), the confidence interval shrinks as the sample size increases and
the standard deviation decreases. The confidence coefficient is also important as it
determines the value of the constant in Equation (4.8). This value will tend to increase as
the confidence coefficient decreases, however, this results in a larger and therefore less
precise confidence interval (Figure 4.3).
Figure 4.3: LCL and UCL for 95% Confidence Interval
Fractional Factorial Design
The fractional factorial design method was employed in conducting the
verification study. This method permits the testing of a certain subset of CRM binder
combinations to evaluate the factors, rather than trying to test all the possible
combinations. It allows a generalization of the results as if all the combinations had been
50
simulated. Equation (4.9) provides the notation usually used for expressing a fractional
factorial designs:
Eq.(4.9)
Where,
I: number of levels of each factor investigated
n: number of factors
p: number of design generators
The fraction of the full factorial design is given by 1/(I p), and the number of
aliases by is given by (I p-1). The number of aliases refers to the number of effects which
are confounded with each other (Toler, 2006).
Usually in fractional factorial designs there are two levels of each factor
investigated, a “high” value and a “low” value. Therefore for a half a replicate (1/2) one
design generator is necessary, and the number of aliases for each effect is (21-1) =1.
The standard order approach is used to determine treatment combinations to be
used in the experiment. If a study using three factors A,B, and C is considered, then the
coefficients for factor A are determined by alternating – and + signs. The coefficients of
factor B are determined by alternating pairs of – and + signs. The coefficients of factor C
are determined by alternating four – and four + signs. The coefficients of the remaining
factors are determined using an alias or with either one of the design generators. The +
and – coefficients for all n factors must be determined in order to decide which treatment
combinations should be included in the experiment (Table 4.2) (Toler, 2006).
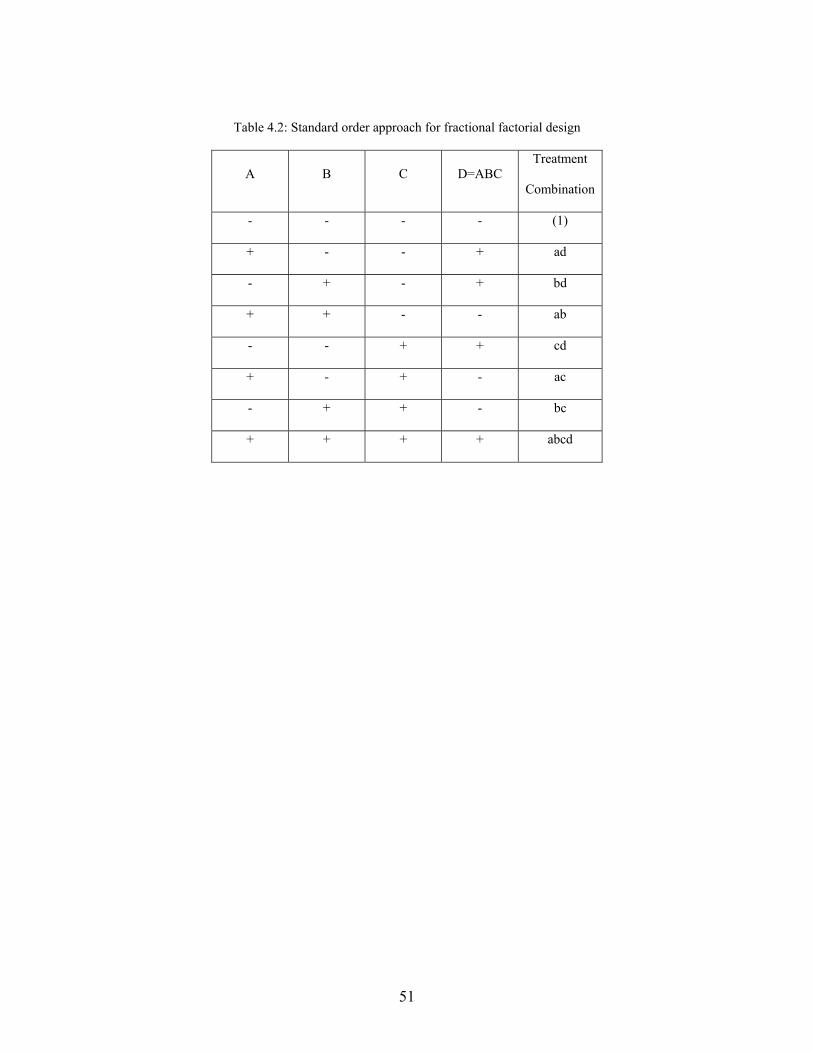
51
Table 4.2: Standard order approach for fractional factorial design
A B C D=ABC Treatment
Combination
- - - - (1)
+ - - + ad
- + - + bd
+ + - - ab
- - + + cd
+ - + - ac
- + + - bc
+ + + + abcd
52
CHAPTER FIVE
MODEL DEVELOPMENT 5. five
Models were developed for determining SHRP test properties of various CRM
binders. Emphasis was placed on the determination of CRM binder properties given only
the virgin binder properties obtained using standard SHRP binder tests and crumb rubber
content and type. This chapter describes the development of models for determining:
• CRM binder viscosity using virgin binder viscosity data;
• CRM binder’s G*/sinδ and failure temperature data using virgin binder’s G*/sinδ
data; and
• CRM binder’s G*/sinδ and failure temperature data using virgin binder’s
viscosity data.
Viscosity Model
The model was developed in two parts; first, the effects of the addition of crumb
rubber to the virgin binders were studied. Once a working model was developed for the
addition of the crumb rubber to the virgin binders, the model for temperature variation
was developed. Such a division assumes that once the binder viscosity is set at 135oC,
binder viscosities will vary with temperatures greater than 135oC in the same fashion.
Therefore, the starting point for the model is described by Equation (5.1), given by:
, , Eq.(5.1)
53
Where ηx,t is the viscosity with rubber content x at temperature t, and η0,135 is the
neat binder viscosity at 135oC. The Rubber Factor and Temperature Factor components
of the model are discussed in the following sections.
Rubber Factor
The rubber factor was considered first because preliminary experimental results
indicated that when crumb rubber was added to the binder, the asphalt viscosity
consistently increased. However, it was also seen that this increase was dependent on the
virgin binder viscosity; therefore, it was necessary to normalize the data in order to
analyze the extent of the viscosity increase. When analyzing viscosity changes due to the
addition of crumb rubber, the virgin binder was held as the reference point, all subsequent
CRM binder viscosities were then divided by the virgin viscosity. Ultimately, a unitless
ratio of crumb rubber concentration to virgin binder viscosity relationship was found.
When these ratios were plotted against their corresponding crumb rubber
percentages, it became clear that the nature of the viscosity increase was consistent for all
CRM modified binders. It was seen that viscosity ratio change with respect to crumb
rubber percent followed an exponential trend. As all the viscosity ratios started at 0%
crumb rubber the starting point was always 1; therefore, the nature of the change could be
quantified by a single entity. This factor was referred to as the rubber coefficient for
viscosity (Rcv). Figure 5.1 provides a visual reference for identifying the rubber
coefficient for viscosity; the Rcv was identified as a suitable parameter for describing the
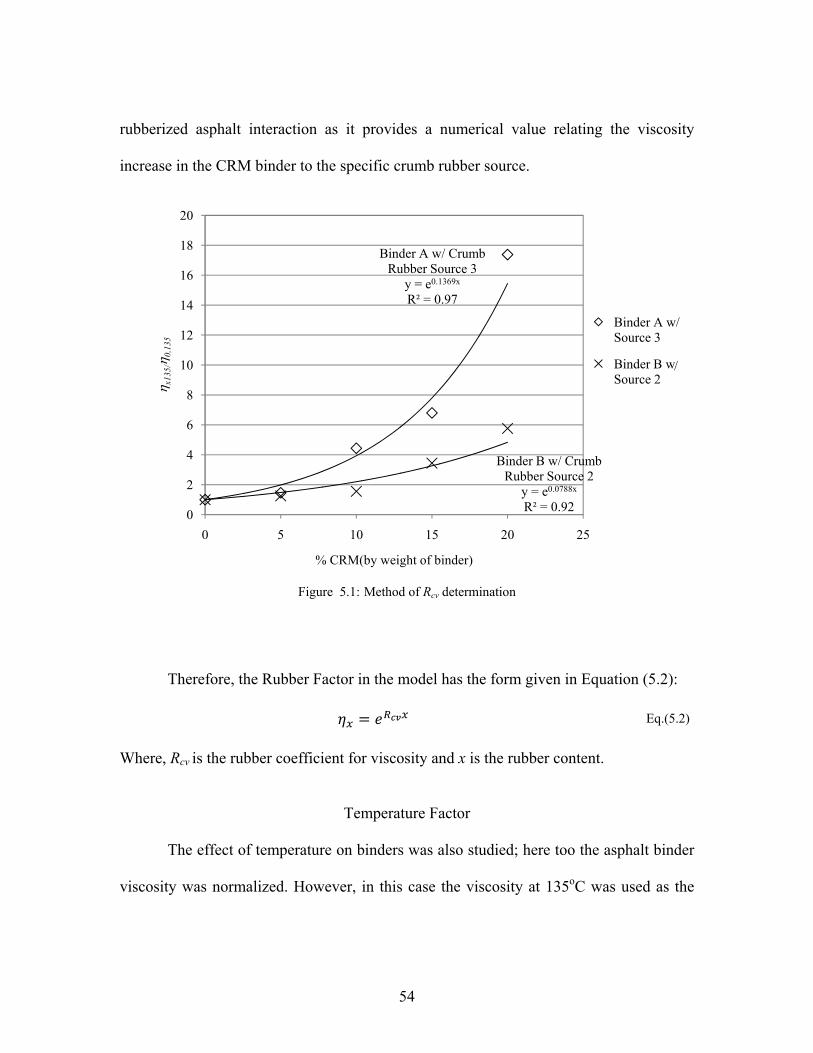
54
rubberized asphalt interaction as it provides a numerical value relating the viscosity
increase in the CRM binder to the specific crumb rubber source.
Figure 5.1: Method of Rcv determination
Therefore, the Rubber Factor in the model has the form given in Equation (5.2):
Eq.(5.2) Where, Rcv is the rubber coefficient for viscosity and x is the rubber content.
Temperature Factor
The effect of temperature on binders was also studied; here too the asphalt binder
viscosity was normalized. However, in this case the viscosity at 135oC was used as the
Binder A w/ Crumb Rubber Source 3
y = e0.1369x
R² = 0.97
Binder B w/ Crumb Rubber Source 2
y = e0.0788x
R² = 0.920
2
4
6
8
10
12
14
16
18
20
0 5 10 15 20 25
η x13
5/η 0
,135
% CRM(by weight of binder)
Binder A w/ Source 3
Binder B w Source 2
/
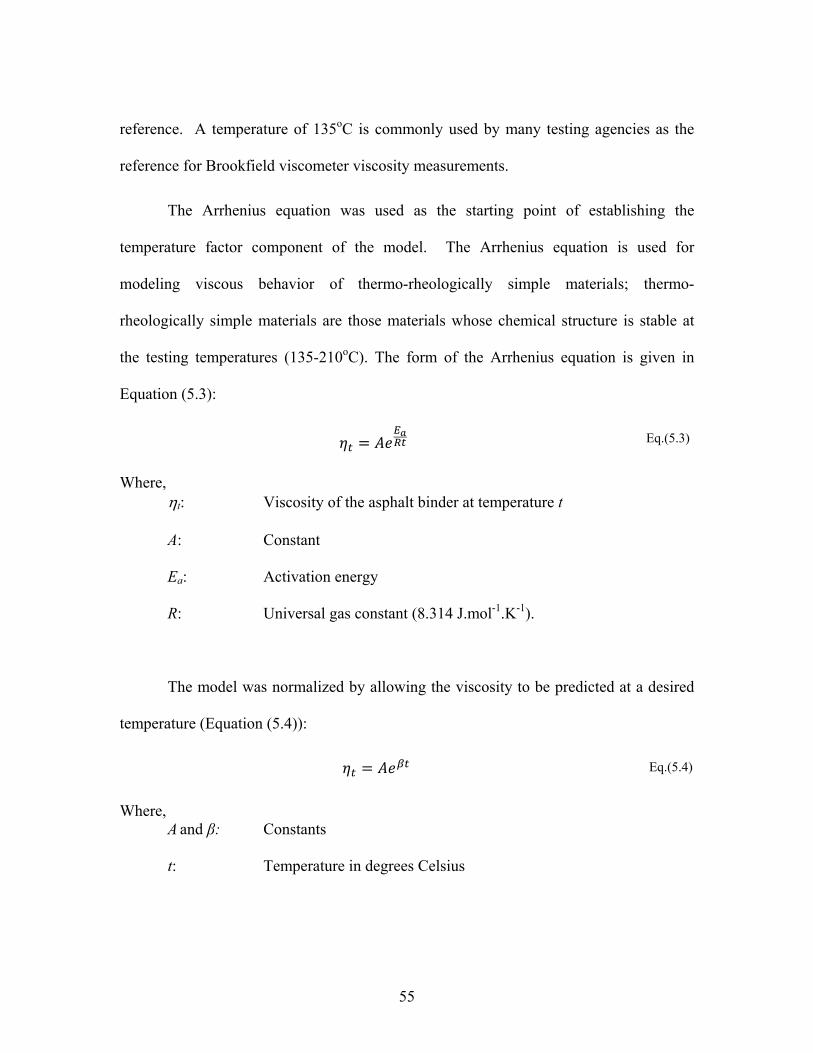
55
reference. A temperature of 135oC is commonly used by many testing agencies as the
reference for Brookfield viscometer viscosity measurements.
The Arrhenius equation was used as the starting point of establishing the
temperature factor component of the model. The Arrhenius equation is used for
modeling viscous behavior of thermo-rheologically simple materials; thermo-
rheologically simple materials are those materials whose chemical structure is stable at
the testing temperatures (135-210oC). The form of the Arrhenius equation is given in
Equation (5.3):
Eq.(5.3)
Where,
ηt: Viscosity of the asphalt binder at temperature t
A: Constant
Ea: Activation energy
R: Universal gas constant (8.314 J.mol-1.K-1).
The model was normalized by allowing the viscosity to be predicted at a desired
temperature (Equation (5.4)):
Eq.(5.4)
Where,
A and β: Constants
t: Temperature in degrees Celsius
56
The Combined Model
The rubber and temperature factors were combined to produce Equation (5.5):
, , Eq.(5.5)
Since the values for η0,135 and Rcv are known constants which have been previously
derived, only the values for parameters A and β need to be estimated. The method of
nonlinear least squares was used to estimate the parameters A and β. All calculations
were performed using the Statistical Analysis System (SAS) procedure, whereby a
nonlinear regression model was fitted to the data.
Failure Temperature Model
The model was developed in two parts; first, the effects of the addition of crumb
rubber to the virgin binder were studied. Once a working model was developed for the
addition of the crumb rubber to the virgin binder, the model for temperature variation was
developed. Equation (5.6) illustrates the starting point for the model:
, , Eq.(5.6)
Where,
G*/sinδx,t: Complex shear modulus divided by the sine of the phase angle with rubber content x at temperature t
G*/sinδ0,64: Virgin binder G*/sinδ value at 64oC
The Rubber Factor and Temperature Factor components of the model are
discussed next.
57
Rubber Factor
The rubber coefficient for G*/sinδ (Rcg) was introduced as a means of quantifying
the unique effects of crumb rubber on the specific binder; it is defined as the exponential
coefficient by which the crumb rubber concentration is multiplied when values of CRM
binder are normalized with the neat binder of the same source. It can be seen in Figure
5.2 that the normalized values follow an exponential trend with increasing crumb rubber
concentrations.
This procedure yielded high R squared values when used to describe the change in
behavior of the binder with respect to crumb rubber concentration. The Rcg values were
calculated for all CRM-Binder combinations, consistent with Figure 5.2, the relationship
between crumb rubber concentration and G*/sinδ was seen to be adequately presented by
Equation (5.7).
,
,
Eq.(5.7)
Where (G*/sinδ)x,64/(G*/sinδ)0,64 is the ratio of G*/sinδ values at 64oC, between 0 and x%
crumb rubber by weight of binder, Rcg is the rubber coefficient for G*/sinδ and x is the
crumb rubber concentration by weight of binder. Equation (5.7) illustrates the
exponential growth witnessed by CRM binders with regards to G*/sinδ values.
Therefore, at a temperature of 64oC the rutting susceptibility of a binder with varying
crumb rubber concentrations may be predicted using Equation (5.7).
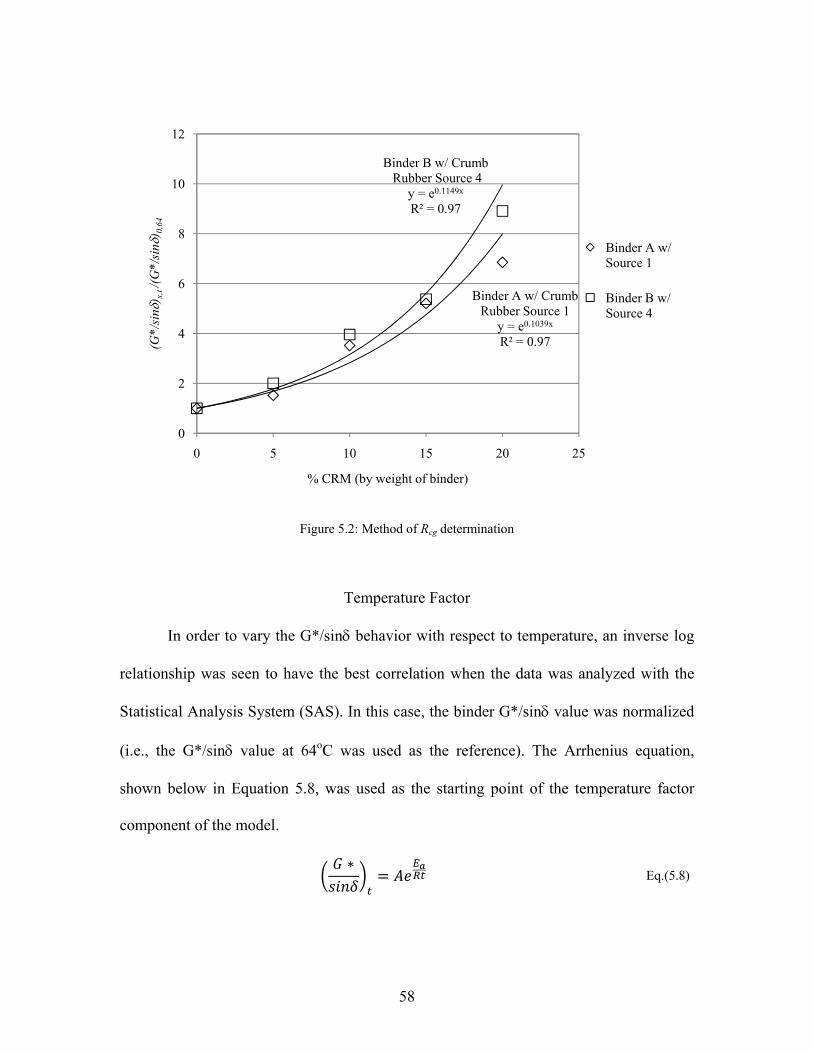
58
Figure 5.2: Method of Rcg determination
Temperature Factor
In order to vary the G*/sinδ behavior with respect to temperature, an inverse log
relationship was seen to have the best correlation when the data was analyzed with the
Statistical Analysis System (SAS). In this case, the binder G*/sinδ value was normalized
(i.e., the G*/sinδ value at 64oC was used as the reference). The Arrhenius equation,
shown below in Equation 5.8, was used as the starting point of the temperature factor
component of the model.
Eq.(5.8)
Binder A w/ Crumb Rubber Source 1
y = e0.1039x
R² = 0.97
Binder B w/ CrumbRubber Source 4
y = e0.1149x
R² = 0.97
0
2
4
6
8
10
12
0 5 10 15 20 25
(G*/
sinδ
) x,t /(
G*/
sinδ
) 0,6
4
% CRM (by weight of binder)
Binder A w/ Source 1
Binder B w/ Source 4
59
Where,
(G*/sinδ)t: complex shear modulus divided by sine of phase angle given at the desired temperature t (> 64oC)
t: Temperature in degrees K
A: Constant, Ea is the activation energy
R: Universal gas constant (8.314 J.mol-1.K-1).
As shown in Equation (5.9), the model was normalized by allowing the
G*/sinδ value to be predicted at a desired temperature. The resulting equation is:
Eq.(5.9)
Where,
K and φ: Constants
t: Temperature in degrees Celsius
The Combined Model
The rubber and temperature components were combined to produce Equation (5.10):
, , Eq.(5.10)
Where,
G*/sinδx,t : Complex shear modulus divided by the phase angle at the desired crumb rubber concentration and temperature
G*/sinδ0, 64: Complex shear modulus divided by the phase angle at a crumb
rubber concentration of zero at 64oC Rcg: Rubber coefficient for G*/sinδ
60
x: Concentration of crumb rubber by weight of binder
K and φ: Constants
t: Temperature in oC.
The method of nonlinear least squares was used to estimate the parameters K and
φ. All calculations were performed using the nonlinear modeling procedure in SAS.
High End Failure Temperature Model
Failure temperature of a binder is defined as the temperature at which the G*/sinδ
value of the unaged binder falls below 1000 Pa (Asphalt Institute, 2003). Therefore, by
rearranging the preceding relationship and solving for temperature when the G*/sinδ is
set to 1000 it is possible to predict the high temperature failure temperature of the binder,
doing so yields Equation (5.11):
,
,
Eq.(5.11)
Equation (5.12) is produced by taking the natural logarithm of both sides,
,
,
Eq.(5.12)
solving for T yields Equation (5.13),
61
,
,
Eq.(5.13)
Therefore, as shown in Equation (5.14), the failure temperature may be determined by
substituting in (G*/sinδ)x,t = 1000 Pa.
1000
,
Eq.(5.14)
Where,
ft: Failure temperature (high end) G*/sinδ0,64: Complex shear modulus divided by the phase angle at a crumb
rubber concentration of zero at 64oC Rcg: Rubber coefficient for G*/sinδ x: Concentration of crumb rubber by weight of binder
Universal model
The experimental data was processed using the Statistical Analysis System,
specifically the nonlinear regression function was used in this software package to find
the optimum empirical relationship between G*/sinδ and the unmodified viscosity while
varying temperature and crumb rubber concentration. This procedure resulted in the
exponential described by Equation (5.15):
62
, Eq.(5.15)
Where,
G*/sinδ: Complex shear modulus divided by sine of phase angle (kPa)
η135,0: Unmodified binder viscosity at 135oC determined by Brookfield viscometer (Pa-s)
x: Percent crumb rubber added by weight of binder (% crumb
rubber) t: User defined temperature (64 – 88 oC) a, b, and c: Coefficients
The differences in CRM binder of differing origin (ambient versus cryogenic) is
well established (Stroup-Gardiner et al., 1993), similarly the differences in rutting
susceptibility between CRM binder and unmodified binder are also known (Xiao et al.,
2007). Therefore, to produce the most accurate results, the binders were classified by
modification procedure (virgin, ambient crumb rubber, or cryogenic crumb rubber) and
coefficients calculated accordingly.
Failure Temperature Model
To solve for failure temperature, it was necessary to rearrange Equation (5.13),
solving for t using a G*/sinδ value of 1 kPa would provide the necessary input to solve
for failure temperature. Therefore, taking Equation (5.15) and dividing by (η135,0 a)
yields Equation (5.16),
63
, Eq.(5.16)
Taking the natural logarithm of both sides produced Equation (5.17),
, Eq.(5.17)
If Equation (5.17) is then solved as a function of t, Equation (5.18) is produced,
1
, Eq.(5.18)
Finally, t is defined as the failure temperature (ft) when G*/sinδ is less than 1 kPa, thus
producing Equation (5.19),
1 1
, Eq.(5.19)
Crumb Rubber Concentration Model
Rearranging Equation (5.13) for crumb rubber concentration (x), yields Equation (5.20)
1 1
, Eq.(5.20)
Similarly, the required amount of crumb rubber for a desired failure temperature may be
obtained by setting the G*/sinδ value to 1 kPa as shown in Equation (5.21),
1 1
, Eq.(5.21)
64
CHAPTER SIX
EXPERIMENTAL RESULTS AND DISCUSSION 6. sixix
In this chapter the results of the tests performed in Tasks 1-6 are presented and
discussed. The first section of the chapter deals specifically with the crumb rubber testing
outlined in Task 1. The next section presents the experimental data obtained from the
binder testing of the various CRM binders outlined Task 2. The remainder of the chapter
is dedicated to the presenting and discussing the various model results and verification
outlined in Tasks 3-6.
Task 1: Characterization of Crumb Rubber Properties
SEM Characterization of Crumb Rubber
As seen in the SEM images given in Figure 6.1, the effects of processing
procedure on crumb rubber surface characteristics were confirmed, two of the crumb
rubber sources (Sources 1 and 2) exhibited smooth fractured edges consistent with
cryogenic grinding. The remaining samples (Sources 3 and 4) exhibited a rougher
morphology typical of ambient ground crumb rubber. The SEM was also utilized to
determine the elemental composition of the crumb rubber particles (Figure 6.2).
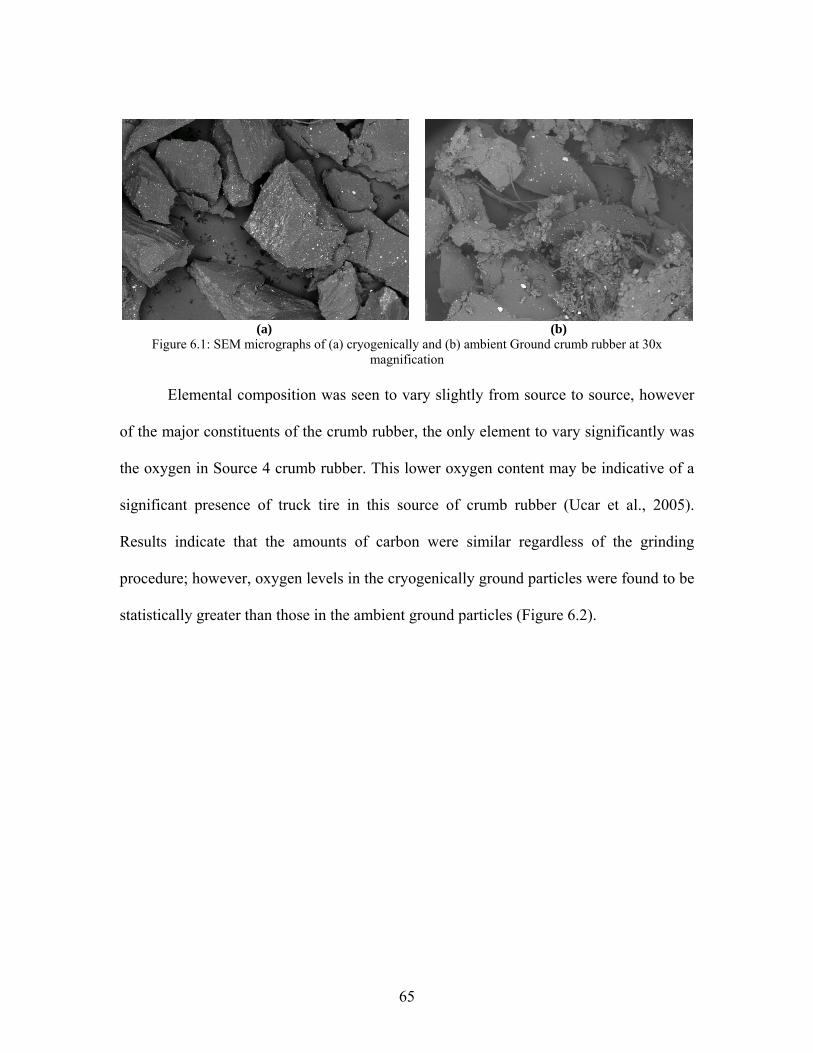
65
(a) (b)Figure 6.1: SEM micrographs of (a) cryogenically and (b) ambient Ground crumb rubber at 30x
magnification
Elemental composition was seen to vary slightly from source to source, however
of the major constituents of the crumb rubber, the only element to vary significantly was
the oxygen in Source 4 crumb rubber. This lower oxygen content may be indicative of a
significant presence of truck tire in this source of crumb rubber (Ucar et al., 2005).
Results indicate that the amounts of carbon were similar regardless of the grinding
procedure; however, oxygen levels in the cryogenically ground particles were found to be
statistically greater than those in the ambient ground particles (Figure 6.2).
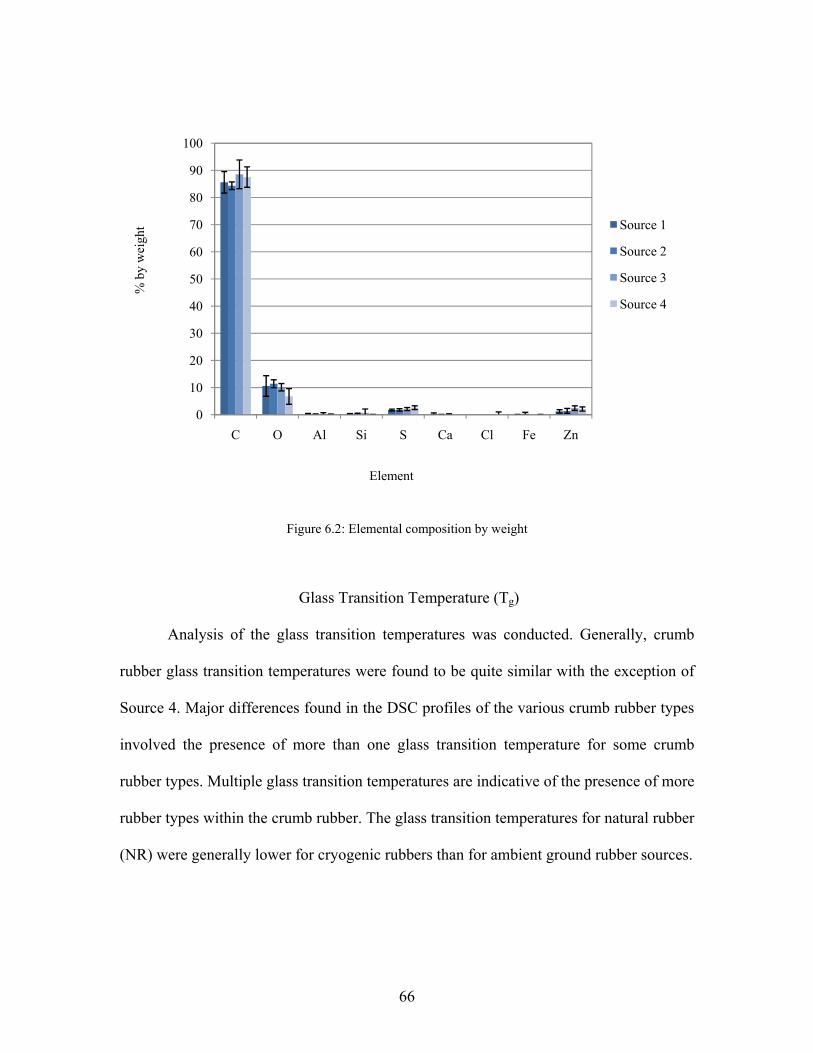
66
Figure 6.2: Elemental composition by weight
Glass Transition Temperature (Tg)
Analysis of the glass transition temperatures was conducted. Generally, crumb
rubber glass transition temperatures were found to be quite similar with the exception of
Source 4. Major differences found in the DSC profiles of the various crumb rubber types
involved the presence of more than one glass transition temperature for some crumb
rubber types. Multiple glass transition temperatures are indicative of the presence of more
rubber types within the crumb rubber. The glass transition temperatures for natural rubber
(NR) were generally lower for cryogenic rubbers than for ambient ground rubber sources.
0
10
20
30
40
50
60
70
80
90
100
C O Al Si S Ca Cl Fe Zn
% b
y w
eigh
t
Element
Source 1
Source 2
Source 3
Source 4
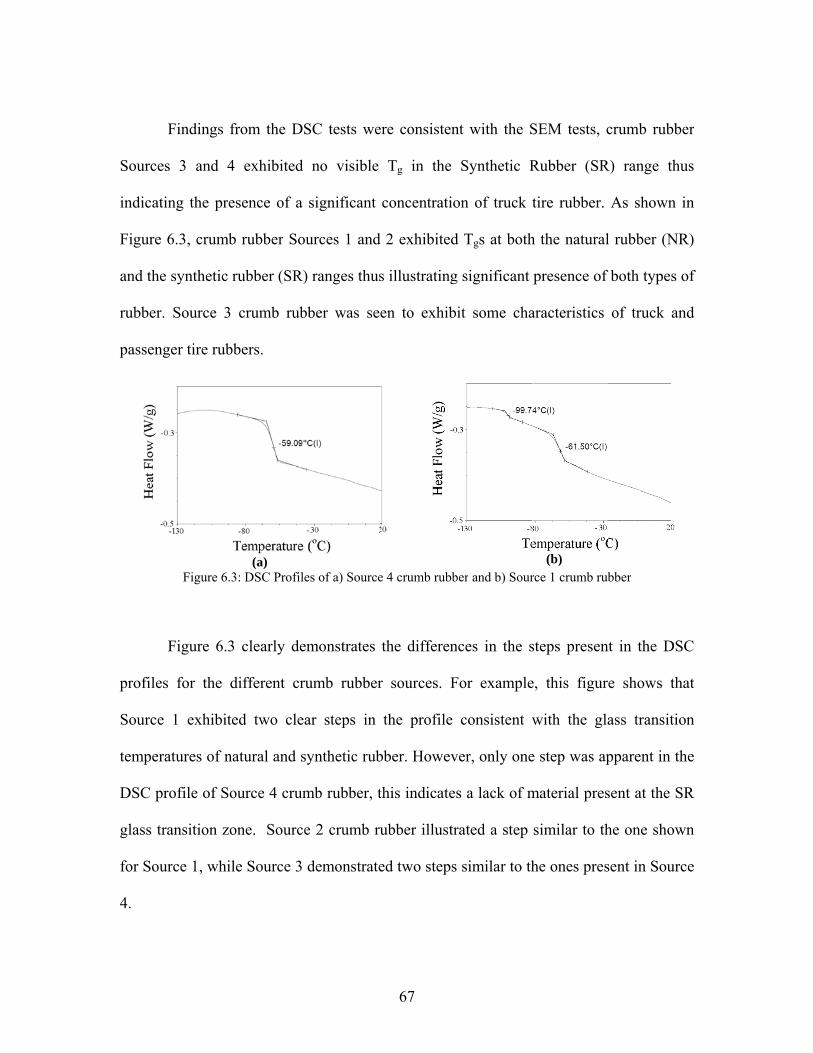
Sourc
indic
Figur
and th
rubbe
passe
profil
Sourc
temp
DSC
glass
for So
4.
Findings
ces 3 and 4
ating the pr
re 6.3, crum
he synthetic
er. Source 3
enger tire rub
Figure 6
Figure 6.
les for the
ce 1 exhibit
eratures of n
profile of S
transition z
ource 1, whi
from the DS
4 exhibited
esence of a
mb rubber So
rubber (SR)
3 crumb rub
bbers.
(a) .3: DSC Profil
3 clearly de
different cr
ted two cle
natural and s
Source 4 crum
zone. Source
ile Source 3
SC tests we
no visible
significant
ources 1 and
) ranges thus
bber was se
es of a) Source
emonstrates
rumb rubber
ar steps in
synthetic rub
mb rubber, t
e 2 crumb ru
demonstrate
67
ere consisten
Tg in the
concentratio
d 2 exhibited
s illustrating
en to exhib
e 4 crumb rubb
the differen
r sources. F
the profile
bber. Howev
this indicate
ubber illustr
ed two steps
nt with the S
Synthetic R
on of truck t
d Tgs at both
g significant
it some cha
ber and b) Sour
nces in the s
For example
consistent w
ver, only one
s a lack of m
rated a step
s similar to th
SEM tests, c
Rubber (SR
tire rubber.
h the natural
presence of
aracteristics
(b) rce 1 crumb rub
steps presen
e, this figur
with the gla
e step was ap
material pres
similar to th
he ones pres
crumb rubbe
R) range thu
As shown i
l rubber (NR
both types o
of truck an
bber
t in the DSC
e shows tha
ass transitio
pparent in th
sent at the SR
he one show
sent in Sourc
er
us
in
R)
of
nd
C
at
on
he
R
wn
ce
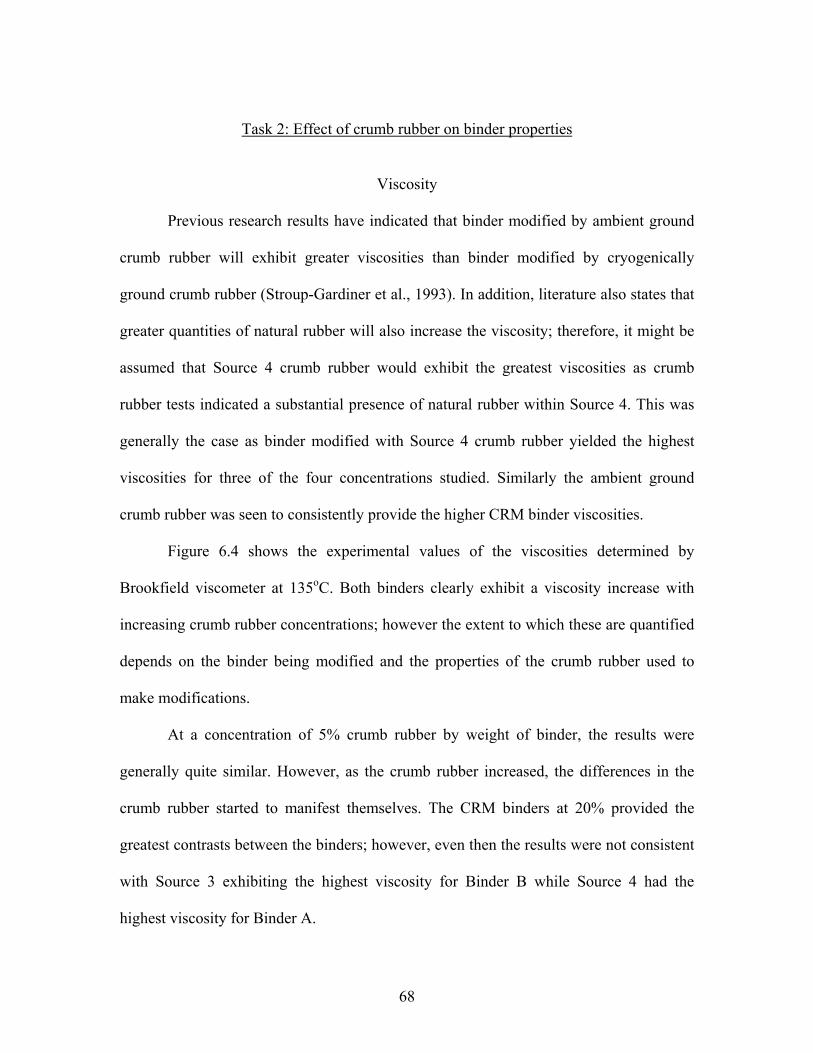
68
Task 2: Effect of crumb rubber on binder properties
Viscosity
Previous research results have indicated that binder modified by ambient ground
crumb rubber will exhibit greater viscosities than binder modified by cryogenically
ground crumb rubber (Stroup-Gardiner et al., 1993). In addition, literature also states that
greater quantities of natural rubber will also increase the viscosity; therefore, it might be
assumed that Source 4 crumb rubber would exhibit the greatest viscosities as crumb
rubber tests indicated a substantial presence of natural rubber within Source 4. This was
generally the case as binder modified with Source 4 crumb rubber yielded the highest
viscosities for three of the four concentrations studied. Similarly the ambient ground
crumb rubber was seen to consistently provide the higher CRM binder viscosities.
Figure 6.4 shows the experimental values of the viscosities determined by
Brookfield viscometer at 135oC. Both binders clearly exhibit a viscosity increase with
increasing crumb rubber concentrations; however the extent to which these are quantified
depends on the binder being modified and the properties of the crumb rubber used to
make modifications.
At a concentration of 5% crumb rubber by weight of binder, the results were
generally quite similar. However, as the crumb rubber increased, the differences in the
crumb rubber started to manifest themselves. The CRM binders at 20% provided the
greatest contrasts between the binders; however, even then the results were not consistent
with Source 3 exhibiting the highest viscosity for Binder B while Source 4 had the
highest viscosity for Binder A.
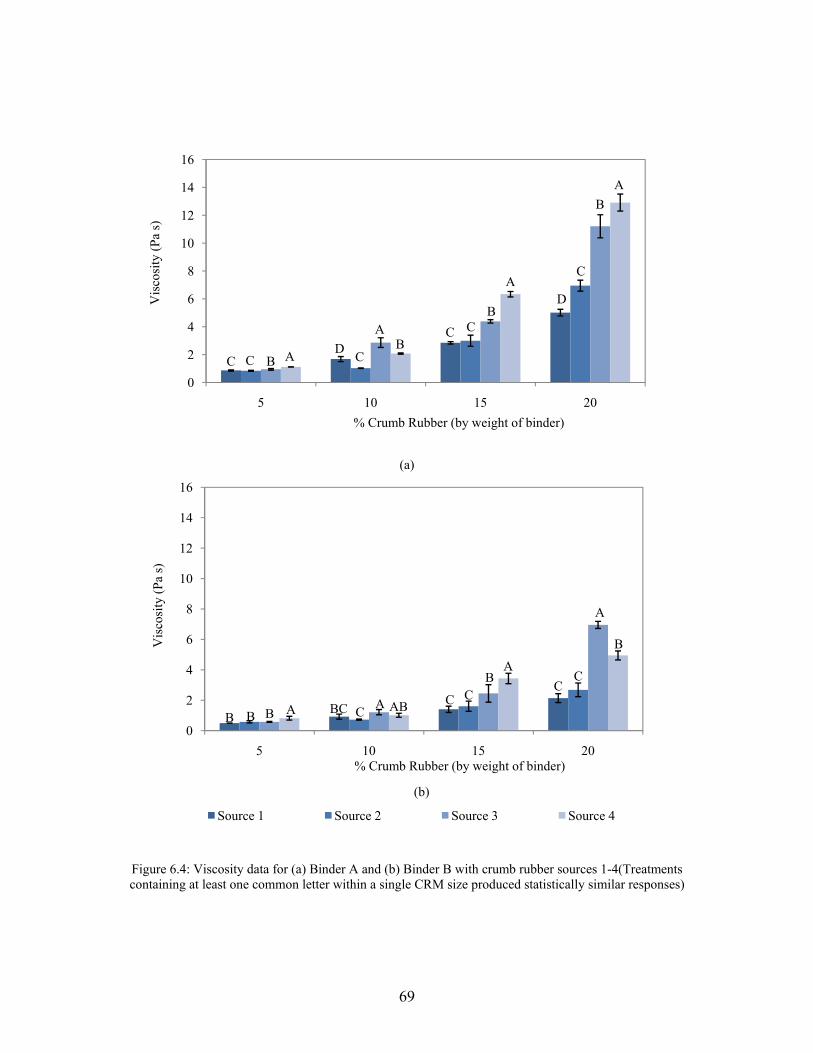
69
(a)
Figure 6.4: Viscosity data for (a) Binder A and (b) Binder B with crumb rubber sources 1-4(Treatments containing at least one common letter within a single CRM size produced statistically similar responses)
0
2
4
6
8
10
12
14
16
5 10 15 20
Vis
cosi
ty (P
a s)
% Crumb Rubber (by weight of binder)
C BDA C
AB
CCB
AC
D
AB
C
0
2
4
6
8
10
12
14
16
5 10 15 20
Vis
cosi
ty (P
a s)
% Crumb Rubber (by weight of binder)
Source 1 Source 2 Source 3 Source 4
A
B
C
AB B BA ABBC C
AB
C CC
(b)
70
When examining the binder viscosities using grinding procedure as a blocking
factor, the importance of grinding procedure was confirmed for determination of viscous
properties of the CRM binder. Binder source, in this limited study, played a key role in
dictating the viscous properties of the CRM binder; when binder source was used as a
blocking factor, statistical differences were noted for every crumb rubber concentration.
When the crumb rubber concentration was used as a blocking factor, the relative
effects of the various crumb rubber sources could be analyzed. From Figure 6.4, it can be
seen that Source 4 crumb rubber consistently exhibited higher viscosities regardless of
the binder source. When the grinding procedures were compared, the ambient ground
crumb rubber samples yielded statistically significant higher viscosities regardless of the
crumb rubber concentration. This suggests that the morphology of the crumb rubber plays
an important role in the viscous performance of the binder, as the smooth crystalline
particles generated by the cryogenic procedure yielded less viscous binder than their
rougher ambient counterpart. It was concluded that the base binder plays an influential
role in determining the viscosity of the CRM binder, when the binder source was used as
a blocking factor, Binder A consistently had a statistically higher viscosity than Binder B.
Particle and Interaction Effects on Viscosity (PEV & IEV)
Particle Effect and Interaction Effect were determined for viscosity. Doing so
permitted the analysis of interaction and particle effects on binder properties. PEV and
IEV identified as the contribution to the binder viscosity due to the interaction between
crumb rubber and the binder (IEV) and as the effect of the crumb rubber particles as inert
71
filler in the binder (PEV). Precise identification of the contribution of each was necessary
to determine the cause of the change in properties of the CRM binder (Equations (6.1)
and (6.2)).
– Eq. (6.1)
Eq. (6.2)
Where,
IE: Interaction effect
PE: Particle effect
Drained: Drained binder property
Base: Virgin binder property
CRM: CRM binder property
Results indicated that at a crumb rubber concentration of 10%, the interaction
effect for viscosity was statistically consistent regardless of crumb rubber source; this
indicates that at the 10% level the CRM binder effects due to interaction between particle
and binder were independent of the source. Results also indicated that at the 10% level
very small interactions occur regardless of crumb rubber, binder source, or grinding
procedure when viscosity results are considered.
Figure 6.5 illustrates the differences in IE and PE for the two binder Sources (A
and B) when modified with crumb rubbers from four different sources. Clearly, the IE
72
increases significantly as the amount of crumb rubber is increased, thereby suggesting
that any reactions occurring between the crumb rubber and binder are dependent on the
amount of crumb rubber used. The base binder used also appears to play a major role on
the development of the IE as the interactions were noted to be consistently higher for
Binder A than Binder B.
As shown in Figure 6.5, the PE clearly increases as the crumb rubber
concentration increases, thus suggesting that the effect of the particle in the binder matrix
is magnified as the number of particles increases. At 10% crumb rubber, there appears to
be some variation between binder and crumb rubber sources. However, these differences
are more apparent when the 20% crumb rubber concentration is studied. At 20% rate, the
ambient ground crumb rubber sources yielded the highest PEs, furthermore the base
Binder A also tended to exhibit higher PEs than Binder B. These findings suggest that the
ability of the particle as an inert filler in the binder matrix to modify the asphalt
properties is highly dependent on the base binder viscosity as well as the morphological
properties of the crumb rubber.
Emphasis must be placed on the fact that PE was generally 12 times greater than
the IE, thereby suggesting that the bulk of the viscous effects due to the presence of
crumb rubber in the binders were attributed to the effects of the crumb rubber as inert
filler. The grinding procedure was seen to consistently affect the properties of the binders
where the ambient ground binders were generally seen to demonstrate the highest
viscosity.
73
Source 4 crumb rubber consistently produced the most viscous binder; crumb
rubber testing also indicated that this rubber source contained a significant portion of
truck tire crumb rubber. Therefore, it appears that the source of tire used as a modifier
plays some role in the viscosity of the modified binder. It is unclear whether this is due to
chemical differences in tire source, and thus interaction between tire and binder. Tire
composition and properties depend on tire grade, age, and manufacturer (Kyari et al.,
2005), differences in natural and synthetic rubber content in tire sources may contribute
to different particle morphology, such as surface area of the particles. Tire compounds
exhibit differing properties with respect to aging (oil resistance, sunlight aging, and
oxidation) and physical distresses (abrasion resistance, tear resistance, and maximum
tensile strength); therefore, variability in these may contribute to varied particle
morphologies thus resulting in varied CRM binder properties.
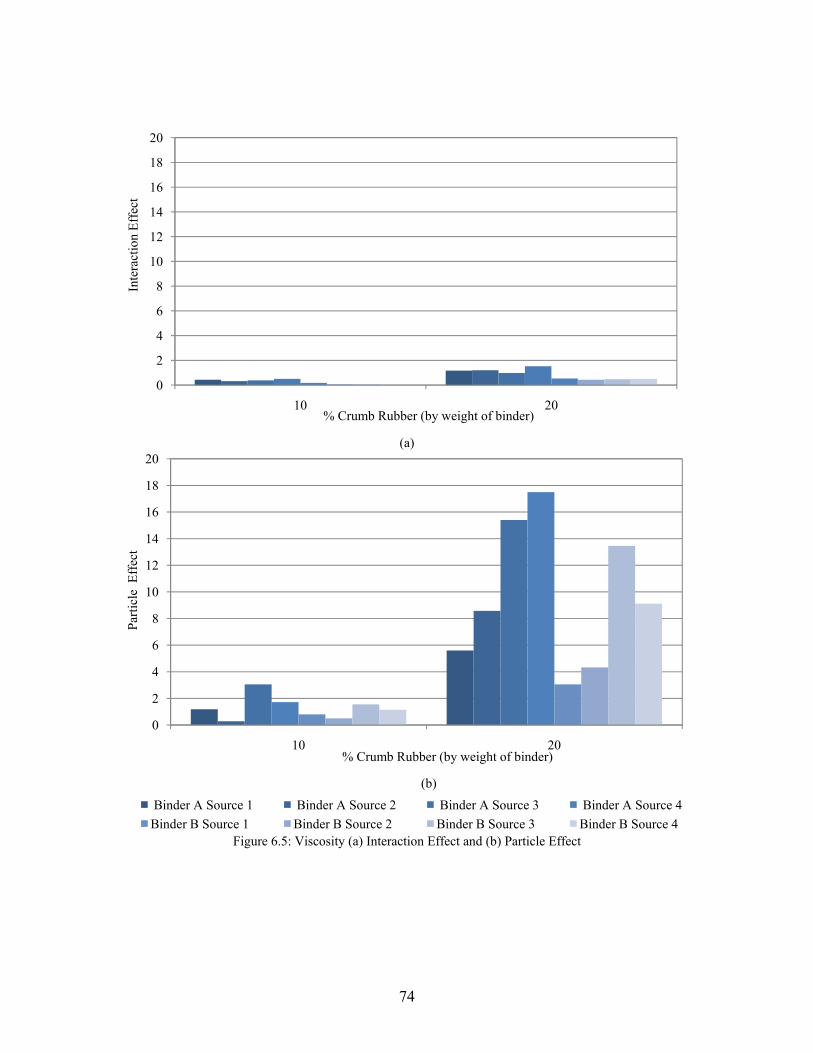
74
(a)
Figure 6.5: Viscosity (a) Interaction Effect and (b) Particle Effect
0
2
4
6
8
10
12
14
16
18
20
10 20
Inte
ract
ion
Effe
ct
% Crumb Rubber (by weight of binder)
0
2
4
6
8
10
12
14
16
18
20
10 20
Parti
cle
Eff
ect
% Crumb Rubber (by weight of binder)
Binder A Source 1 Binder A Source 2 Binder A Source 3 Binder A Source 4Binder B Source 1 Binder B Source 2 Binder B Source 3 Binder B Source 4
(b)
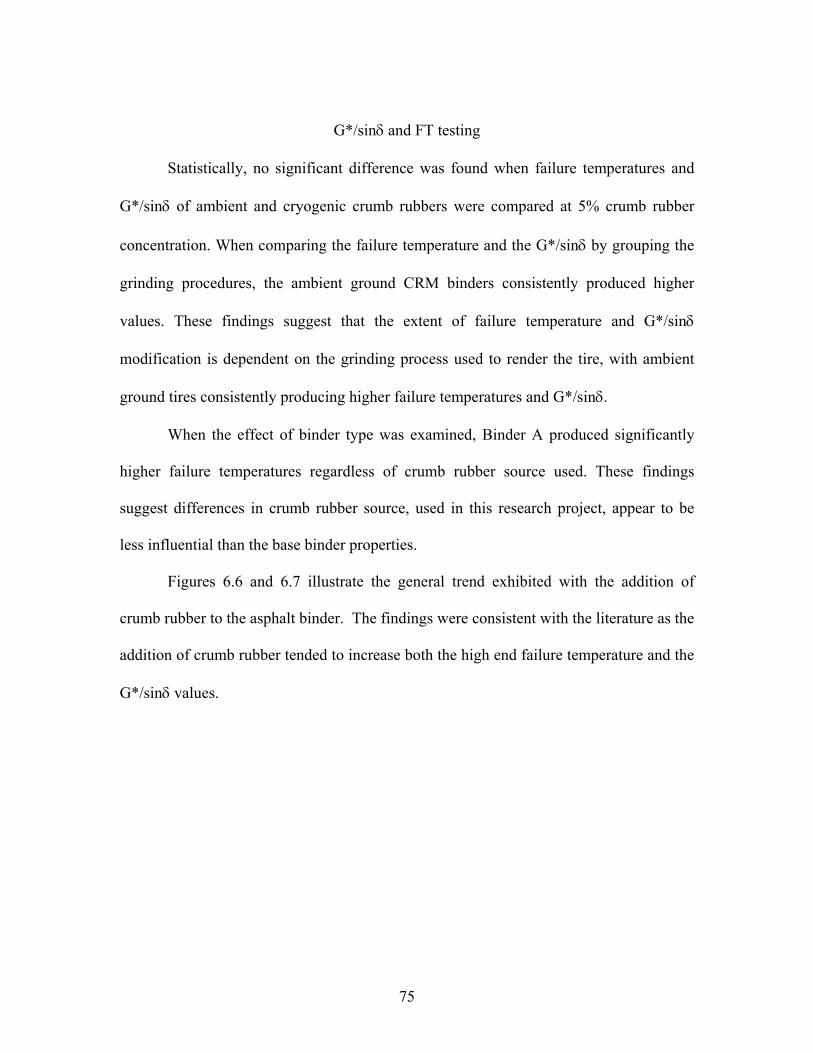
75
G*/sinδ and FT testing
Statistically, no significant difference was found when failure temperatures and
G*/sinδ of ambient and cryogenic crumb rubbers were compared at 5% crumb rubber
concentration. When comparing the failure temperature and the G*/sinδ by grouping the
grinding procedures, the ambient ground CRM binders consistently produced higher
values. These findings suggest that the extent of failure temperature and G*/sinδ
modification is dependent on the grinding process used to render the tire, with ambient
ground tires consistently producing higher failure temperatures and G*/sinδ.
When the effect of binder type was examined, Binder A produced significantly
higher failure temperatures regardless of crumb rubber source used. These findings
suggest differences in crumb rubber source, used in this research project, appear to be
less influential than the base binder properties.
Figures 6.6 and 6.7 illustrate the general trend exhibited with the addition of
crumb rubber to the asphalt binder. The findings were consistent with the literature as the
addition of crumb rubber tended to increase both the high end failure temperature and the
G*/sinδ values.
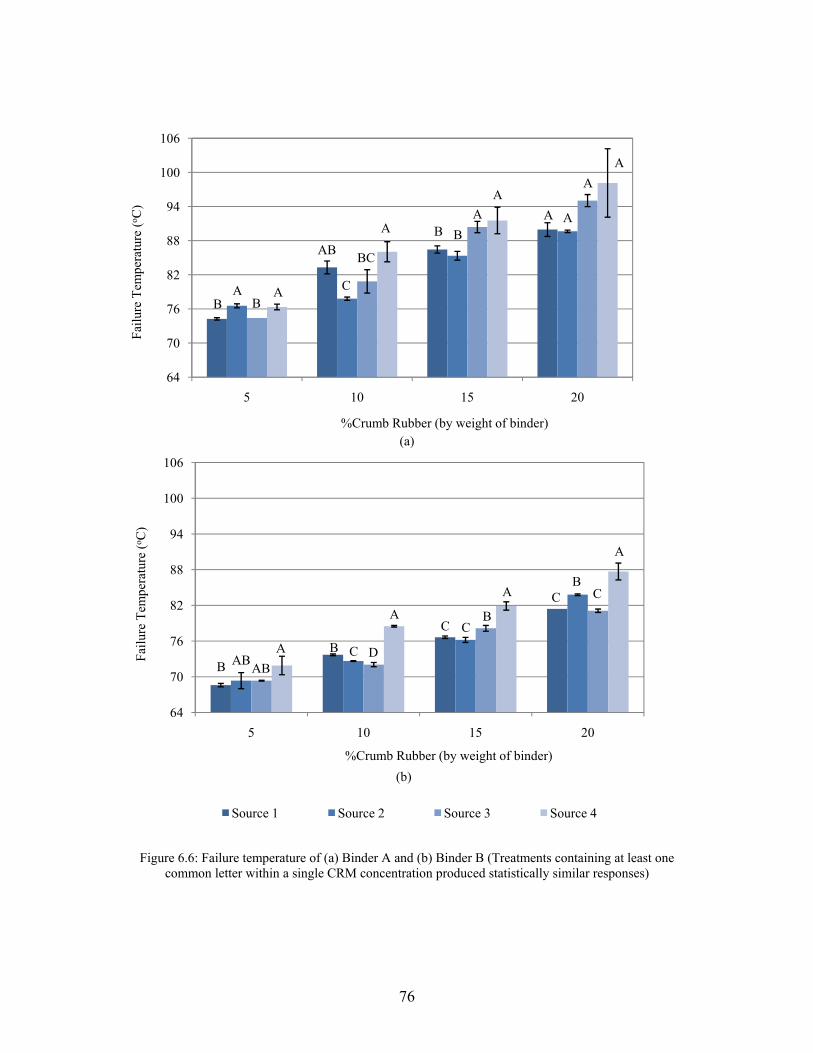
76
(a)
Figure 6.6: Failure temperature of (a) Binder A and (b) Binder B (Treatments containing at least one
common letter within a single CRM concentration produced statistically similar responses)
64
70
76
82
88
94
100
106
5 10 15 20
Failu
re T
empe
ratu
re (o C
)
%Crumb Rubber (by weight of binder)
A
BA A
B
AB BC
C
AA
BB
A
A A
A
64
70
76
82
88
94
100
106
5 10 15 20
Failu
re T
empe
ratu
re (o C
)
%Crumb Rubber (by weight of binder)
Source 1 Source 2 Source 3 Source 4
(b)
B ABABA B C D
A
A
BCC
A
C CB
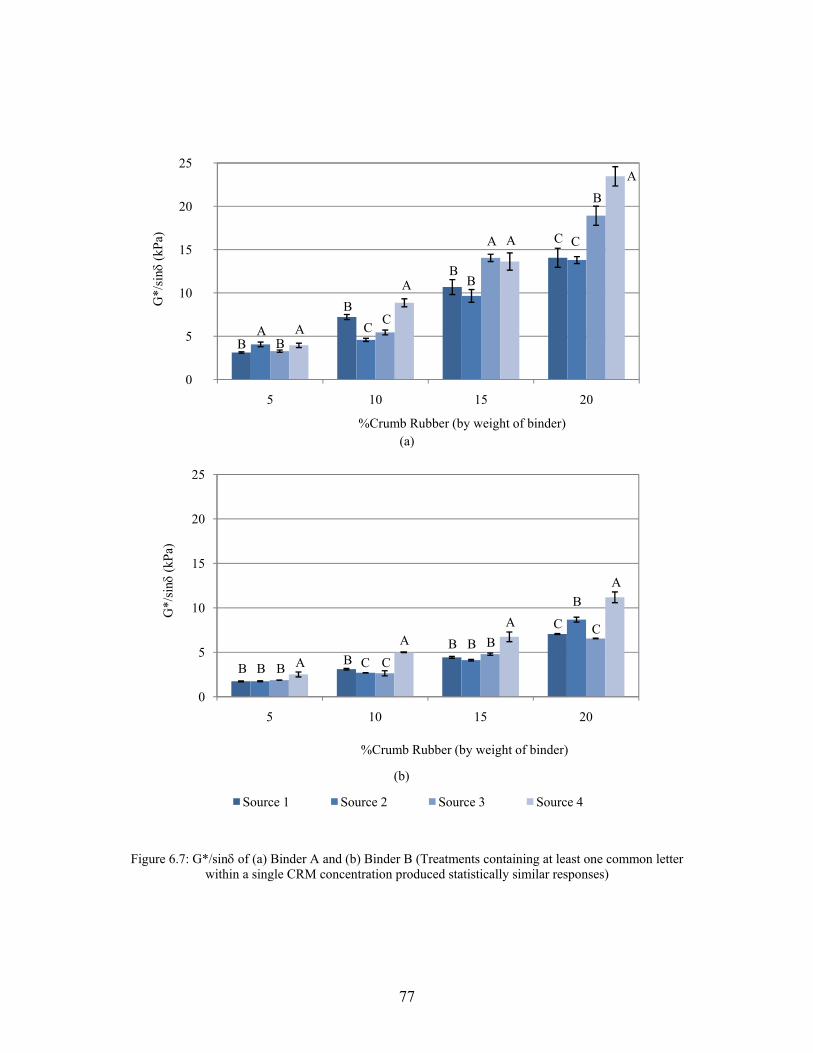
77
(a)
Figure 6.7: G*/sinδ of (a) Binder A and (b) Binder B (Treatments containing at least one common letter
within a single CRM concentration produced statistically similar responses)
0
5
10
15
20
25
5 10 15 20
G*/
sinδ
(kPa
)
%Crumb Rubber (by weight of binder)
B B
B
BB
B
A A
A
A A
A
CC
CC
0
5
10
15
20
25
5 10 15 20
G*/
sinδ
(kPa
)
%Crumb Rubber (by weight of binder)
Source 1 Source 2 Source 3 Source 4
(b)
C C
C C
A
AA
A
B BBB
B BB
B
78
As shown in Figures 6.6 and 6.7, modified binders made with Source 4 crumb
rubber yielded the highest failure temperatures and G*/sinδ regardless of concentration,
such findings suggest that ambient ground truck tire rubber yielded the highest failure
temperatures and G*/sinδ. The results of modified binders made with Source 3 crumb
rubber (ambient) were insufficient to conclude that this crumb rubber source produced
results which are significantly different from the two cryogenic crumb rubbers studied.
Particle Effect (PE) and Interaction Effect (IE) on G*/sinδ and Failure Temperature
The PE and IE on failure temperature and G*/sinδ values were calculated.
Precise identification of the contribution of each was necessary to determine the cause of
the change in properties of the CRM binder. Figures 6.8 and 6.9 illustrate the differences
in IE for the two binder types (A and B) when modified with crumb rubbers from 4
different sources. The IE and PE increase significantly as the amount of crumb rubber is
increased, thereby suggesting that any reactions occurring between the crumb rubber and
the binders are dependent on the amount of crumb rubber used.
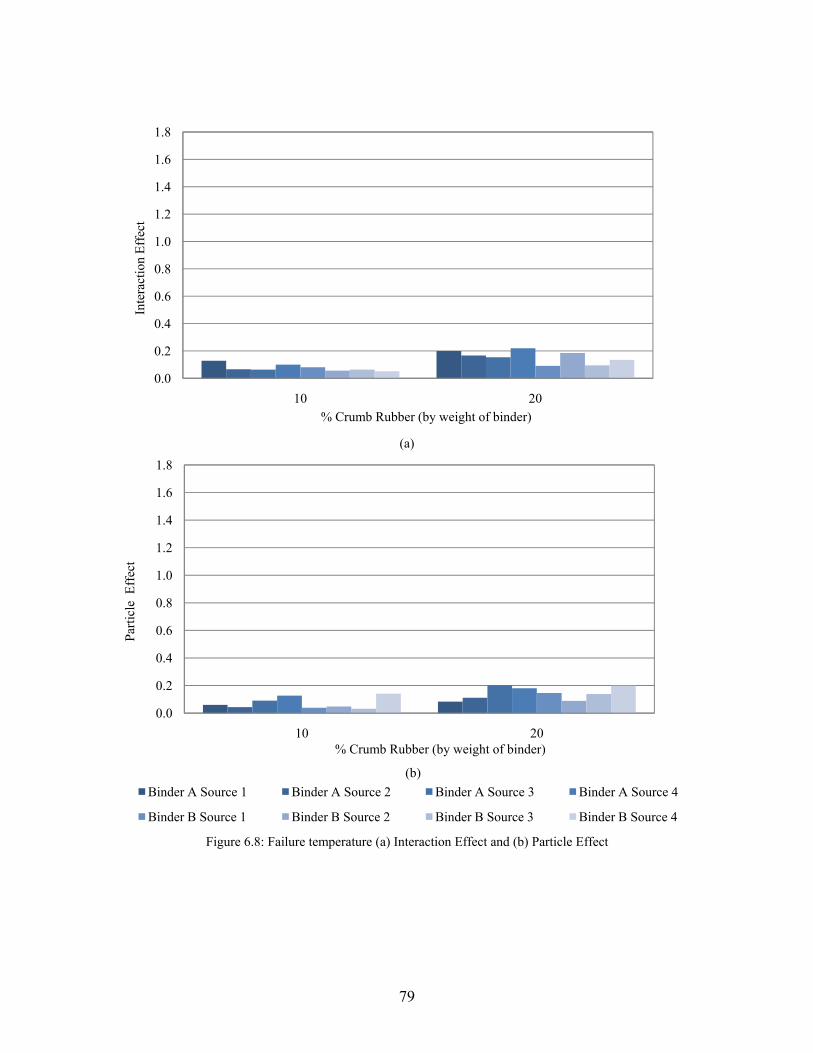
79
(a)
Figure 6.8: Failure temperature (a) Interaction Effect and (b) Particle Effect
0.0
0.2
0.4
0.6
0.8
1.0
1.2
1.4
1.6
1.8
10 20
Inte
ract
ion
Effe
ct
% Crumb Rubber (by weight of binder)
0.0
0.2
0.4
0.6
0.8
1.0
1.2
1.4
1.6
1.8
10 20
Parti
cle
Eff
ect
% Crumb Rubber (by weight of binder)
Binder A Source 1 Binder A Source 2 Binder A Source 3 Binder A Source 4
Binder B Source 1 Binder B Source 2 Binder B Source 3 Binder B Source 4
(b)
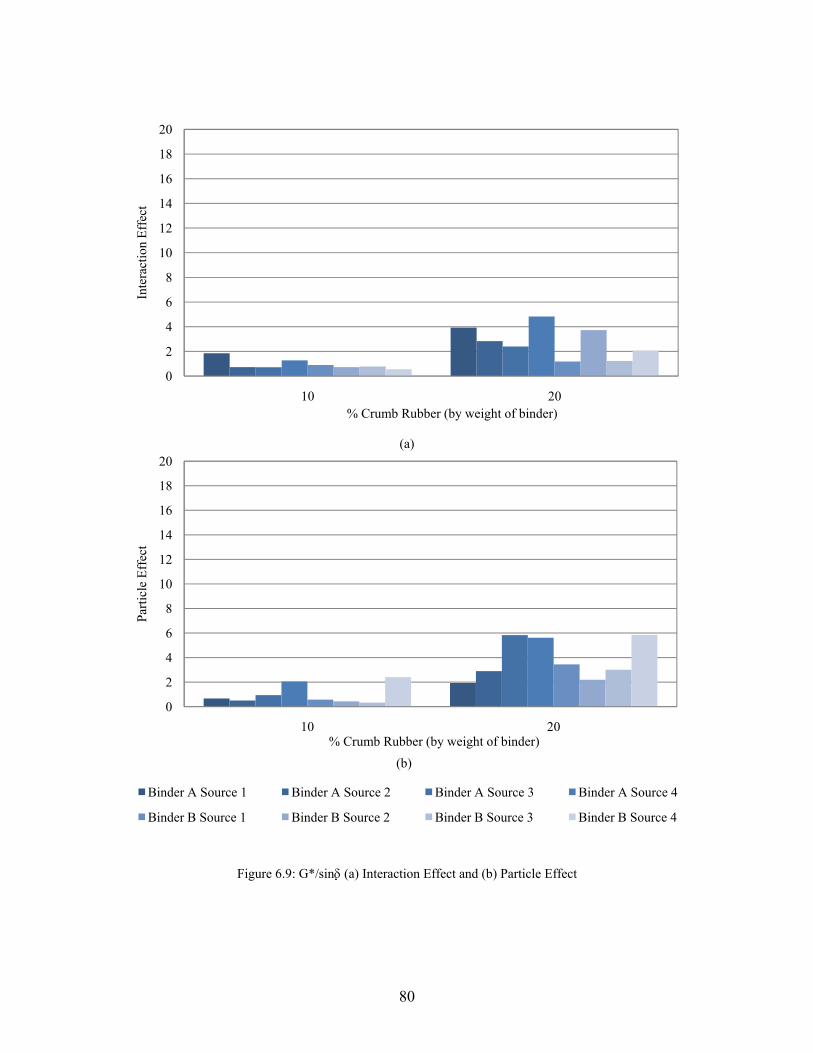
80
(a)
Figure 6.9: G*/sinδ (a) Interaction Effect and (b) Particle Effect
0
2
4
6
8
10
12
14
16
18
20
10 20
Inte
ract
ion
Effe
ct
% Crumb Rubber (by weight of binder)
0
2
4
6
8
10
12
14
16
18
20
10 20
Parti
cle
Effe
ct
% Crumb Rubber (by weight of binder)
Binder A Source 1 Binder A Source 2 Binder A Source 3 Binder A Source 4
Binder B Source 1 Binder B Source 2 Binder B Source 3 Binder B Source 4
(b)
81
When the results were analyzed by grinding procedures, the IEs were generally
quite consistent for both ambient and cryogenic crumb rubbers (at similar crumb rubber
concentrations). This behavior was unexpected as the literature suggests that crumb
rubber produced by the ambient procedure produces crumb rubber with larger surface
areas than those produced cryogenically. Finer crumb rubbers, in general, provide a
larger surface area for chemical interactions to occur, therefore, it was expected that as
surface area increased, the interaction effect would follow suit. This suggests that the
interaction effect between crumb rubber particles and binder is independent of the surface
morphology.
When the PEs were compared by the grinding procedure, the crumb rubbers
produced using the ambient procedure resulted in higher values than the one produced
cryogenically. As expected such results suggest that the PE is influenced by the particle
morphology. Such findings indicate that emphasis should be placed on the grinding
procedure rather than the tire composition. Tire composition does appear to play a role in
the development of G*/sinδ and failure temperature values, however this role appears to
be within the context of the particle effect.
The analysis of the interaction and particle effects produced some unexpected
results. Of particular note were the inconsistencies in the PE and IE for CRM binder
modified with Source 1 crumb rubber. Figures 6.8 and 6.9 show that at 20% crumb
rubber by weight of binder Source 1 crumb rubber produced a high IE and a low PE
when reacted with Binder A. However, when Binder B was reacted with the same crumb
rubber source, it produced a low IE and a high PE. This suggests that the effect of crumb
82
rubber is dependent on the base binder properties, by examining the IE and PE it is
evident that the same crumb rubber source might have different effect on different binder
types exhibiting the same performance grade and similar base viscosities.
These findings reinforce the conclusion that little interaction effects are taking
place, as reported by others (Putman, 2005). In the event of interactions between binder
and crumb rubber, it would be natural to assume that ambient crumb rubber would
produce greater interaction effects as ambient particles provide a greater surface area. It
was also seen that as the crumb rubber concentration increased, the differences between
the various CRM binders became more pronounced, this reinforces the conclusion that
binder modification is dependent on the crumb rubber concentration.
Task 3: Viscosity model results
Equation (6.3) describes the resulting estimated equation using SAS:
, , 211.8 . Eq. (6.3) With the standard error of A and β found to be 28.4084 and 0.00096. Equation (6.3) was
used to predict values of viscosity for an array of binder and temperature combinations.
Upper and lower prediction intervals, were also estimated from Equation (6.3). The
predicted values and the prediction intervals were plotted along with the actual values.
Whenever the actual values fell within the prediction intervals, the predictions based on
the model were considered to be accurate. Analysis of the model showed that 94% of the
time the actual values fell within the prediction intervals.
83
While R2 is a popular method of determining the goodness of fit of a model, it
does not provide an indication of the range of accuracy of the model. Therefore, 95%
confidence intervals were used as a method of determining the accuracy of the model, as
well as to provide the user an indication of the accuracy of the model. An additional
benefit of using the 95% confidence interval is that if used properly the confidence
interval allows the user to incorporate a factor of safety into the predicted value. For
viscosity values it is conservative to use the upper 95% confidence interval value when
making predictions, doing this provides a value that is slightly higher than the actual
value. However, it is sufficiently accurate to provide an indication of the viscosity, while
also reducing the risk of exceeding the upper confidence interval to 2.5%.
Values for the Rcv were calculated and are summarized in Tables 6.1 and 6.2. As
seen in these tables, statistically significant differences are present depending on the
binder source and grinding procedure. The highest Rcv was exhibited by the Russian
binder source; it is thought that this elevated Rcv is due to the high shear mixing
procedure and higher temperature used during reaction, rather than unique crumb rubber
and binder properties. This is likely the case as the Russian binder, whose viscosity was
similar to the other binders tested, was modified with ambient crumb rubber. For the
remaining binders, the Rcv values tended to decrease with decreasing virgin viscosity,
thus suggesting that as the virgin binder viscosity decreases so too does the
corresponding CRM binder viscosity.
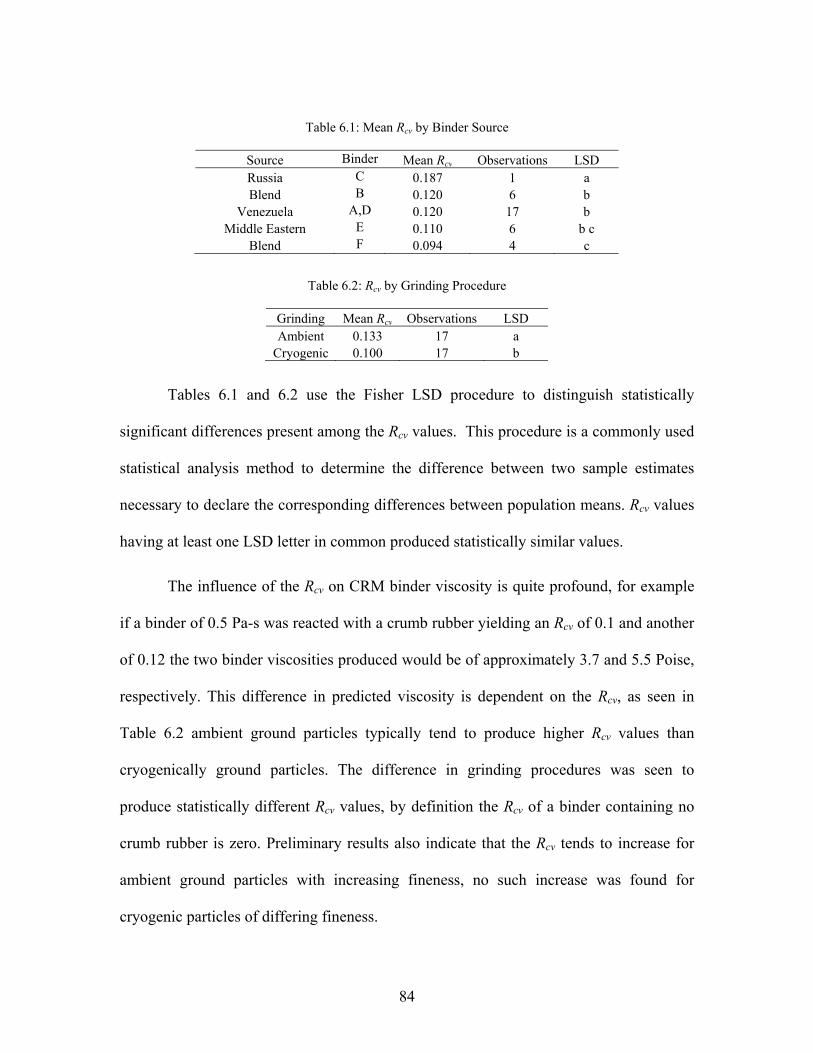
84
Table 6.1: Mean Rcv by Binder Source
Source Binder Mean Rcv Observations LSD Russia C 0.187 1 a Blend B 0.120 6 b
Venezuela A,D 0.120 17 b Middle Eastern E 0.110 6 b c
Blend F 0.094 4 c
Table 6.2: Rcv by Grinding Procedure
Grinding Mean Rcv Observations LSD Ambient 0.133 17 a
Cryogenic 0.100 17 b
Tables 6.1 and 6.2 use the Fisher LSD procedure to distinguish statistically
significant differences present among the Rcv values. This procedure is a commonly used
statistical analysis method to determine the difference between two sample estimates
necessary to declare the corresponding differences between population means. Rcv values
having at least one LSD letter in common produced statistically similar values.
The influence of the Rcv on CRM binder viscosity is quite profound, for example
if a binder of 0.5 Pa-s was reacted with a crumb rubber yielding an Rcv of 0.1 and another
of 0.12 the two binder viscosities produced would be of approximately 3.7 and 5.5 Poise,
respectively. This difference in predicted viscosity is dependent on the Rcv, as seen in
Table 6.2 ambient ground particles typically tend to produce higher Rcv values than
cryogenically ground particles. The difference in grinding procedures was seen to
produce statistically different Rcv values, by definition the Rcv of a binder containing no
crumb rubber is zero. Preliminary results also indicate that the Rcv tends to increase for
ambient ground particles with increasing fineness, no such increase was found for
cryogenic particles of differing fineness.
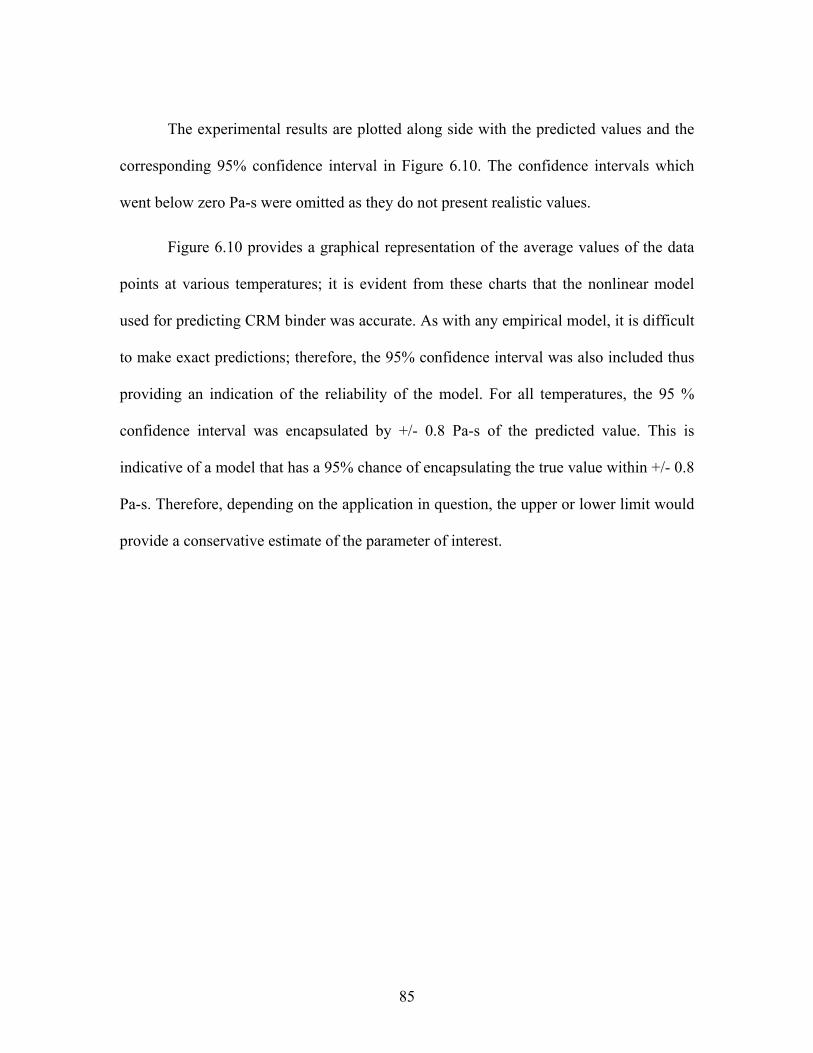
85
The experimental results are plotted along side with the predicted values and the
corresponding 95% confidence interval in Figure 6.10. The confidence intervals which
went below zero Pa-s were omitted as they do not present realistic values.
Figure 6.10 provides a graphical representation of the average values of the data
points at various temperatures; it is evident from these charts that the nonlinear model
used for predicting CRM binder was accurate. As with any empirical model, it is difficult
to make exact predictions; therefore, the 95% confidence interval was also included thus
providing an indication of the reliability of the model. For all temperatures, the 95 %
confidence interval was encapsulated by +/- 0.8 Pa-s of the predicted value. This is
indicative of a model that has a 95% chance of encapsulating the true value within +/- 0.8
Pa-s. Therefore, depending on the application in question, the upper or lower limit would
provide a conservative estimate of the parameter of interest.
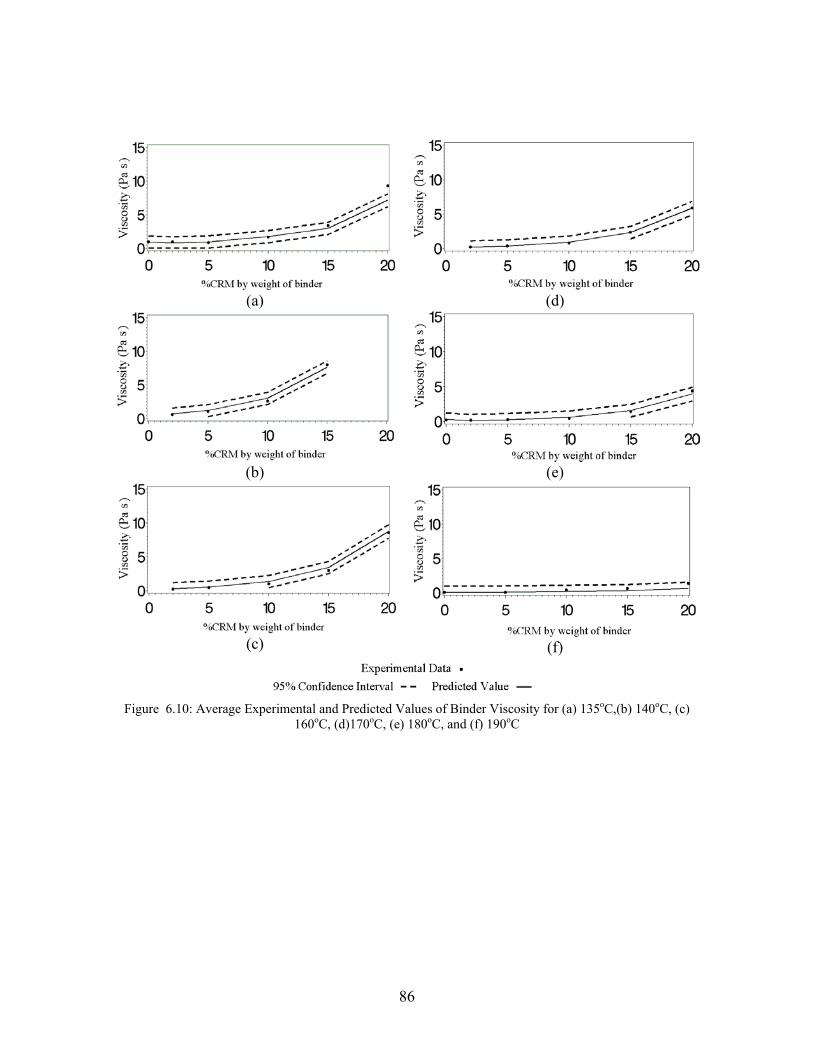
86
(a) (d)
(b) (e)
(c)
(f)
Figure 6.10: Average Experimental and Predicted Values of Binder Viscosity for (a) 135oC,(b) 140oC, (c) 160oC, (d)170oC, (e) 180oC, and (f) 190oC
87
The upper confidence interval is particularly useful as it provides a conservative
estimate of the maximum viscosity achieved with a specific crumb rubber at a given
temperature. It is of note that Figure 6.10 is not representative of any one single binder or
crumb rubber type, rather it is a summary of the data used in this particular study.
Therefore, they should not be compared to one another as the binders are not all of the
same source or grade. The value of these figures lies in their representation of the average
estimated value of the binder viscosity against the average value of the experimental
viscosities. The drawbacks of using such a method are apparent when examining the
predicted viscosity at 20% crumb rubber at 135oC. This is the only case where the
average experimental value fell outside the prediction interval, this is due to the
increasing variability of binder viscosities with increasing crumb rubber concentrations as
temperature decreases. The effects of the different virgin binder and crumb rubber types
are more pronounced at lower temperatures given the increased viscosity of asphalt at
lower temperatures.
Task 4: G*/sinδ and FT Model Results
In this section, the experimental results are compared to the predicted values
using the G*/sinδ model and the high end failure temperature model. Of interest in this
section was the ability of the 95% confidence interval to capture the experimental values
without creating excessively large intervals. Also presented in this section are the various
Rcg values, these values are compared by base binder, grinding procedure, and crumb
rubber source.
88
G*/sinδ model
Using SAS, the values for K and φ were determined to be 837.8 and -0.1047
respectively. The resulting estimated relationship is given by Equation (6.4):
, ,837.8 . Eq. (6.4)
The standard error of K and φ were found to be 90.2 and 0.002, respectively. Equation
(6.4) was used to predict values of G*/sinδ for an array of binder and temperature
combinations. Upper and lower prediction intervals were also estimated from Equation
(6.4). The predicted values and the prediction intervals were plotted along with the
actual values. Whenever the actual values fell within the prediction intervals, the
predictions based on the model were considered to be accurate. Analysis of the model
showed that 92.6% of the time the actual values fell within the prediction intervals.
Figure 6.11 illustrates the increase in G*/sinδ values as crumb rubber content
increases. In addition, this figure illustrates the accuracy of the model in predicting the
CRM binder properties. Experimental results show that as crumb rubber concentration is
increased, the G*/sinδ value increases, a decrease in experimental G*/sinδ values is noted
as the temperature increases. At 82 and 88 oC, binders with less than 10% crumb rubber
by weight were seen to not withstand any loading. The average experimental values were
consistently encapsulated by the 95% confidence interval; furthermore the 95%
confidence interval was seen to be approximately +/- 1.3 kPa.
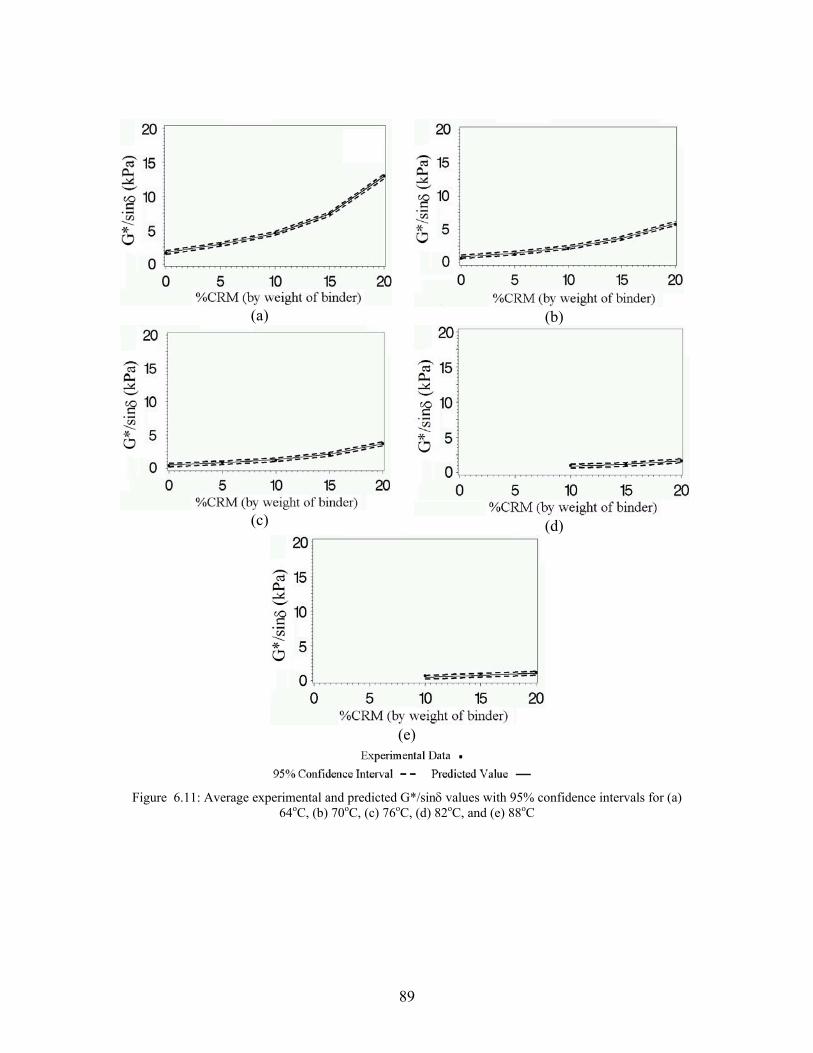
89
(a)
(b)
(c)
(d)
(e)
Figure 6.11: Average experimental and predicted G*/sinδ values with 95% confidence intervals for (a) 64oC, (b) 70oC, (c) 76oC, (d) 82oC, and (e) 88oC
90
Failure Temperature Model
Equation (6.5) is produced by substituting the computed values for K and φ into
Equation (6.4), this relationship provides an idea of how failure temperature (FT) of
CRM binder varies with crumb rubber concentration.
1000
,
837.8
.1047
Eq. (6.5)
A verification of the high end failure temperature model was also performed, as seen in
Figure 6.12 where the average values consistently fell within the 95% confidence
interval. This suggests that the model derived from the combined model was accurate for
the purposes of predicting high end failure temperature given only the virgin G*/sinδ
value and other variables (e.g., ambient/cryogenic and particle size) of the crumb rubber
to be used. The accuracy of this limited model was seen to be good as the 95%
confidence interval was approximately +/- 3oC. Using the 95% confidence interval also
provides a factor of safety in the prediction of the CRM binder failure temperature, using
the lower value from the confidence interval means that the probability of calculating an
inaccurate failure temperature on the high side is less than 2.5%.
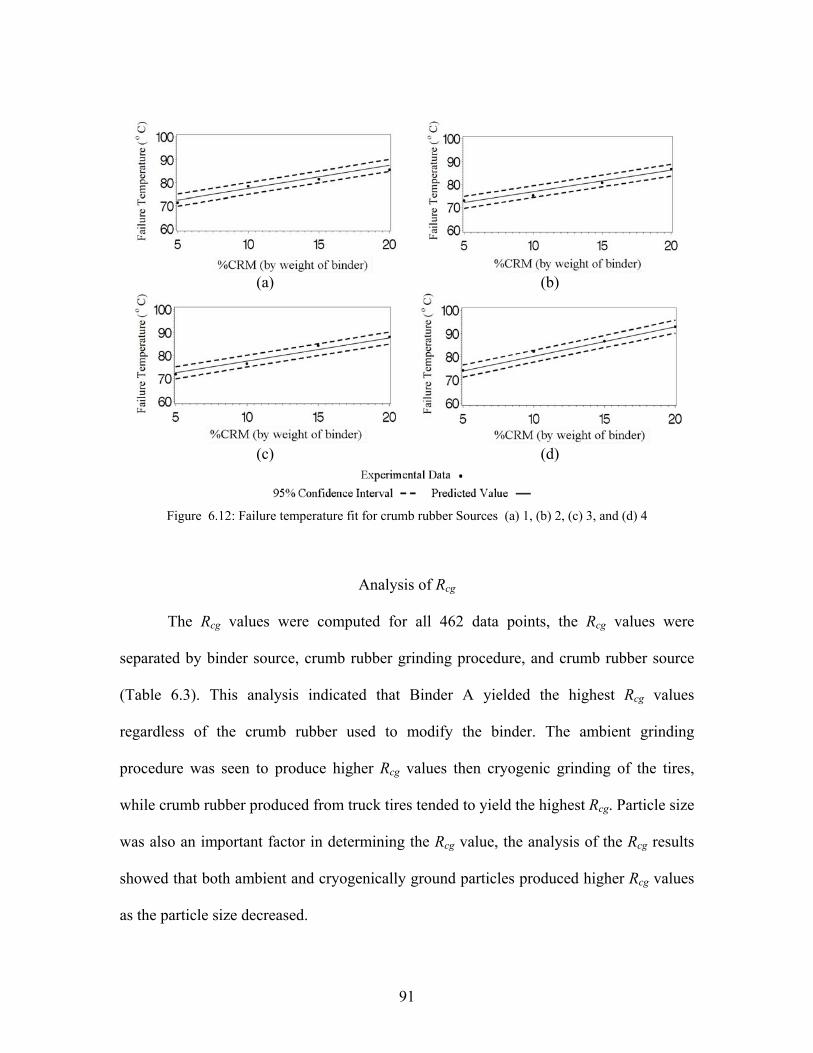
91
(a)
(b)
(c)
(d)
Figure 6.12: Failure temperature fit for crumb rubber Sources (a) 1, (b) 2, (c) 3, and (d) 4
Analysis of Rcg
The Rcg values were computed for all 462 data points, the Rcg values were
separated by binder source, crumb rubber grinding procedure, and crumb rubber source
(Table 6.3). This analysis indicated that Binder A yielded the highest Rcg values
regardless of the crumb rubber used to modify the binder. The ambient grinding
procedure was seen to produce higher Rcg values then cryogenic grinding of the tires,
while crumb rubber produced from truck tires tended to yield the highest Rcg. Particle size
was also an important factor in determining the Rcg value, the analysis of the Rcg results
showed that both ambient and cryogenically ground particles produced higher Rcg values
as the particle size decreased.
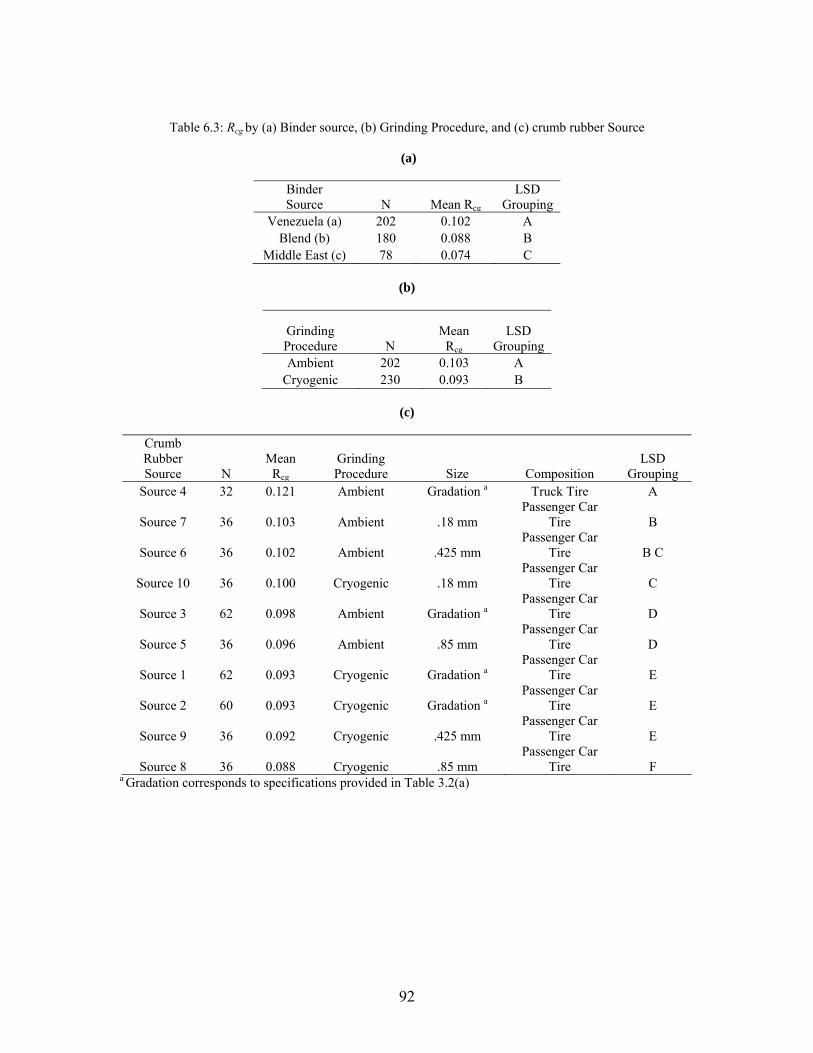
92
Table 6.3: Rcg by (a) Binder source, (b) Grinding Procedure, and (c) crumb rubber Source
(a)
Binder Source N Mean Rcg
LSD Grouping
Venezuela (a) 202 0.102 A Blend (b) 180 0.088 B
Middle East (c) 78 0.074 C
(b)
Grinding Procedure N
Mean Rcg
LSD Grouping
Ambient 202 0.103 A Cryogenic 230 0.093 B
(c)
Crumb Rubber Source N
Mean Rcg
Grinding Procedure Size Composition
LSD Grouping
Source 4 32 0.121 Ambient Gradation a Truck Tire A
Source 7 36 0.103 Ambient .18 mm Passenger Car
Tire B
Source 6 36 0.102 Ambient .425 mm Passenger Car
Tire B C
Source 10 36 0.100 Cryogenic .18 mm Passenger Car
Tire C
Source 3 62 0.098 Ambient Gradation a Passenger Car
Tire D
Source 5 36 0.096 Ambient .85 mm Passenger Car
Tire D
Source 1 62 0.093 Cryogenic Gradation a Passenger Car
Tire E
Source 2 60 0.093 Cryogenic Gradation a Passenger Car
Tire E
Source 9 36 0.092 Cryogenic .425 mm Passenger Car
Tire E
Source 8 36 0.088 Cryogenic .85 mm Passenger Car
Tire F a Gradation corresponds to specifications provided in Table 3.2(a)
93
Many of these results are consistent with the literature where ambient ground
rubber has been known to exert greater changes on the binder (Blumenthal, 1994; Putman
& Amirkhanian, 2006; West et al., 1998), while finer crumb rubber particles have also
been seen to produce CRM binders with greater rutting resistance (Putman, 2005).
Task 5: Universal model results
In this section, the results of the nonlinear regression suitability for the test data
are presented. First, the model coefficients are presented along with a discussion of their
significance. Next, the various models are examined with respect to their ability to
predict the experimental values. In this study, R-squared values are presented as a general
indication of the model fit; the 95% confidence interval, the interval within which there is
a 95% probability of locating the mean, was determined as measure of the variability
captured by the model. Therefore, if the mean values of all the experimental data points
are calculated, then the 95% confidence interval would provide an estimate of the ability
of the model to predict accurate values (Ott & Longnecker, 2001).
Model coefficients
The coefficients produced by conducting the nonlinear regression analysis of the
data using SAS are presented in Table 6.4. These coefficients are specific to the binder
modification, therefore, coefficients are presented for virgin binder, cryogenic CRM
binder, and ambient CRM binder.
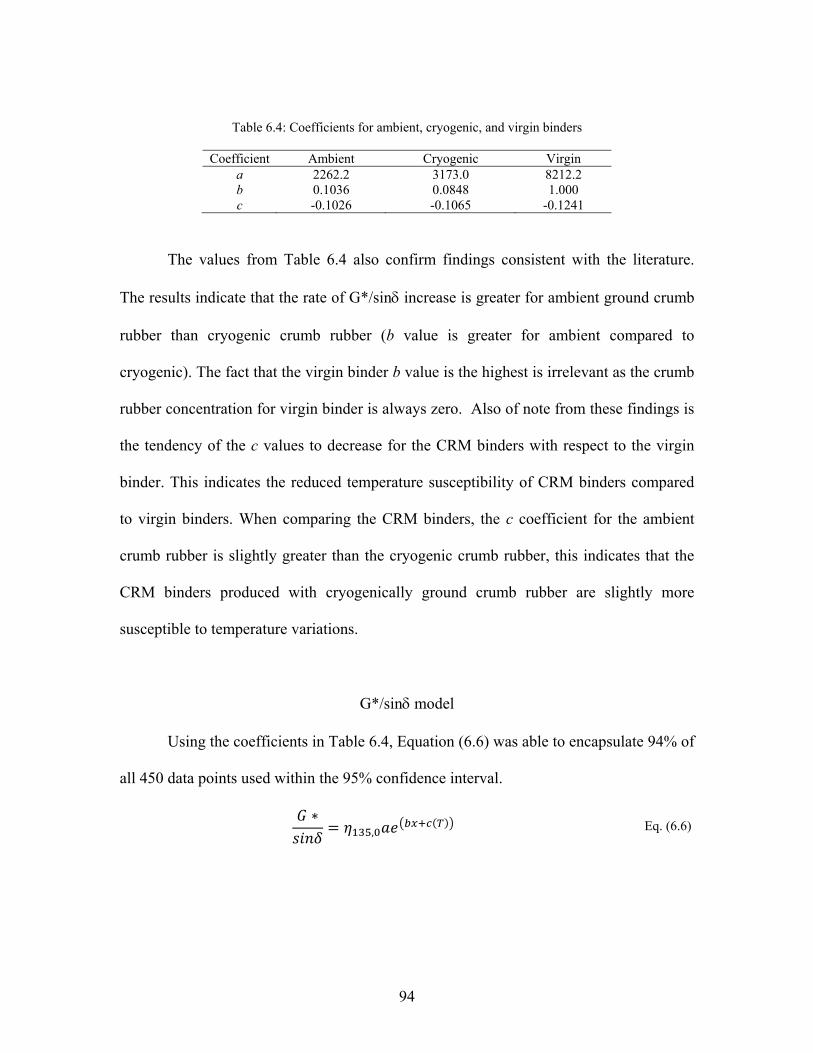
94
Table 6.4: Coefficients for ambient, cryogenic, and virgin binders
Coefficient Ambient Cryogenic Virgin a 2262.2 3173.0 8212.2 b 0.1036 0.0848 1.000 c -0.1026 -0.1065 -0.1241
The values from Table 6.4 also confirm findings consistent with the literature.
The results indicate that the rate of G*/sinδ increase is greater for ambient ground crumb
rubber than cryogenic crumb rubber (b value is greater for ambient compared to
cryogenic). The fact that the virgin binder b value is the highest is irrelevant as the crumb
rubber concentration for virgin binder is always zero. Also of note from these findings is
the tendency of the c values to decrease for the CRM binders with respect to the virgin
binder. This indicates the reduced temperature susceptibility of CRM binders compared
to virgin binders. When comparing the CRM binders, the c coefficient for the ambient
crumb rubber is slightly greater than the cryogenic crumb rubber, this indicates that the
CRM binders produced with cryogenically ground crumb rubber are slightly more
susceptible to temperature variations.
G*/sinδ model
Using the coefficients in Table 6.4, Equation (6.6) was able to encapsulate 94% of
all 450 data points used within the 95% confidence interval.
, Eq. (6.6)
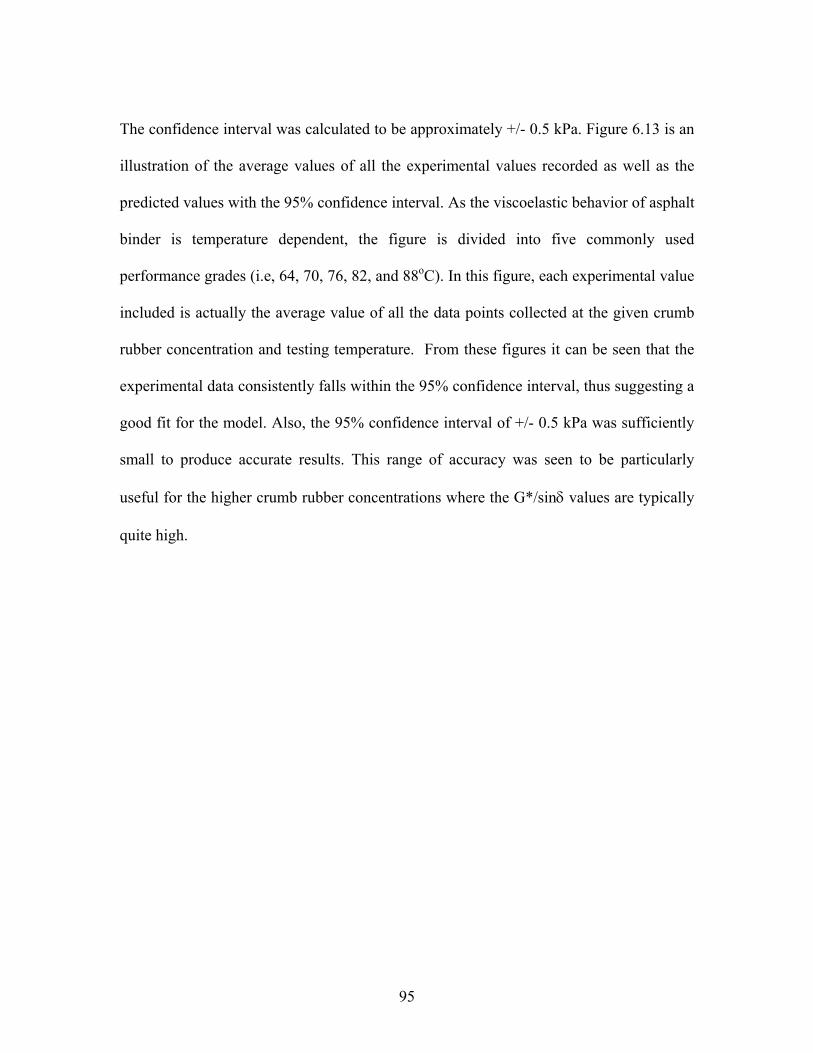
95
The confidence interval was calculated to be approximately +/- 0.5 kPa. Figure 6.13 is an
illustration of the average values of all the experimental values recorded as well as the
predicted values with the 95% confidence interval. As the viscoelastic behavior of asphalt
binder is temperature dependent, the figure is divided into five commonly used
performance grades (i.e, 64, 70, 76, 82, and 88oC). In this figure, each experimental value
included is actually the average value of all the data points collected at the given crumb
rubber concentration and testing temperature. From these figures it can be seen that the
experimental data consistently falls within the 95% confidence interval, thus suggesting a
good fit for the model. Also, the 95% confidence interval of +/- 0.5 kPa was sufficiently
small to produce accurate results. This range of accuracy was seen to be particularly
useful for the higher crumb rubber concentrations where the G*/sinδ values are typically
quite high.
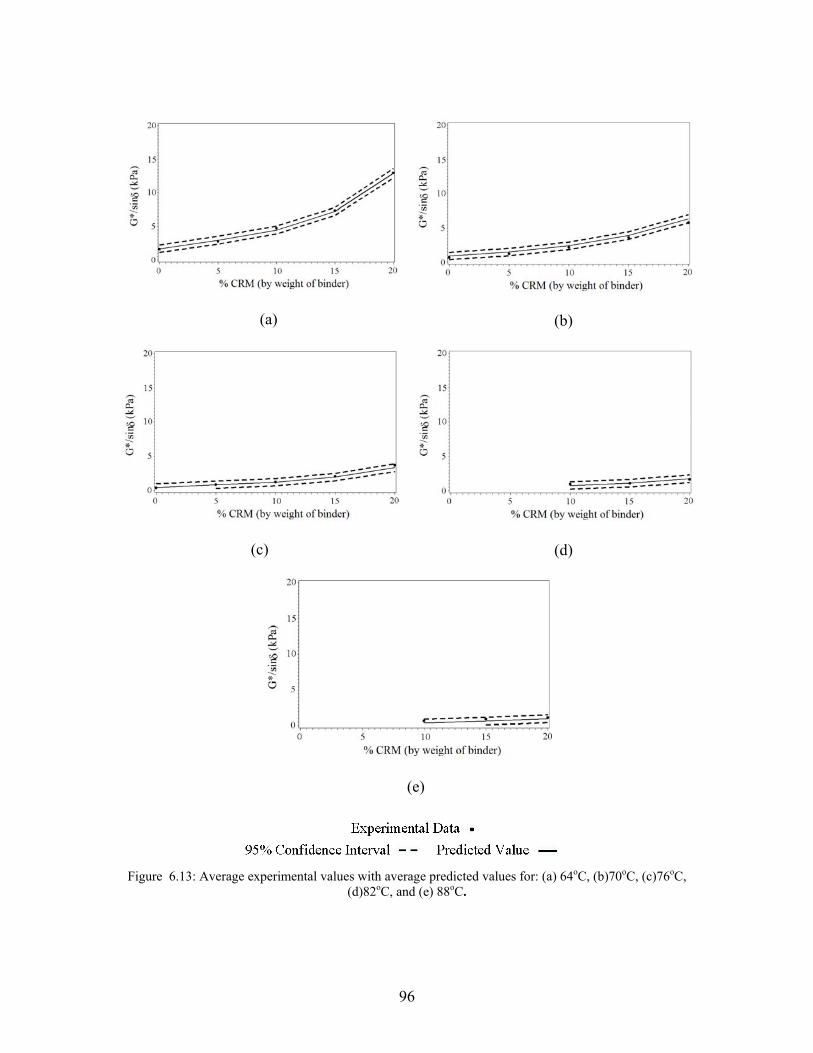
96
(a)
(b)
(c)
(d)
(e)
Figure 6.13: Average experimental values with average predicted values for: (a) 64oC, (b)70oC, (c)76oC, (d)82oC, and (e) 88oC.
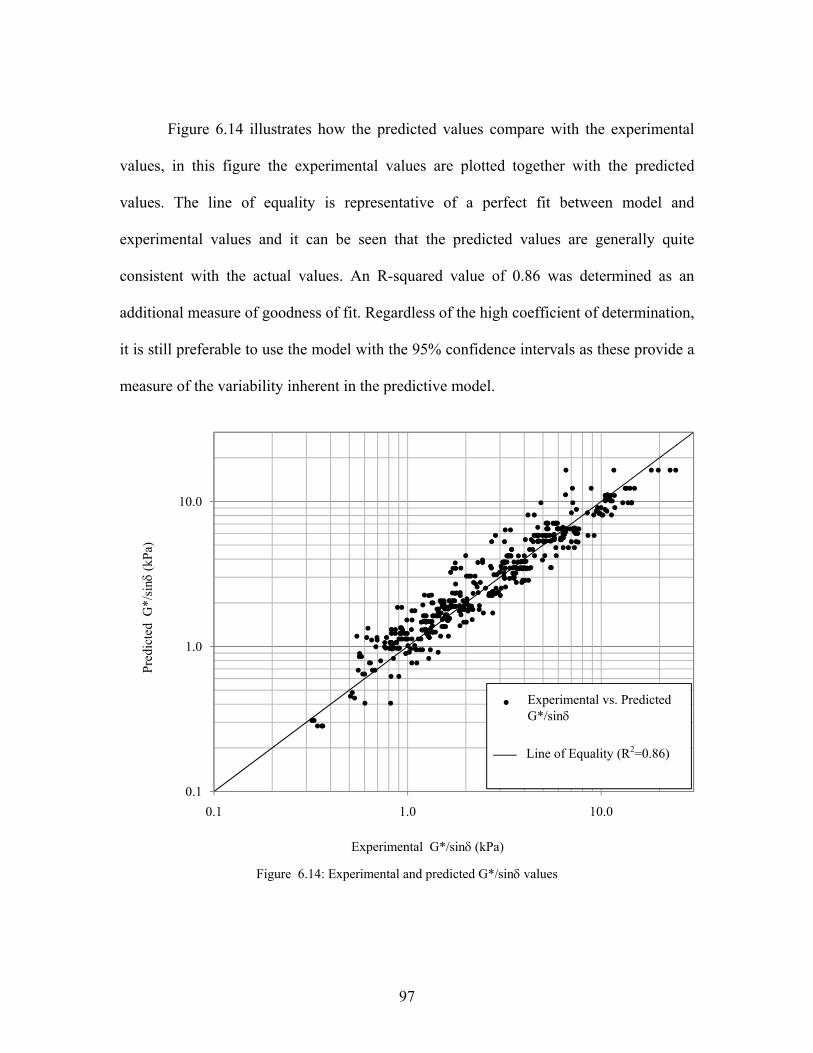
97
Figure 6.14 illustrates how the predicted values compare with the experimental
values, in this figure the experimental values are plotted together with the predicted
values. The line of equality is representative of a perfect fit between model and
experimental values and it can be seen that the predicted values are generally quite
consistent with the actual values. An R-squared value of 0.86 was determined as an
additional measure of goodness of fit. Regardless of the high coefficient of determination,
it is still preferable to use the model with the 95% confidence intervals as these provide a
measure of the variability inherent in the predictive model.
Figure 6.14: Experimental and predicted G*/sinδ values
0.1
1.0
10.0
0.1 1.0 10.0
Pred
icte
d G
*/si
nδ(k
Pa)
Experimental G*/sinδ (kPa)
Experimental vs. Predicted G*/sin(delta)
Linear (Line of Equality (R2 = 0.86))
Experimental vs. Predicted G*/sinδ
Line of Equality (R2=0.86)
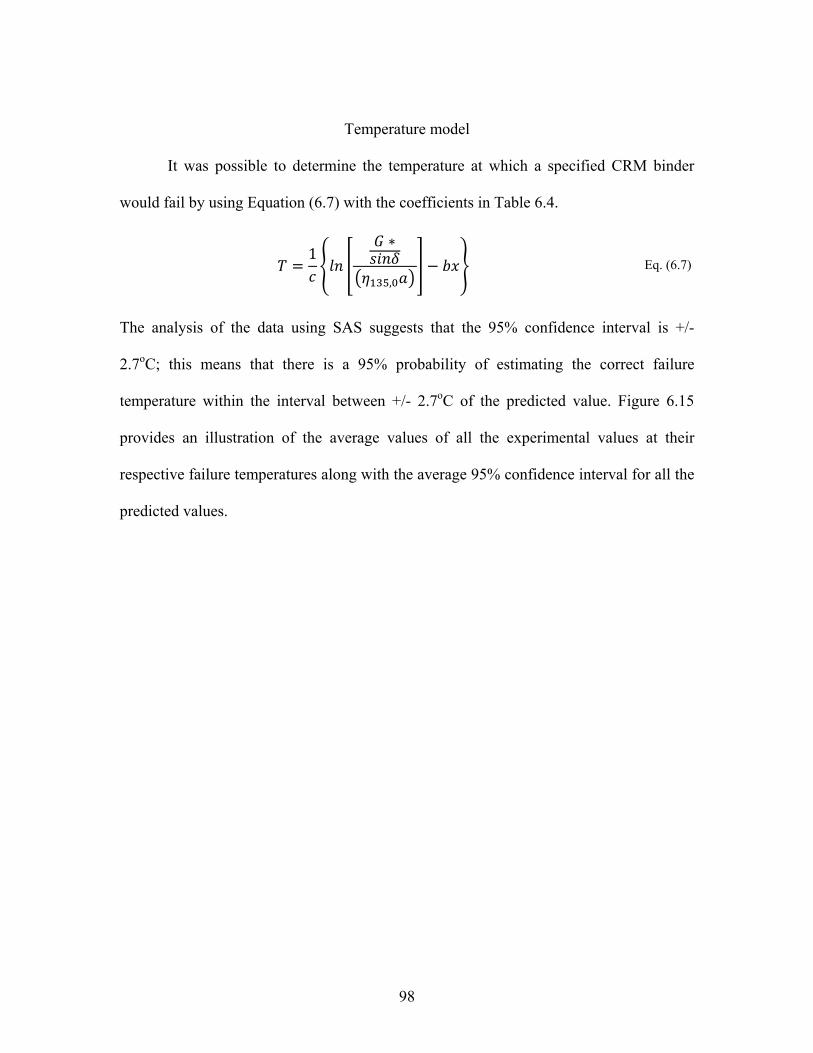
98
Temperature model
It was possible to determine the temperature at which a specified CRM binder
would fail by using Equation (6.7) with the coefficients in Table 6.4.
1
, Eq. (6.7)
The analysis of the data using SAS suggests that the 95% confidence interval is +/-
2.7oC; this means that there is a 95% probability of estimating the correct failure
temperature within the interval between +/- 2.7oC of the predicted value. Figure 6.15
provides an illustration of the average values of all the experimental values at their
respective failure temperatures along with the average 95% confidence interval for all the
predicted values.
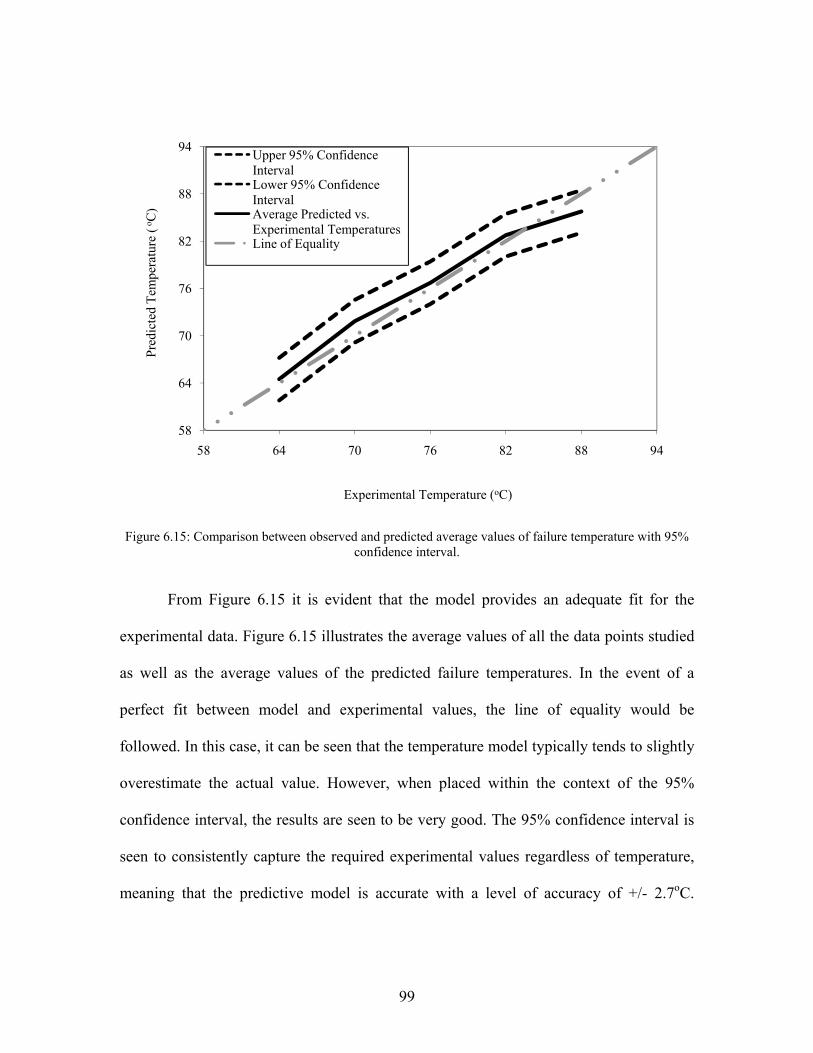
99
Figure 6.15: Comparison between observed and predicted average values of failure temperature with 95% confidence interval.
From Figure 6.15 it is evident that the model provides an adequate fit for the
experimental data. Figure 6.15 illustrates the average values of all the data points studied
as well as the average values of the predicted failure temperatures. In the event of a
perfect fit between model and experimental values, the line of equality would be
followed. In this case, it can be seen that the temperature model typically tends to slightly
overestimate the actual value. However, when placed within the context of the 95%
confidence interval, the results are seen to be very good. The 95% confidence interval is
seen to consistently capture the required experimental values regardless of temperature,
meaning that the predictive model is accurate with a level of accuracy of +/- 2.7oC.
58
64
70
76
82
88
94
58 64 70 76 82 88 94
Pred
icte
d Te
mpe
ratu
re (
o C)
Experimental Temperature (oC)
Upper 95% Confidence IntervalLower 95% Confidence IntervalAverage Predicted vs. Experimental TemperaturesLine of Equality
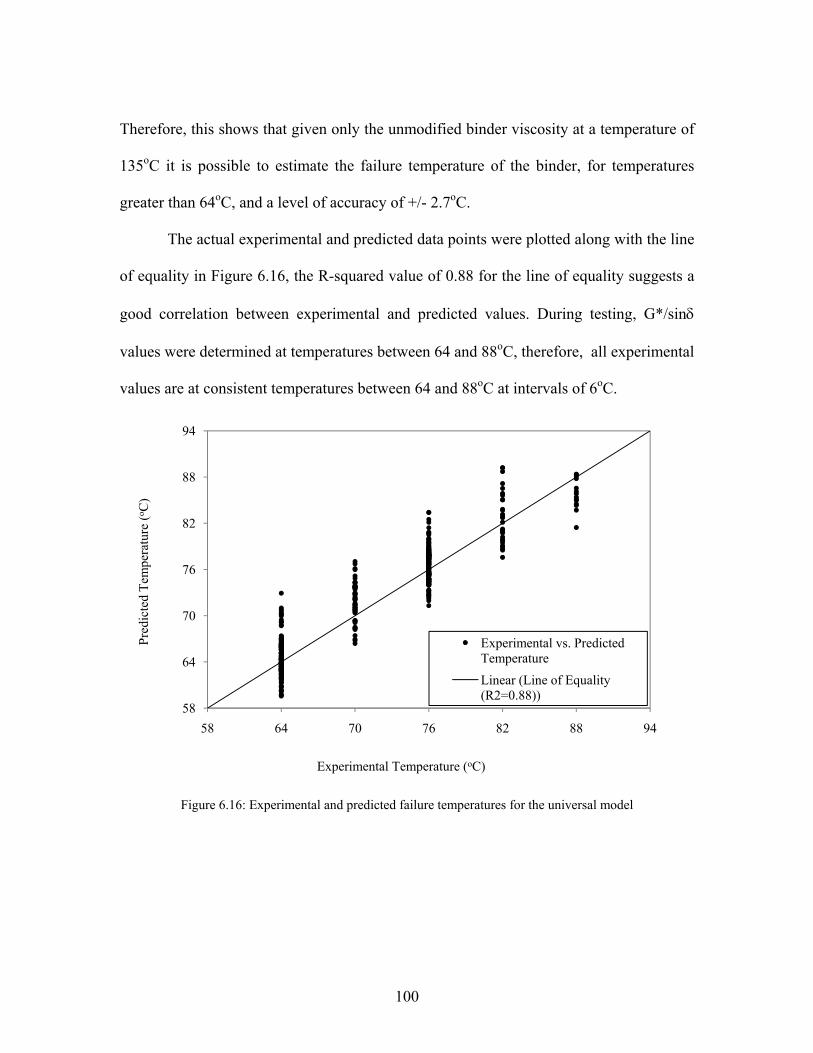
100
Therefore, this shows that given only the unmodified binder viscosity at a temperature of
135oC it is possible to estimate the failure temperature of the binder, for temperatures
greater than 64oC, and a level of accuracy of +/- 2.7oC.
The actual experimental and predicted data points were plotted along with the line
of equality in Figure 6.16, the R-squared value of 0.88 for the line of equality suggests a
good correlation between experimental and predicted values. During testing, G*/sinδ
values were determined at temperatures between 64 and 88oC, therefore, all experimental
values are at consistent temperatures between 64 and 88oC at intervals of 6oC.
Figure 6.16: Experimental and predicted failure temperatures for the universal model
58
64
70
76
82
88
94
58 64 70 76 82 88 94
Pred
icte
d Te
mpe
ratu
re (o C
)
Experimental Temperature (oC)
Experimental vs. Predicted TemperatureLinear (Line of Equality (R2=0.88))
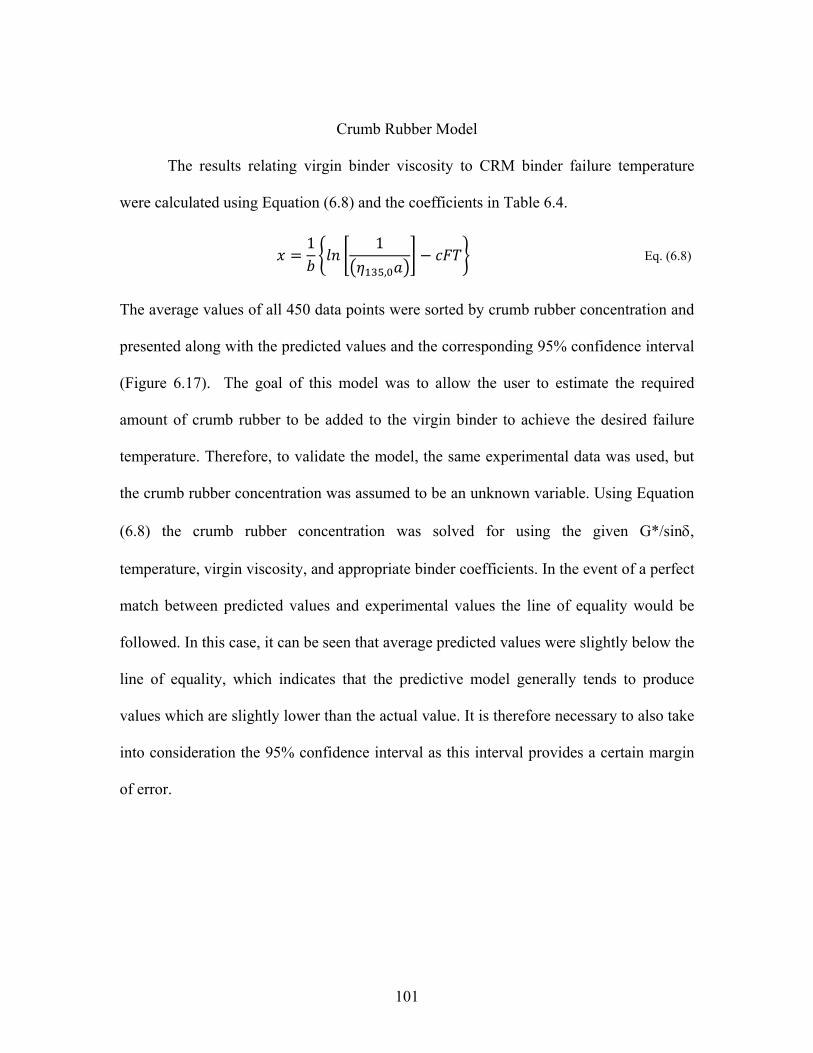
101
Crumb Rubber Model
The results relating virgin binder viscosity to CRM binder failure temperature
were calculated using Equation (6.8) and the coefficients in Table 6.4.
1 1
, Eq. (6.8)
The average values of all 450 data points were sorted by crumb rubber concentration and
presented along with the predicted values and the corresponding 95% confidence interval
(Figure 6.17). The goal of this model was to allow the user to estimate the required
amount of crumb rubber to be added to the virgin binder to achieve the desired failure
temperature. Therefore, to validate the model, the same experimental data was used, but
the crumb rubber concentration was assumed to be an unknown variable. Using Equation
(6.8) the crumb rubber concentration was solved for using the given G*/sinδ,
temperature, virgin viscosity, and appropriate binder coefficients. In the event of a perfect
match between predicted values and experimental values the line of equality would be
followed. In this case, it can be seen that average predicted values were slightly below the
line of equality, which indicates that the predictive model generally tends to produce
values which are slightly lower than the actual value. It is therefore necessary to also take
into consideration the 95% confidence interval as this interval provides a certain margin
of error.
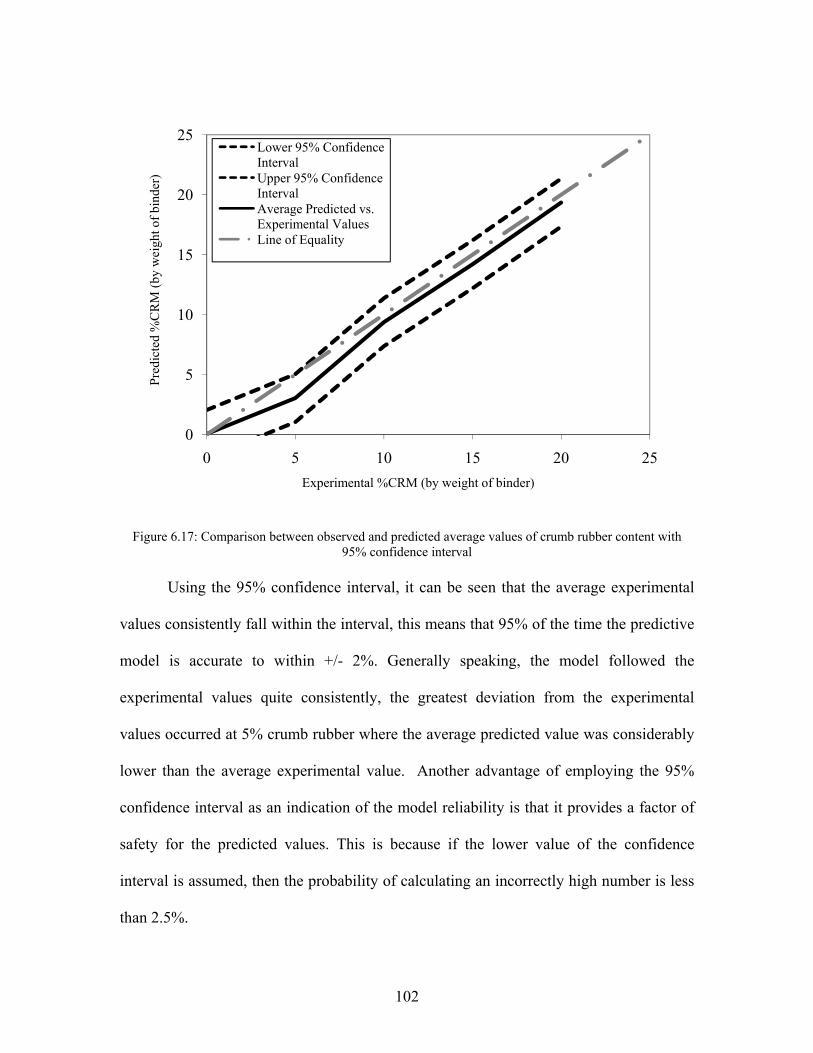
102
Figure 6.17: Comparison between observed and predicted average values of crumb rubber content with 95% confidence interval
Using the 95% confidence interval, it can be seen that the average experimental
values consistently fall within the interval, this means that 95% of the time the predictive
model is accurate to within +/- 2%. Generally speaking, the model followed the
experimental values quite consistently, the greatest deviation from the experimental
values occurred at 5% crumb rubber where the average predicted value was considerably
lower than the average experimental value. Another advantage of employing the 95%
confidence interval as an indication of the model reliability is that it provides a factor of
safety for the predicted values. This is because if the lower value of the confidence
interval is assumed, then the probability of calculating an incorrectly high number is less
than 2.5%.
0
5
10
15
20
25
0 5 10 15 20 25
Pred
icte
d %
CR
M (b
y w
eigh
t of b
inde
r)
Experimental %CRM (by weight of binder)
Lower 95% Confidence IntervalUpper 95% Confidence IntervalAverage Predicted vs. Experimental ValuesLine of Equality
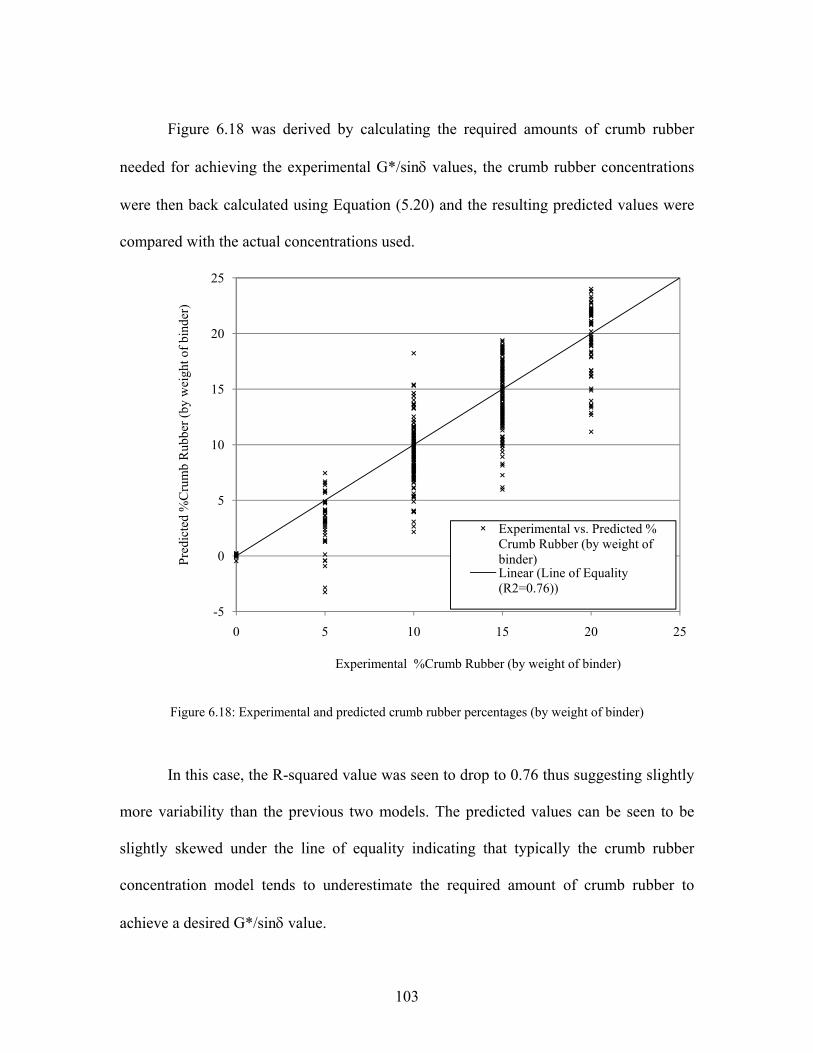
103
Figure 6.18 was derived by calculating the required amounts of crumb rubber
needed for achieving the experimental G*/sinδ values, the crumb rubber concentrations
were then back calculated using Equation (5.20) and the resulting predicted values were
compared with the actual concentrations used.
Figure 6.18: Experimental and predicted crumb rubber percentages (by weight of binder)
In this case, the R-squared value was seen to drop to 0.76 thus suggesting slightly
more variability than the previous two models. The predicted values can be seen to be
slightly skewed under the line of equality indicating that typically the crumb rubber
concentration model tends to underestimate the required amount of crumb rubber to
achieve a desired G*/sinδ value.
-5
0
5
10
15
20
25
0 5 10 15 20 25
Pred
icte
d %
Cru
mb
Rub
ber (
by w
eigh
t of b
inde
r)
Experimental %Crumb Rubber (by weight of binder)
Experimental vs. Predicted % Crumb Rubber (by weight of binder)Linear (Line of Equality (R2=0.76))
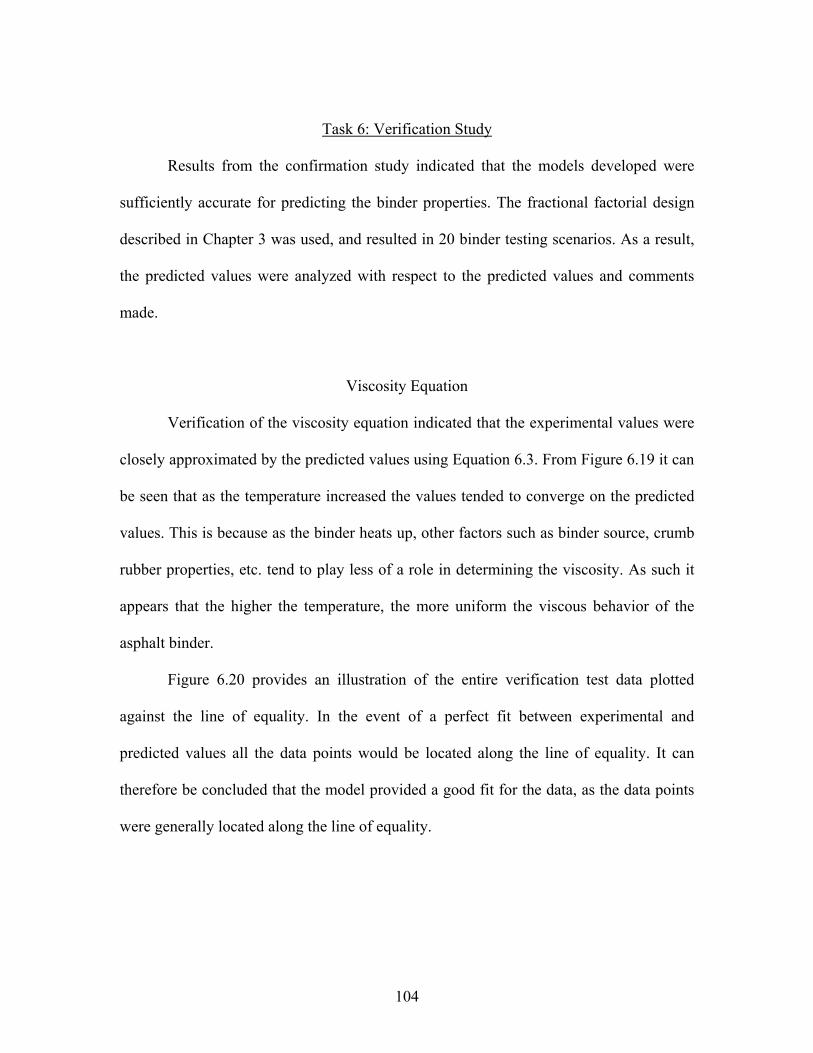
104
Task 6: Verification Study
Results from the confirmation study indicated that the models developed were
sufficiently accurate for predicting the binder properties. The fractional factorial design
described in Chapter 3 was used, and resulted in 20 binder testing scenarios. As a result,
the predicted values were analyzed with respect to the predicted values and comments
made.
Viscosity Equation
Verification of the viscosity equation indicated that the experimental values were
closely approximated by the predicted values using Equation 6.3. From Figure 6.19 it can
be seen that as the temperature increased the values tended to converge on the predicted
values. This is because as the binder heats up, other factors such as binder source, crumb
rubber properties, etc. tend to play less of a role in determining the viscosity. As such it
appears that the higher the temperature, the more uniform the viscous behavior of the
asphalt binder.
Figure 6.20 provides an illustration of the entire verification test data plotted
against the line of equality. In the event of a perfect fit between experimental and
predicted values all the data points would be located along the line of equality. It can
therefore be concluded that the model provided a good fit for the data, as the data points
were generally located along the line of equality.
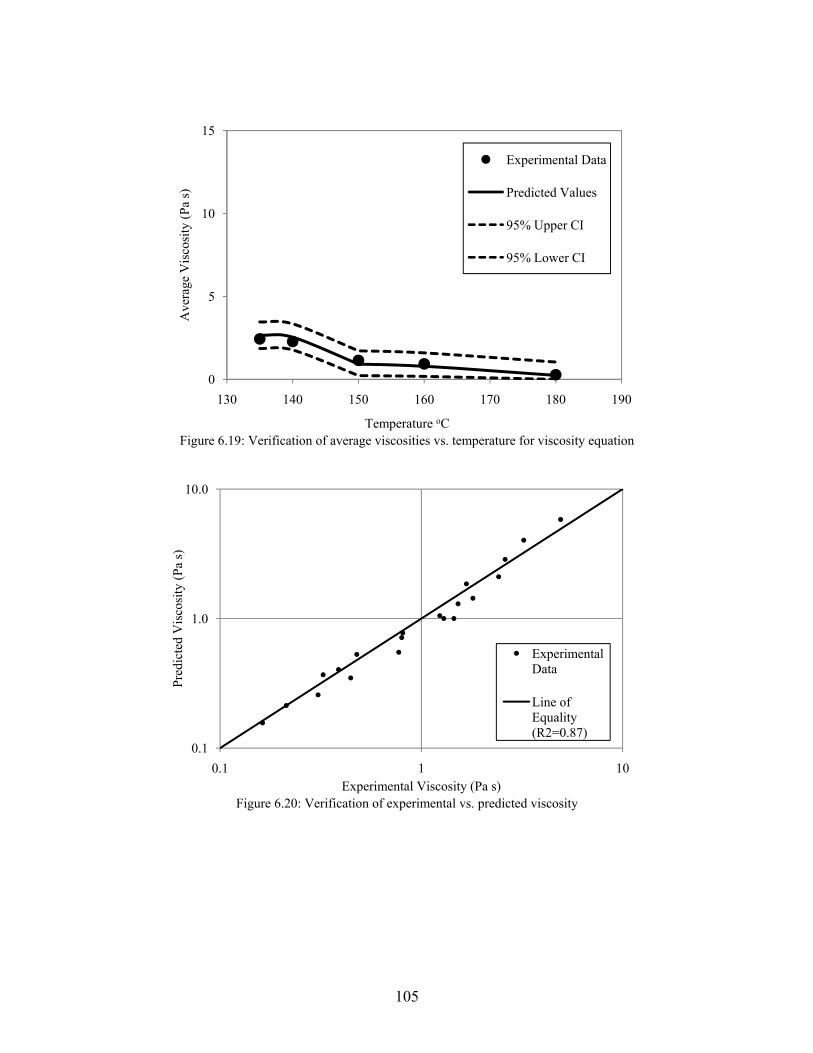
105
Figure 6.19: Verification of average viscosities vs. temperature for viscosity equation
Figure 6.20: Verification of experimental vs. predicted viscosity
0
5
10
15
130 140 150 160 170 180 190
Ave
rage
Vis
cosi
ty (P
a s)
Temperature oC
Experimental Data
Predicted Values
95% Upper CI
95% Lower CI
0.1
1.0
10.0
0.1 1 10
Pred
icte
d V
isco
sity
(Pa
s)
Experimental Viscosity (Pa s)
Experimental Data
Line of Equality (R2=0.87)
106
G*/sinδ Equation
The verification results also proved the validity of the G*/sinδ model, as seen in
Figure 6.21. The model produced accurate results regardless of crumb rubber
concentration or temperature. It can also be seen that the predictive model tends to
produce the intermediate value between the high and low. For example, it can be seen
that at 64oC, the 5% and 10% crumb rubber experimental data is somewhat higher than
the predicted value, while for the 15% and 20% it is slightly lower than the predicted
value .This suggests that there is a great deal of variability within CRM binder properties,
but it also shows that the model will generally select an intermediate value.
These findings are also evident in Figures 6.22 and 6.23, here it can be seen that
the experimental data points tend to follow the line of equality. Also, the data does not
appear to be skewed to one direction, this can be seen as approximately the same number
of data points are located above the line of equality as below the line of equality.
Therefore, it may be concluded that the model was able to determine CRM
binder’s G*/sinδ and failure temperature given only the virgin binder G*/sinδ value. As it
is conservative to underestimate the failure temperature and G*/sinδ for design purposes,
it is suggested that the lower confidence interval be used. Doing so, provides an accurate
and conservative estimate.
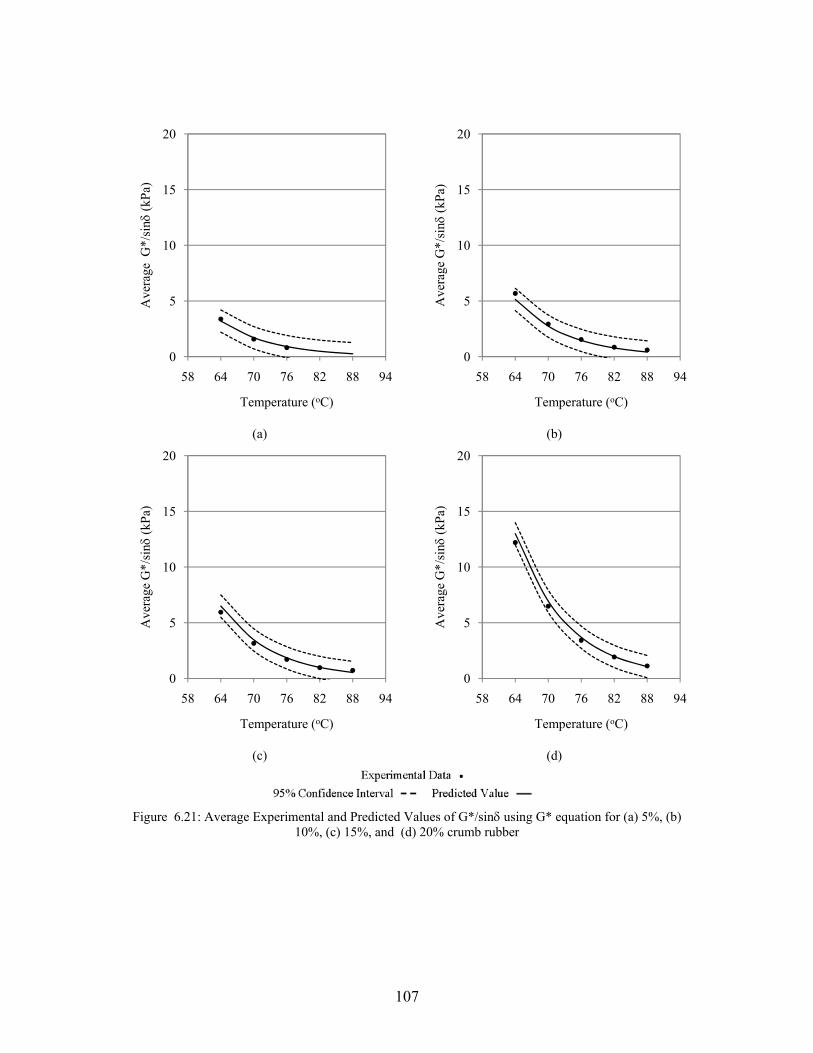
107
(a) (b)
(c) (d)
Figure 6.21: Average Experimental and Predicted Values of G*/sinδ using G* equation for (a) 5%, (b) 10%, (c) 15%, and (d) 20% crumb rubber
0
5
10
15
20
58 64 70 76 82 88 94
Ave
rage
G*/
sinδ
(kPa
)
Temperature (oC)
0
5
10
15
20
58 64 70 76 82 88 94
Ave
rage
G*/
sinδ
(kPa
)
Temperature (oC)
0
5
10
15
20
58 64 70 76 82 88 94
Ave
rage
G*/
sinδ
(kPa
)
Temperature (oC)
0
5
10
15
20
58 64 70 76 82 88 94
Ave
rage
G*/
sinδ
(kPa
)
Temperature (oC)
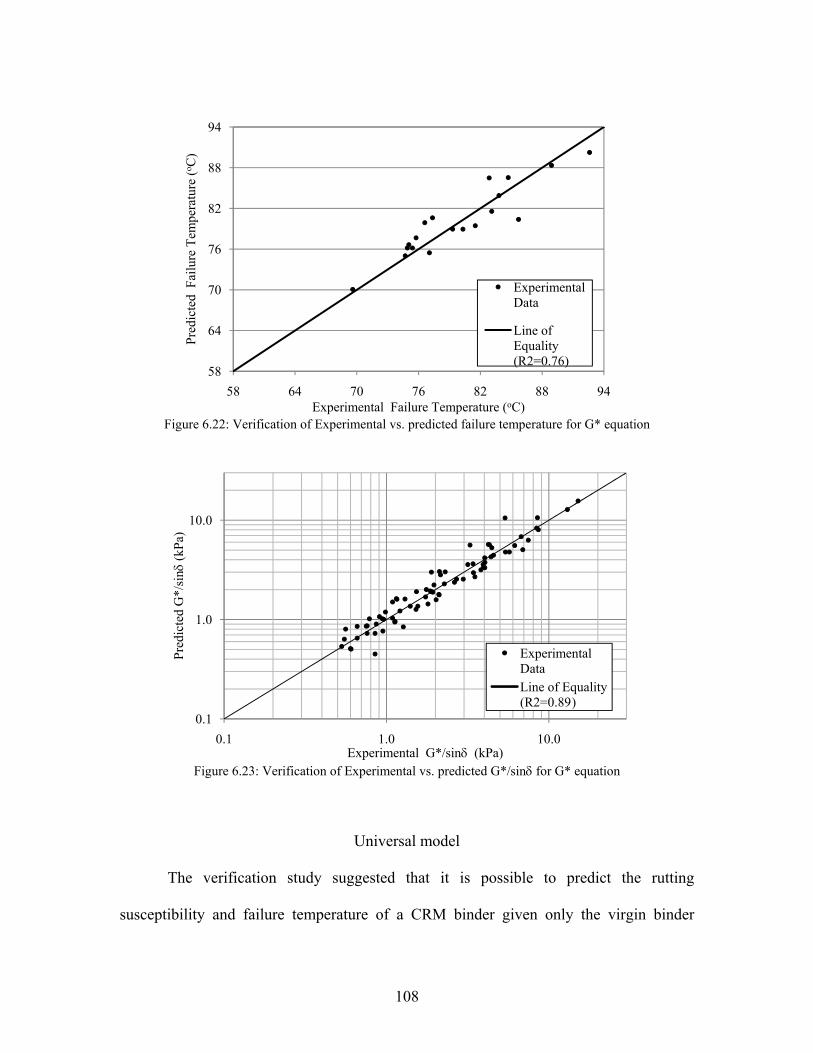
108
Figure 6.22: Verification of Experimental vs. predicted failure temperature for G* equation
Figure 6.23: Verification of Experimental vs. predicted G*/sinδ for G* equation
Universal model
The verification study suggested that it is possible to predict the rutting
susceptibility and failure temperature of a CRM binder given only the virgin binder
58
64
70
76
82
88
94
58 64 70 76 82 88 94
Pred
icte
d F
ailu
re T
empe
ratu
re (o C
)
Experimental Failure Temperature (oC)
Experimental Data
Line of Equality (R2=0.76)
0.1
1.0
10.0
0.1 1.0 10.0
Pred
icte
d G
*/si
nδ(k
Pa)
Experimental G*/sinδ (kPa)
Experimental DataLine of Equality (R2=0.89)
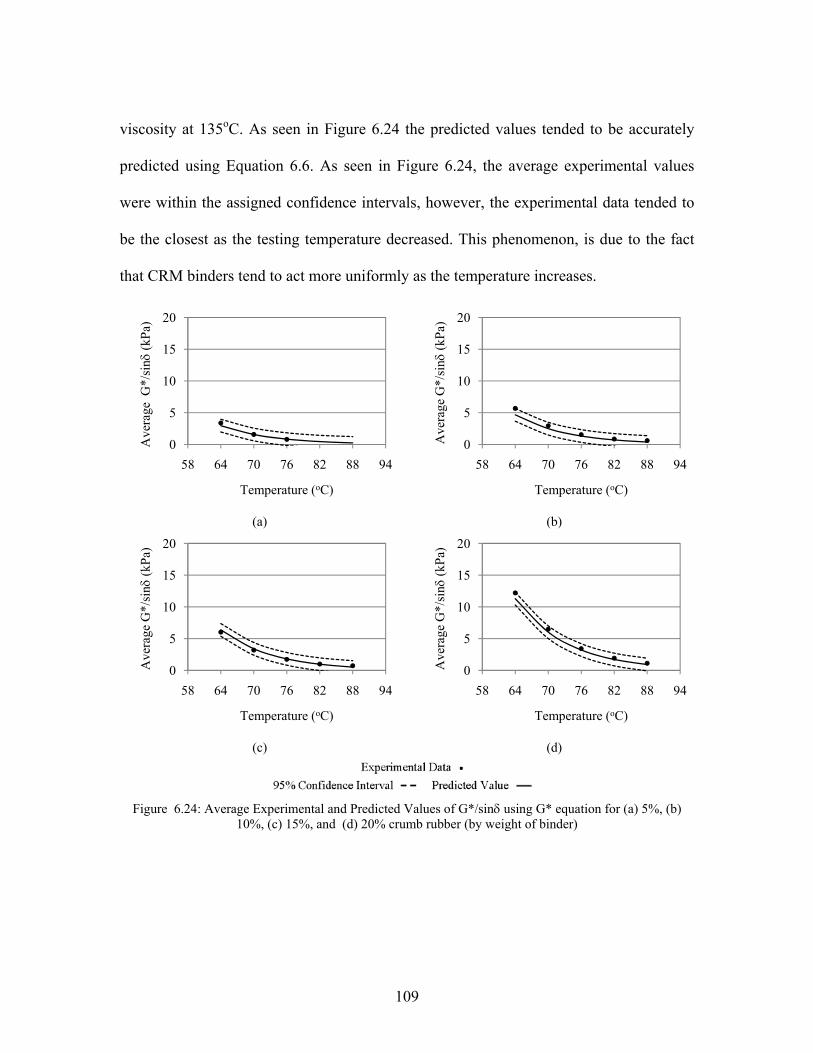
109
viscosity at 135oC. As seen in Figure 6.24 the predicted values tended to be accurately
predicted using Equation 6.6. As seen in Figure 6.24, the average experimental values
were within the assigned confidence intervals, however, the experimental data tended to
be the closest as the testing temperature decreased. This phenomenon, is due to the fact
that CRM binders tend to act more uniformly as the temperature increases.
(a) (b)
(c) (d)
Figure 6.24: Average Experimental and Predicted Values of G*/sinδ using G* equation for (a) 5%, (b) 10%, (c) 15%, and (d) 20% crumb rubber (by weight of binder)
0
5
10
15
20
58 64 70 76 82 88 94
Ave
rage
G*/
sinδ
(kPa
)
Temperature (oC)
0
5
10
15
20
58 64 70 76 82 88 94
Ave
rage
G*/
sinδ
(kPa
)
Temperature (oC)
0
5
10
15
20
58 64 70 76 82 88 94
Ave
rage
G*/
sinδ
(kPa
)
Temperature (oC)
0
5
10
15
20
58 64 70 76 82 88 94
Ave
rage
G*/
sinδ
(kPa
)
Temperature (oC)
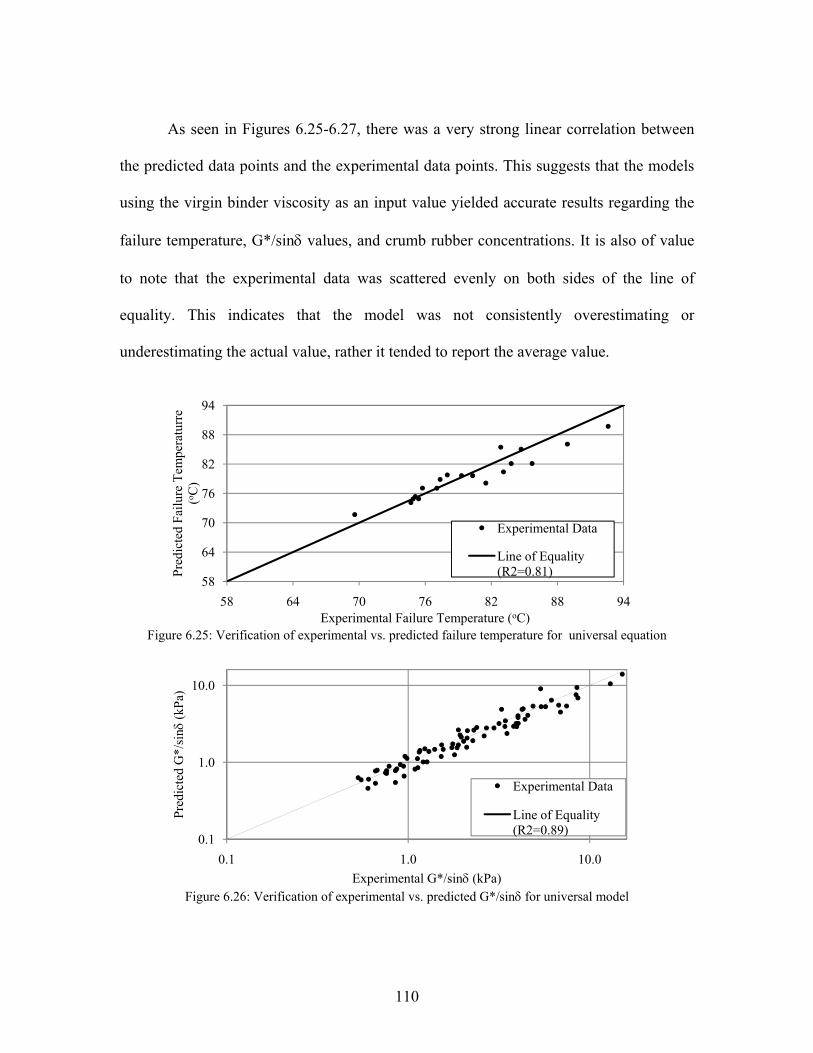
110
As seen in Figures 6.25-6.27, there was a very strong linear correlation between
the predicted data points and the experimental data points. This suggests that the models
using the virgin binder viscosity as an input value yielded accurate results regarding the
failure temperature, G*/sinδ values, and crumb rubber concentrations. It is also of value
to note that the experimental data was scattered evenly on both sides of the line of
equality. This indicates that the model was not consistently overestimating or
underestimating the actual value, rather it tended to report the average value.
Figure 6.25: Verification of experimental vs. predicted failure temperature for universal equation
Figure 6.26: Verification of experimental vs. predicted G*/sinδ for universal model
58
64
70
76
82
88
94
58 64 70 76 82 88 94
Pred
icte
d Fa
ilure
Tem
pera
turr
e
(o C)
Experimental Failure Temperature (oC)
Experimental Data
Line of Equality (R2=0.81)
0.1
1.0
10.0
0.1 1.0 10.0
Pred
icte
d G
*/si
nδ(k
Pa)
Experimental G*/sinδ (kPa)
Experimental Data
Line of Equality (R2=0.89)
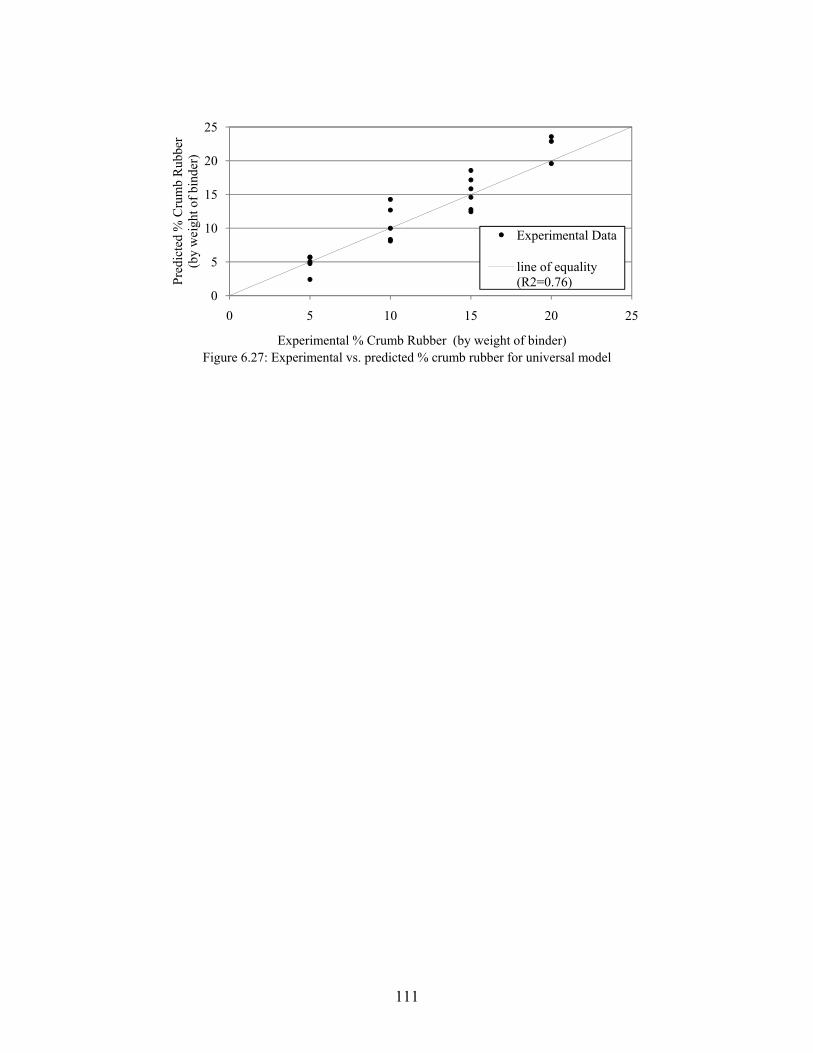
111
Figure 6.27: Experimental vs. predicted % crumb rubber for universal model
0
5
10
15
20
25
0 5 10 15 20 25
Pred
icte
d %
Cru
mb
Rub
ber
(by
wei
ght o
f bin
der)
Experimental % Crumb Rubber (by weight of binder)
Experimental Data
line of equality (R2=0.76)
112
CHAPTER SEVEN
SUMMARY, CONCLUSIONS, AND RECCOMENDATIONS FOR FUTURE RESEARCH
7. seven Summary
The purpose of this research was to identify and model critical elements of the
asphalt rubber matrix contributing to the CRM binder properties as measured by
Superpave testing procedures. Initially, an extensive literature review regarding the use,
performance, and estimation of SHRP properties of various CRM binders was conducted.
The findings from the literature review indicated that CRM binder was an established
paving material with a record of improving pavement performance. Previously, other
researchers had attempted to develop models for the prediction of binder properties.
These models are today either not applicable (due to new testing procedures) or not
practical (due to difficulty of application or lack of accuracy). As such, this research
aimed to develop predictive models for estimating binder properties within a certain
range of accuracy. Currently, no such models exist, however, for CRM binder to become
more established in the field of polymer modified asphalts it is necessary that such
models be developed to show the consistency of the product.
The first task in this research involved evaluating the various crumb rubber
sources; this was done in order to gain an understanding of the differences between the
various crumb rubbers. Doing so would permit identification of the important parameters,
thus allowing for an accurate model to be developed. Analysis of the crumb rubbers
involved determination of the glass transition temperature, chemical and visual analysis
by scanning electron microscope. During the second task, the crumb rubber sources were
113
reacted at various concentrations (5, 10, 15, and 20% by weight of binder) with two
binder sources. Drained binder samples were also obtained to determine the particle and
interaction effects of the crumb rubber on the various binders. Subsequently, binder tests
were performed on the binders in order to determine which factors had the most effect on
the development of binder properties.
Once the critical parameters were established, other test data was obtained from
research projects conducted at other labs. Doing so allowed a broader model to be
developed, a model which would not be specific to one specific tester and lab facility.
Ultimately a total of 17 virgin binder sources from 10 separate regions were evaluated; a
further 12 crumb rubber sources were used in conjunction with the various binder
sources. These crumb rubber sources used various gradations, grinding mechanisms, and
tire types thus allowing numerous variables to be taken into consideration. Three distinct
models were developed during this research, these were:
1. Viscosity model: this model permitted the estimation of CRM binder viscosity
as a function of crumb rubber content (0-20%) and temperature (135-190oC).
The starting parameters for this model were the virgin binder viscosity at
135oC and the crumb rubber type (ambient or cryogenic).
2. G*/sinδ and failure temperature model: this model permitted the estimation of
CRM binder’s G*/sinδ value and failure temperature as a function of crumb
rubber content (0-20%) and temperature (64-94oC). The starting parameters for
this model were the virgin binder G*/sinδ value at 64oC or the failure
temperature and the crumb rubber type (ambient or cryogenic).
114
3. Universal model: this model permitted the estimation of the CRM binder
G*/sinδ value and failure temperature as a function of crumb rubber content
(0-20%). The starting parameters for this model were the virgin binder
viscosity at 135oC and the type of crumb rubber (ambient or cryogenic).
The nonlinear empirical models for estimation of CRM binder properties were
developed using the nonlinear least squares method. The accuracy of the various models
was evaluated by identifying 95% confidence intervals for the binder property estimation.
Validation of the models was performed using a fractional factorial design with
previously untested CRM binders.
Conclusions
• There is evidence to suggest that increasing crumb rubber concentrations,
regardless of crumb rubber or binder type, results in increasing viscosities, failure
temperatures, and G*/sinδ values. This confirms that as crumb rubber is added to
the binder, the rutting resistance and viscosity are increased; however, the extent
of this increase is dependent on the type of binder and crumb rubber properties.
• The effect of the crumb rubber in the binder tends to enhance the effects of the
base binder. Therefore, increases in the rutting resistance of CRM binders are still
related to the base binder properties. This indicates that, for CRM binder, the
properties of the base binder typically have a greater influence on the rutting
susceptibility and viscosity of the binder than the properties of the crumb rubber
used in the matrix.
115
• Examination of the interaction and particle effects (IE and PE) indicated that the
effects of the crumb rubber on the binder increase as the crumb rubber
concentration increases. Particle effects of ambient ground crumb rubbers are
generally seen to be higher than particle effects for cryogenically ground crumb
rubbers. The particle effect for failure temperature and G*/sinδ of CRM binders is
thought to be influenced by the surface morphology of the particle. Findings form
the IE and PE indicate that the reaction between rubber and asphalt is largely a
physical one, and less due to interaction effects between the crumb rubber and
binder..
• From the experimental data it was possible to develop a nonlinear empirical
model depicting the viscosity of modified asphalt binders between the
temperatures of 135oC and 190oC. Furthermore, this model was seen to be
accurate for virgin, polymer modified, and CRM binders in this limited research
work. The accuracy of the model was found to be within +/- 0.8 Pa-s. Such a level
of precision allows conservative estimates of binder viscosity to be made using
the 95% upper confidence interval.
• During the development of the model, the Rubber coefficient for viscosity (Rcv)
was identified as being critical to the accurate determination of CRM binder
properties. This term provides a number which may be used to determine the
impact of the specific crumb rubber on the specific binder.
• It was possible to develop an empirical model depicting the changes in G*/sinδ
values and failure temperature. The Rubber coefficient for G*/sinδ (Rcg), was an
116
important parameter when estimating the rutting susceptibility of a CRM binder,
analysis of the Rcg indicated that ambient ground crumb rubber yielded higher Rcg
values and, therefore, also higher G*/sinδ values.
• The lower confidence interval was found to be the most conservative value. Using
the value corresponding to the lower end of the 95% confidence interval, the
probability of selecting an inaccurately high failure temperature was reduced to
less than 2.5%.
• The universal model showed that it is possible to develop empirical relationships
describing the change in G*/sinδ as a function of temperature, virgin binder
viscosity, and crumb rubber concentration. The 95% confidence interval for
determination of G*/sinδ of binders was found to be approximately +/- 0.5 kPa.
• The 95% confidence intervals used for the estimation of failure temperature and
crumb rubber concentration were 2.7oC and 2% crumb rubber (by binder weight),
respectively.
• It is suggested that the lower 95% confidence interval be used together with the
predicted value as doing so reduces the probability of producing excessively high
predicted values to less than 2.5%. Specifically, in the case of failure temperature
and G*/sinδ it is preferable to obtain a conservative value rather than obtaining
inaccurately high values.
• An exponential growth model was seen to provide a realistic trend of the change
in G*/sinδ of binder using both crumb rubber concentration and the temperature
as exponents. The rutting susceptibility was shown by the model to increase with
117
the addition of crumb rubber and decrease with an increase in temperature. Both
of these trends are consistent with how the literature describes the change of CRM
binder G*/sinδ with respect to temperature and crumb rubber concentration.
Recommendations
• Further testing is required with more binders, specifically the effects of the
addition of crumb rubber to other performance grades of binders is of interest.
Such testing would reveal the consistency of the trend for temperature less than
64oC.
• It is also suggested that more research is needed in this area to generalize the
findings, specifically in the area of generating more Rcv and Rcg data. In particular,
it would be useful to develop more Rcv and Rcg data for other binders.
• Further research should be undertaken investigating the possibilities of modeling
other binder properties such as low failure temperature, and rate of aging of
modified binders.
• For viscosity predictions it is recommended to use the upper confidence interval
value. Doing so provides a conservative value, and also presents a value which
has a probability of 2.5% of being exceeded.
• For failure temperature predications it is recommended to use the lower
confidence interval value. This provides a conservative value, and also presents a
temperature which has a probability of 97.5% of being exceeded.
118
• For G*/sinδ predications it is recommended to use the lower confidence interval
value. This provides a conservative value, and also presents a G*/sinδ value
which has a probability of 97.5% of being exceeded. Using the lower confidence
interval provides a minimum expected value.

119
APPENDICES
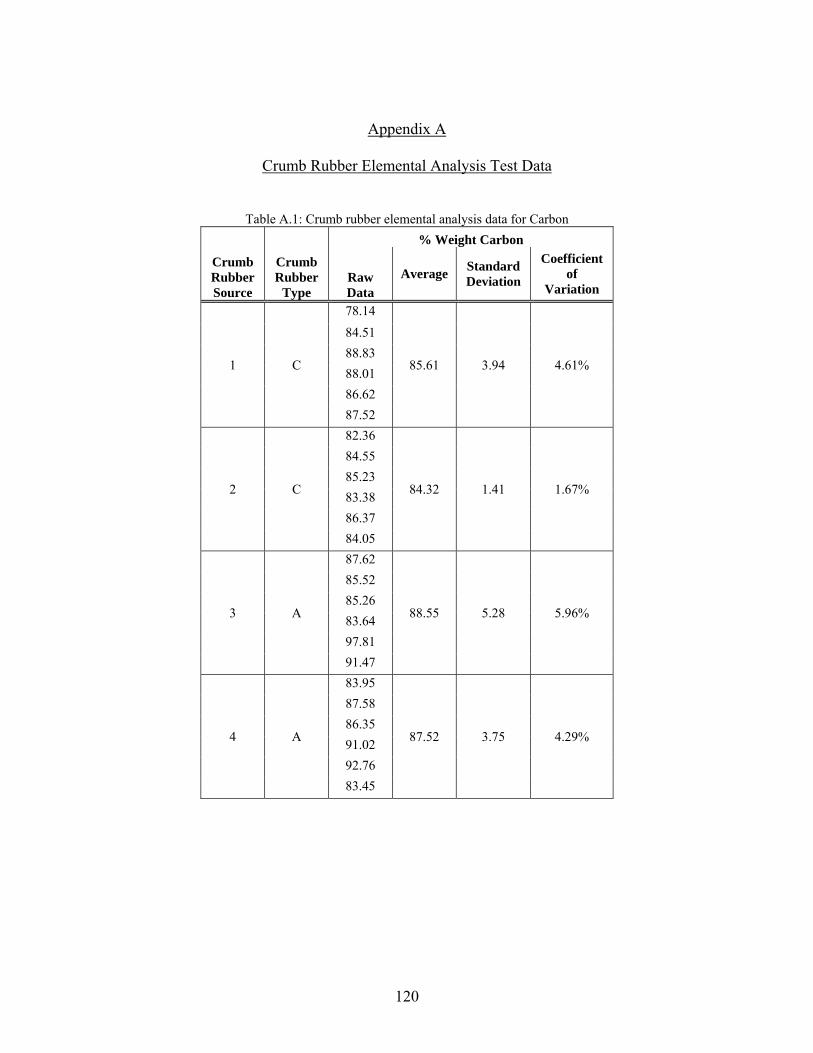
120
Appendix A
Crumb Rubber Elemental Analysis Test Data
A. S Table A.1: Crumb rubber elemental analysis data for Carbon
% Weight Carbon
Crumb Rubber Source
Crumb Rubber
Type Raw Data
Average Standard Deviation
Coefficient of
Variation
1 C
78.14
85.61 3.94 4.61%
84.51 88.83 88.01 86.62 87.52
2 C
82.36
84.32 1.41 1.67%
84.55 85.23 83.38 86.37 84.05
3 A
87.62
88.55 5.28 5.96%
85.52 85.26 83.64 97.81 91.47
4 A
83.95
87.52 3.75 4.29%
87.58 86.35 91.02 92.76 83.45
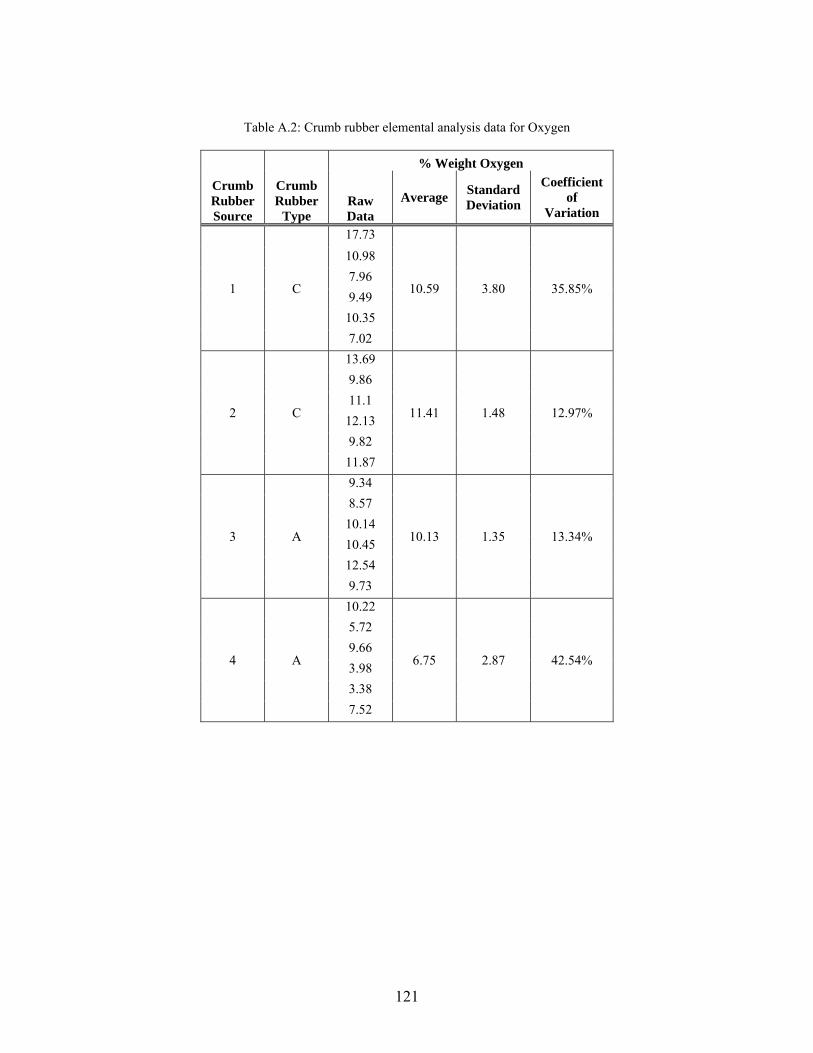
121
Table A.2: Crumb rubber elemental analysis data for Oxygen
% Weight Oxygen
Crumb Rubber Source
Crumb Rubber
Type Raw Data
Average Standard Deviation
Coefficient of
Variation
1 C
17.73
10.59 3.80 35.85%
10.98 7.96 9.49
10.35 7.02
2 C
13.69
11.41 1.48 12.97%
9.86 11.1
12.13 9.82
11.87
3 A
9.34
10.13 1.35 13.34%
8.57 10.14 10.45 12.54 9.73
4 A
10.22
6.75 2.87 42.54%
5.72 9.66 3.98 3.38 7.52
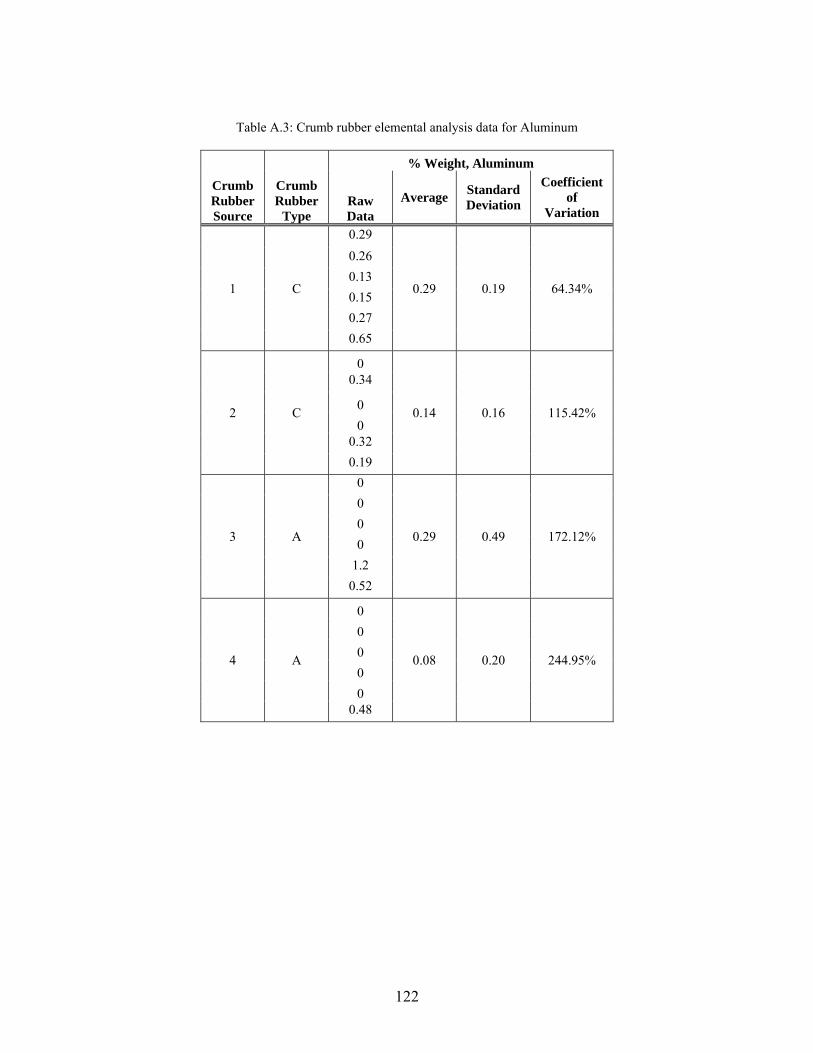
122
Table A.3: Crumb rubber elemental analysis data for Aluminum
% Weight, Aluminum
Crumb Rubber Source
Crumb Rubber
Type Raw Data
Average Standard Deviation
Coefficient of
Variation
1 C
0.29
0.29 0.19 64.34%
0.26 0.13 0.15 0.27 0.65
2 C
0
0.14 0.16 115.42%
0.34
0 0
0.32 0.19
3 A
0
0.29 0.49 172.12%
0 0 0
1.2 0.52
4 A
0
0.08 0.20 244.95%
0 0 0 0
0.48
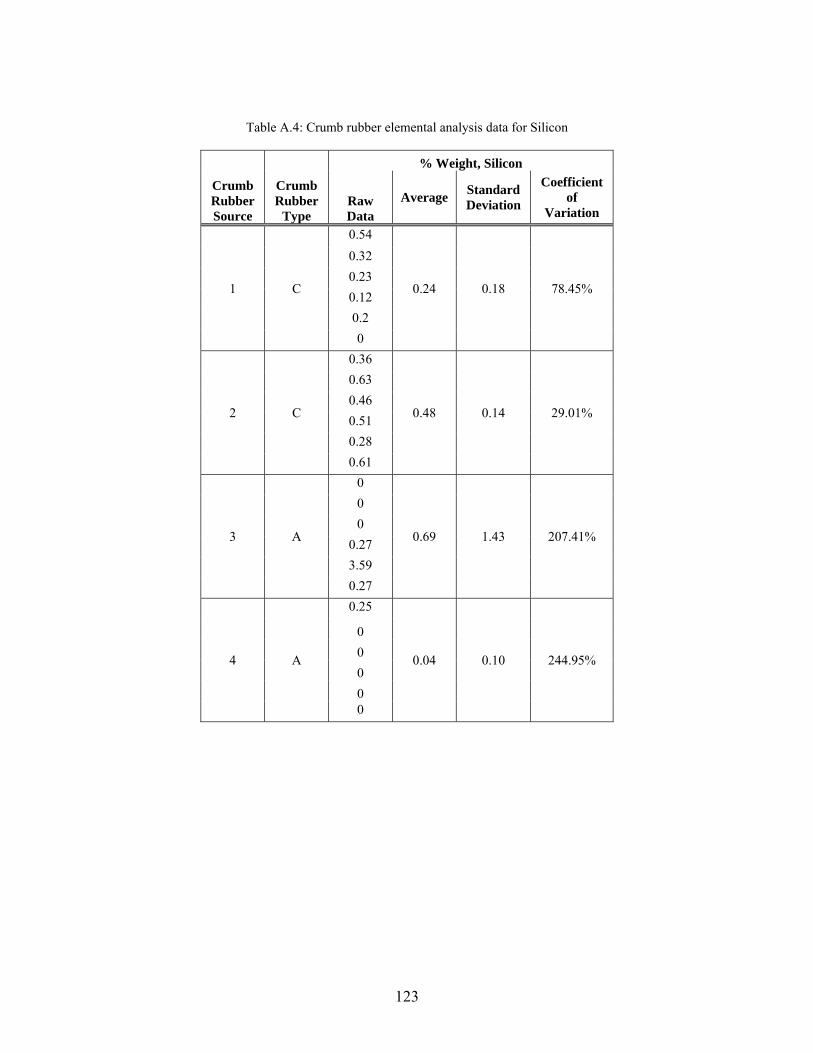
123
Table A.4: Crumb rubber elemental analysis data for Silicon
% Weight, Silicon
Crumb Rubber Source
Crumb Rubber
Type Raw Data
Average Standard Deviation
Coefficient of
Variation
1 C
0.54
0.24 0.18 78.45%
0.32 0.23 0.12 0.2 0
2 C
0.36
0.48 0.14 29.01%
0.63 0.46 0.51 0.28 0.61
3 A
0
0.69 1.43 207.41%
0 0
0.27 3.59 0.27
4 A
0.25
0.04 0.10 244.95%
0 0 0 0 0
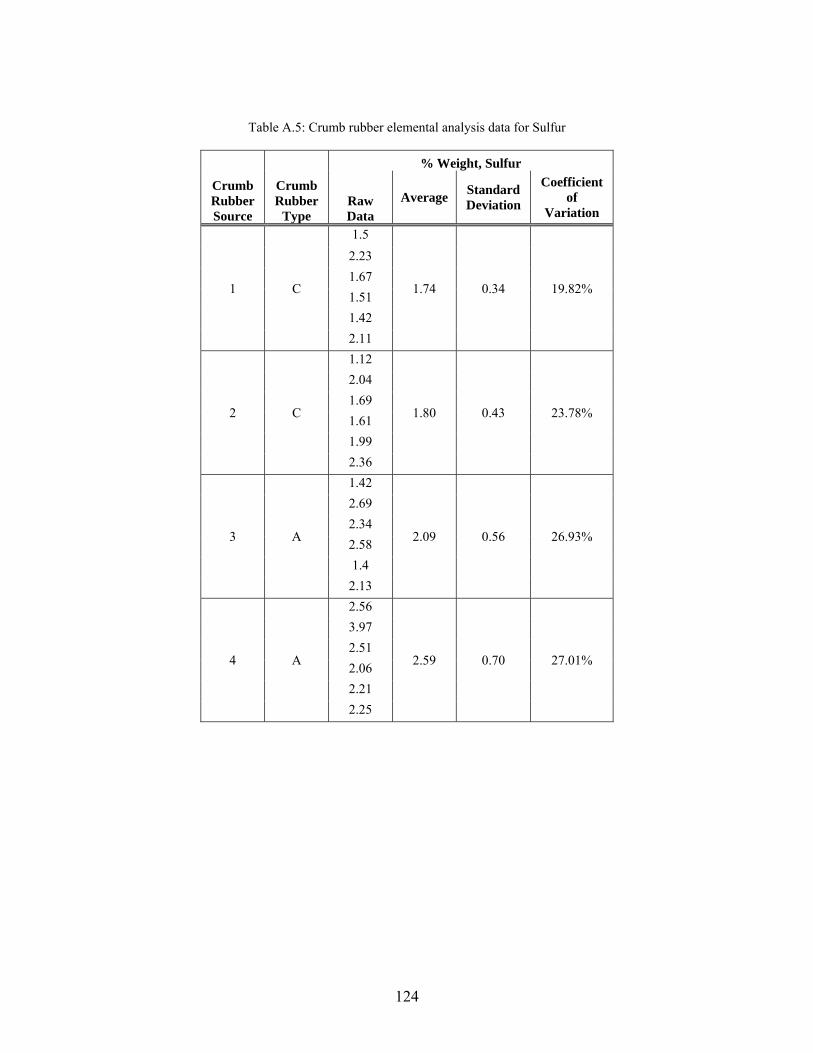
124
Table A.5: Crumb rubber elemental analysis data for Sulfur
% Weight, Sulfur
Crumb Rubber Source
Crumb Rubber
Type Raw Data
Average Standard Deviation
Coefficient of
Variation
1 C
1.5
1.74 0.34 19.82%
2.23 1.67 1.51 1.42 2.11
2 C
1.12
1.80 0.43 23.78%
2.04 1.69 1.61 1.99 2.36
3 A
1.42
2.09 0.56 26.93%
2.69 2.34 2.58 1.4
2.13
4 A
2.56
2.59 0.70 27.01%
3.97 2.51 2.06 2.21 2.25
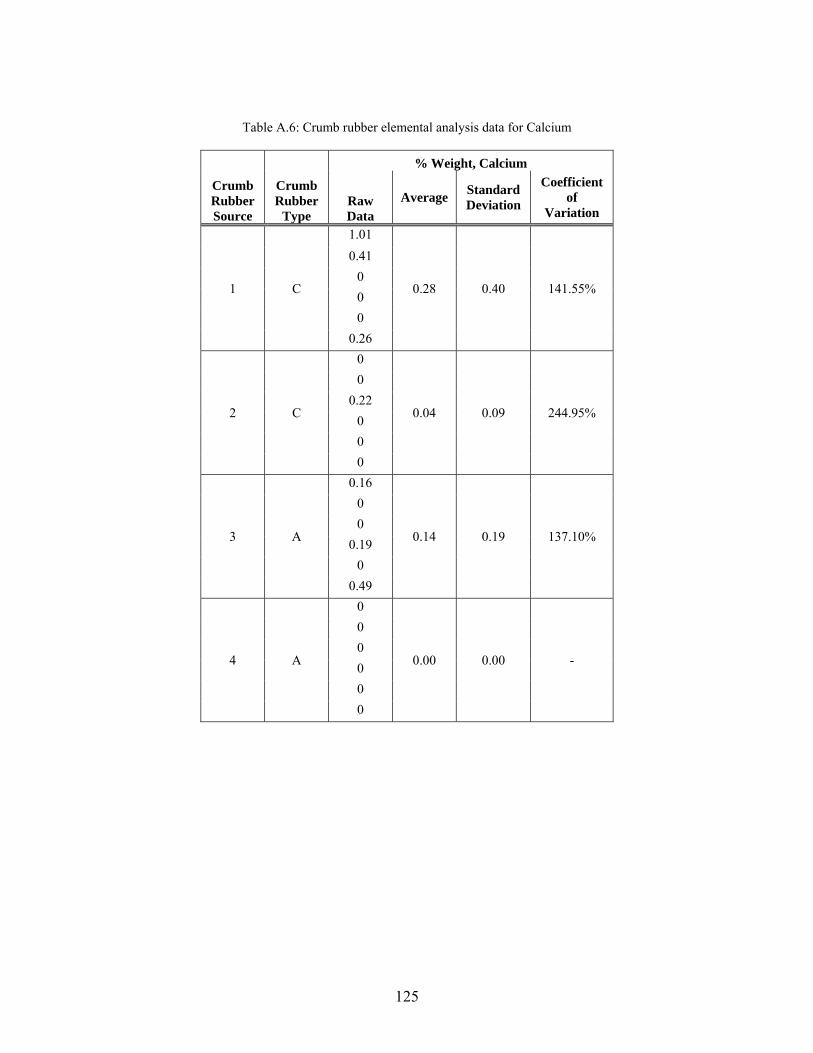
125
Table A.6: Crumb rubber elemental analysis data for Calcium
% Weight, Calcium
Crumb Rubber Source
Crumb Rubber
Type Raw Data
Average Standard Deviation
Coefficient of
Variation
1 C
1.01
0.28 0.40 141.55%
0.41 0 0 0
0.26
2 C
0
0.04 0.09 244.95%
0 0.22
0 0 0
3 A
0.16
0.14 0.19 137.10%
0 0
0.19 0
0.49
4 A
0
0.00 0.00 -
0 0 0 0 0
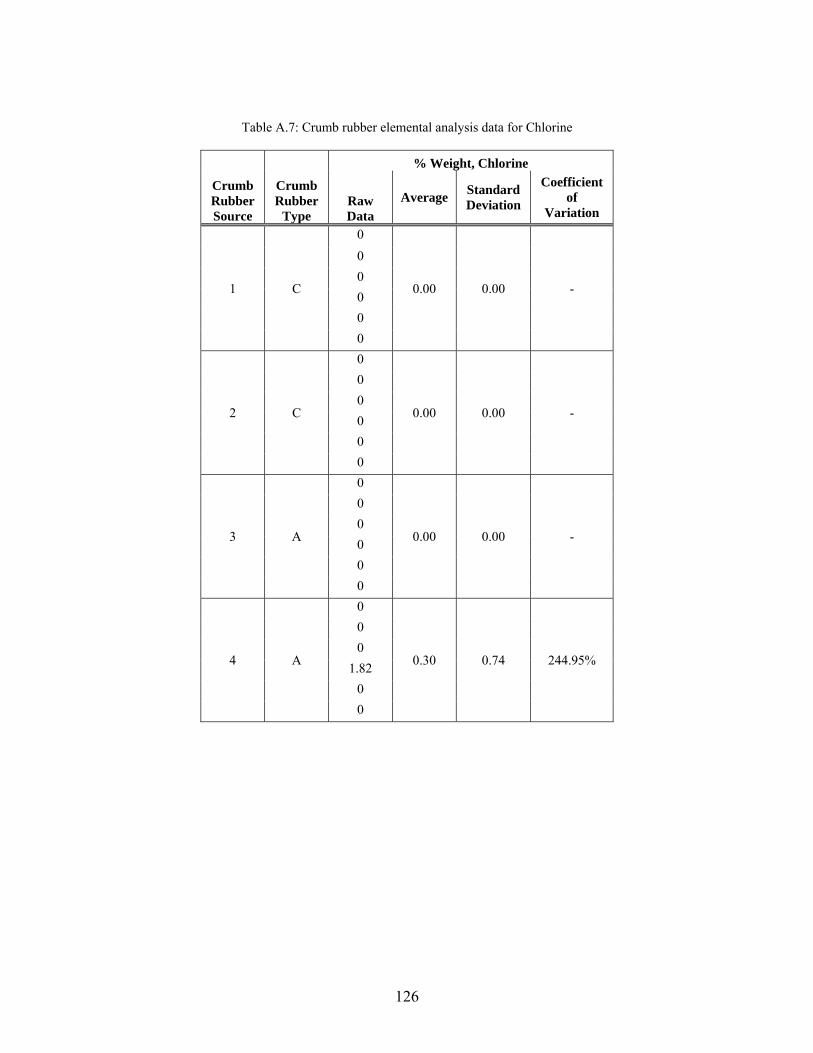
126
Table A.7: Crumb rubber elemental analysis data for Chlorine
% Weight, Chlorine
Crumb Rubber Source
Crumb Rubber
Type Raw Data
Average Standard Deviation
Coefficient of
Variation
1 C
0
0.00 0.00 -
0 0 0 0 0
2 C
0
0.00 0.00 -
0 0 0 0 0
3 A
0
0.00 0.00 -
0 0 0 0 0
4 A
0
0.30 0.74 244.95%
0 0
1.82 0 0
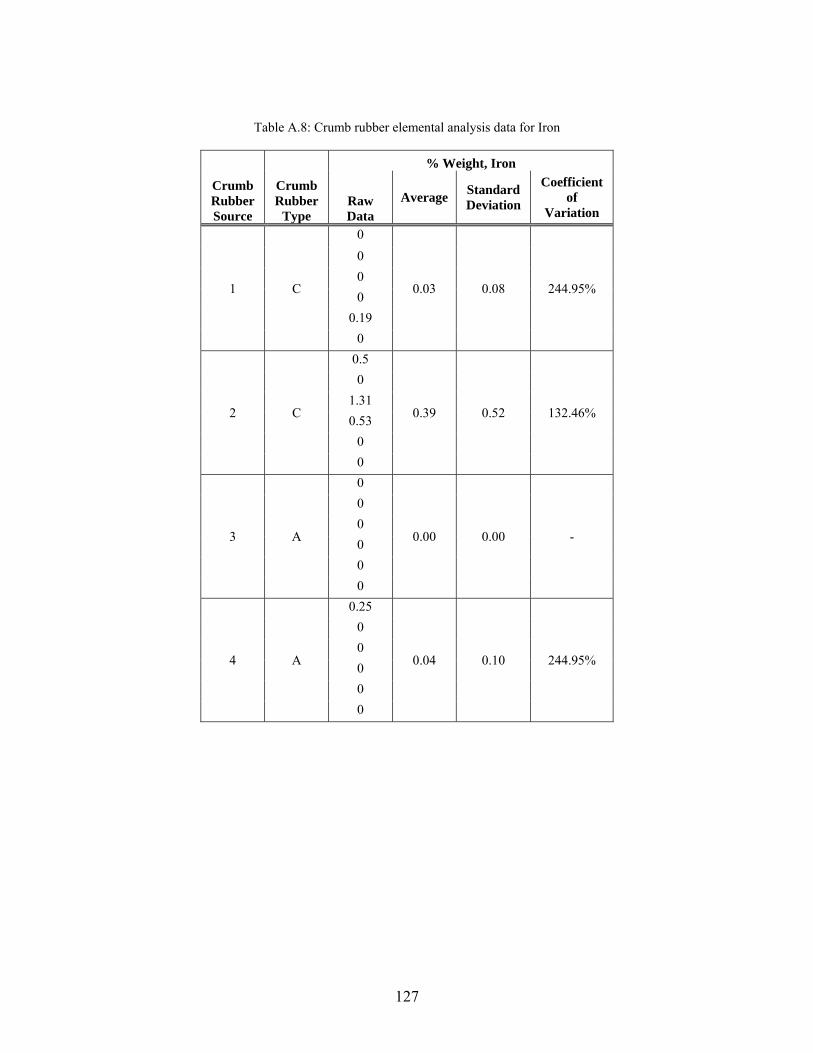
127
Table A.8: Crumb rubber elemental analysis data for Iron
% Weight, Iron
Crumb Rubber Source
Crumb Rubber
Type Raw Data
Average Standard Deviation
Coefficient of
Variation
1 C
0
0.03 0.08 244.95%
0 0 0
0.19 0
2 C
0.5
0.39 0.52 132.46%
0 1.31 0.53
0 0
3 A
0
0.00 0.00 -
0 0 0 0 0
4 A
0.25
0.04 0.10 244.95%
0 0 0 0 0
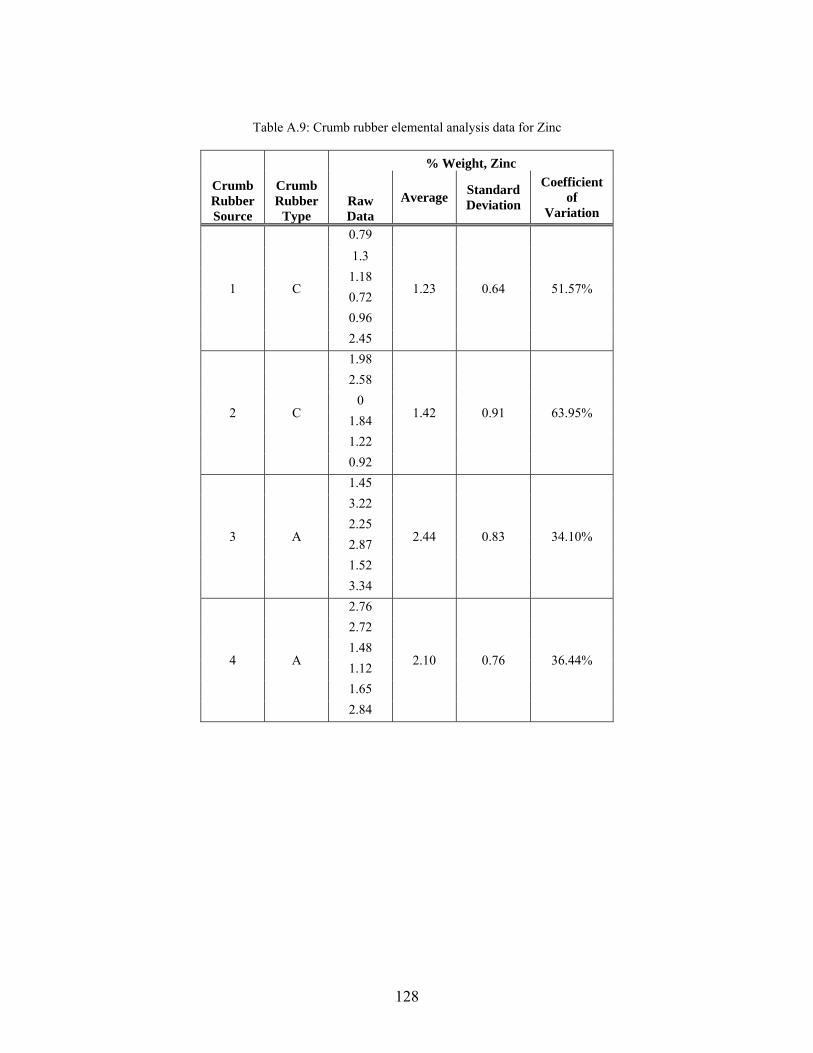
128
Table A.9: Crumb rubber elemental analysis data for Zinc
% Weight, Zinc
Crumb Rubber Source
Crumb Rubber
Type Raw Data
Average Standard Deviation
Coefficient of
Variation
1 C
0.79
1.23 0.64 51.57%
1.3 1.18 0.72 0.96 2.45
2 C
1.98
1.42 0.91 63.95%
2.58 0
1.84 1.22 0.92
3 A
1.45
2.44 0.83 34.10%
3.22 2.25 2.87 1.52 3.34
4 A
2.76
2.10 0.76 36.44%
2.72 1.48 1.12 1.65 2.84
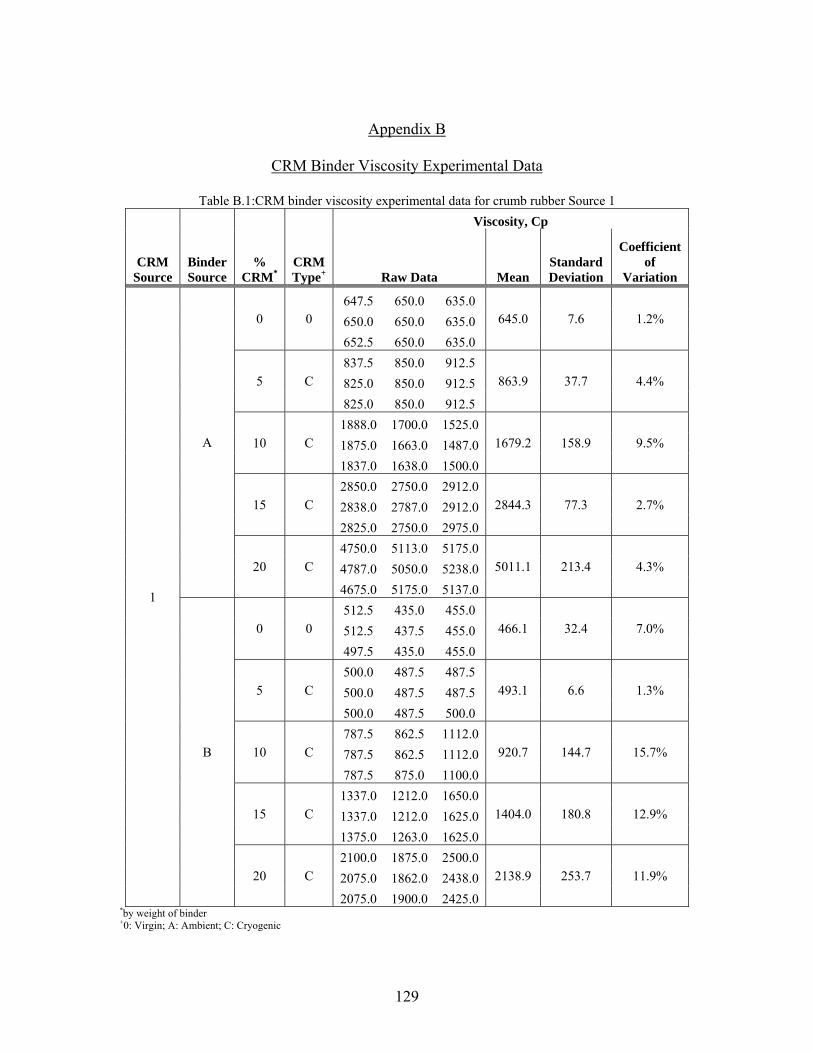
129
Appendix B
CRM Binder Viscosity Experimental Data B. S
Table B.1:CRM binder viscosity experimental data for crumb rubber Source 1
CRM Source
Binder Source
% CRM*
CRM Type+
Viscosity, Cp
Raw Data Mean Standard Deviation
Coefficient of
Variation
1
A
0 0 647.5 650.0 635.0
645.0 7.6 1.2% 650.0 650.0 635.0 652.5 650.0 635.0
5 C 837.5 850.0 912.5
863.9 37.7 4.4% 825.0 850.0 912.5 825.0 850.0 912.5
10 C 1888.0 1700.0 1525.0
1679.2 158.9 9.5% 1875.0 1663.0 1487.0 1837.0 1638.0 1500.0
15 C 2850.0 2750.0 2912.0
2844.3 77.3 2.7% 2838.0 2787.0 2912.0 2825.0 2750.0 2975.0
20 C 4750.0 5113.0 5175.0
5011.1 213.4 4.3% 4787.0 5050.0 5238.0 4675.0 5175.0 5137.0
B
0 0 512.5 435.0 455.0
466.1 32.4 7.0% 512.5 437.5 455.0 497.5 435.0 455.0
5 C 500.0 487.5 487.5
493.1 6.6 1.3% 500.0 487.5 487.5 500.0 487.5 500.0
10 C 787.5 862.5 1112.0
920.7 144.7 15.7% 787.5 862.5 1112.0 787.5 875.0 1100.0
15 C 1337.0 1212.0 1650.0
1404.0 180.8 12.9% 1337.0 1212.0 1625.0 1375.0 1263.0 1625.0
20 C 2100.0 1875.0 2500.0
2138.9 253.7 11.9% 2075.0 1862.0 2438.0 2075.0 1900.0 2425.0
*by weight of binder +0: Virgin; A: Ambient; C: Cryogenic
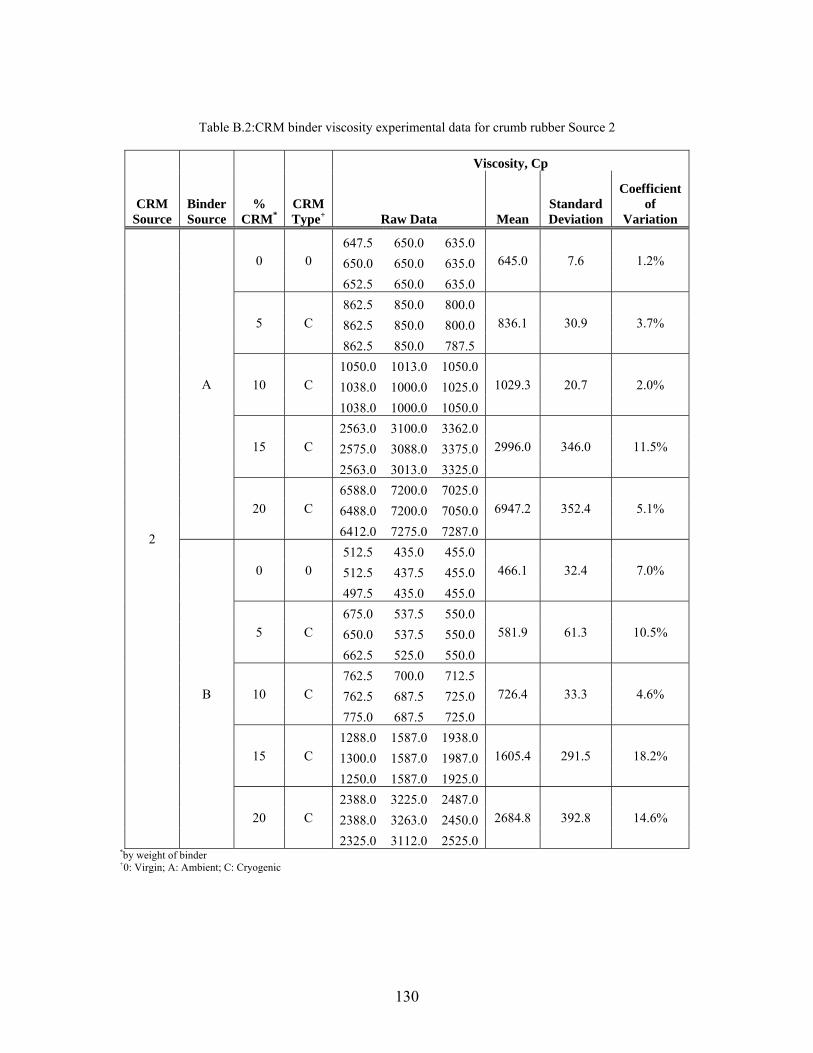
130
Table B.2:CRM binder viscosity experimental data for crumb rubber Source 2
CRM Source
Binder Source
% CRM*
CRM Type+
Viscosity, Cp
Raw Data Mean Standard Deviation
Coefficient of
Variation
2
A
0 0 647.5 650.0 635.0
645.0 7.6 1.2% 650.0 650.0 635.0 652.5 650.0 635.0
5 C 862.5 850.0 800.0
836.1 30.9 3.7% 862.5 850.0 800.0 862.5 850.0 787.5
10 C 1050.0 1013.0 1050.0
1029.3 20.7 2.0% 1038.0 1000.0 1025.0 1038.0 1000.0 1050.0
15 C 2563.0 3100.0 3362.0
2996.0 346.0 11.5% 2575.0 3088.0 3375.0 2563.0 3013.0 3325.0
20 C 6588.0 7200.0 7025.0
6947.2 352.4 5.1% 6488.0 7200.0 7050.0 6412.0 7275.0 7287.0
B
0 0 512.5 435.0 455.0
466.1 32.4 7.0% 512.5 437.5 455.0 497.5 435.0 455.0
5 C 675.0 537.5 550.0
581.9 61.3 10.5% 650.0 537.5 550.0 662.5 525.0 550.0
10 C 762.5 700.0 712.5
726.4 33.3 4.6% 762.5 687.5 725.0 775.0 687.5 725.0
15 C 1288.0 1587.0 1938.0
1605.4 291.5 18.2% 1300.0 1587.0 1987.0 1250.0 1587.0 1925.0
20 C 2388.0 3225.0 2487.0
2684.8 392.8 14.6% 2388.0 3263.0 2450.0 2325.0 3112.0 2525.0
*by weight of binder +0: Virgin; A: Ambient; C: Cryogenic

131
Table B.3: CRM binder viscosity experimental data for CRM Source 3
CRM Source
Binder Source
% CRM*
CRM Type+
Viscosity, Cp
Raw Data Mean Standard Deviation
Coefficient of
Variation
3
A
0 0 647.5 650.0 635.0
645.0 7.6 1.2% 650.0 650.0 635.0 652.5 650.0 635.0
5 A 962.5 875.0 1000.0
943.1 52.7 5.6% 962.5 875.0 987.5 962.5 875.0 987.5
10 A 2750.0 2625.0 3263.0
2861.2 302.5 10.6% 2737.0 2588.0 3213.0 2725.0 2563.0 3287.0
15 A 4350.0 4313.0 4488.0
4384.9 112.9 2.6% 4325.0 4300.0 4600.0 4338.0 4262.0 4488.0
20 A 10450.0 12213.0 11000.0
11208.3 723.9 6.5% 10362.0 12062.0 11000.0 10700.0 12088.0 11000.0
B
0 0 512.5 435.0 455.0
466.1 32.4 7.0% 512.5 437.5 455.0 497.5 435.0 455.0
5 A 612.5 550.0 575.0
579.2 27.2 4.7% 612.5 550.0 575.0 612.5 550.0 575.0
10 A 1150.0 1087.0 1438.0
1214.0 151.9 12.5% 1125.0 1100.0 1388.0 1150.0 1075.0 1413.0
15 A 1788.0 2775.0 2825.0
2450.0 497.5 20.3% 1775.0 2750.0 2813.0 1800.0 2737.0 2787.0
20 A 6938.0 6775.0 7412.0
6954.3 221.5 3.2% 6813.0 6813.0 7113.0 6775.0 6813.0 7137.0
*by weight of binder +0: Virgin; A: Ambient; C: Cryogenic
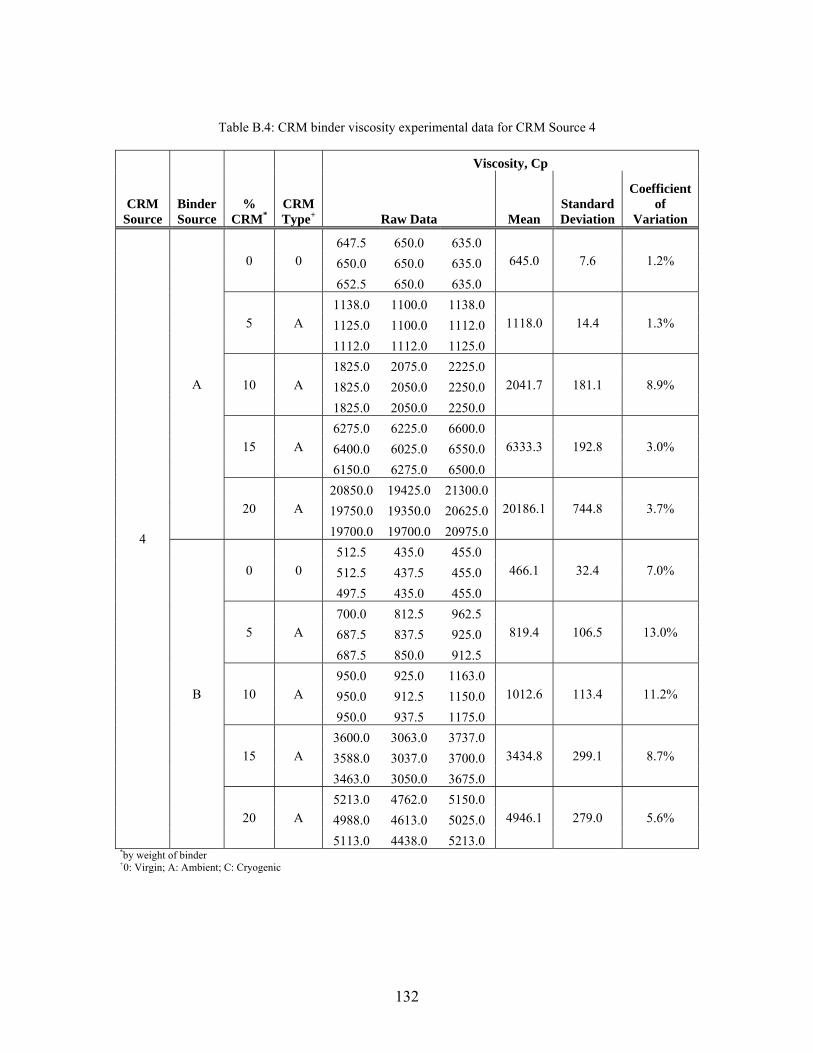
132
Table B.4: CRM binder viscosity experimental data for CRM Source 4
CRM Source
Binder Source
% CRM*
CRM Type+
Viscosity, Cp
Raw Data Mean Standard Deviation
Coefficient of
Variation
4
A
0 0 647.5 650.0 635.0
645.0 7.6 1.2% 650.0 650.0 635.0 652.5 650.0 635.0
5 A 1138.0 1100.0 1138.0
1118.0 14.4 1.3% 1125.0 1100.0 1112.0 1112.0 1112.0 1125.0
10 A 1825.0 2075.0 2225.0
2041.7 181.1 8.9% 1825.0 2050.0 2250.0 1825.0 2050.0 2250.0
15 A 6275.0 6225.0 6600.0
6333.3 192.8 3.0% 6400.0 6025.0 6550.0 6150.0 6275.0 6500.0
20 A 20850.0 19425.0 21300.0
20186.1 744.8 3.7% 19750.0 19350.0 20625.0 19700.0 19700.0 20975.0
B
0 0 512.5 435.0 455.0
466.1 32.4 7.0% 512.5 437.5 455.0 497.5 435.0 455.0
5 A 700.0 812.5 962.5
819.4 106.5 13.0% 687.5 837.5 925.0 687.5 850.0 912.5
10 A 950.0 925.0 1163.0
1012.6 113.4 11.2% 950.0 912.5 1150.0 950.0 937.5 1175.0
15 A 3600.0 3063.0 3737.0
3434.8 299.1 8.7% 3588.0 3037.0 3700.0 3463.0 3050.0 3675.0
20 A 5213.0 4762.0 5150.0
4946.1 279.0 5.6% 4988.0 4613.0 5025.0 5113.0 4438.0 5213.0
*by weight of binder +0: Virgin; A: Ambient; C: Cryogenic
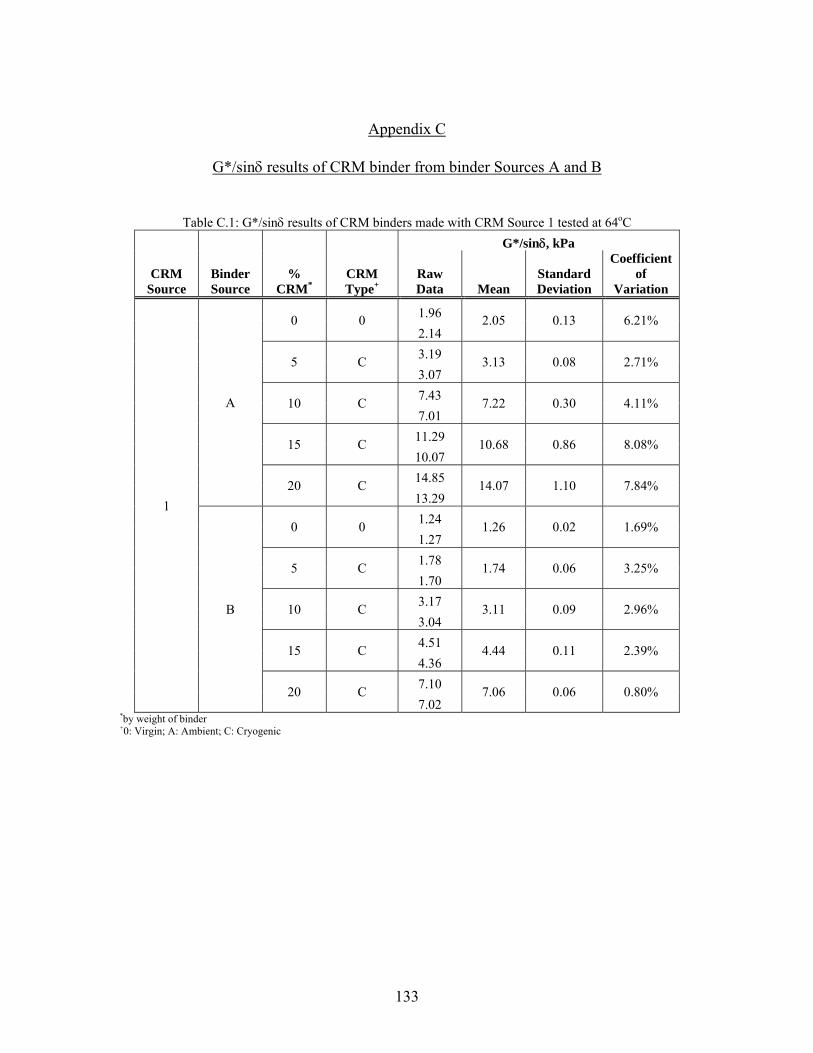
133
Appendix C
G*/sinδ results of CRM binder from binder Sources A and B
C. S Table C.1: G*/sinδ results of CRM binders made with CRM Source 1 tested at 64oC
G*/sinδ, kPa
CRM Source
Binder Source
% CRM*
CRM Type+
Raw Data Mean
Standard Deviation
Coefficient of
Variation
1
A
0 0 1.96 2.05 0.13 6.21% 2.14
5 C 3.19 3.13 0.08 2.71% 3.07
10 C 7.43 7.22 0.30 4.11% 7.01
15 C 11.29 10.68 0.86 8.08% 10.07
20 C 14.85 14.07 1.10 7.84% 13.29
B
0 0 1.24 1.26 0.02 1.69% 1.27
5 C 1.78 1.74 0.06 3.25% 1.70
10 C 3.17 3.11 0.09 2.96% 3.04
15 C 4.51 4.44 0.11 2.39% 4.36
20 C 7.10 7.06 0.06 0.80% 7.02
*by weight of binder +0: Virgin; A: Ambient; C: Cryogenic
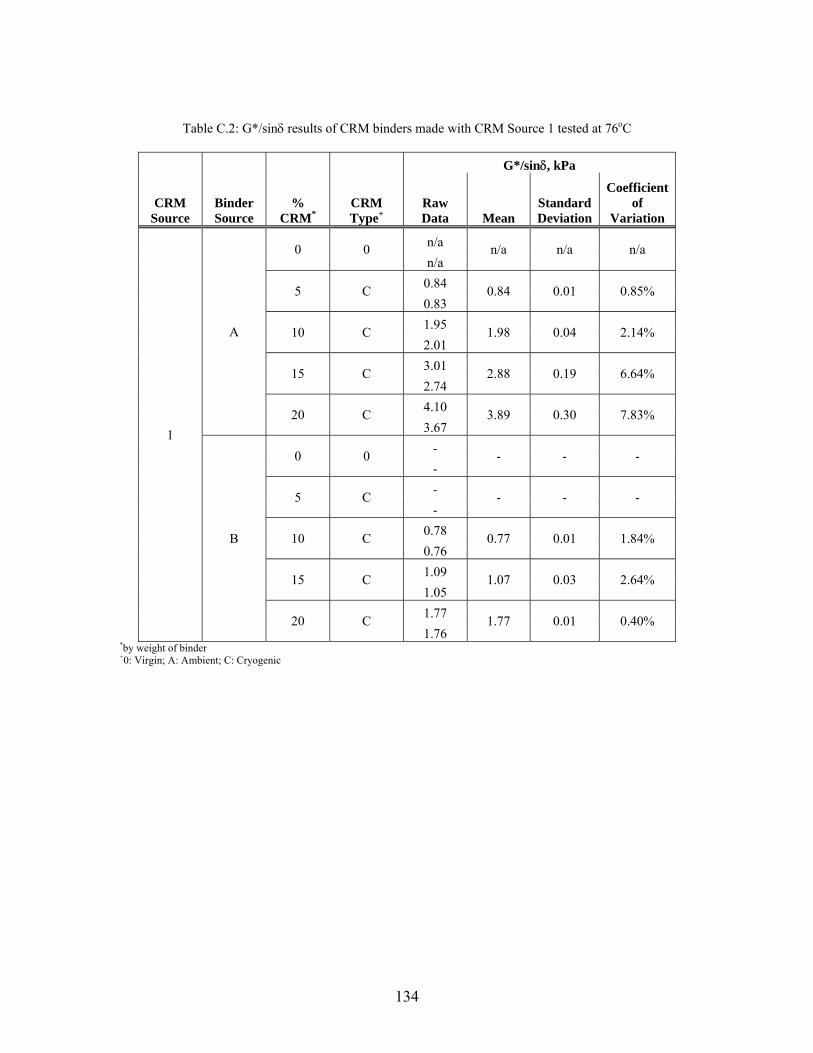
134
Table C.2: G*/sinδ results of CRM binders made with CRM Source 1 tested at 76oC
G*/sinδ, kPa
CRM Source
Binder Source
% CRM*
CRM Type+
Raw Data Mean
Standard Deviation
Coefficient of
Variation
1
A
0 0 n/a n/a n/a n/a n/a
5 C 0.84 0.84 0.01 0.85% 0.83
10 C 1.95 1.98 0.04 2.14% 2.01
15 C 3.01 2.88 0.19 6.64% 2.74
20 C 4.10 3.89 0.30 7.83% 3.67
B
0 0 - - - - -
5 C - - - - -
10 C 0.78 0.77 0.01 1.84% 0.76
15 C 1.09 1.07 0.03 2.64% 1.05
20 C 1.77 1.77 0.01 0.40% 1.76
*by weight of binder +0: Virgin; A: Ambient; C: Cryogenic
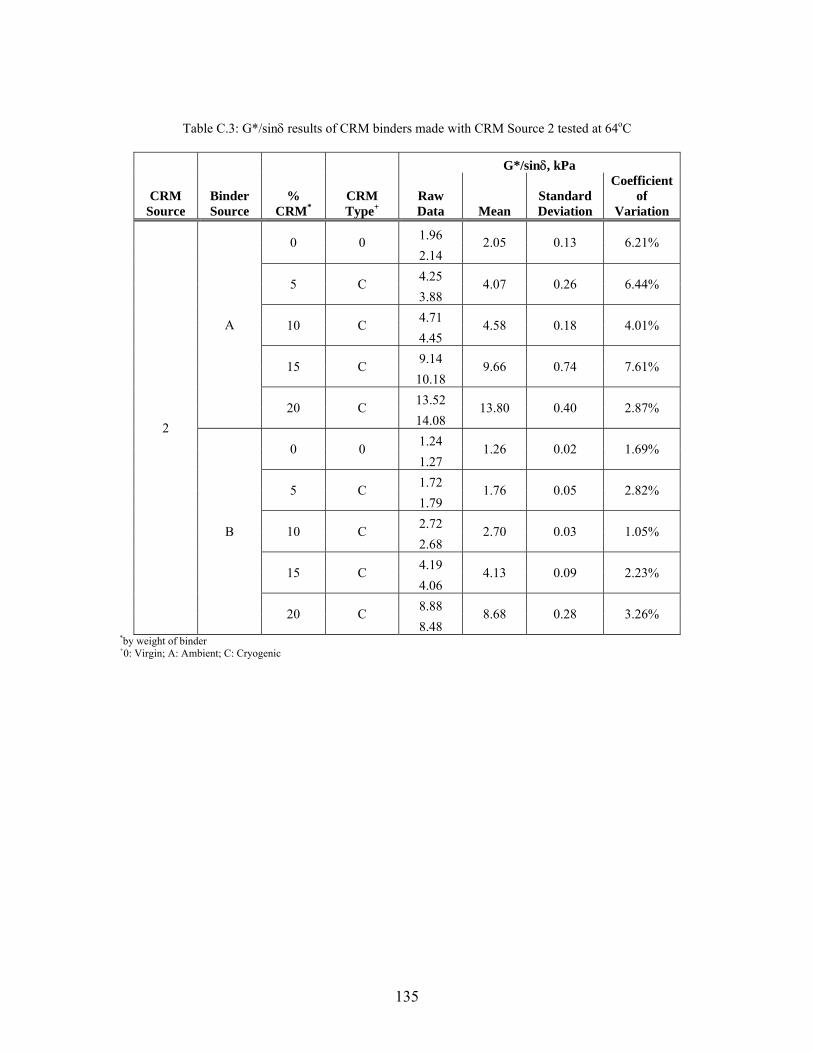
135
Table C.3: G*/sinδ results of CRM binders made with CRM Source 2 tested at 64oC
G*/sinδ, kPa
CRM Source
Binder Source
% CRM*
CRM Type+
Raw Data Mean
Standard Deviation
Coefficient of
Variation
2
A
0 0 1.96 2.05 0.13 6.21% 2.14
5 C 4.25 4.07 0.26 6.44% 3.88
10 C 4.71 4.58 0.18 4.01% 4.45
15 C 9.14 9.66 0.74 7.61% 10.18
20 C 13.52 13.80 0.40 2.87% 14.08
B
0 0 1.24 1.26 0.02 1.69% 1.27
5 C 1.72 1.76 0.05 2.82% 1.79
10 C 2.72 2.70 0.03 1.05% 2.68
15 C 4.19 4.13 0.09 2.23% 4.06
20 C 8.88 8.68 0.28 3.26% 8.48
*by weight of binder +0: Virgin; A: Ambient; C: Cryogenic
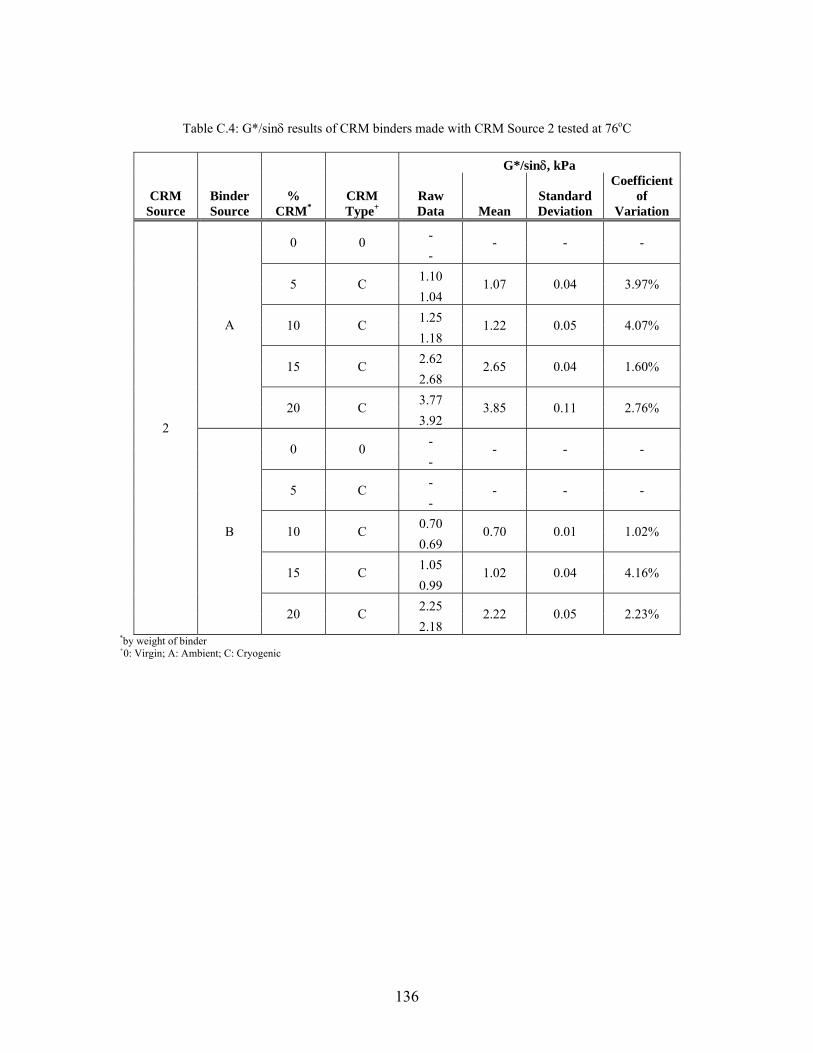
136
Table C.4: G*/sinδ results of CRM binders made with CRM Source 2 tested at 76oC
G*/sinδ, kPa
CRM Source
Binder Source
% CRM*
CRM Type+
Raw Data Mean
Standard Deviation
Coefficient of
Variation
2
A
0 0 - - - - -
5 C 1.10 1.07 0.04 3.97% 1.04
10 C 1.25 1.22 0.05 4.07% 1.18
15 C 2.62 2.65 0.04 1.60% 2.68
20 C 3.77 3.85 0.11 2.76% 3.92
B
0 0 - - - - -
5 C - - - - -
10 C 0.70 0.70 0.01 1.02% 0.69
15 C 1.05 1.02 0.04 4.16% 0.99
20 C 2.25 2.22 0.05 2.23% 2.18
*by weight of binder +0: Virgin; A: Ambient; C: Cryogenic
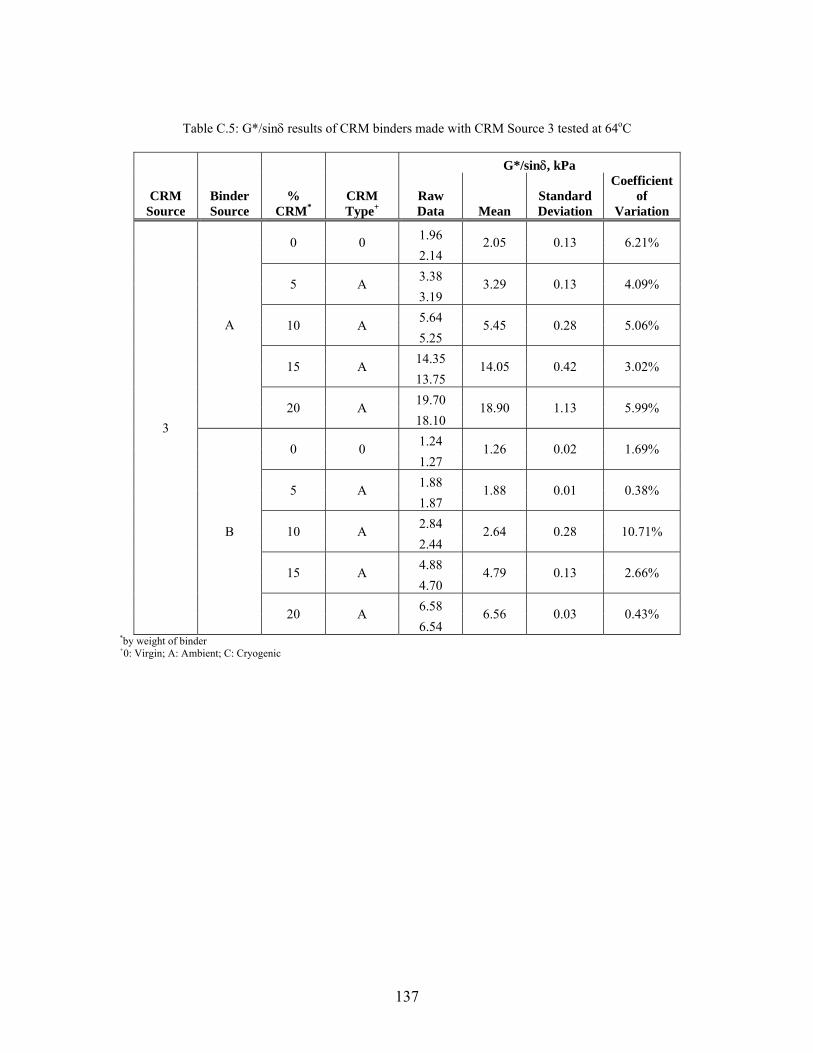
137
Table C.5: G*/sinδ results of CRM binders made with CRM Source 3 tested at 64oC
G*/sinδ, kPa
CRM Source
Binder Source
% CRM*
CRM Type+
Raw Data Mean
Standard Deviation
Coefficient of
Variation
3
A
0 0 1.96 2.05 0.13 6.21% 2.14
5 A 3.38 3.29 0.13 4.09% 3.19
10 A 5.64 5.45 0.28 5.06% 5.25
15 A 14.35 14.05 0.42 3.02% 13.75
20 A 19.70 18.90 1.13 5.99% 18.10
B
0 0 1.24 1.26 0.02 1.69% 1.27
5 A 1.88 1.88 0.01 0.38% 1.87
10 A 2.84 2.64 0.28 10.71% 2.44
15 A 4.88 4.79 0.13 2.66% 4.70
20 A 6.58 6.56 0.03 0.43% 6.54
*by weight of binder +0: Virgin; A: Ambient; C: Cryogenic
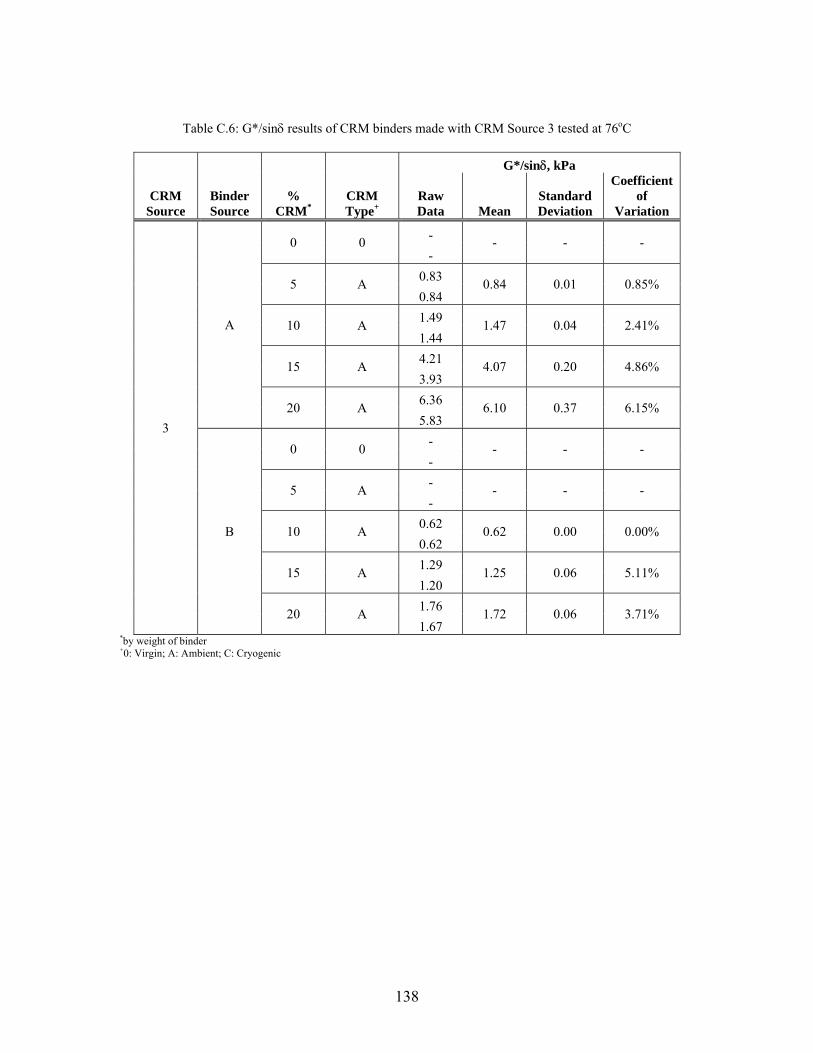
138
Table C.6: G*/sinδ results of CRM binders made with CRM Source 3 tested at 76oC
G*/sinδ, kPa
CRM Source
Binder Source
% CRM*
CRM Type+
Raw Data Mean
Standard Deviation
Coefficient of
Variation
3
A
0 0 - - - - -
5 A 0.83 0.84 0.01 0.85% 0.84
10 A 1.49 1.47 0.04 2.41% 1.44
15 A 4.21 4.07 0.20 4.86% 3.93
20 A 6.36 6.10 0.37 6.15% 5.83
B
0 0 - - - - -
5 A - - - - -
10 A 0.62 0.62 0.00 0.00% 0.62
15 A 1.29 1.25 0.06 5.11% 1.20
20 A 1.76 1.72 0.06 3.71% 1.67
*by weight of binder +0: Virgin; A: Ambient; C: Cryogenic
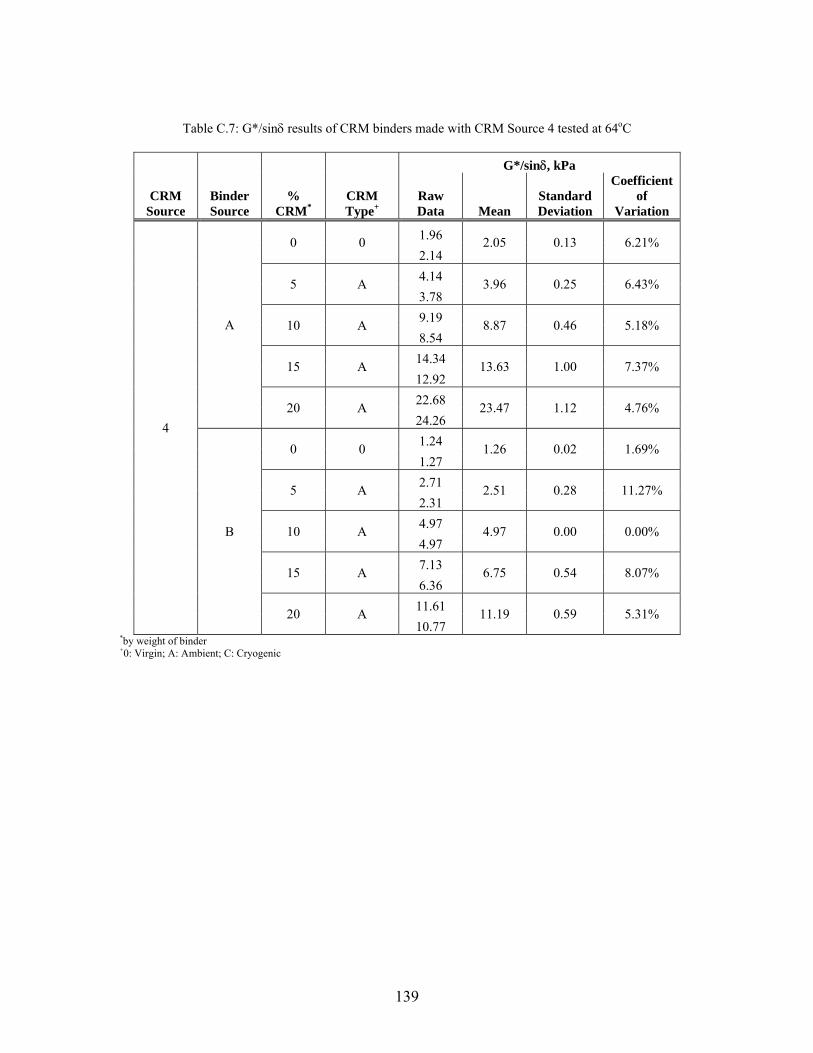
139
Table C.7: G*/sinδ results of CRM binders made with CRM Source 4 tested at 64oC
G*/sinδ, kPa
CRM Source
Binder Source
% CRM*
CRM Type+
Raw Data Mean
Standard Deviation
Coefficient of
Variation
4
A
0 0 1.96 2.05 0.13 6.21% 2.14
5 A 4.14 3.96 0.25 6.43% 3.78
10 A 9.19 8.87 0.46 5.18% 8.54
15 A 14.34 13.63 1.00 7.37% 12.92
20 A 22.68 23.47 1.12 4.76% 24.26
B
0 0 1.24 1.26 0.02 1.69% 1.27
5 A 2.71 2.51 0.28 11.27% 2.31
10 A 4.97 4.97 0.00 0.00% 4.97
15 A 7.13 6.75 0.54 8.07% 6.36
20 A 11.61 11.19 0.59 5.31% 10.77
*by weight of binder +0: Virgin; A: Ambient; C: Cryogenic

140
Table C.8: G*/sinδ results of CRM binders made with CRM Source 4 tested at 76oC
G*/sinδ, kPa
CRM Source
Binder Source
% CRM*
CRM Type+
Raw Data Mean
Standard Deviation
Coefficient of
Variation
4
A
0 0 - - - - -
5 A 1.09 1.05 0.06 6.09% 1.00
10 A 2.75 2.61 0.21 7.87% 2.46
15 A 3.99 4.02 0.04 1.06% 4.05
20 A 7.27 7.02 0.35 5.04% 6.77
B
0 0 - - - - -
5 A 0.73 0.65 0.12 18.64% 0.56
10 A 1.32 1.31 0.01 1.08% 1.30
15 A 1.87 1.77 0.14 7.99% 1.67
20 A 3.14 3.07 0.11 3.46% 2.99
*by weight of binder +0: Virgin; A: Ambient; C: Cryogenic
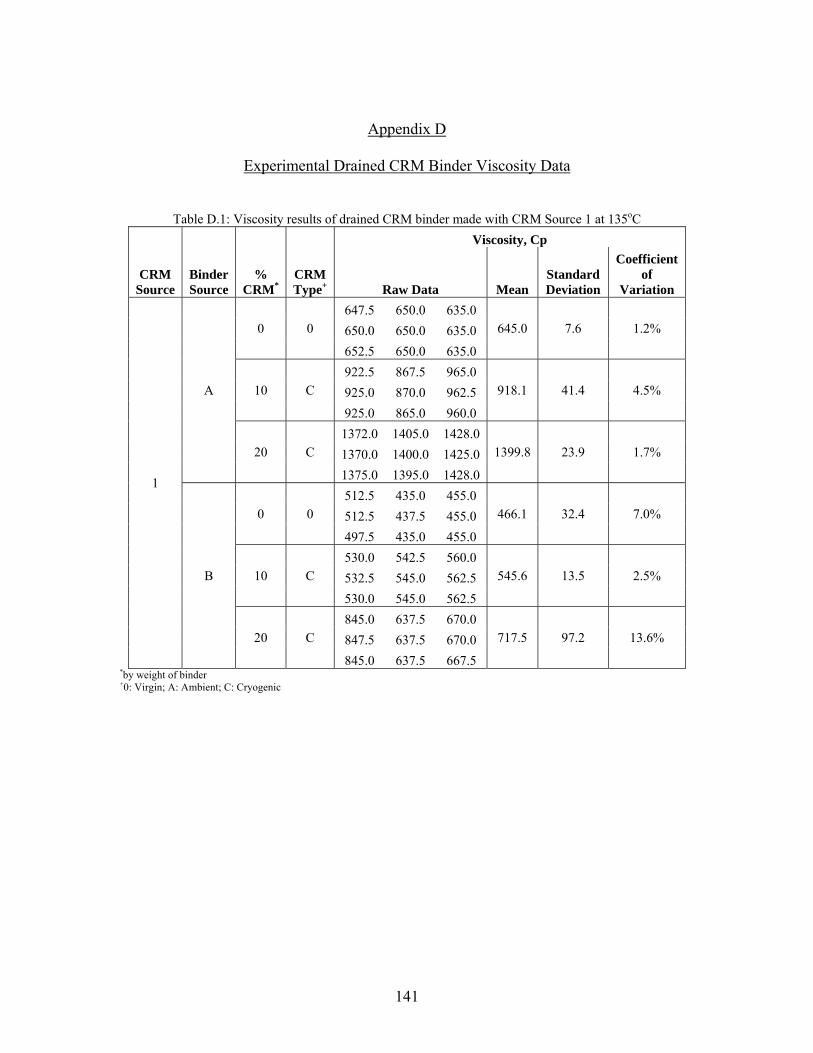
141
Appendix D
Experimental Drained CRM Binder Viscosity Data
D. S Table D.1: Viscosity results of drained CRM binder made with CRM Source 1 at 135oC
Viscosity, Cp
CRM Source
Binder Source
% CRM*
CRM Type+ Raw Data Mean
Standard Deviation
Coefficient of
Variation
1
A
0 0 647.5 650.0 635.0
645.0 7.6 1.2% 650.0 650.0 635.0 652.5 650.0 635.0
10 C 922.5 867.5 965.0
918.1 41.4 4.5% 925.0 870.0 962.5 925.0 865.0 960.0
20 C 1372.0 1405.0 1428.0
1399.8 23.9 1.7% 1370.0 1400.0 1425.0 1375.0 1395.0 1428.0
B
0 0 512.5 435.0 455.0
466.1 32.4 7.0% 512.5 437.5 455.0 497.5 435.0 455.0
10 C 530.0 542.5 560.0
545.6 13.5 2.5% 532.5 545.0 562.5 530.0 545.0 562.5
20 C 845.0 637.5 670.0
717.5 97.2 13.6% 847.5 637.5 670.0 845.0 637.5 667.5
*by weight of binder +0: Virgin; A: Ambient; C: Cryogenic
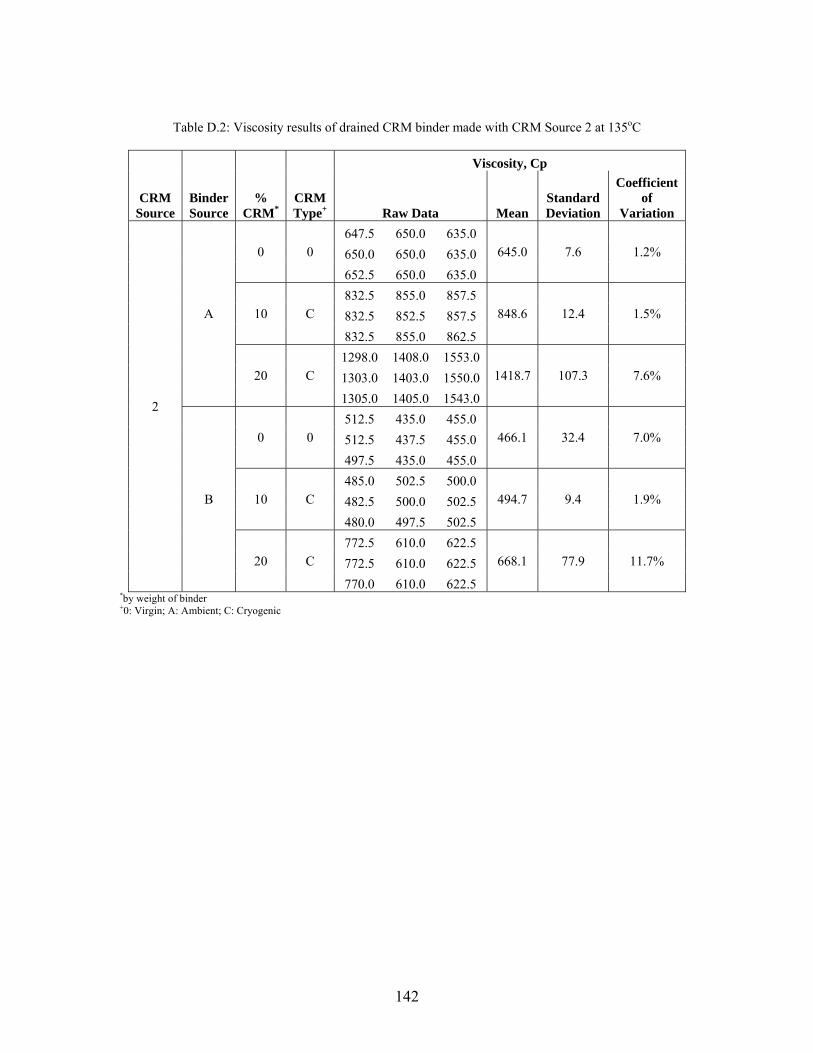
142
Table D.2: Viscosity results of drained CRM binder made with CRM Source 2 at 135oC
Viscosity, Cp
CRM Source
Binder Source
% CRM*
CRM Type+ Raw Data Mean
Standard Deviation
Coefficient of
Variation
2
A
0 0 647.5 650.0 635.0
645.0 7.6 1.2% 650.0 650.0 635.0 652.5 650.0 635.0
10 C 832.5 855.0 857.5
848.6 12.4 1.5% 832.5 852.5 857.5 832.5 855.0 862.5
20 C 1298.0 1408.0 1553.0
1418.7 107.3 7.6% 1303.0 1403.0 1550.0 1305.0 1405.0 1543.0
B
0 0 512.5 435.0 455.0
466.1 32.4 7.0% 512.5 437.5 455.0 497.5 435.0 455.0
10 C 485.0 502.5 500.0
494.7 9.4 1.9% 482.5 500.0 502.5 480.0 497.5 502.5
20 C 772.5 610.0 622.5
668.1 77.9 11.7% 772.5 610.0 622.5 770.0 610.0 622.5
*by weight of binder +0: Virgin; A: Ambient; C: Cryogenic

143
Table D.3: Viscosity results of drained CRM binder made with CRM Source 3 at 135oC
Viscosity, Cp
CRM Source
Binder Source
% CRM*
CRM Type+ Raw Data Mean
Standard Deviation
Coefficient of
Variation
3
A
0 0 647.5 650.0 635.0
645.0 7.6 1.2% 650.0 650.0 635.0 652.5 650.0 635.0
10 A 837.5 857.5 965.0
888.9 60.4 6.8% 837.5 860.0 970.0 840.0 862.5 970.0
20 A 1275.0 1265.0 1290.0
1275.6 10.8 0.8% 1280.0 1265.0 1286.0 1278.0 1258.0 1283.0
B
0 0 512.5 435.0 455.0
466.1 32.4 7.0% 512.5 437.5 455.0 497.5 435.0 455.0
10 A 485.0 490.0 495.0
489.4 3.3 0.7% 487.5 487.5 492.5 487.5 487.5 492.5
20 A 617.5 630.0 797.5
681.9 85.5 12.5% 620.0 630.0 795.0 622.5 630.0 795.0
*by weight of binder +0: Virgin; A: Ambient; C: Cryogenic

144
Table D.4: Viscosity results of drained CRM binder made with CRM Source 4 at 135oC
Viscosity, Cp
CRM Source
Binder Source
% CRM*
CRM Type+ Raw Data Mean
Standard Deviation
Coefficient of
Variation
2
A
0 0 647.5 650.0 635.0
645.0 7.6 1.2% 650.0 650.0 635.0 652.5 650.0 635.0
10 A 1025.0 955.0 920.0
966.1 43.5 4.5% 1020.0 950.0 925.0 1020.0 952.5 927.5
20 A 1533.0 1615.0 1740.0
1626.8 92.8 5.7% 1528.0 1610.0 1737.0 1523.0 1610.0 1745.0
B
0 0 512.5 435.0 455.0
466.1 32.4 7.0% 512.5 437.5 455.0 497.5 435.0 455.0
10 A 472.5 475.0 485.0
477.5 6.7 1.4% 470.0 475.0 485.0 470.0 477.5 487.5
20 A 677.5 702.5 705.0
694.2 13.8 2.0% 675.0 702.5 702.5 675.0 705.0 702.5
*by weight of binder +0: Virgin; A: Ambient; C: Cryogenic
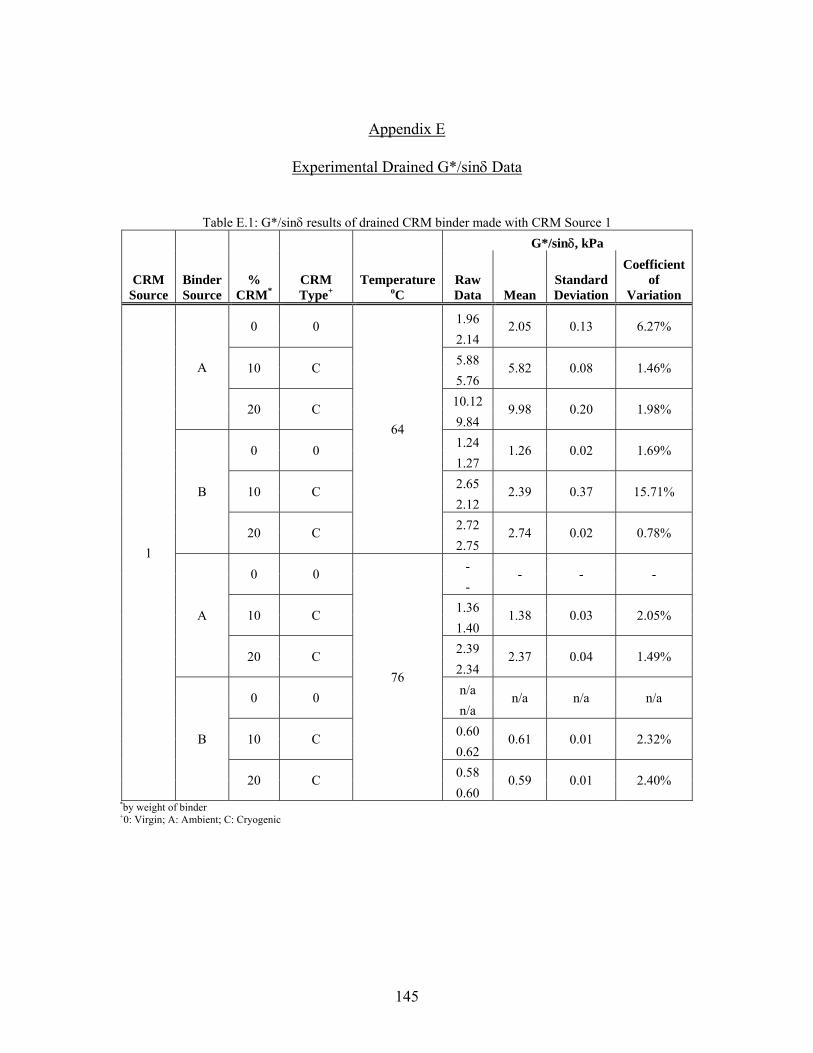
145
Appendix E
Experimental Drained G*/sinδ Data
E. S Table E.1: G*/sinδ results of drained CRM binder made with CRM Source 1
G*/sinδ, kPa
CRM Source
Binder Source
% CRM*
CRM Type+
Temperature oC
Raw Data Mean
Standard Deviation
Coefficient of
Variation
1
A
0 0
64
1.96 2.05 0.13 6.27% 2.14
10 C 5.88 5.82 0.08 1.46% 5.76
20 C 10.12 9.98 0.20 1.98% 9.84
B
0 0 1.24 1.26 0.02 1.69% 1.27
10 C 2.65 2.39 0.37 15.71% 2.12
20 C 2.72 2.74 0.02 0.78% 2.75
A
0 0
76
- - - - -
10 C 1.36 1.38 0.03 2.05% 1.40
20 C 2.39 2.37 0.04 1.49% 2.34
B
0 0 n/a n/a n/a n/a n/a
10 C 0.60 0.61 0.01 2.32% 0.62
20 C 0.58 0.59 0.01 2.40% 0.60
*by weight of binder +0: Virgin; A: Ambient; C: Cryogenic
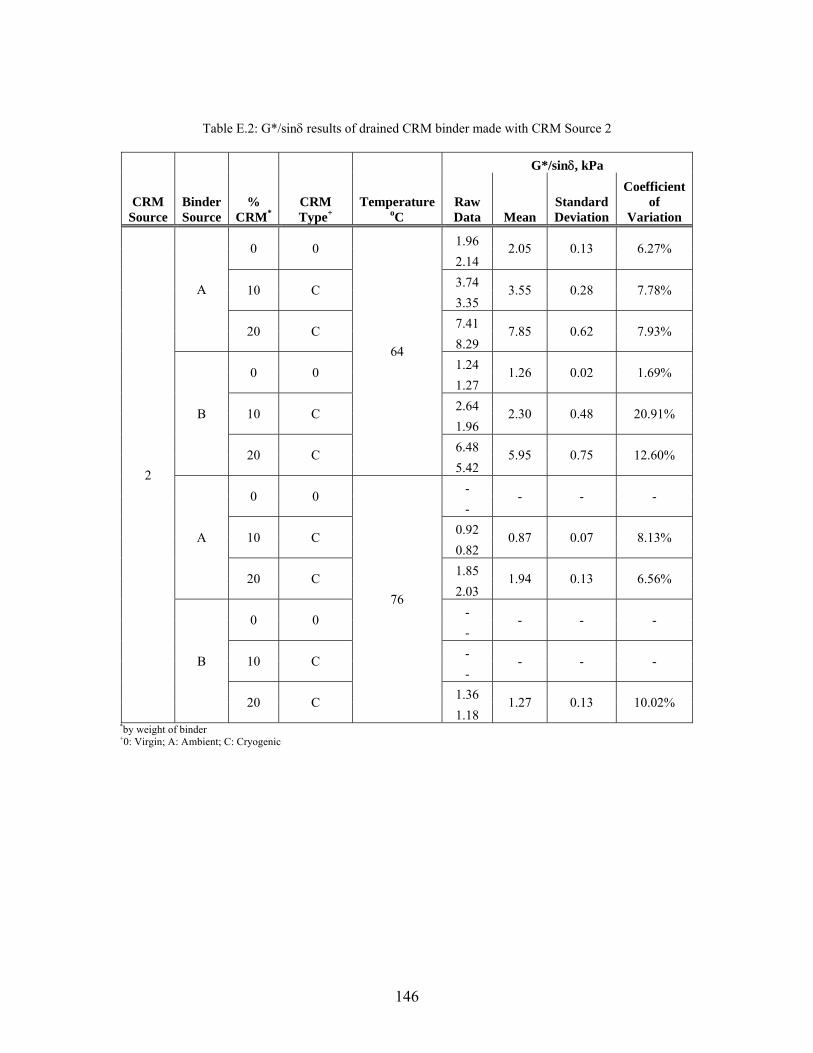
146
Table E.2: G*/sinδ results of drained CRM binder made with CRM Source 2
G*/sinδ, kPa
CRM Source
Binder Source
% CRM*
CRM Type+
Temperature oC
Raw Data Mean
Standard Deviation
Coefficient of
Variation
2
A
0 0
64
1.96 2.05 0.13 6.27% 2.14
10 C 3.74 3.55 0.28 7.78% 3.35
20 C 7.41 7.85 0.62 7.93% 8.29
B
0 0 1.24 1.26 0.02 1.69% 1.27
10 C 2.64 2.30 0.48 20.91% 1.96
20 C 6.48 5.95 0.75 12.60% 5.42
A
0 0
76
- - - - -
10 C 0.92 0.87 0.07 8.13% 0.82
20 C 1.85 1.94 0.13 6.56% 2.03
B
0 0 - - - - -
10 C - - - - -
20 C 1.36 1.27 0.13 10.02% 1.18
*by weight of binder +0: Virgin; A: Ambient; C: Cryogenic
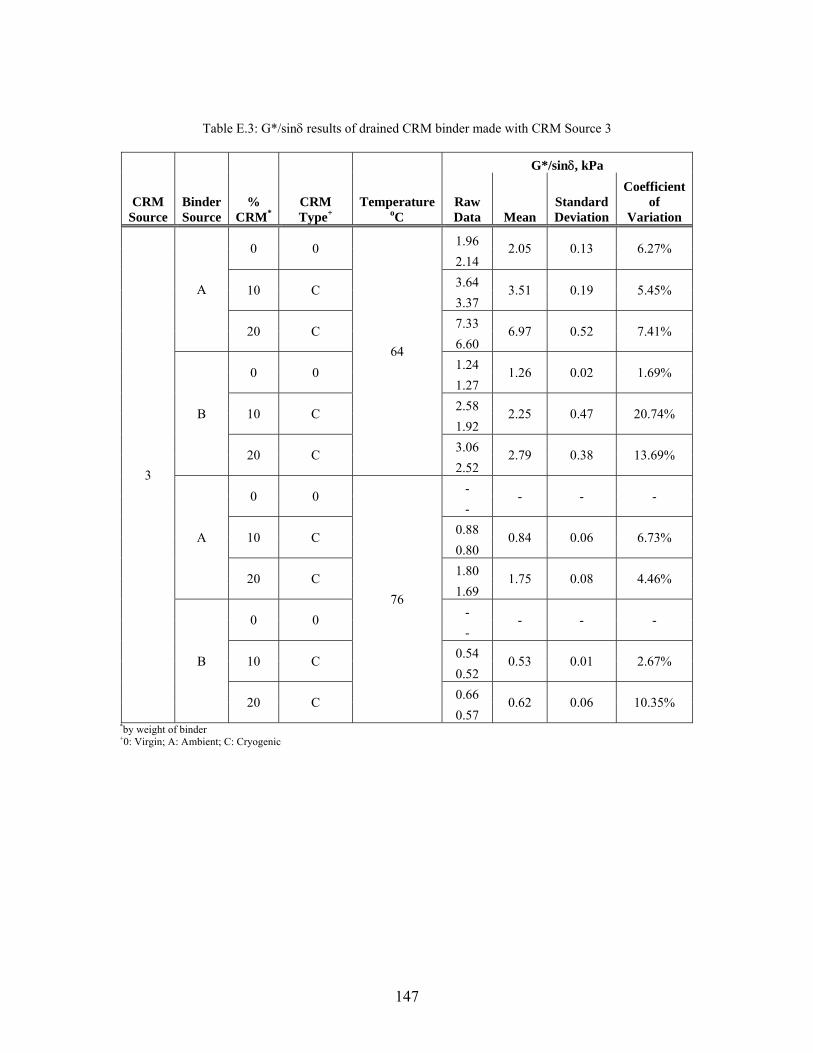
147
Table E.3: G*/sinδ results of drained CRM binder made with CRM Source 3
G*/sinδ, kPa
CRM Source
Binder Source
% CRM*
CRM Type+
Temperature oC
Raw Data Mean
Standard Deviation
Coefficient of
Variation
3
A
0 0
64
1.96 2.05 0.13 6.27% 2.14
10 C 3.64 3.51 0.19 5.45% 3.37
20 C 7.33 6.97 0.52 7.41% 6.60
B
0 0 1.24 1.26 0.02 1.69% 1.27
10 C 2.58 2.25 0.47 20.74% 1.92
20 C 3.06 2.79 0.38 13.69% 2.52
A
0 0
76
- - - - -
10 C 0.88 0.84 0.06 6.73% 0.80
20 C 1.80 1.75 0.08 4.46% 1.69
B
0 0 - - - - -
10 C 0.54 0.53 0.01 2.67% 0.52
20 C 0.66 0.62 0.06 10.35% 0.57
*by weight of binder +0: Virgin; A: Ambient; C: Cryogenic

148
Table E.4: G*/sinδ results of drained CRM binder made with CRM Source 4
G*/sinδ, kPa
CRM Source
Binder Source
% CRM*
CRM Type+
Temperature oC
Raw Data Mean
Standard Deviation
Coefficient of
Variation
4
A
0 0
64
1.96 2.05 0.13 6.27% 2.14
10 C 4.66 4.66 0.00 0.00% 4.66
20 C 12.14 11.96 0.26 2.19% 11.77
B
0 0 1.24 1.26 0.02 1.69% 1.27
10 C 1.97 1.96 0.02 1.09% 1.94
20 C 3.95 3.85 0.14 3.67% 3.75
A
0 0
76
- - - - -
10 C 1.16 1.15 0.01 1.23% 1.14
20 C 2.90 2.81 0.13 4.53% 2.72
B
0 0 - - - - -
10 C - - - - -
20 C 0.87 0.86 0.01 1.64% 0.85
*by weight of binder +0: Virgin; A: Ambient; C: Cryogenic
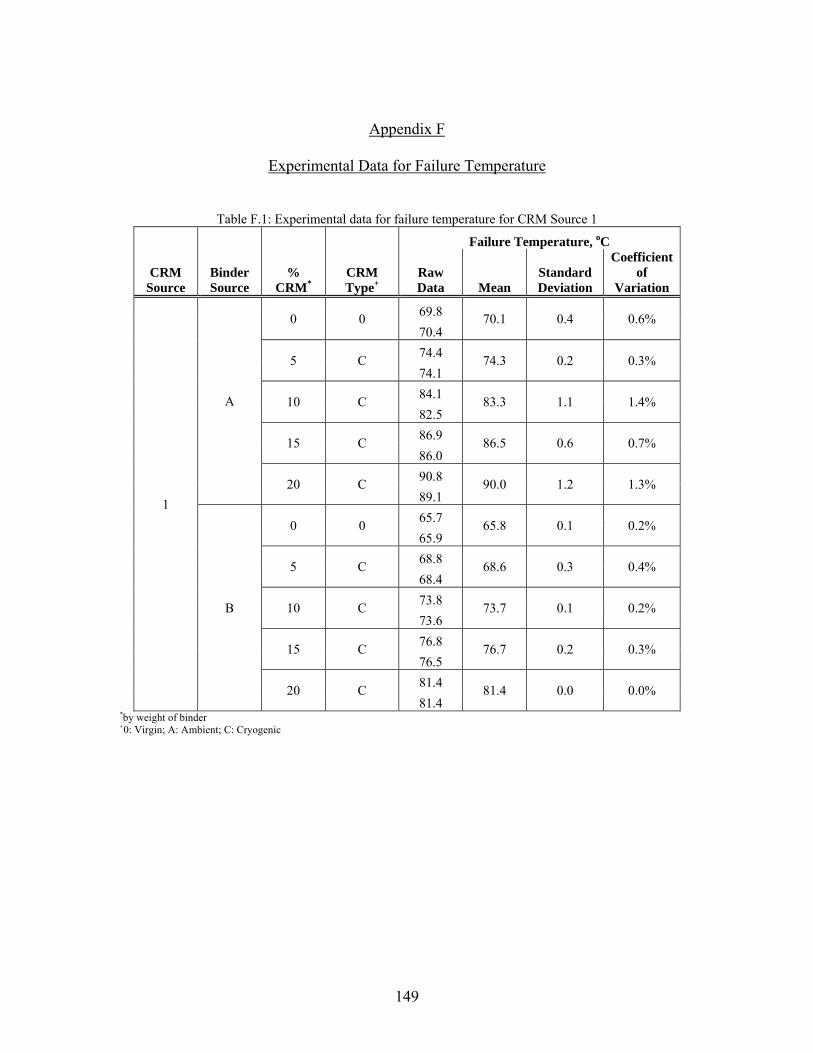
149
Appendix F
Experimental Data for Failure Temperature
F. S Table F.1: Experimental data for failure temperature for CRM Source 1
Failure Temperature, oC
CRM Source
Binder Source
% CRM*
CRM Type+
Raw Data Mean
Standard Deviation
Coefficient of
Variation
1
A
0 0 69.8 70.1 0.4 0.6% 70.4
5 C 74.4 74.3 0.2 0.3% 74.1
10 C 84.1 83.3 1.1 1.4% 82.5
15 C 86.9 86.5 0.6 0.7% 86.0
20 C 90.8 90.0 1.2 1.3% 89.1
B
0 0 65.7 65.8 0.1 0.2% 65.9
5 C 68.8 68.6 0.3 0.4% 68.4
10 C 73.8 73.7 0.1 0.2% 73.6
15 C 76.8 76.7 0.2 0.3% 76.5
20 C 81.4 81.4 0.0 0.0% 81.4
*by weight of binder +0: Virgin; A: Ambient; C: Cryogenic
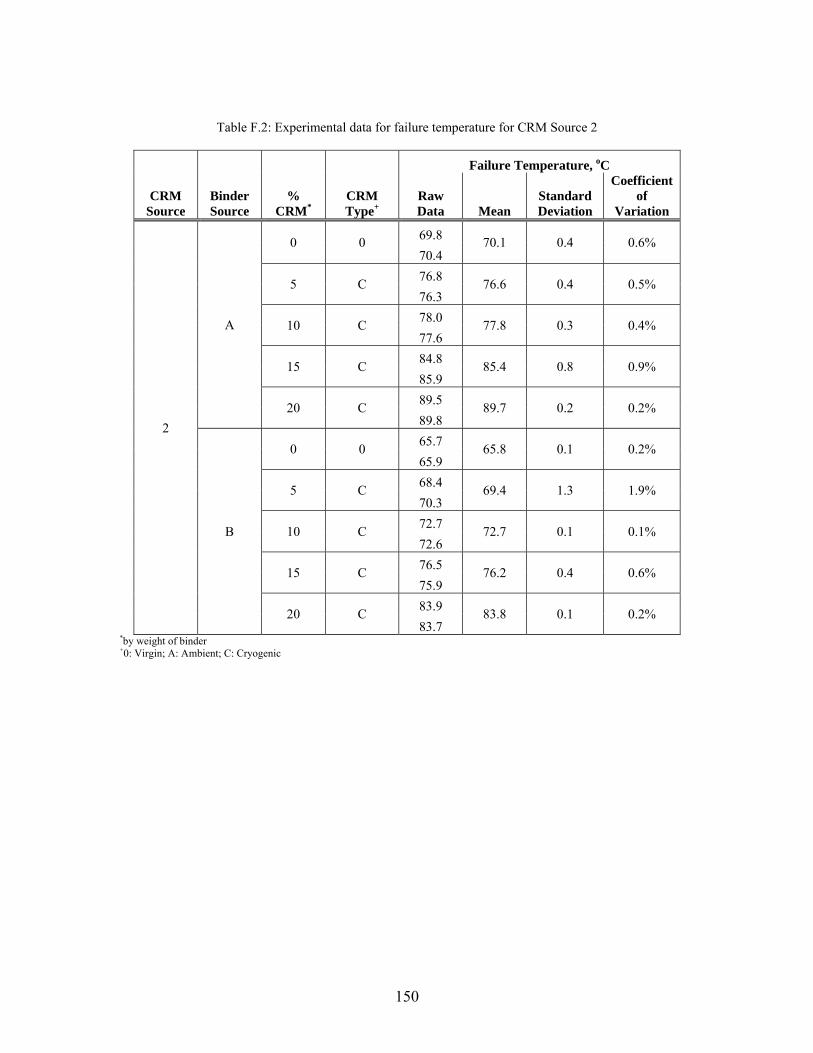
150
Table F.2: Experimental data for failure temperature for CRM Source 2
Failure Temperature, oC
CRM Source
Binder Source
% CRM*
CRM Type+
Raw Data Mean
Standard Deviation
Coefficient of
Variation
2
A
0 0 69.8 70.1 0.4 0.6% 70.4
5 C 76.8 76.6 0.4 0.5% 76.3
10 C 78.0 77.8 0.3 0.4% 77.6
15 C 84.8 85.4 0.8 0.9% 85.9
20 C 89.5 89.7 0.2 0.2% 89.8
B
0 0 65.7 65.8 0.1 0.2% 65.9
5 C 68.4 69.4 1.3 1.9% 70.3
10 C 72.7 72.7 0.1 0.1% 72.6
15 C 76.5 76.2 0.4 0.6% 75.9
20 C 83.9 83.8 0.1 0.2% 83.7
*by weight of binder +0: Virgin; A: Ambient; C: Cryogenic

151
Table F.3: Experimental data for failure temperature for CRM Source 3
Failure Temperature, oC
CRM Source
Binder Source
% CRM*
CRM Type+
Raw Data Mean
Standard Deviation
Coefficient of
Variation
3
A
0 0 69.8 70.1 0.4 0.6% 70.4
5 A 74.4 74.4 0.0 0.0% 74.4
10 A 82.3 80.9 2.1 2.5% 79.4
15 A 91.1 90.4 1.0 1.1% 89.7
20 A 95.8 95.1 1.1 1.1% 94.3
B
0 0 65.7 65.8 0.1 0.2% 65.9
5 A 69.4 69.4 0.1 0.1% 69.3
10 A 72.3 72.1 0.4 0.5% 71.8
15 A 78.5 78.2 0.5 0.6% 77.8
20 A 81.3 81.1 0.3 0.3% 80.9
*by weight of binder +0: Virgin; A: Ambient; C: Cryogenic
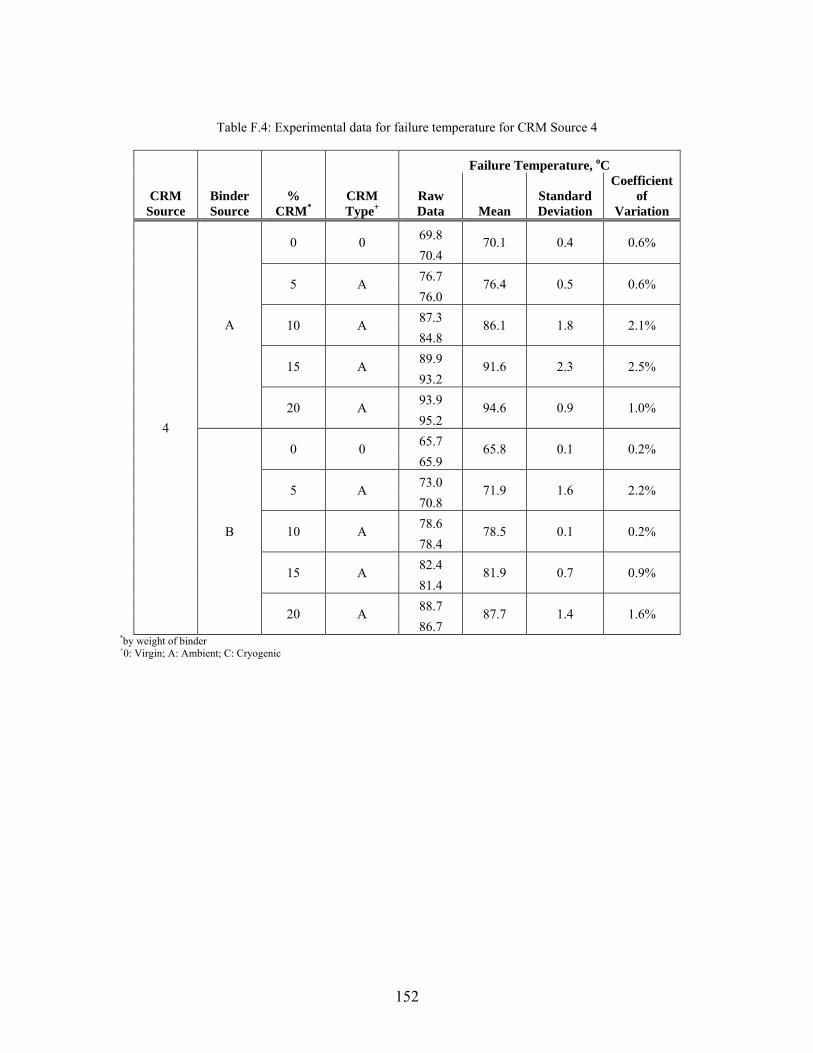
152
Table F.4: Experimental data for failure temperature for CRM Source 4
Failure Temperature, oC
CRM Source
Binder Source
% CRM*
CRM Type+
Raw Data Mean
Standard Deviation
Coefficient of
Variation
4
A
0 0 69.8 70.1 0.4 0.6% 70.4
5 A 76.7 76.4 0.5 0.6% 76.0
10 A 87.3 86.1 1.8 2.1% 84.8
15 A 89.9 91.6 2.3 2.5% 93.2
20 A 93.9 94.6 0.9 1.0% 95.2
B
0 0 65.7 65.8 0.1 0.2% 65.9
5 A 73.0 71.9 1.6 2.2% 70.8
10 A 78.6 78.5 0.1 0.2% 78.4
15 A 82.4 81.9 0.7 0.9% 81.4
20 A 88.7 87.7 1.4 1.6% 86.7
*by weight of binder +0: Virgin; A: Ambient; C: Cryogenic
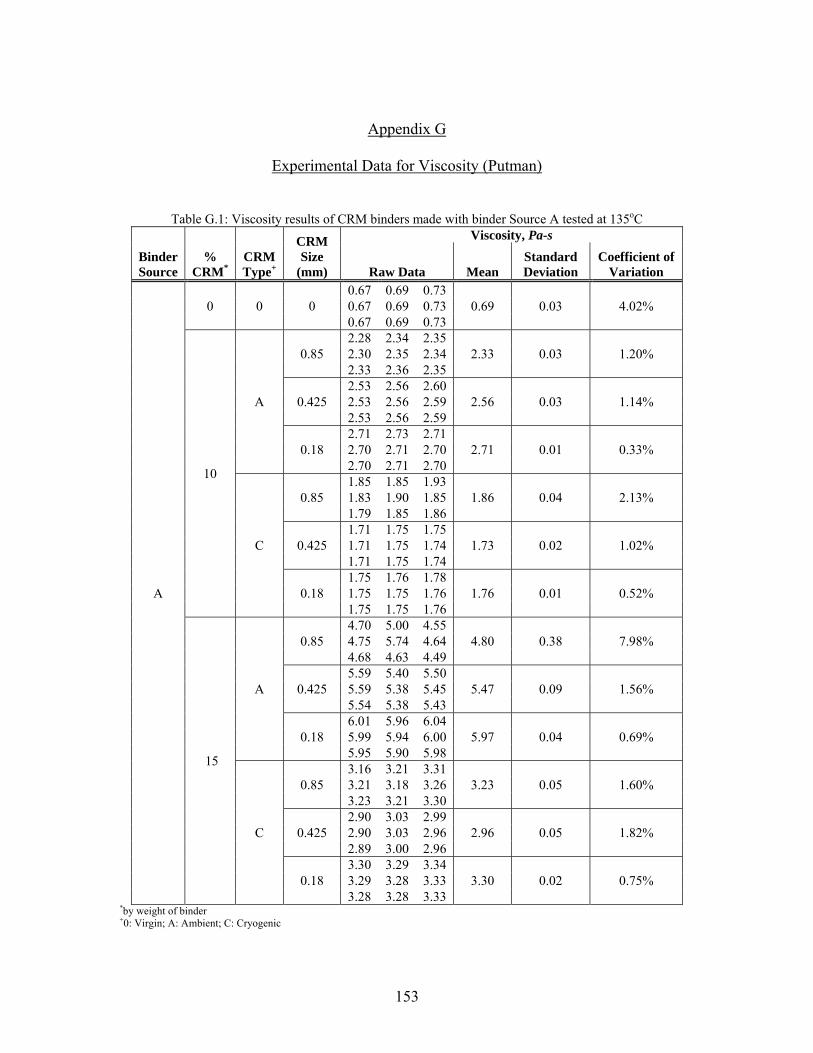
153
Appendix G
Experimental Data for Viscosity (Putman)
G. S Table G.1: Viscosity results of CRM binders made with binder Source A tested at 135oC
Binder Source
% CRM*
CRM Type+
CRM Size
(mm)
Viscosity, Pa-s
Raw Data Mean Standard Deviation
Coefficient of Variation
A
0 0 0 0.67 0.69 0.73
0.69 0.03 4.02% 0.67 0.69 0.73 0.67 0.69 0.73
10
A
0.85 2.28 2.34 2.35
2.33 0.03 1.20% 2.30 2.35 2.34 2.33 2.36 2.35
0.425 2.53 2.56 2.60
2.56 0.03 1.14% 2.53 2.56 2.59 2.53 2.56 2.59
0.18 2.71 2.73 2.71
2.71 0.01 0.33% 2.70 2.71 2.70 2.70 2.71 2.70
C
0.85 1.85 1.85 1.93
1.86 0.04 2.13% 1.83 1.90 1.85 1.79 1.85 1.86
0.425 1.71 1.75 1.75
1.73 0.02 1.02% 1.71 1.75 1.74 1.71 1.75 1.74
0.18 1.75 1.76 1.78
1.76 0.01 0.52% 1.75 1.75 1.76 1.75 1.75 1.76
15
A
0.85 4.70 5.00 4.55
4.80 0.38 7.98% 4.75 5.74 4.64 4.68 4.63 4.49
0.425 5.59 5.40 5.50
5.47 0.09 1.56% 5.59 5.38 5.45 5.54 5.38 5.43
0.18 6.01 5.96 6.04
5.97 0.04 0.69% 5.99 5.94 6.00 5.95 5.90 5.98
C
0.85 3.16 3.21 3.31
3.23 0.05 1.60% 3.21 3.18 3.26 3.23 3.21 3.30
0.425 2.90 3.03 2.99
2.96 0.05 1.82% 2.90 3.03 2.96 2.89 3.00 2.96
0.18 3.30 3.29 3.34
3.30 0.02 0.75% 3.29 3.28 3.33 3.28 3.28 3.33
*by weight of binder +0: Virgin; A: Ambient; C: Cryogenic

154
Table G.2: Viscosity results of CRM binders made with binder Source B tested at 135oC
Binder Source
% CRM*
CRM Type+
CRM Size
(mm)
Viscosity, Pa-s
Raw Data Mean Standard Deviation
Coefficient of Variation
B
0 0 0 0.47 0.47 0.47
0.47 0.00 0.23% 0.47 0.47 0.47 0.47 0.47 0.47
10
A
0.85 1.59 1.63 1.74
1.55 0.14 9.15% 1.56 1.31 1.64 1.58 1.33 1.61
0.425 1.43 1.40 1.41
1.41 0.01 0.98% 1.41 1.39 1.43 1.41 1.39 1.41
0.18 1.46 1.45 1.45
1.45 0.01 0.55% 1.45 1.44 1.45 1.45 1.44 1.44
C
0.85 1.60 1.45 1.38
1.47 0.11 7.66% 1.63 1.36 1.38 1.61 1.41 1.39
0.425 1.13 1.14 1.11
1.13 0.01 1.27% 1.14 1.15 1.11 1.14 1.14 1.11
0.18 1.10 1.09 1.08
1.08 0.01 0.83% 1.09 1.08 1.08 1.09 1.08 1.08
15
A
0.85 2.93 2.84 2.88
2.83 0.06 2.17% 2.76 2.86 2.73 2.88 2.81 2.81
0.425 3.50 3.58 3.53
3.52 0.03 0.78% 3.51 3.56 3.50 3.51 3.53 3.50
0.18 3.89 3.94 3.91
3.89 0.03 0.70% 3.86 3.91 3.90 3.85 3.89 3.88
C
0.85 2.00 2.21 2.26
2.14 0.10 4.53% 2.14 2.03 2.20 2.04 2.23 2.16
0.425 1.73 1.70 1.79
1.73 0.04 2.32% 1.71 1.69 1.79 1.71 1.70 1.78
0.18 1.95 1.86 1.85
1.88 0.04 2.31% 1.94 1.86 1.85 1.94 1.86 1.85
*by weight of binder +0: Virgin; A: Ambient; C: Cryogenic
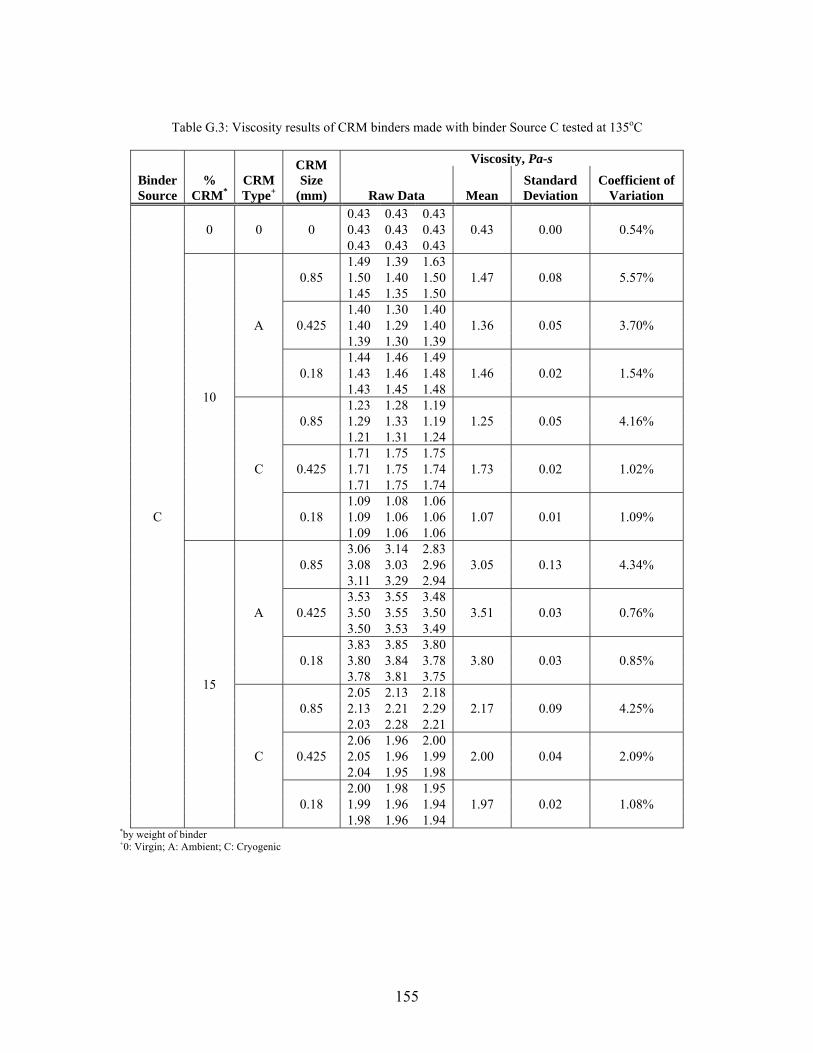
155
Table G.3: Viscosity results of CRM binders made with binder Source C tested at 135oC
Binder Source
% CRM*
CRM Type+
CRM Size
(mm)
Viscosity, Pa-s
Raw Data Mean Standard Deviation
Coefficient of Variation
C
0 0 0 0.43 0.43 0.43
0.43 0.00 0.54% 0.43 0.43 0.43 0.43 0.43 0.43
10
A
0.85 1.49 1.39 1.63
1.47 0.08 5.57% 1.50 1.40 1.50 1.45 1.35 1.50
0.425 1.40 1.30 1.40
1.36 0.05 3.70% 1.40 1.29 1.40 1.39 1.30 1.39
0.18 1.44 1.46 1.49
1.46 0.02 1.54% 1.43 1.46 1.48 1.43 1.45 1.48
C
0.85 1.23 1.28 1.19
1.25 0.05 4.16% 1.29 1.33 1.19 1.21 1.31 1.24
0.425 1.71 1.75 1.75
1.73 0.02 1.02% 1.71 1.75 1.74 1.71 1.75 1.74
0.18 1.09 1.08 1.06
1.07 0.01 1.09% 1.09 1.06 1.06 1.09 1.06 1.06
15
A
0.85 3.06 3.14 2.83
3.05 0.13 4.34% 3.08 3.03 2.96 3.11 3.29 2.94
0.425 3.53 3.55 3.48
3.51 0.03 0.76% 3.50 3.55 3.50 3.50 3.53 3.49
0.18 3.83 3.85 3.80
3.80 0.03 0.85% 3.80 3.84 3.78 3.78 3.81 3.75
C
0.85 2.05 2.13 2.18
2.17 0.09 4.25% 2.13 2.21 2.29 2.03 2.28 2.21
0.425 2.06 1.96 2.00
2.00 0.04 2.09% 2.05 1.96 1.99 2.04 1.95 1.98
0.18 2.00 1.98 1.95
1.97 0.02 1.08% 1.99 1.96 1.94 1.98 1.96 1.94
*by weight of binder +0: Virgin; A: Ambient; C: Cryogenic
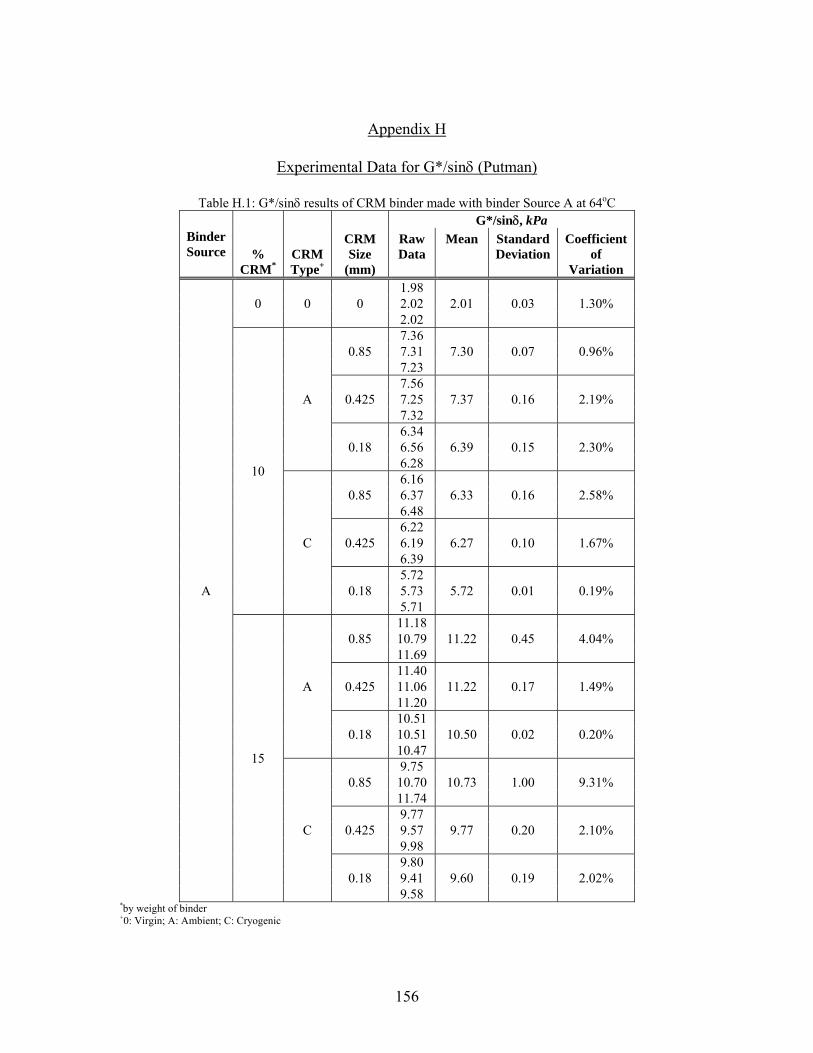
156
Appendix H
Experimental Data for G*/sinδ (Putman) H. S
Table H.1: G*/sinδ results of CRM binder made with binder Source A at 64oC
Binder Source %
CRM* CRM Type+
CRM Size
(mm)
G*/sinδ, kPa Raw Data
Mean Standard Deviation
Coefficient of
Variation
A
0 0 0 1.98
2.01 0.03 1.30% 2.02 2.02
10
A
0.85 7.36
7.30 0.07 0.96% 7.31 7.23
0.425 7.56
7.37 0.16 2.19% 7.25 7.32
0.18 6.34
6.39 0.15 2.30% 6.56 6.28
C
0.85 6.16
6.33 0.16 2.58% 6.37 6.48
0.425 6.22
6.27 0.10 1.67% 6.19 6.39
0.18 5.72
5.72 0.01 0.19% 5.73 5.71
15
A
0.85 11.18
11.22 0.45 4.04% 10.79 11.69
0.425 11.40
11.22 0.17 1.49% 11.06 11.20
0.18 10.51
10.50 0.02 0.20% 10.51 10.47
C
0.85 9.75
10.73 1.00 9.31% 10.70 11.74
0.425 9.77
9.77 0.20 2.10% 9.57 9.98
0.18 9.80
9.60 0.19 2.02% 9.41 9.58
*by weight of binder +0: Virgin; A: Ambient; C: Cryogenic
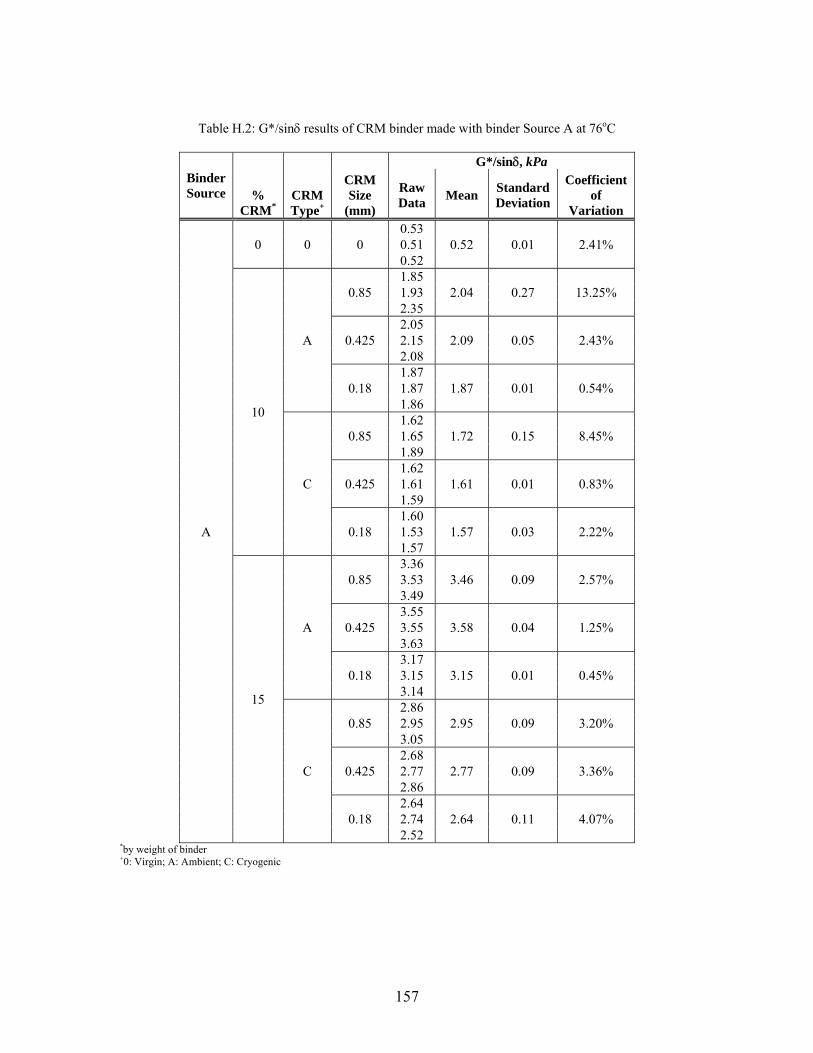
157
Table H.2: G*/sinδ results of CRM binder made with binder Source A at 76oC
Binder Source %
CRM* CRM Type+
CRM Size
(mm)
G*/sinδ, kPa
Raw Data Mean Standard
Deviation
Coefficient of
Variation
A
0 0 0 0.53
0.52 0.01 2.41% 0.51 0.52
10
A
0.85 1.85
2.04 0.27 13.25% 1.93 2.35
0.425 2.05
2.09 0.05 2.43% 2.15 2.08
0.18 1.87
1.87 0.01 0.54% 1.87 1.86
C
0.85 1.62
1.72 0.15 8.45% 1.65 1.89
0.425 1.62
1.61 0.01 0.83% 1.61 1.59
0.18 1.60
1.57 0.03 2.22% 1.53 1.57
15
A
0.85 3.36
3.46 0.09 2.57% 3.53 3.49
0.425 3.55
3.58 0.04 1.25% 3.55 3.63
0.18 3.17
3.15 0.01 0.45% 3.15 3.14
C
0.85 2.86
2.95 0.09 3.20% 2.95 3.05
0.425 2.68
2.77 0.09 3.36% 2.77 2.86
0.18 2.64
2.64 0.11 4.07% 2.74 2.52
*by weight of binder +0: Virgin; A: Ambient; C: Cryogenic
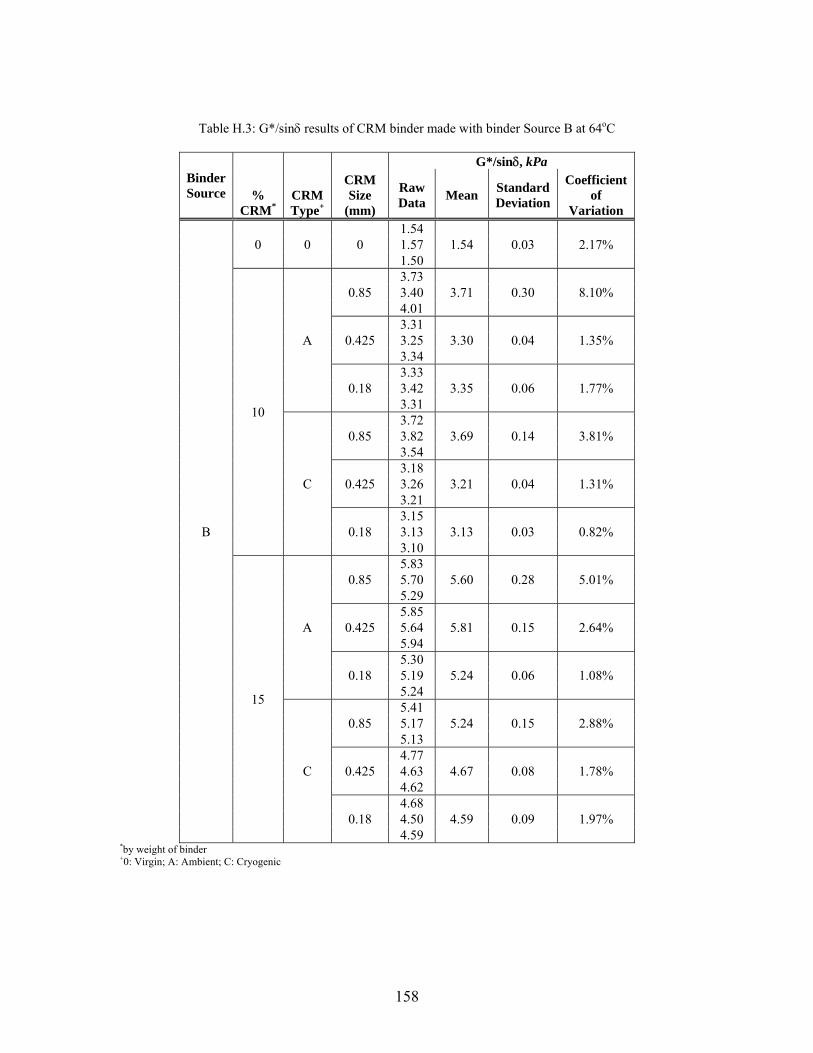
158
Table H.3: G*/sinδ results of CRM binder made with binder Source B at 64oC
Binder Source %
CRM* CRM Type+
CRM Size
(mm)
G*/sinδ, kPa
Raw Data Mean Standard
Deviation
Coefficient of
Variation
B
0 0 0 1.54
1.54 0.03 2.17% 1.57 1.50
10
A
0.85 3.73
3.71 0.30 8.10% 3.40 4.01
0.425 3.31
3.30 0.04 1.35% 3.25 3.34
0.18 3.33
3.35 0.06 1.77% 3.42 3.31
C
0.85 3.72
3.69 0.14 3.81% 3.82 3.54
0.425 3.18
3.21 0.04 1.31% 3.26 3.21
0.18 3.15
3.13 0.03 0.82% 3.13 3.10
15
A
0.85 5.83
5.60 0.28 5.01% 5.70 5.29
0.425 5.85
5.81 0.15 2.64% 5.64 5.94
0.18 5.30
5.24 0.06 1.08% 5.19 5.24
C
0.85 5.41
5.24 0.15 2.88% 5.17 5.13
0.425 4.77
4.67 0.08 1.78% 4.63 4.62
0.18 4.68
4.59 0.09 1.97% 4.50 4.59
*by weight of binder +0: Virgin; A: Ambient; C: Cryogenic

159
Table H.4: G*/sinδ results of CRM binder made with binder Source B at 76oC
Binder Source %
CRM* CRM Type+
CRM Size
(mm)
G*/sinδ, kPa
Raw Data Mean Standard
Deviation
Coefficient of
Variation
B
0 0 0 0.32
0.32 0.00 1.44% 0.32 0.33
10
A
0.85
1.27 0.02 1.70% 1.28 1.25
0.425 0.93
0.96 0.03 3.39% 1.00 0.97
0.18 0.83
0.87 0.04 4.96% 0.86 0.91
C
0.85 0.87
0.85 0.04 4.23% 0.87 0.81
0.425 0.82
0.84 0.03 3.92% 0.82 0.88
0.18 0.76
0.80 0.04 4.53% 0.83 0.82
15
A
0.85 1.71
1.76 0.16 8.82% 1.64 1.93
0.425 1.72
1.71 0.05 2.89% 1.65 1.75
0.18 1.54
1.50 0.03 2.25% 1.50 1.47
C
0.85 1.36
1.44 0.12 8.59% 1.39 1.59
0.425 1.45
1.41 0.05 3.77% 1.42 1.35
0.18 1.21
1.23 0.02 1.61% 1.25 1.22
*by weight of binder +0: Virgin; A: Ambient; C: Cryogenic
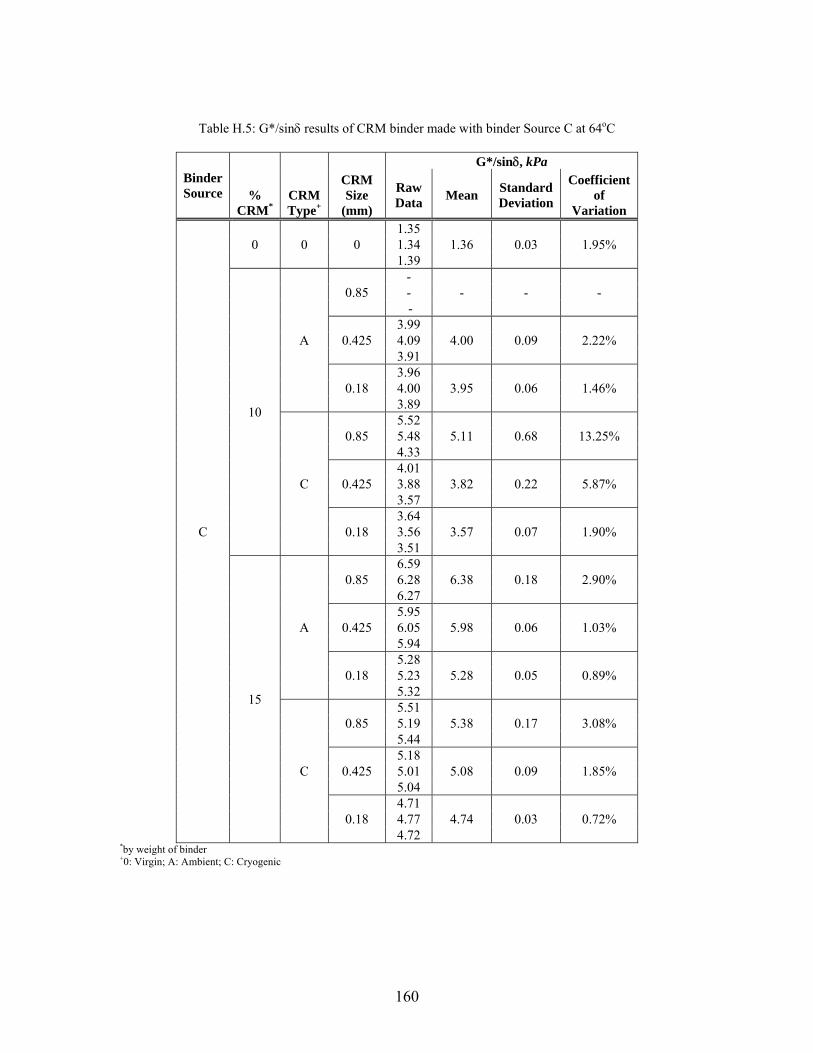
160
Table H.5: G*/sinδ results of CRM binder made with binder Source C at 64oC
Binder Source %
CRM* CRM Type+
CRM Size
(mm)
G*/sinδ, kPa
Raw Data Mean Standard
Deviation
Coefficient of
Variation
C
0 0 0 1.35
1.36 0.03 1.95% 1.34 1.39
10
A
0.85 -
- - - - -
0.425 3.99
4.00 0.09 2.22% 4.09 3.91
0.18 3.96
3.95 0.06 1.46% 4.00 3.89
C
0.85 5.52
5.11 0.68 13.25% 5.48 4.33
0.425 4.01
3.82 0.22 5.87% 3.88 3.57
0.18 3.64
3.57 0.07 1.90% 3.56 3.51
15
A
0.85 6.59
6.38 0.18 2.90% 6.28 6.27
0.425 5.95
5.98 0.06 1.03% 6.05 5.94
0.18 5.28
5.28 0.05 0.89% 5.23 5.32
C
0.85 5.51
5.38 0.17 3.08% 5.19 5.44
0.425 5.18
5.08 0.09 1.85% 5.01 5.04
0.18 4.71
4.74 0.03 0.72% 4.77 4.72
*by weight of binder +0: Virgin; A: Ambient; C: Cryogenic
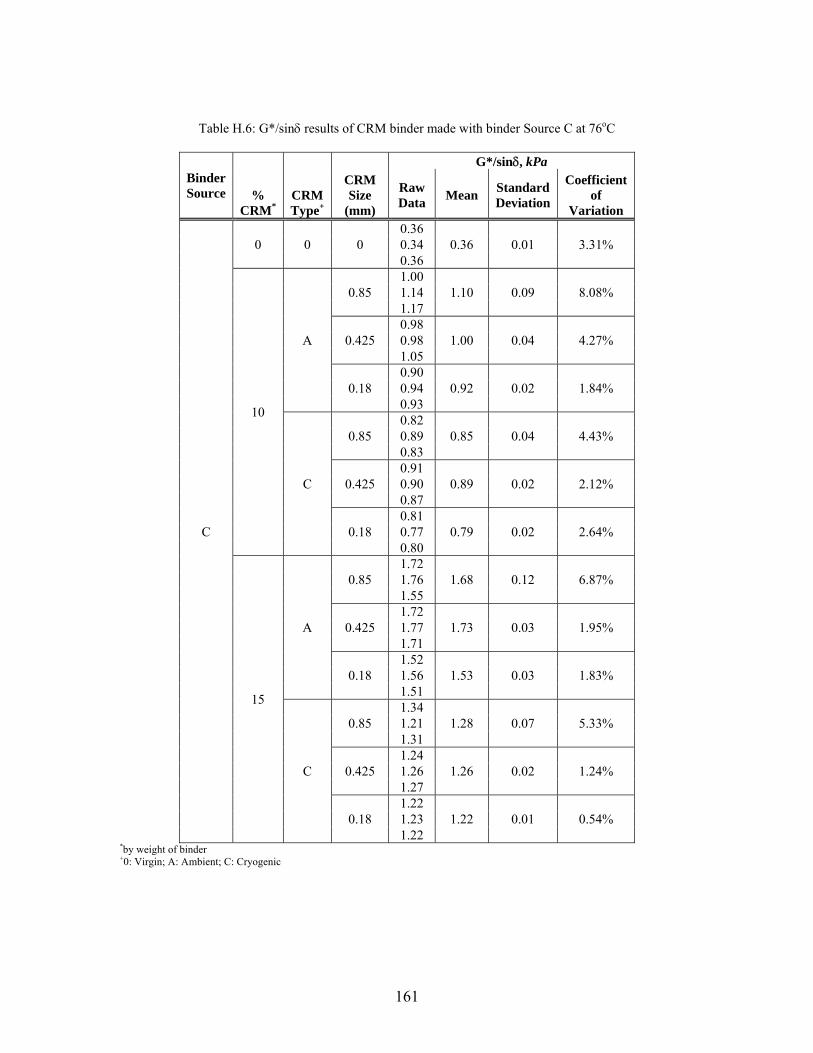
161
Table H.6: G*/sinδ results of CRM binder made with binder Source C at 76oC
Binder Source %
CRM* CRM Type+
CRM Size
(mm)
G*/sinδ, kPa
Raw Data Mean Standard
Deviation
Coefficient of
Variation
C
0 0 0 0.36
0.36 0.01 3.31% 0.34 0.36
10
A
0.85 1.00
1.10 0.09 8.08% 1.14 1.17
0.425 0.98
1.00 0.04 4.27% 0.98 1.05
0.18 0.90
0.92 0.02 1.84% 0.94 0.93
C
0.85 0.82
0.85 0.04 4.43% 0.89 0.83
0.425 0.91
0.89 0.02 2.12% 0.90 0.87
0.18 0.81
0.79 0.02 2.64% 0.77 0.80
15
A
0.85 1.72
1.68 0.12 6.87% 1.76 1.55
0.425 1.72
1.73 0.03 1.95% 1.77 1.71
0.18 1.52
1.53 0.03 1.83% 1.56 1.51
C
0.85 1.34
1.28 0.07 5.33% 1.21 1.31
0.425 1.24
1.26 0.02 1.24% 1.26 1.27
0.18 1.22
1.22 0.01 0.54% 1.23 1.22
*by weight of binder +0: Virgin; A: Ambient; C: Cryogenic
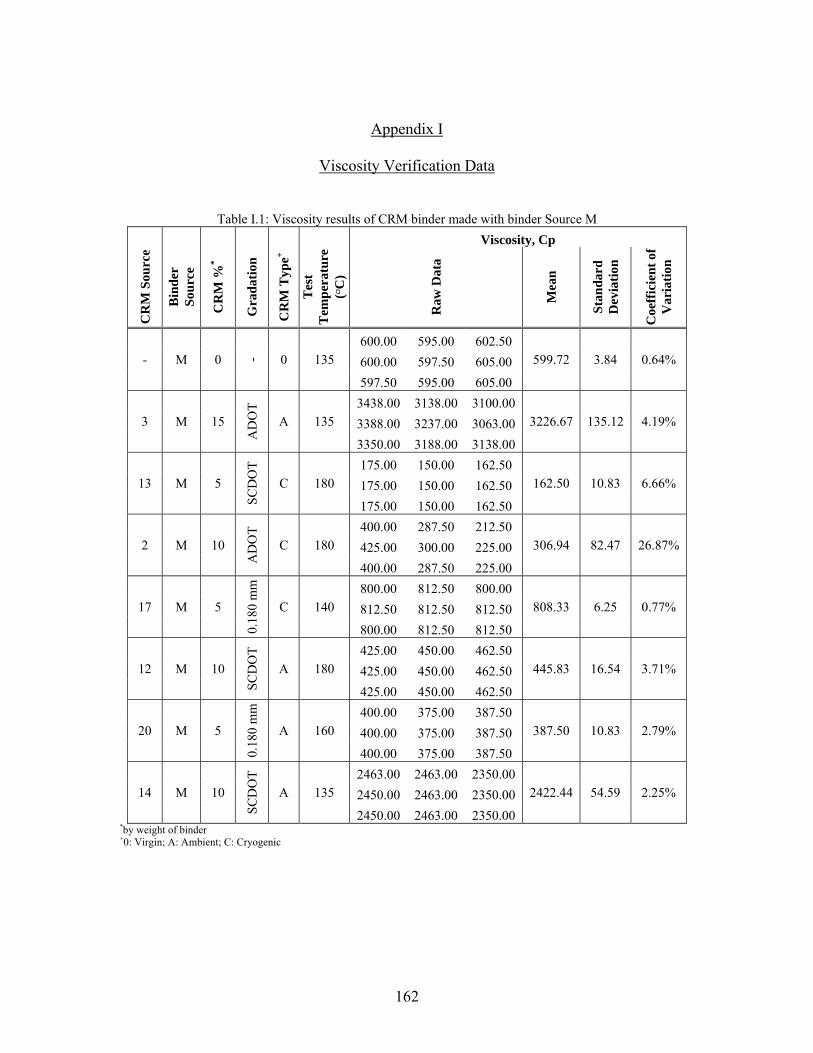
162
Appendix I
Viscosity Verification Data
I. S Table I.1: Viscosity results of CRM binder made with binder Source M
Viscosity, Cp
CR
M S
ourc
e
Bin
der
Sour
ce
CR
M %
*
Gra
datio
n
CR
M T
ype+
Tes
t T
empe
ratu
re
(oC
)
Raw
Dat
a
Mea
n
Stan
dard
D
evia
tion
Coe
ffic
ient
of
Var
iatio
n
- M 0 - 0 135 600.00 595.00 602.50
599.72 3.84 0.64% 600.00 597.50 605.00 597.50 595.00 605.00
3 M 15
AD
OT
A 135 3438.00 3138.00 3100.00
3226.67 135.12 4.19% 3388.00 3237.00 3063.00 3350.00 3188.00 3138.00
13 M 5
SCD
OT
C 180 175.00 150.00 162.50
162.50 10.83 6.66% 175.00 150.00 162.50 175.00 150.00 162.50
2 M 10
AD
OT
C 180 400.00 287.50 212.50
306.94 82.47 26.87% 425.00 300.00 225.00 400.00 287.50 225.00
17 M 5
0.18
0 m
m
C 140 800.00 812.50 800.00
808.33 6.25 0.77% 812.50 812.50 812.50 800.00 812.50 812.50
12 M 10
SCD
OT
A 180 425.00 450.00 462.50
445.83 16.54 3.71% 425.00 450.00 462.50 425.00 450.00 462.50
20 M 5
0.18
0 m
m
A 160 400.00 375.00 387.50
387.50 10.83 2.79% 400.00 375.00 387.50 400.00 375.00 387.50
14 M 10
SCD
OT
A 135 2463.00 2463.00 2350.00
2422.44 54.59 2.25% 2450.00 2463.00 2350.00 2450.00 2463.00 2350.00
*by weight of binder +0: Virgin; A: Ambient; C: Cryogenic
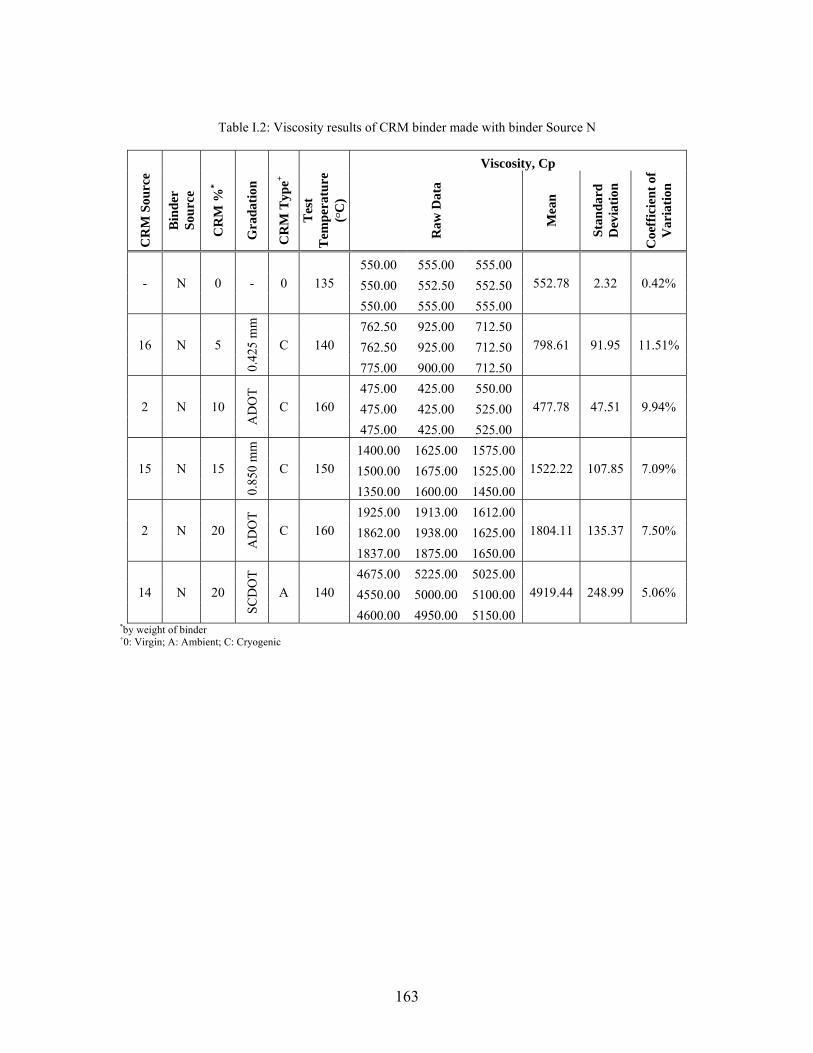
163
Table I.2: Viscosity results of CRM binder made with binder Source N
Viscosity, Cp C
RM
Sou
rce
Bin
der
Sour
ce
CR
M %
*
Gra
datio
n
CR
M T
ype+
Tes
t T
empe
ratu
re
(oC
)
Raw
Dat
a
Mea
n
Stan
dard
D
evia
tion
Coe
ffic
ient
of
Var
iatio
n
- N 0 - 0 135 550.00 555.00 555.00
552.78 2.32 0.42% 550.00 552.50 552.50 550.00 555.00 555.00
16 N 5
0.42
5 m
m
C 140 762.50 925.00 712.50
798.61 91.95 11.51% 762.50 925.00 712.50 775.00 900.00 712.50
2 N 10
AD
OT
C 160 475.00 425.00 550.00
477.78 47.51 9.94% 475.00 425.00 525.00 475.00 425.00 525.00
15 N 15
0.85
0 m
m
C 150 1400.00 1625.00 1575.00
1522.22 107.85 7.09% 1500.00 1675.00 1525.00 1350.00 1600.00 1450.00
2 N 20
AD
OT
C 160 1925.00 1913.00 1612.00
1804.11 135.37 7.50% 1862.00 1938.00 1625.00 1837.00 1875.00 1650.00
14 N 20
SCD
OT
A 140 4675.00 5225.00 5025.00
4919.44 248.99 5.06% 4550.00 5000.00 5100.00 4600.00 4950.00 5150.00
*by weight of binder +0: Virgin; A: Ambient; C: Cryogenic
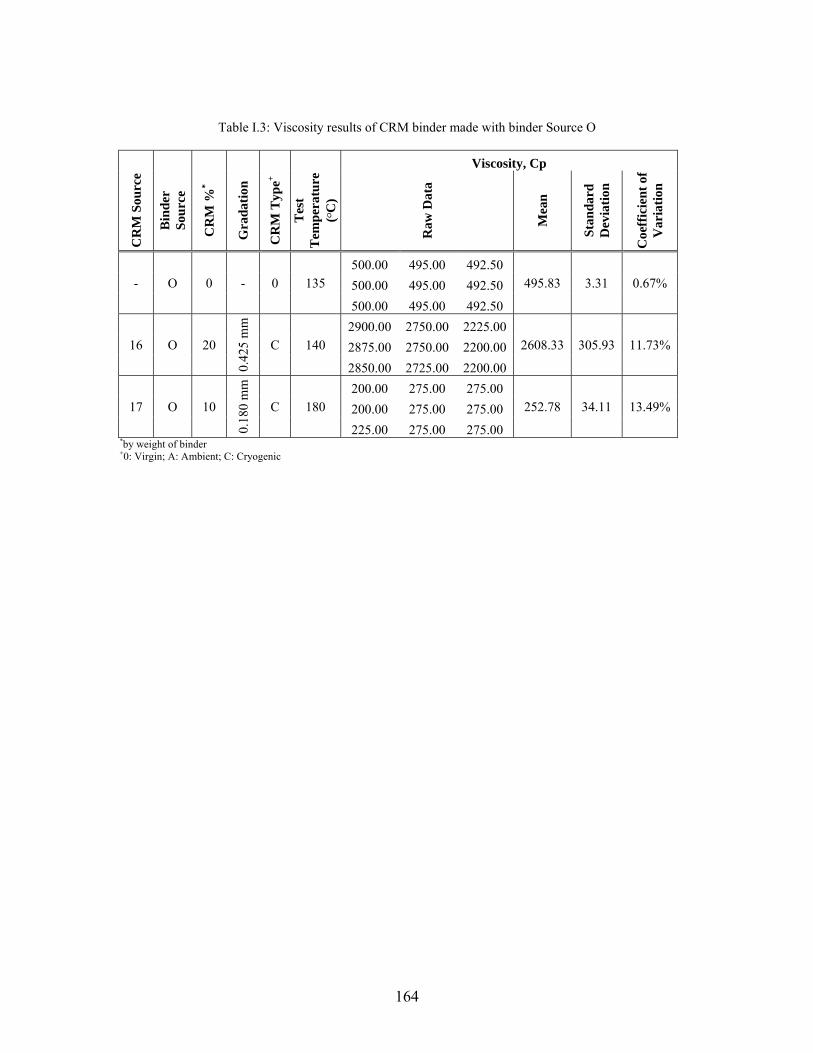
164
Table I.3: Viscosity results of CRM binder made with binder Source O
Viscosity, Cp
CR
M S
ourc
e
Bin
der
Sour
ce
CR
M %
*
Gra
datio
n
CR
M T
ype+
Tes
t T
empe
ratu
re
(oC
)
Raw
Dat
a
Mea
n
Stan
dard
D
evia
tion
Coe
ffic
ient
of
Var
iatio
n
- O 0 - 0 135 500.00 495.00 492.50
495.83 3.31 0.67% 500.00 495.00 492.50 500.00 495.00 492.50
16 O 20
0.42
5 m
m
C 140 2900.00 2750.00 2225.00
2608.33 305.93 11.73% 2875.00 2750.00 2200.00 2850.00 2725.00 2200.00
17 O 10
0.18
0 m
m
C 180 200.00 275.00 275.00
252.78 34.11 13.49% 200.00 275.00 275.00 225.00 275.00 275.00
*by weight of binder +0: Virgin; A: Ambient; C: Cryogenic
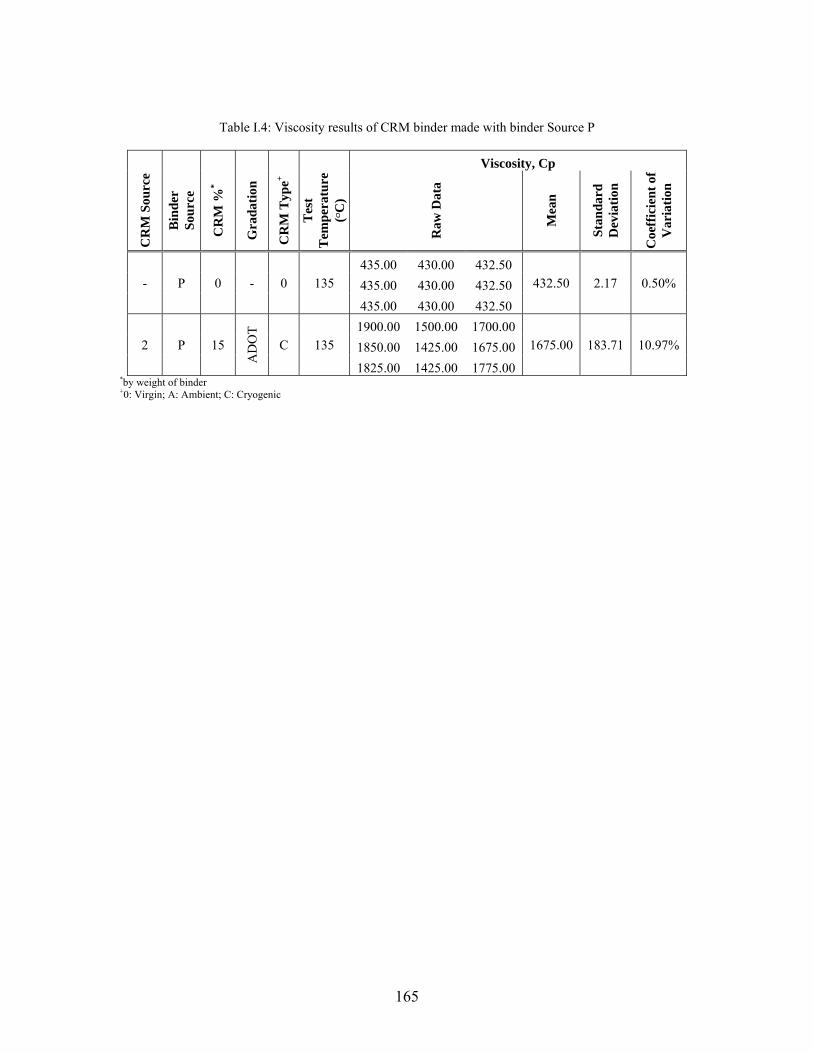
165
Table I.4: Viscosity results of CRM binder made with binder Source P
Viscosity, Cp C
RM
Sou
rce
Bin
der
Sour
ce
CR
M %
*
Gra
datio
n
CR
M T
ype+
Tes
t T
empe
ratu
re
(oC
)
Raw
Dat
a
Mea
n
Stan
dard
D
evia
tion
Coe
ffic
ient
of
Var
iatio
n
- P 0 - 0 135 435.00 430.00 432.50
432.50 2.17 0.50% 435.00 430.00 432.50 435.00 430.00 432.50
2 P 15
AD
OT
C 135 1900.00 1500.00 1700.00
1675.00 183.71 10.97% 1850.00 1425.00 1675.00 1825.00 1425.00 1775.00
*by weight of binder +0: Virgin; A: Ambient; C: Cryogenic
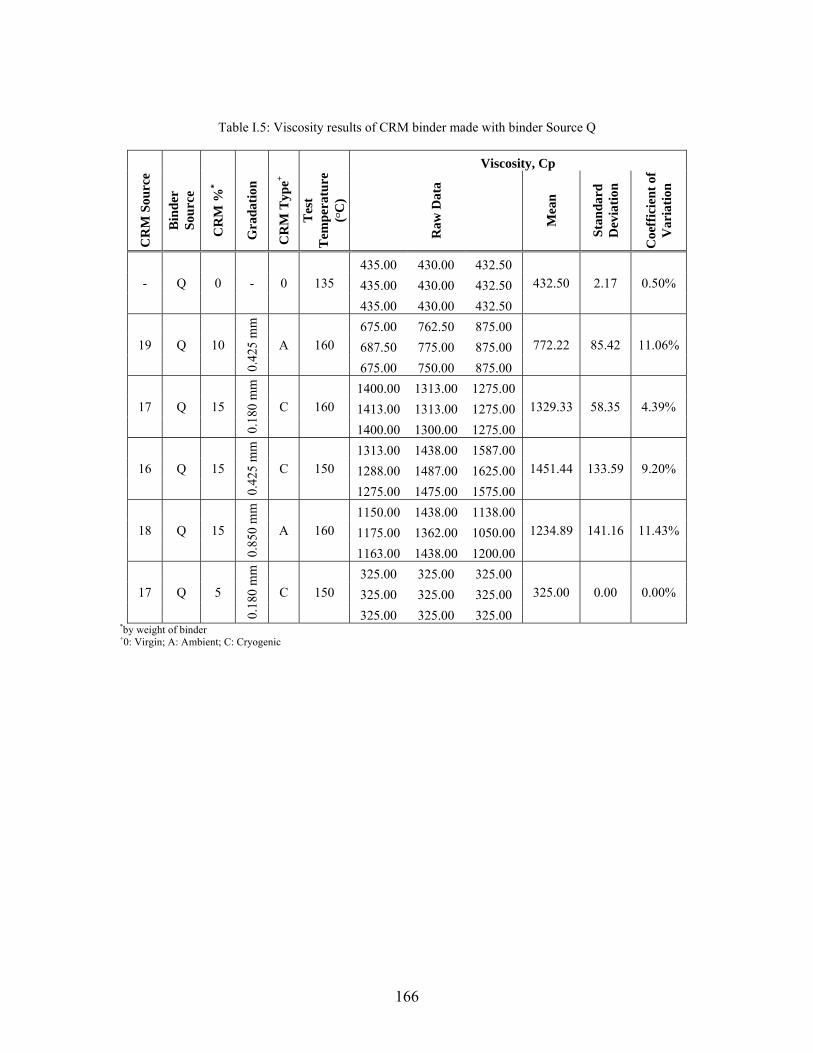
166
Table I.5: Viscosity results of CRM binder made with binder Source Q
Viscosity, Cp C
RM
Sou
rce
Bin
der
Sour
ce
CR
M %
*
Gra
datio
n
CR
M T
ype+
Tes
t T
empe
ratu
re
(oC
)
Raw
Dat
a
Mea
n
Stan
dard
D
evia
tion
Coe
ffic
ient
of
Var
iatio
n
- Q 0 - 0 135 435.00 430.00 432.50
432.50 2.17 0.50% 435.00 430.00 432.50 435.00 430.00 432.50
19 Q 10
0.42
5 m
m
A 160 675.00 762.50 875.00
772.22 85.42 11.06% 687.50 775.00 875.00 675.00 750.00 875.00
17 Q 15
0.18
0 m
m
C 160 1400.00 1313.00 1275.00
1329.33 58.35 4.39% 1413.00 1313.00 1275.00 1400.00 1300.00 1275.00
16 Q 15
0.42
5 m
m
C 150 1313.00 1438.00 1587.00
1451.44 133.59 9.20% 1288.00 1487.00 1625.00 1275.00 1475.00 1575.00
18 Q 15
0.85
0 m
m
A 160 1150.00 1438.00 1138.00
1234.89 141.16 11.43% 1175.00 1362.00 1050.00 1163.00 1438.00 1200.00
17 Q 5
0.18
0 m
m
C 150 325.00 325.00 325.00
325.00 0.00 0.00% 325.00 325.00 325.00 325.00 325.00 325.00
*by weight of binder +0: Virgin; A: Ambient; C: Cryogenic
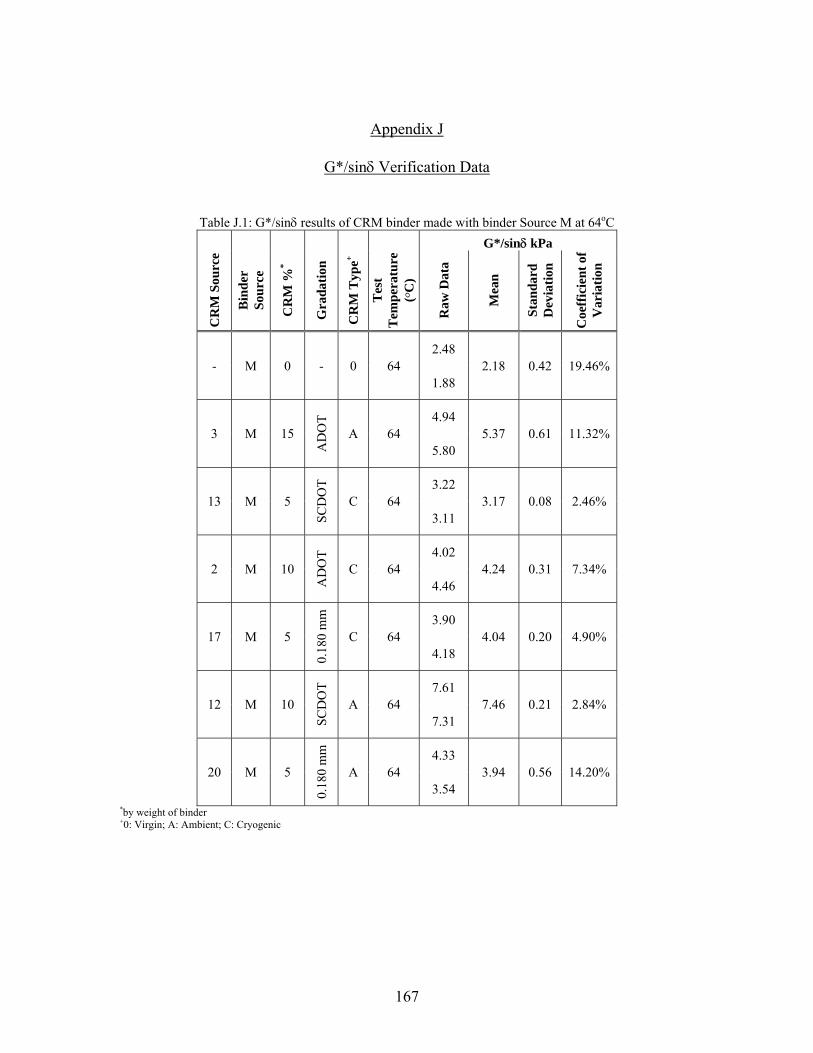
167
Appendix J
G*/sinδ Verification Data
J. S Table J.1: G*/sinδ results of CRM binder made with binder Source M at 64oC
G*/sinδ kPa
CR
M S
ourc
e
Bin
der
Sour
ce
CR
M %
*
Gra
datio
n
CR
M T
ype+
Tes
t T
empe
ratu
re
(oC
)
Raw
Dat
a
Mea
n
Stan
dard
D
evia
tion
Coe
ffic
ient
of
Var
iatio
n
- M 0 - 0 64 2.48
2.18 0.42 19.46% 1.88
3 M 15
AD
OT
A 64 4.94
5.37 0.61 11.32% 5.80
13 M 5
SCD
OT
C 64 3.22
3.17 0.08 2.46% 3.11
2 M 10
AD
OT
C 64 4.02
4.24 0.31 7.34% 4.46
17 M 5
0.18
0 m
m
C 64 3.90
4.04 0.20 4.90% 4.18
12 M 10
SCD
OT
A 64 7.61
7.46 0.21 2.84% 7.31
20 M 5
0.18
0 m
m
A 64 4.33
3.94 0.56 14.20% 3.54
*by weight of binder +0: Virgin; A: Ambient; C: Cryogenic
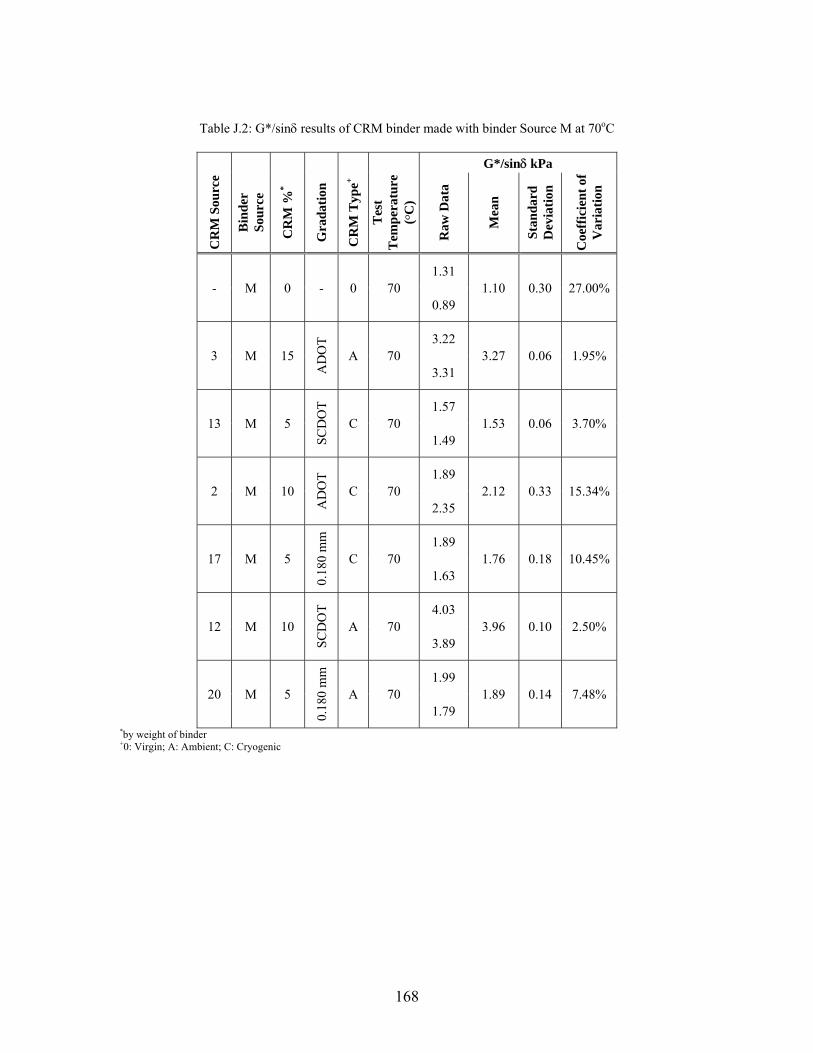
168
Table J.2: G*/sinδ results of CRM binder made with binder Source M at 70oC
G*/sinδ kPa
CR
M S
ourc
e
Bin
der
Sour
ce
CR
M %
*
Gra
datio
n
CR
M T
ype+
Tes
t T
empe
ratu
re
(oC
)
Raw
Dat
a
Mea
n
Stan
dard
D
evia
tion
Coe
ffic
ient
of
Var
iatio
n
- M 0 - 0 70 1.31
1.10 0.30 27.00% 0.89
3 M 15
AD
OT
A 70 3.22
3.27 0.06 1.95% 3.31
13 M 5
SCD
OT
C 70 1.57
1.53 0.06 3.70% 1.49
2 M 10
AD
OT
C 70 1.89
2.12 0.33 15.34% 2.35
17 M 5
0.18
0 m
m
C 70 1.89
1.76 0.18 10.45% 1.63
12 M 10
SCD
OT
A 70 4.03
3.96 0.10 2.50% 3.89
20 M 5
0.18
0 m
m
A 70 1.99
1.89 0.14 7.48% 1.79
*by weight of binder +0: Virgin; A: Ambient; C: Cryogenic
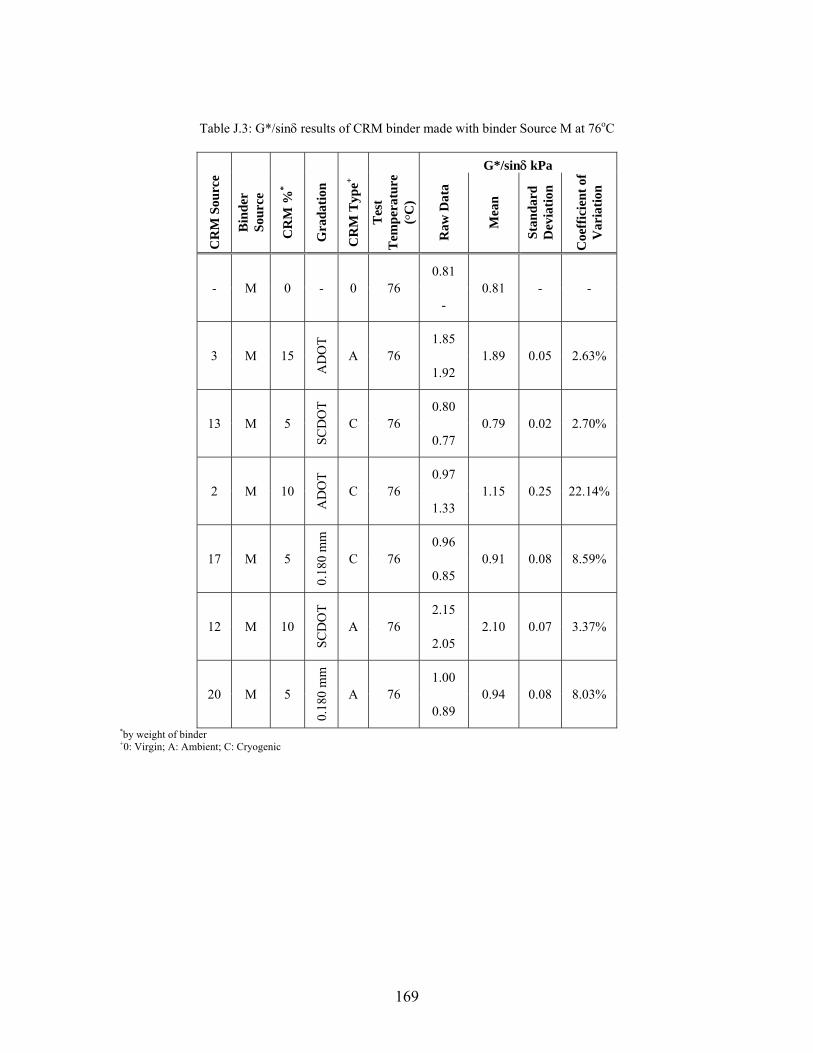
169
Table J.3: G*/sinδ results of CRM binder made with binder Source M at 76oC
G*/sinδ kPa
CR
M S
ourc
e
Bin
der
Sour
ce
CR
M %
*
Gra
datio
n
CR
M T
ype+
Tes
t T
empe
ratu
re
(oC
)
Raw
Dat
a
Mea
n
Stan
dard
D
evia
tion
Coe
ffic
ient
of
Var
iatio
n
- M 0 - 0 76 0.81
0.81 - - -
3 M 15
AD
OT
A 76 1.85
1.89 0.05 2.63% 1.92
13 M 5
SCD
OT
C 76 0.80
0.79 0.02 2.70% 0.77
2 M 10
AD
OT
C 76 0.97
1.15 0.25 22.14% 1.33
17 M 5
0.18
0 m
m
C 76 0.96
0.91 0.08 8.59% 0.85
12 M 10
SCD
OT
A 76 2.15
2.10 0.07 3.37% 2.05
20 M 5
0.18
0 m
m
A 76 1.00
0.94 0.08 8.03% 0.89
*by weight of binder +0: Virgin; A: Ambient; C: Cryogenic
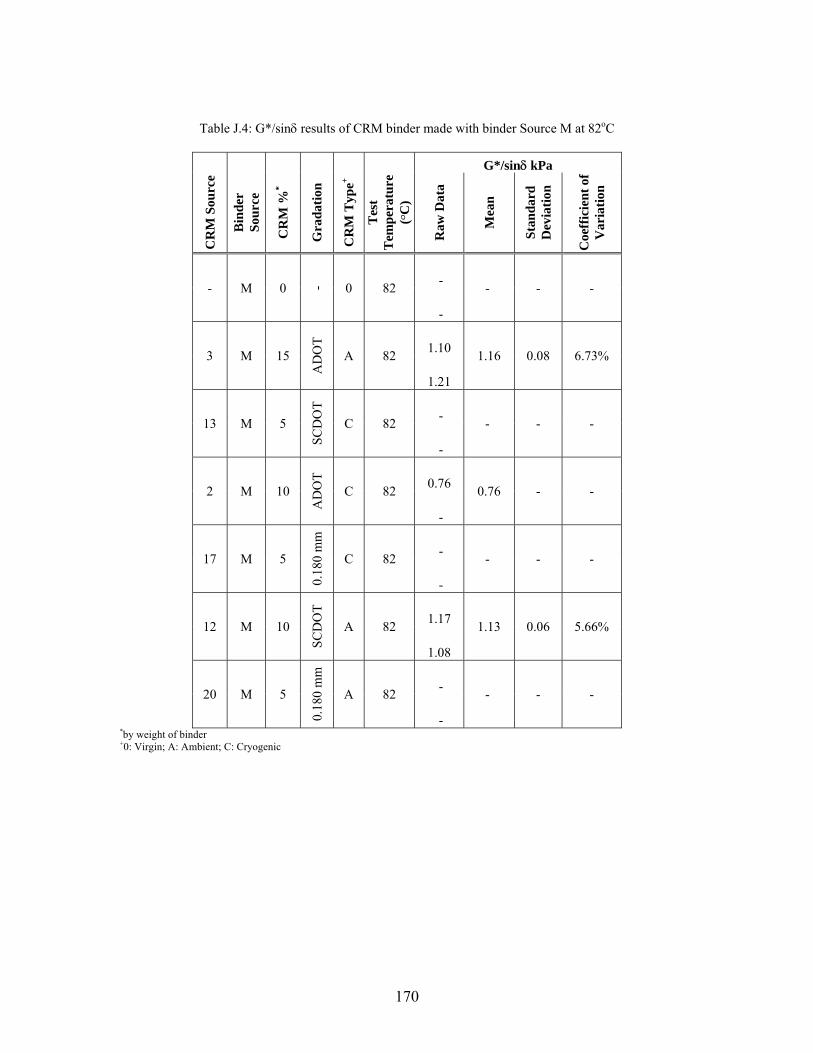
170
Table J.4: G*/sinδ results of CRM binder made with binder Source M at 82oC
G*/sinδ kPa
CR
M S
ourc
e
Bin
der
Sour
ce
CR
M %
*
Gra
datio
n
CR
M T
ype+
Tes
t T
empe
ratu
re
(oC
)
Raw
Dat
a
Mea
n
Stan
dard
D
evia
tion
Coe
ffic
ient
of
Var
iatio
n
- M 0 - 0 82 - - - -
-
3 M 15
AD
OT
A 82 1.10 1.16 0.08 6.73%
1.21
13 M 5
SCD
OT
C 82 - - - -
-
2 M 10
AD
OT
C 82 0.76 0.76 - -
-
17 M 5
0.18
0 m
m
C 82 - - - -
-
12 M 10
SCD
OT
A 82 1.17 1.13 0.06 5.66%
1.08
20 M 5
0.18
0 m
m
A 82 - - - -
- *by weight of binder +0: Virgin; A: Ambient; C: Cryogenic

171
Table J.5: G*/sinδ results of CRM binder made with binder Source M at 88oC
G*/sinδ kPa
CR
M S
ourc
e
Bin
der
Sour
ce
CR
M %
*
Gra
datio
n
CR
M T
ype+
Tes
t T
empe
ratu
re
(oC
)
Raw
Dat
a
Mea
n
Stan
dard
D
evia
tion
Coe
ffic
ient
of
Var
iatio
n
- M 0 - 0 88 - - - -
-
3 M 15
AD
OT
A 88 0.64 0.66 0.02 3.24%
0.67
13 M 5
SCD
OT
C 88 - - - -
-
2 M 10
AD
OT
C 88 - - - -
-
17 M 5
0.18
0 m
m
C 88 - - - -
-
12 M 10
SCD
OT
A 88 0.64 0.61 0.04 6.96%
0.58
20 M 5
0.18
0 m
m
A 88 - - - -
- *by weight of binder +0: Virgin; A: Ambient; C: Cryogenic
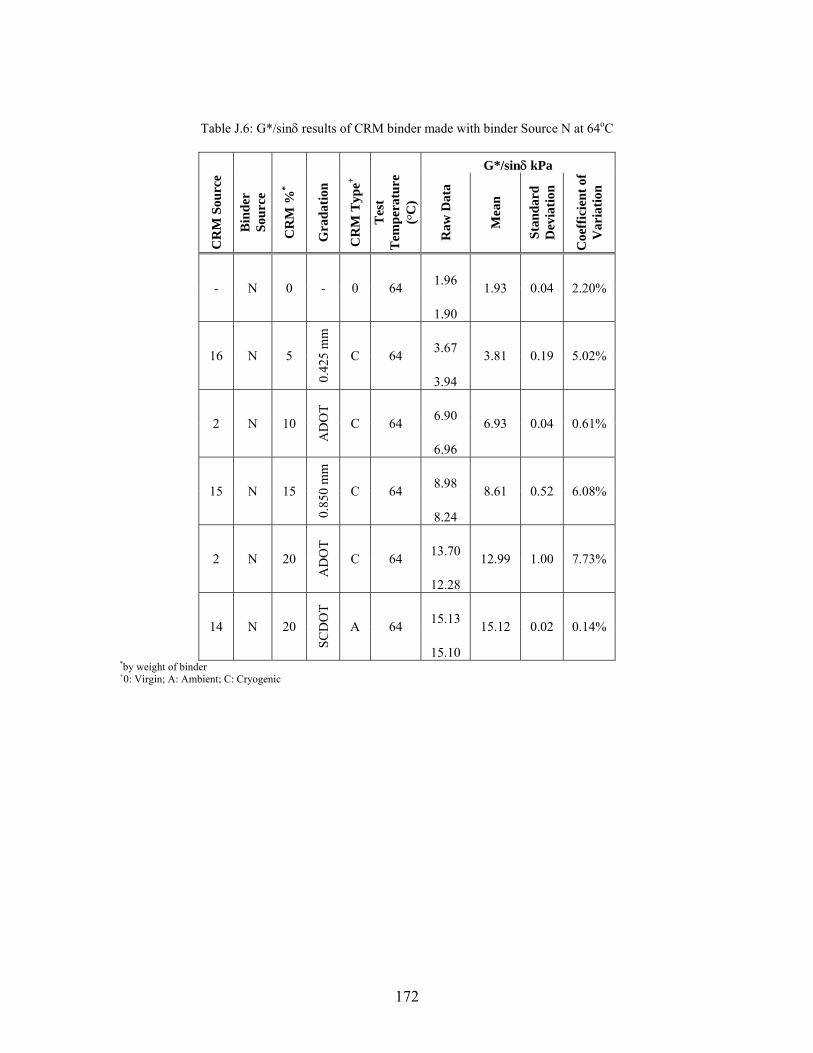
172
Table J.6: G*/sinδ results of CRM binder made with binder Source N at 64oC
G*/sinδ kPa
CR
M S
ourc
e
Bin
der
Sour
ce
CR
M %
*
Gra
datio
n
CR
M T
ype+
Tes
t T
empe
ratu
re
(oC
)
Raw
Dat
a
Mea
n
Stan
dard
D
evia
tion
Coe
ffic
ient
of
Var
iatio
n
- N 0 - 0 64 1.96 1.93 0.04 2.20%
1.90
16 N 5
0.42
5 m
m
C 64 3.67 3.81 0.19 5.02%
3.94
2 N 10
AD
OT
C 64 6.90 6.93 0.04 0.61%
6.96
15 N 15
0.85
0 m
m
C 64 8.98 8.61 0.52 6.08%
8.24
2 N 20
AD
OT
C 64 13.70 12.99 1.00 7.73%
12.28
14 N 20
SCD
OT
A 64 15.13 15.12 0.02 0.14%
15.10 *by weight of binder +0: Virgin; A: Ambient; C: Cryogenic
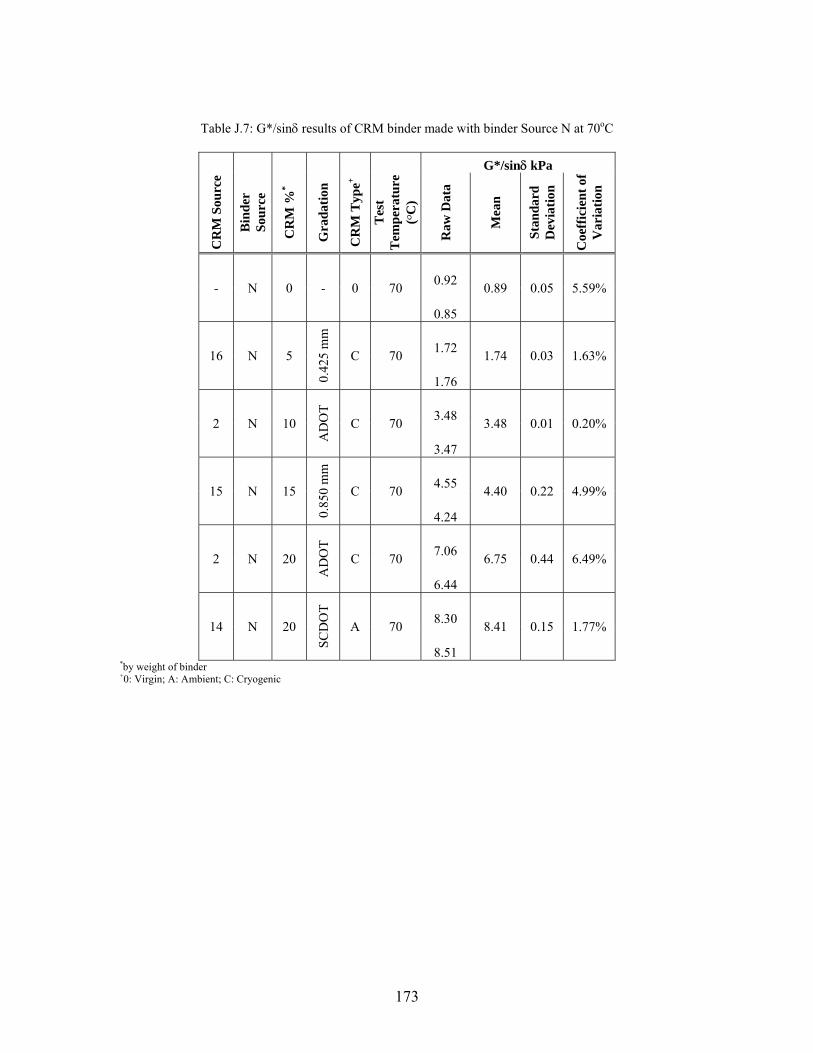
173
Table J.7: G*/sinδ results of CRM binder made with binder Source N at 70oC
G*/sinδ kPa
CR
M S
ourc
e
Bin
der
Sour
ce
CR
M %
*
Gra
datio
n
CR
M T
ype+
Tes
t T
empe
ratu
re
(oC
)
Raw
Dat
a
Mea
n
Stan
dard
D
evia
tion
Coe
ffic
ient
of
Var
iatio
n
- N 0 - 0 70 0.92 0.89 0.05 5.59%
0.85
16 N 5
0.42
5 m
m
C 70 1.72 1.74 0.03 1.63%
1.76
2 N 10
AD
OT
C 70 3.48 3.48 0.01 0.20%
3.47
15 N 15
0.85
0 m
m
C 70 4.55 4.40 0.22 4.99%
4.24
2 N 20
AD
OT
C 70 7.06 6.75 0.44 6.49%
6.44
14 N 20
SCD
OT
A 70 8.30 8.41 0.15 1.77%
8.51 *by weight of binder +0: Virgin; A: Ambient; C: Cryogenic

174
Table J.8: G*/sinδ results of CRM binder made with binder Source N at 76oC
G*/sinδ kPa
CR
M S
ourc
e
Bin
der
Sour
ce
CR
M %
*
Gra
datio
n
CR
M T
ype+
Tes
t T
empe
ratu
re
(oC
)
Raw
Dat
a
Mea
n
Stan
dard
D
evia
tion
Coe
ffic
ient
of
Var
iatio
n
- N 0 - 0 76 - - - -
-
16 N 5
0.42
5 m
m
C 76 0.83 0.87 0.05 5.72%
0.90
2 N 10
AD
OT
C 76 1.78 1.78 0.00 0.00%
1.78
15 N 15
0.85
0 m
m
C 76 2.36 2.27 0.13 5.61%
2.18
2 N 20
AD
OT
C 76 3.44 3.41 0.04 1.24%
3.38
14 N 20
SCD
OT
A 76 4.41 4.56 0.21 4.65%
4.71 *by weight of binder +0: Virgin; A: Ambient; C: Cryogenic
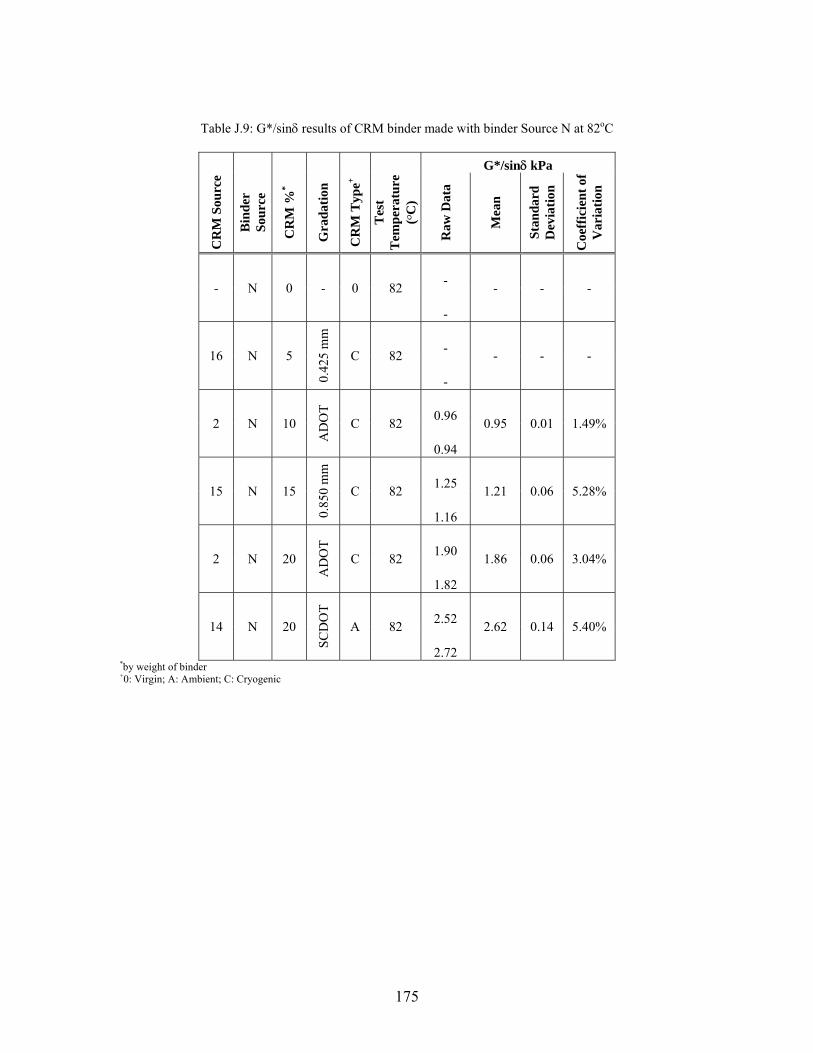
175
Table J.9: G*/sinδ results of CRM binder made with binder Source N at 82oC
G*/sinδ kPa
CR
M S
ourc
e
Bin
der
Sour
ce
CR
M %
*
Gra
datio
n
CR
M T
ype+
Tes
t T
empe
ratu
re
(oC
)
Raw
Dat
a
Mea
n
Stan
dard
D
evia
tion
Coe
ffic
ient
of
Var
iatio
n
- N 0 - 0 82 - - - -
-
16 N 5
0.42
5 m
m
C 82 - - - -
-
2 N 10
AD
OT
C 82 0.96 0.95 0.01 1.49%
0.94
15 N 15
0.85
0 m
m
C 82 1.25 1.21 0.06 5.28%
1.16
2 N 20
AD
OT
C 82 1.90 1.86 0.06 3.04%
1.82
14 N 20
SCD
OT
A 82 2.52 2.62 0.14 5.40%
2.72 *by weight of binder +0: Virgin; A: Ambient; C: Cryogenic
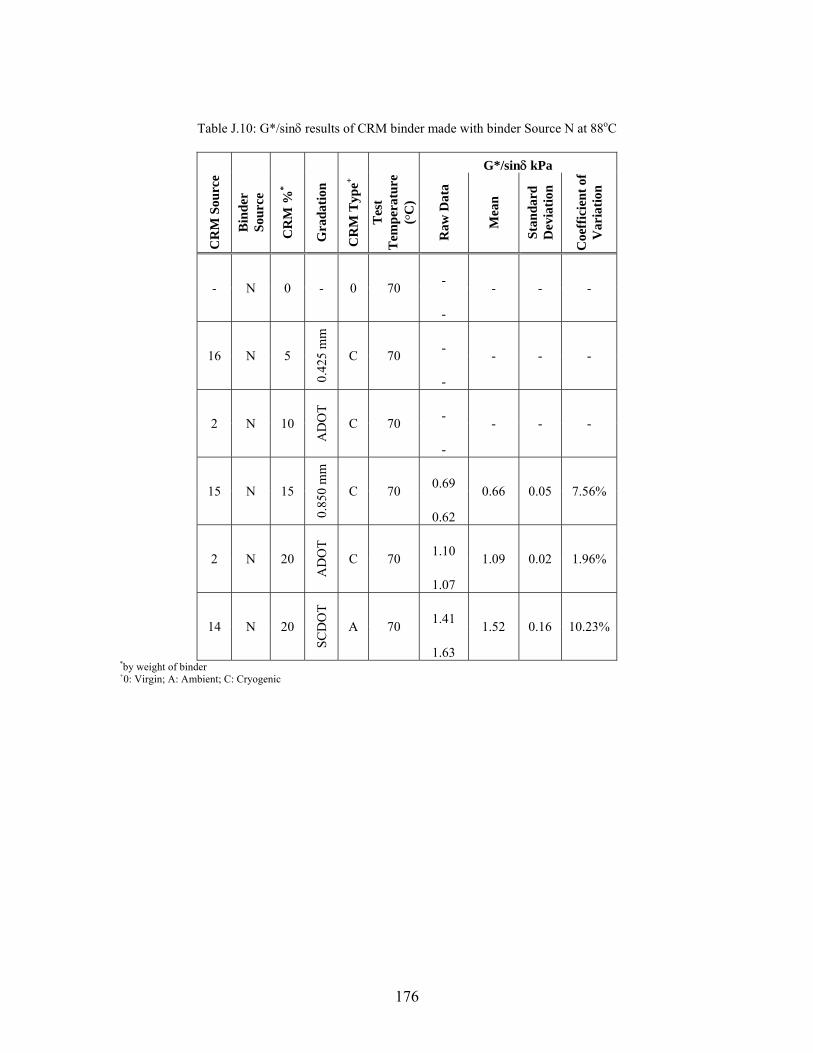
176
Table J.10: G*/sinδ results of CRM binder made with binder Source N at 88oC
G*/sinδ kPa
CR
M S
ourc
e
Bin
der
Sour
ce
CR
M %
*
Gra
datio
n
CR
M T
ype+
Tes
t T
empe
ratu
re
(oC
)
Raw
Dat
a
Mea
n
Stan
dard
D
evia
tion
Coe
ffic
ient
of
Var
iatio
n
- N 0 - 0 70 - - - -
-
16 N 5
0.42
5 m
m
C 70 - - - -
-
2 N 10
AD
OT
C 70 - - - -
-
15 N 15
0.85
0 m
m
C 70 0.69 0.66 0.05 7.56%
0.62
2 N 20
AD
OT
C 70 1.10 1.09 0.02 1.96%
1.07
14 N 20
SCD
OT
A 70 1.41 1.52 0.16 10.23%
1.63 *by weight of binder +0: Virgin; A: Ambient; C: Cryogenic
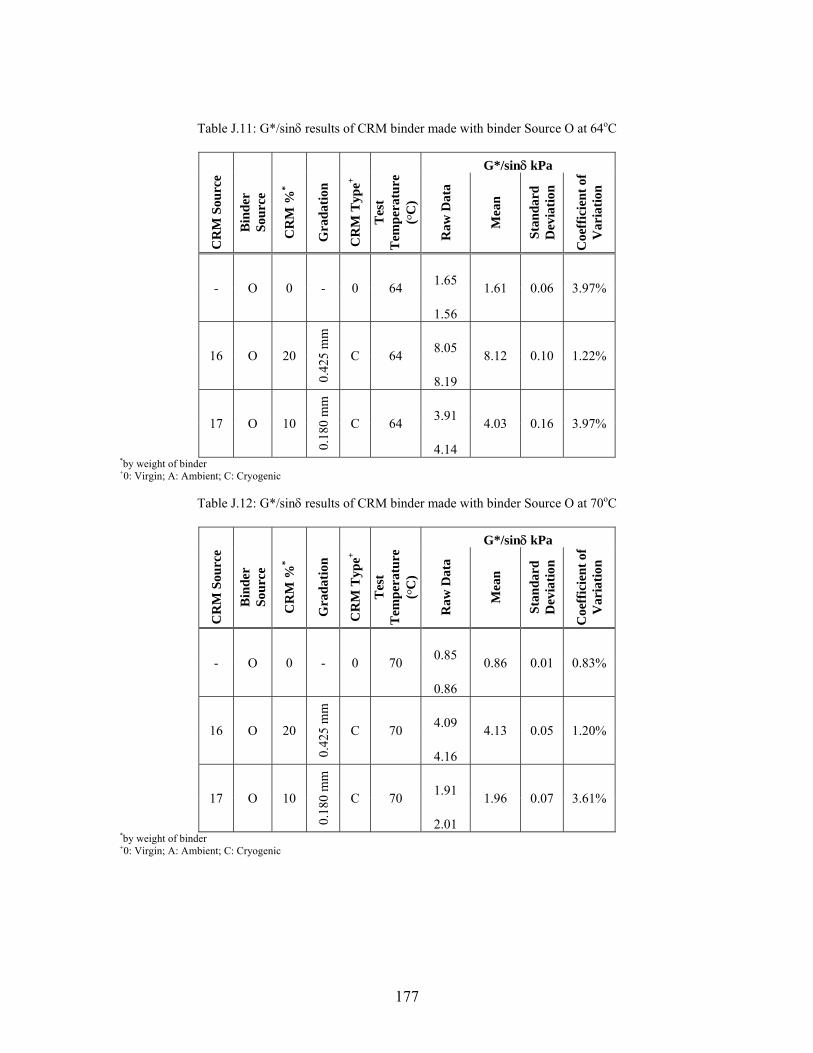
177
Table J.11: G*/sinδ results of CRM binder made with binder Source O at 64oC
G*/sinδ kPa
CR
M S
ourc
e
Bin
der
Sour
ce
CR
M %
*
Gra
datio
n
CR
M T
ype+
Tes
t T
empe
ratu
re
(oC
)
Raw
Dat
a
Mea
n
Stan
dard
D
evia
tion
Coe
ffic
ient
of
Var
iatio
n
- O 0 - 0 64 1.65 1.61 0.06 3.97%
1.56
16 O 20
0.42
5 m
m
C 64 8.05 8.12 0.10 1.22%
8.19
17 O 10
0.18
0 m
m
C 64 3.91 4.03 0.16 3.97%
4.14 *by weight of binder +0: Virgin; A: Ambient; C: Cryogenic
Table J.12: G*/sinδ results of CRM binder made with binder Source O at 70oC
G*/sinδ kPa
CR
M S
ourc
e
Bin
der
Sour
ce
CR
M %
*
Gra
datio
n
CR
M T
ype+
Tes
t T
empe
ratu
re
(oC
)
Raw
Dat
a
Mea
n
Stan
dard
D
evia
tion
Coe
ffic
ient
of
Var
iatio
n
- O 0 - 0 70 0.85 0.86 0.01 0.83%
0.86
16 O 20
0.42
5 m
m
C 70 4.09 4.13 0.05 1.20%
4.16
17 O 10
0.18
0 m
m
C 70 1.91 1.96 0.07 3.61%
2.01 *by weight of binder +0: Virgin; A: Ambient; C: Cryogenic
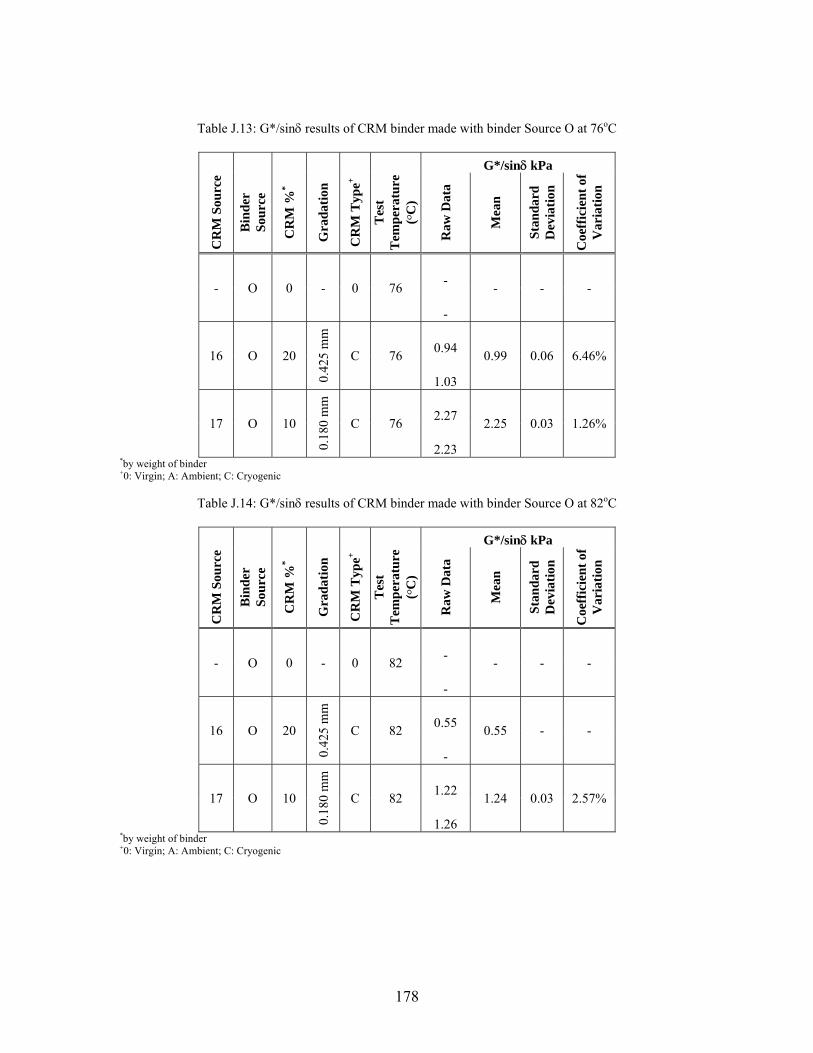
178
Table J.13: G*/sinδ results of CRM binder made with binder Source O at 76oC
G*/sinδ kPa
CR
M S
ourc
e
Bin
der
Sour
ce
CR
M %
*
Gra
datio
n
CR
M T
ype+
Tes
t T
empe
ratu
re
(oC
)
Raw
Dat
a
Mea
n
Stan
dard
D
evia
tion
Coe
ffic
ient
of
Var
iatio
n
- O 0 - 0 76 - - - -
-
16 O 20
0.42
5 m
m
C 76 0.94 0.99 0.06 6.46%
1.03
17 O 10
0.18
0 m
m
C 76 2.27 2.25 0.03 1.26%
2.23 *by weight of binder +0: Virgin; A: Ambient; C: Cryogenic
Table J.14: G*/sinδ results of CRM binder made with binder Source O at 82oC
G*/sinδ kPa
CR
M S
ourc
e
Bin
der
Sour
ce
CR
M %
*
Gra
datio
n
CR
M T
ype+
Tes
t T
empe
ratu
re
(oC
)
Raw
Dat
a
Mea
n
Stan
dard
D
evia
tion
Coe
ffic
ient
of
Var
iatio
n
- O 0 - 0 82 - - - -
-
16 O 20
0.42
5 m
m
C 82 0.55 0.55 - -
-
17 O 10
0.18
0 m
m
C 82 1.22 1.24 0.03 2.57%
1.26 *by weight of binder +0: Virgin; A: Ambient; C: Cryogenic
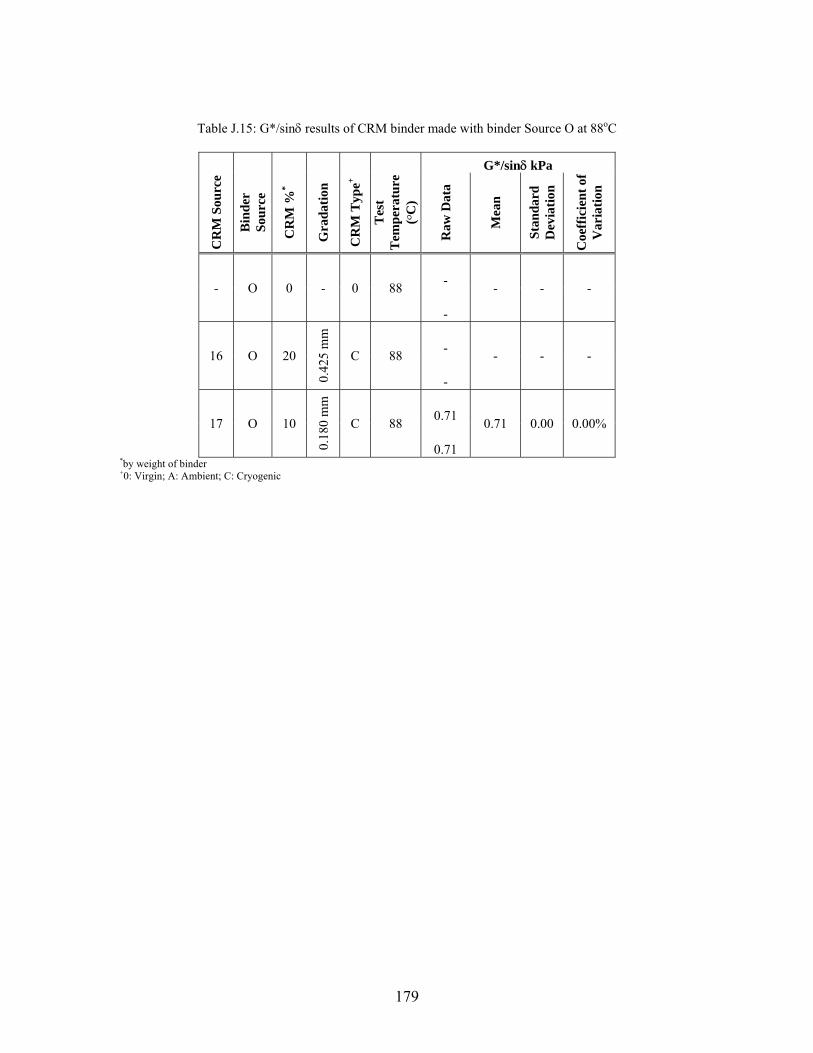
179
Table J.15: G*/sinδ results of CRM binder made with binder Source O at 88oC
G*/sinδ kPa
CR
M S
ourc
e
Bin
der
Sour
ce
CR
M %
*
Gra
datio
n
CR
M T
ype+
Tes
t T
empe
ratu
re
(oC
)
Raw
Dat
a
Mea
n
Stan
dard
D
evia
tion
Coe
ffic
ient
of
Var
iatio
n
- O 0 - 0 88 - - - -
-
16 O 20
0.42
5 m
m
C 88 - - - -
-
17 O 10
0.18
0 m
m
C 88 0.71 0.71 0.00 0.00%
0.71 *by weight of binder +0: Virgin; A: Ambient; C: Cryogenic
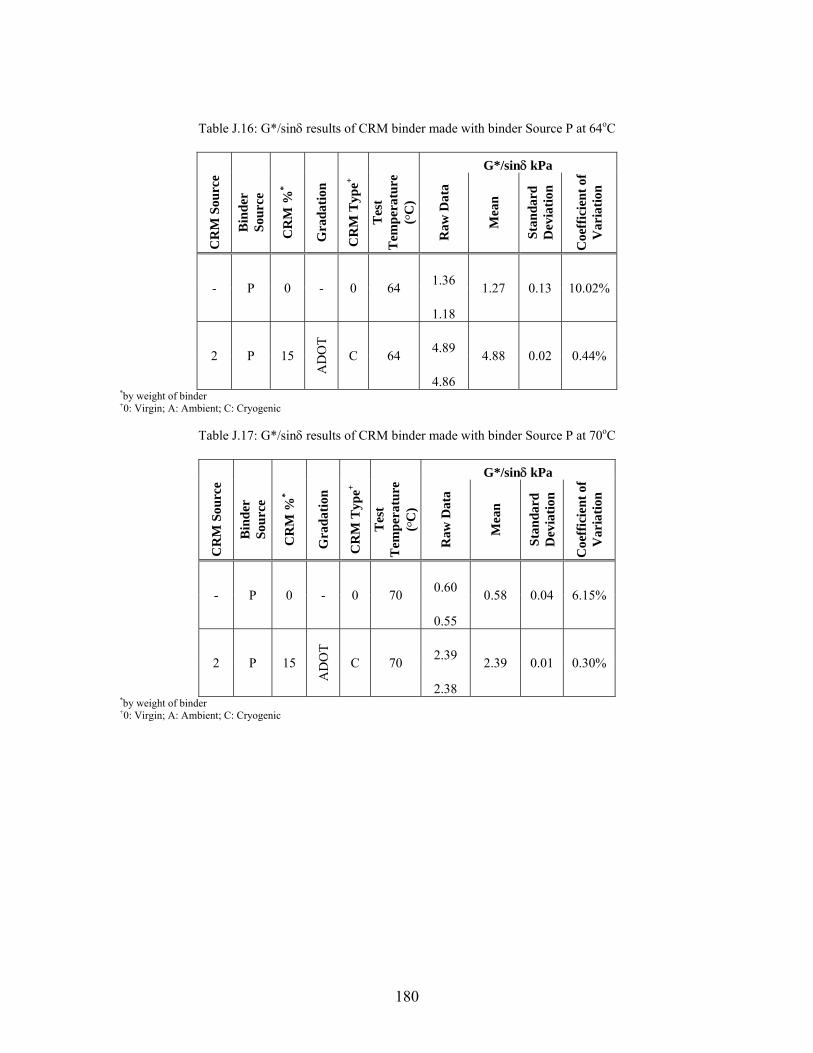
180
Table J.16: G*/sinδ results of CRM binder made with binder Source P at 64oC
G*/sinδ kPa
CR
M S
ourc
e
Bin
der
Sour
ce
CR
M %
*
Gra
datio
n
CR
M T
ype+
Tes
t T
empe
ratu
re
(oC
)
Raw
Dat
a
Mea
n
Stan
dard
D
evia
tion
Coe
ffic
ient
of
Var
iatio
n
- P 0 - 0 64 1.36 1.27 0.13 10.02%
1.18
2 P 15
AD
OT
C 64 4.89 4.88 0.02 0.44%
4.86 *by weight of binder +0: Virgin; A: Ambient; C: Cryogenic
Table J.17: G*/sinδ results of CRM binder made with binder Source P at 70oC
G*/sinδ kPa
CR
M S
ourc
e
Bin
der
Sour
ce
CR
M %
*
Gra
datio
n
CR
M T
ype+
Tes
t T
empe
ratu
re
(oC
)
Raw
Dat
a
Mea
n
Stan
dard
D
evia
tion
Coe
ffic
ient
of
Var
iatio
n - P 0 - 0 70 0.60 0.58 0.04 6.15%
0.55
2 P 15
AD
OT
C 70 2.39 2.39 0.01 0.30%
2.38 *by weight of binder +0: Virgin; A: Ambient; C: Cryogenic
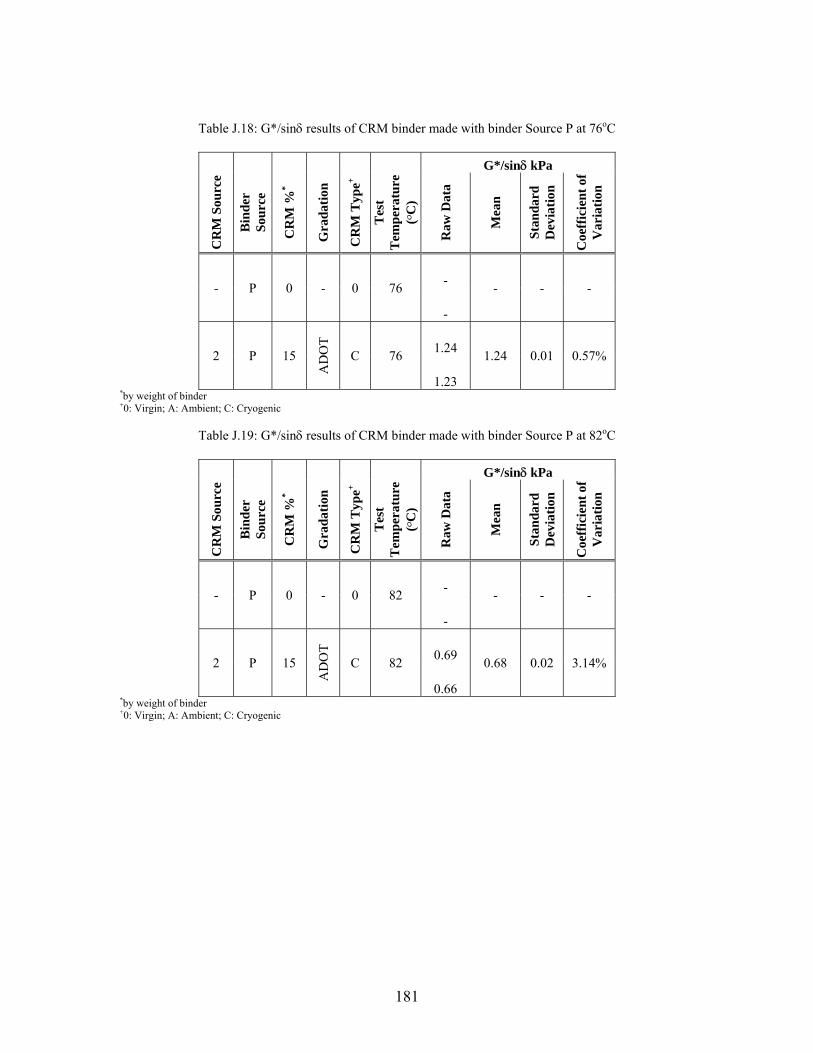
181
Table J.18: G*/sinδ results of CRM binder made with binder Source P at 76oC
G*/sinδ kPa
CR
M S
ourc
e
Bin
der
Sour
ce
CR
M %
*
Gra
datio
n
CR
M T
ype+
Tes
t T
empe
ratu
re
(oC
)
Raw
Dat
a
Mea
n
Stan
dard
D
evia
tion
Coe
ffic
ient
of
Var
iatio
n
- P 0 - 0 76 - - - -
-
2 P 15
AD
OT
C 76 1.24 1.24 0.01 0.57%
1.23 *by weight of binder +0: Virgin; A: Ambient; C: Cryogenic
Table J.19: G*/sinδ results of CRM binder made with binder Source P at 82oC
G*/sinδ kPa
CR
M S
ourc
e
Bin
der
Sour
ce
CR
M %
*
Gra
datio
n
CR
M T
ype+
Tes
t T
empe
ratu
re
(oC
)
Raw
Dat
a
Mea
n
Stan
dard
D
evia
tion
Coe
ffic
ient
of
Var
iatio
n - P 0 - 0 82 - - - -
-
2 P 15
AD
OT
C 82 0.69 0.68 0.02 3.14%
0.66 *by weight of binder +0: Virgin; A: Ambient; C: Cryogenic
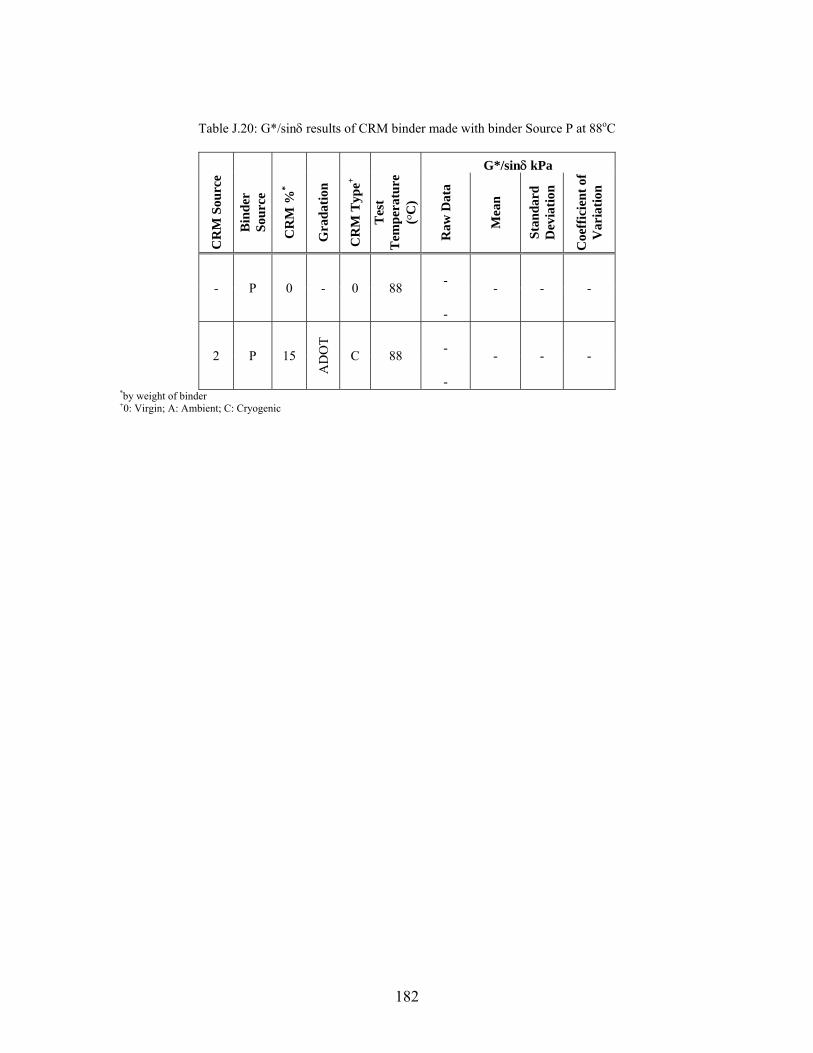
182
Table J.20: G*/sinδ results of CRM binder made with binder Source P at 88oC
G*/sinδ kPa
CR
M S
ourc
e
Bin
der
Sour
ce
CR
M %
*
Gra
datio
n
CR
M T
ype+
Tes
t T
empe
ratu
re
(oC
)
Raw
Dat
a
Mea
n
Stan
dard
D
evia
tion
Coe
ffic
ient
of
Var
iatio
n
- P 0 - 0 88 - - - -
-
2 P 15
AD
OT
C 88 - - - -
- *by weight of binder +0: Virgin; A: Ambient; C: Cryogenic

183
Table J.21: G*/sinδ results of CRM binder made with binder Source Q at 64oC
G*/sinδ kPa
CR
M S
ourc
e
Bin
der
Sour
ce
CR
M %
*
Gra
datio
n
CR
M T
ype+
Tes
t T
empe
ratu
re
(oC
)
Raw
Dat
a
Mea
n
Stan
dard
D
evia
tion
Coe
ffic
ient
of
Var
iatio
n
- Q 0 - 0 64 1.14 1.15 0.01 0.62%
1.15
19 Q 10
0.42
5 m
m
A 64 4.06 4.04 0.04 0.88%
4.01
17 Q 15
0.18
0 m
m
C 64 5.50 5.71 0.29 5.08%
5.91
16 Q 15
0.42
5 m
m
C 64 5.62 5.40 0.32 5.90%
5.17
18 Q 15
0.85
0 m
m
A 64 6.17 6.16 0.02 0.34%
6.14
17 Q 5
0.18
0 m
m
C 64 2.03 1.93 0.15 7.71%
1.82 *by weight of binder +0: Virgin; A: Ambient; C: Cryogenic
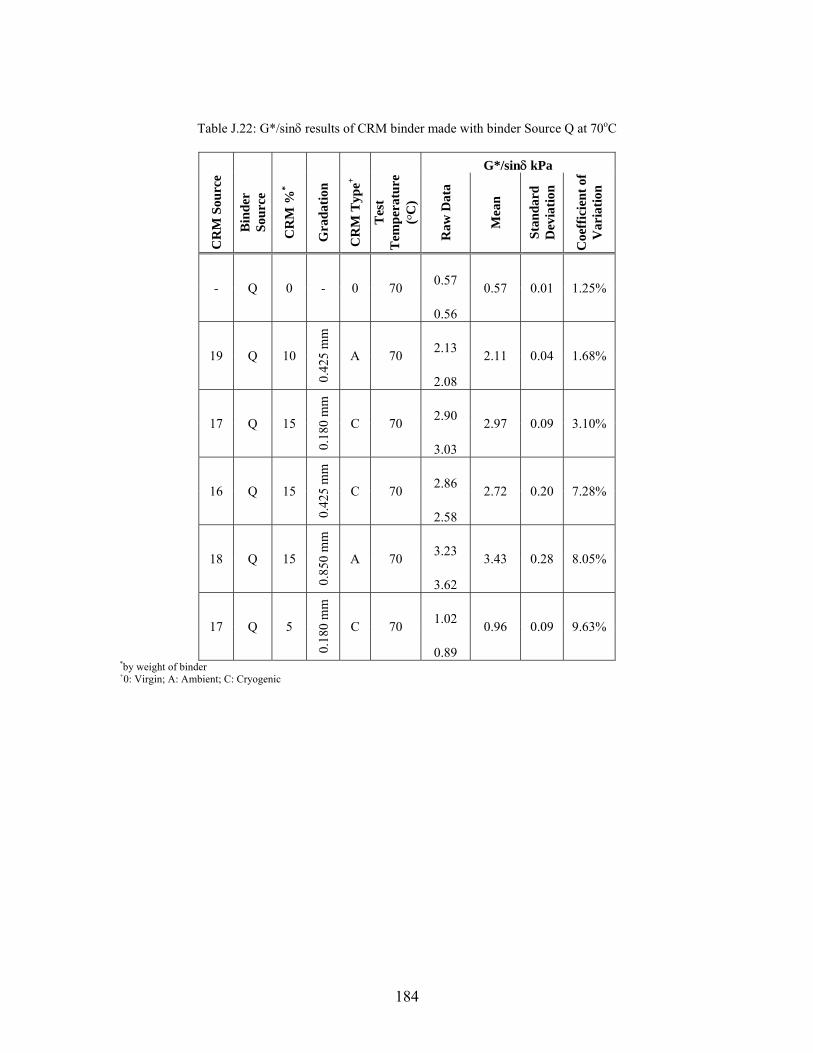
184
Table J.22: G*/sinδ results of CRM binder made with binder Source Q at 70oC
G*/sinδ kPa
CR
M S
ourc
e
Bin
der
Sour
ce
CR
M %
*
Gra
datio
n
CR
M T
ype+
Tes
t T
empe
ratu
re
(oC
)
Raw
Dat
a
Mea
n
Stan
dard
D
evia
tion
Coe
ffic
ient
of
Var
iatio
n
- Q 0 - 0 70 0.57 0.57 0.01 1.25%
0.56
19 Q 10
0.42
5 m
m
A 70 2.13 2.11 0.04 1.68%
2.08
17 Q 15
0.18
0 m
m
C 70 2.90 2.97 0.09 3.10%
3.03
16 Q 15
0.42
5 m
m
C 70 2.86 2.72 0.20 7.28%
2.58
18 Q 15
0.85
0 m
m
A 70 3.23 3.43 0.28 8.05%
3.62
17 Q 5
0.18
0 m
m
C 70 1.02 0.96 0.09 9.63%
0.89 *by weight of binder +0: Virgin; A: Ambient; C: Cryogenic
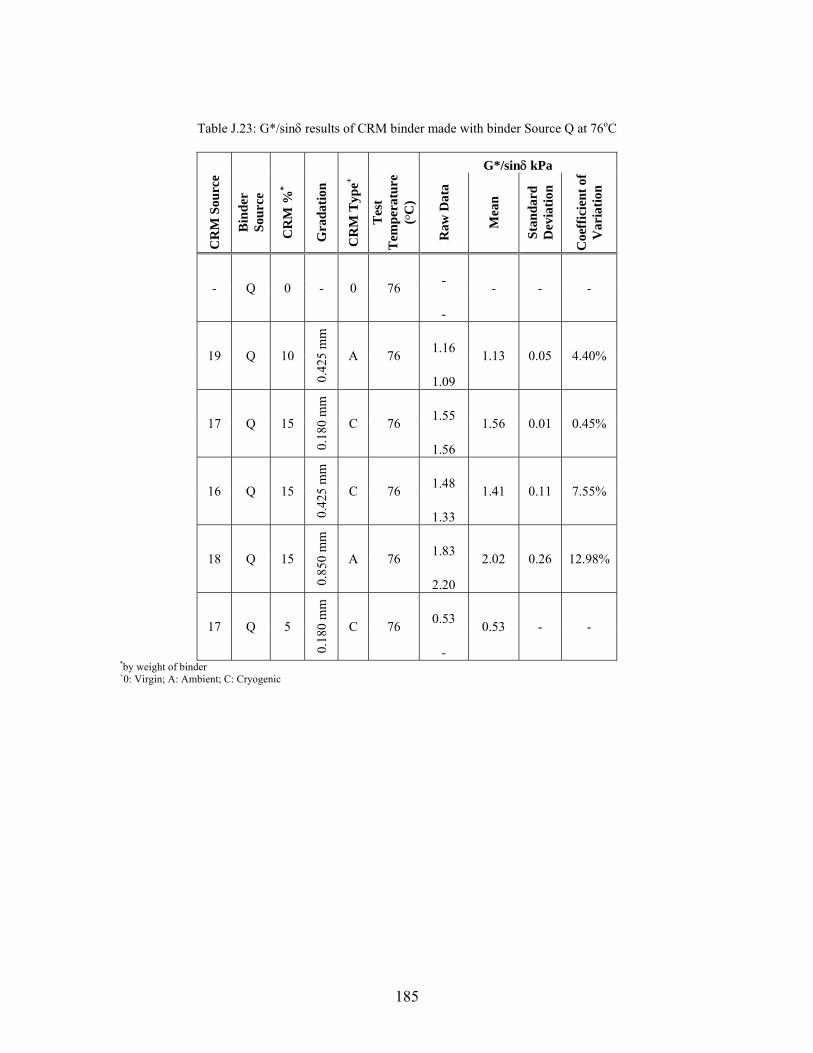
185
Table J.23: G*/sinδ results of CRM binder made with binder Source Q at 76oC
G*/sinδ kPa
CR
M S
ourc
e
Bin
der
Sour
ce
CR
M %
*
Gra
datio
n
CR
M T
ype+
Tes
t T
empe
ratu
re
(oC
)
Raw
Dat
a
Mea
n
Stan
dard
D
evia
tion
Coe
ffic
ient
of
Var
iatio
n
- Q 0 - 0 76 - - - -
-
19 Q 10
0.42
5 m
m
A 76 1.16 1.13 0.05 4.40%
1.09
17 Q 15
0.18
0 m
m
C 76 1.55 1.56 0.01 0.45%
1.56
16 Q 15
0.42
5 m
m
C 76 1.48 1.41 0.11 7.55%
1.33
18 Q 15
0.85
0 m
m
A 76 1.83 2.02 0.26 12.98%
2.20
17 Q 5
0.18
0 m
m
C 76 0.53 0.53 - -
- *by weight of binder +0: Virgin; A: Ambient; C: Cryogenic
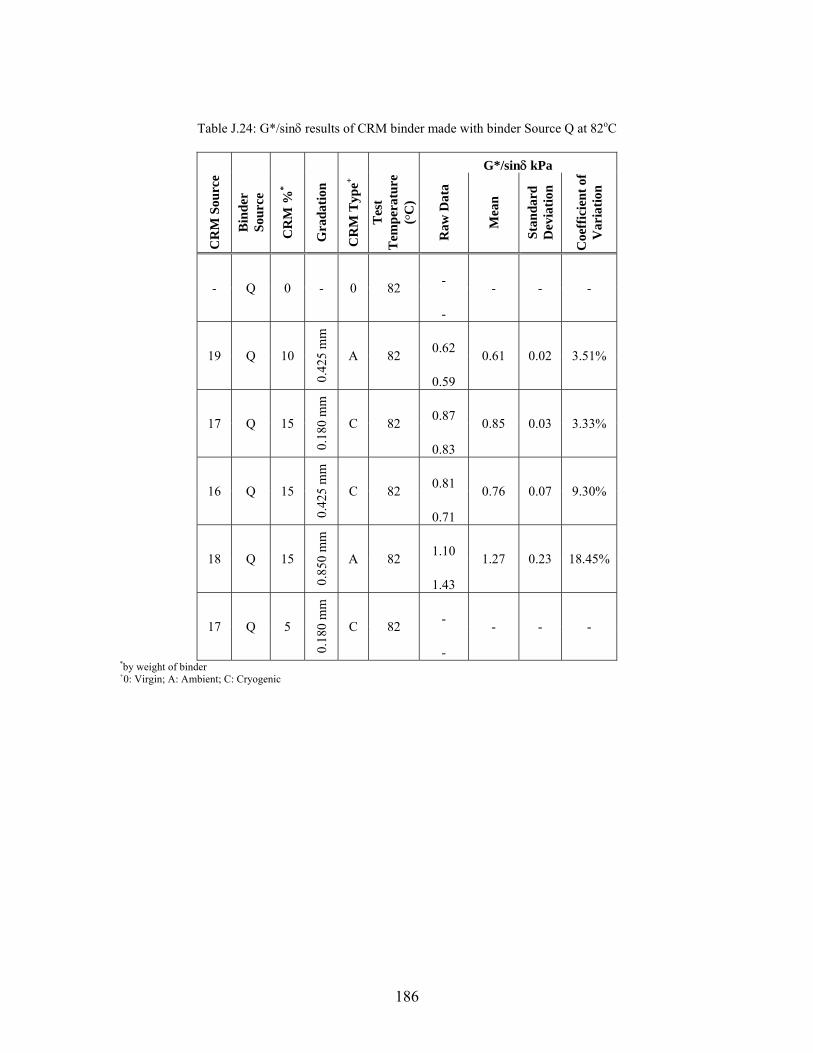
186
Table J.24: G*/sinδ results of CRM binder made with binder Source Q at 82oC
G*/sinδ kPa
CR
M S
ourc
e
Bin
der
Sour
ce
CR
M %
*
Gra
datio
n
CR
M T
ype+
Tes
t T
empe
ratu
re
(oC
)
Raw
Dat
a
Mea
n
Stan
dard
D
evia
tion
Coe
ffic
ient
of
Var
iatio
n
- Q 0 - 0 82 - - - -
-
19 Q 10
0.42
5 m
m
A 82 0.62 0.61 0.02 3.51%
0.59
17 Q 15
0.18
0 m
m
C 82 0.87 0.85 0.03 3.33%
0.83
16 Q 15
0.42
5 m
m
C 82 0.81 0.76 0.07 9.30%
0.71
18 Q 15
0.85
0 m
m
A 82 1.10 1.27 0.23 18.45%
1.43
17 Q 5
0.18
0 m
m
C 82 - - - -
- *by weight of binder +0: Virgin; A: Ambient; C: Cryogenic
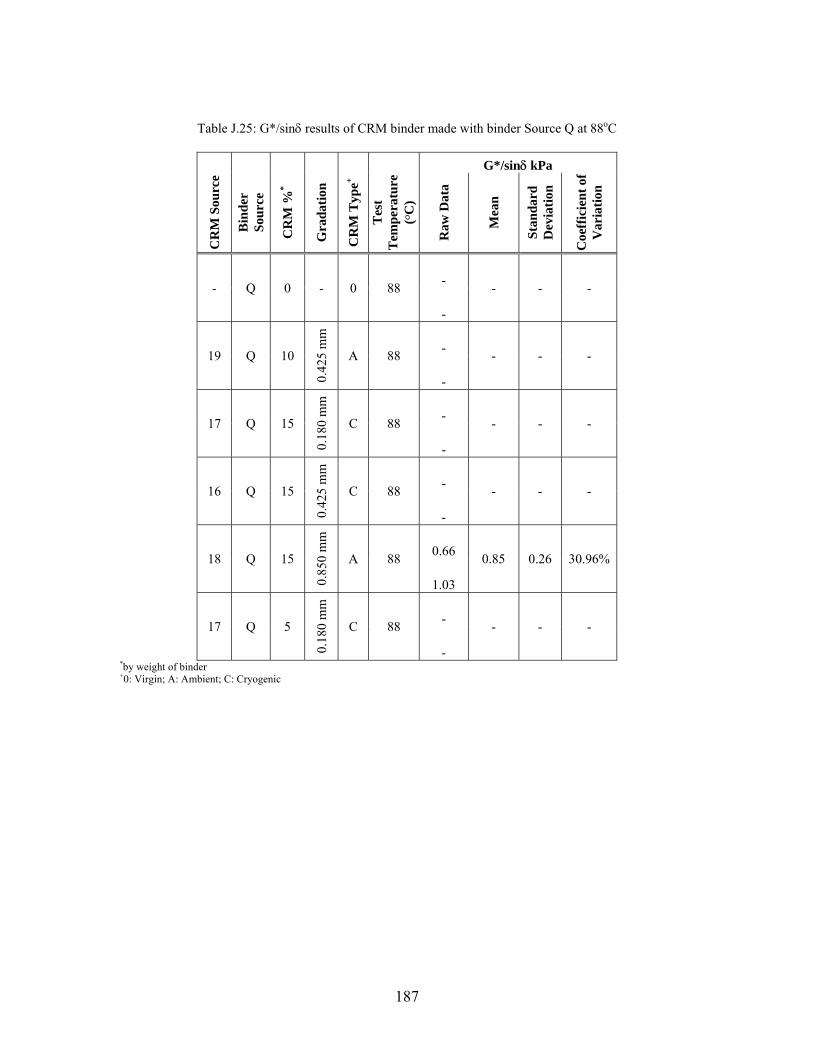
187
Table J.25: G*/sinδ results of CRM binder made with binder Source Q at 88oC
G*/sinδ kPa
CR
M S
ourc
e
Bin
der
Sour
ce
CR
M %
*
Gra
datio
n
CR
M T
ype+
Tes
t T
empe
ratu
re
(oC
)
Raw
Dat
a
Mea
n
Stan
dard
D
evia
tion
Coe
ffic
ient
of
Var
iatio
n
- Q 0 - 0 88 - - - -
-
19 Q 10
0.42
5 m
m
A 88 - - - -
-
17 Q 15
0.18
0 m
m
C 88 - - - -
-
16 Q 15
0.42
5 m
m
C 88 - - - -
-
18 Q 15
0.85
0 m
m
A 88 0.66 0.85 0.26 30.96%
1.03
17 Q 5
0.18
0 m
m
C 88 - - - -
- *by weight of binder +0: Virgin; A: Ambient; C: Cryogenic
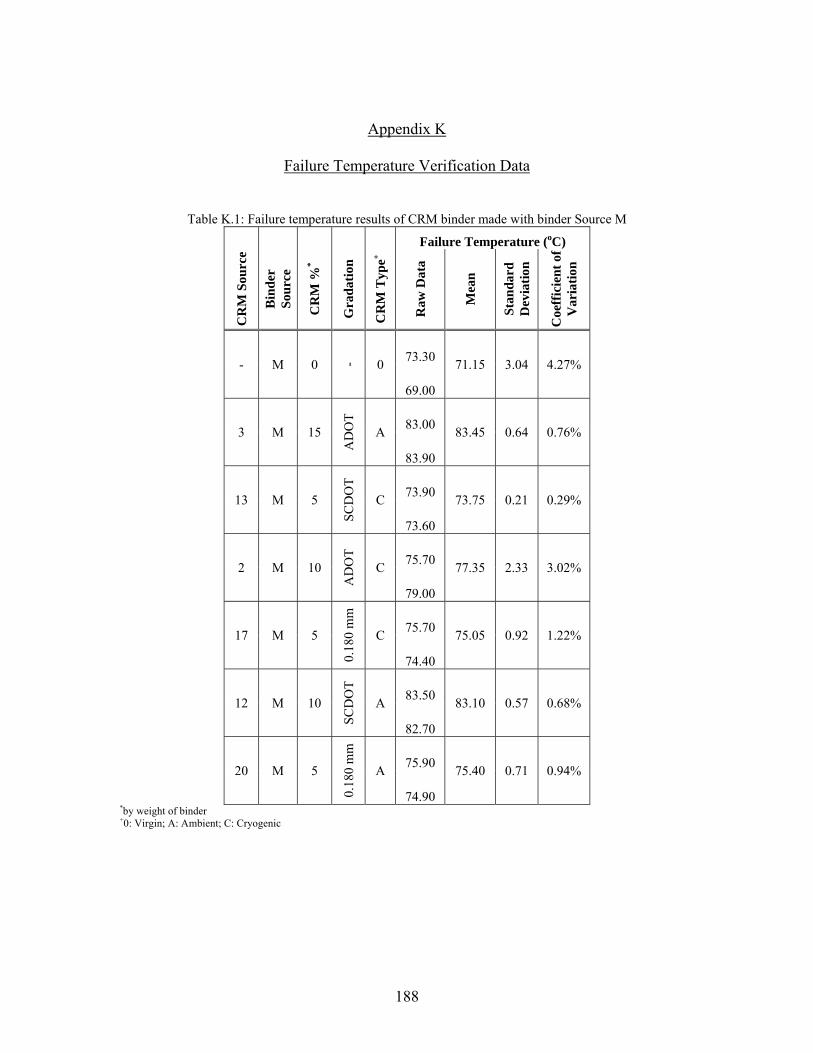
188
Appendix K
Failure Temperature Verification Data
K. S Table K.1: Failure temperature results of CRM binder made with binder Source M
Failure Temperature (oC) C
RM
Sou
rce
Bin
der
Sour
ce
CR
M %
*
Gra
datio
n
CR
M T
ype+
Raw
Dat
a
Mea
n
Stan
dard
D
evia
tion
Coe
ffic
ient
of
Var
iatio
n
- M 0 - 0 73.30 71.15 3.04 4.27%
69.00
3 M 15
AD
OT
A 83.00 83.45 0.64 0.76%
83.90
13 M 5
SCD
OT
C 73.90 73.75 0.21 0.29%
73.60
2 M 10
AD
OT
C 75.70 77.35 2.33 3.02%
79.00
17 M 5
0.18
0 m
m
C 75.70 75.05 0.92 1.22%
74.40
12 M 10
SCD
OT
A 83.50 83.10 0.57 0.68%
82.70
20 M 5
0.18
0 m
m
A 75.90 75.40 0.71 0.94%
74.90 *by weight of binder +0: Virgin; A: Ambient; C: Cryogenic
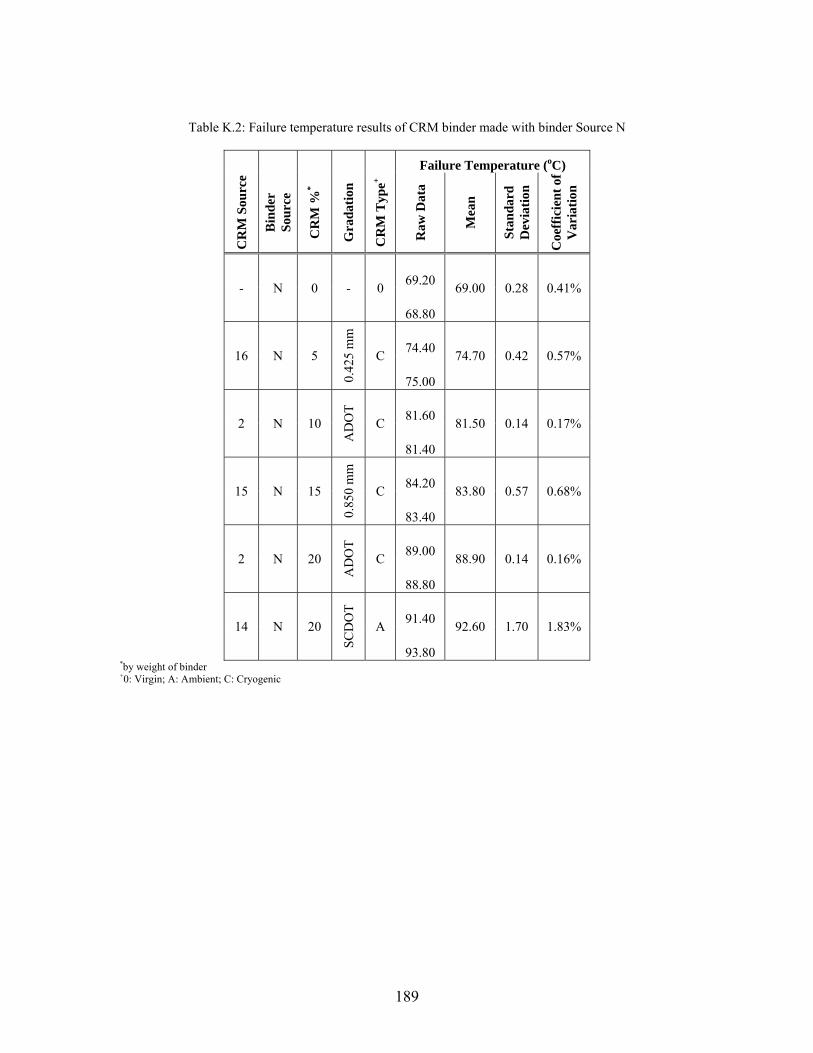
189
Table K.2: Failure temperature results of CRM binder made with binder Source N
Failure Temperature (oC)
CR
M S
ourc
e
Bin
der
Sour
ce
CR
M %
*
Gra
datio
n
CR
M T
ype+
Raw
Dat
a
Mea
n
Stan
dard
D
evia
tion
Coe
ffic
ient
of
Var
iatio
n
- N 0 - 0 69.20 69.00 0.28 0.41%
68.80
16 N 5 0.
425
mm
C 74.40 74.70 0.42 0.57%
75.00
2 N 10
AD
OT
C 81.60 81.50 0.14 0.17%
81.40
15 N 15
0.85
0 m
m
C 84.20 83.80 0.57 0.68%
83.40
2 N 20
AD
OT
C 89.00 88.90 0.14 0.16%
88.80
14 N 20
SCD
OT
A 91.40 92.60 1.70 1.83%
93.80 *by weight of binder +0: Virgin; A: Ambient; C: Cryogenic
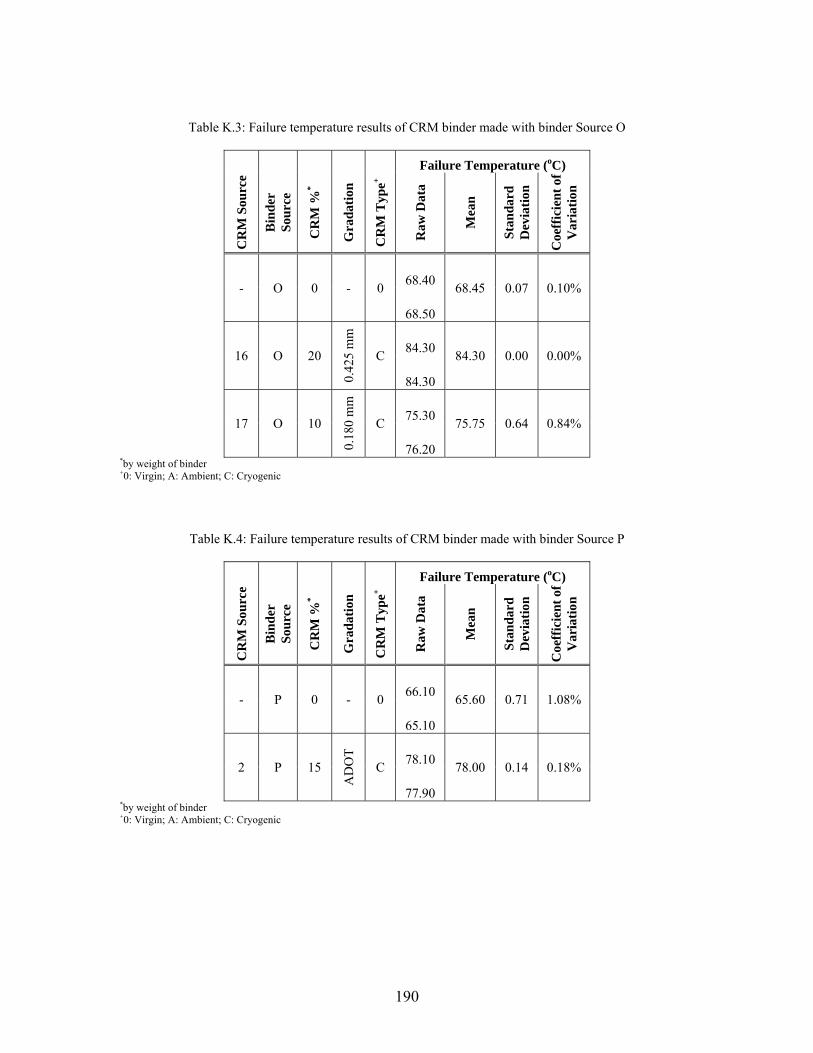
190
Table K.3: Failure temperature results of CRM binder made with binder Source O
Failure Temperature (oC)
CR
M S
ourc
e
Bin
der
Sour
ce
CR
M %
*
Gra
datio
n
CR
M T
ype+
Raw
Dat
a
Mea
n
Stan
dard
D
evia
tion
Coe
ffic
ient
of
Var
iatio
n
- O 0 - 0 68.40 68.45 0.07 0.10%
68.50
16 O 20 0.
425
mm
C 84.30 84.30 0.00 0.00%
84.30
17 O 10
0.18
0 m
m
C 75.30 75.75 0.64 0.84%
76.20 *by weight of binder +0: Virgin; A: Ambient; C: Cryogenic
Table K.4: Failure temperature results of CRM binder made with binder Source P
Failure Temperature (oC)
CR
M S
ourc
e
Bin
der
Sour
ce
CR
M %
*
Gra
datio
n
CR
M T
ype+
Raw
Dat
a
Mea
n
Stan
dard
D
evia
tion
Coe
ffic
ient
of
Var
iatio
n
- P 0 - 0 66.10 65.60 0.71 1.08%
65.10
2 P 15
AD
OT
C 78.10 78.00 0.14 0.18%
77.90 *by weight of binder +0: Virgin; A: Ambient; C: Cryogenic
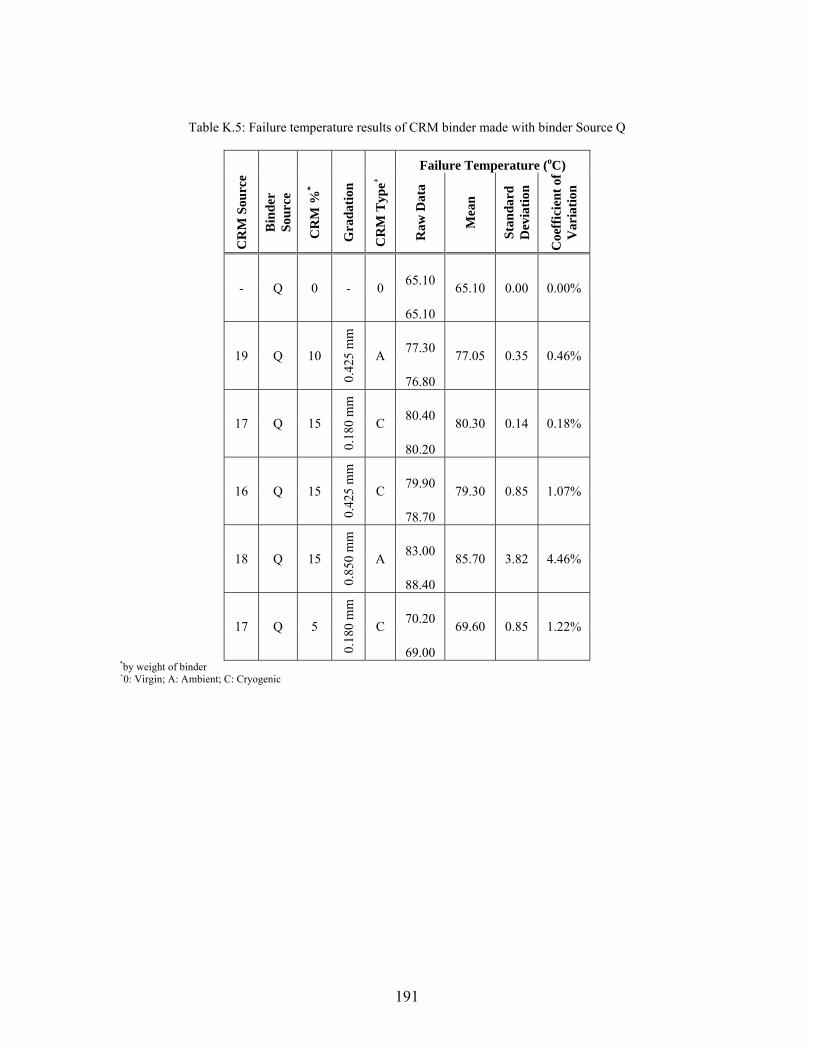
191
Table K.5: Failure temperature results of CRM binder made with binder Source Q
Failure Temperature (oC)
CR
M S
ourc
e
Bin
der
Sour
ce
CR
M %
*
Gra
datio
n
CR
M T
ype+
Raw
Dat
a
Mea
n
Stan
dard
D
evia
tion
Coe
ffic
ient
of
Var
iatio
n
- Q 0 - 0 65.10 65.10 0.00 0.00%
65.10
19 Q 10 0.
425
mm
A 77.30 77.05 0.35 0.46%
76.80
17 Q 15
0.18
0 m
m
C 80.40 80.30 0.14 0.18%
80.20
16 Q 15
0.42
5 m
m
C 79.90 79.30 0.85 1.07%
78.70
18 Q 15
0.85
0 m
m
A 83.00 85.70 3.82 4.46%
88.40
17 Q 5
0.18
0 m
m
C 70.20 69.60 0.85 1.22%
69.00 *by weight of binder +0: Virgin; A: Ambient; C: Cryogenic
192
REFERENCES
Abdelrahman, M. A., & Carpenter, S. H. (1999). Mechanism of Interaction of Asphalt Cements with Crumb Rubber Modifier. Transportation Research Record , 106-113.
Abdelrahman, M. (2006). Controlling the Performance of Crumb Rubber Modifier
(CRM) Binders through the Addition of Polymer Modifiers. Transportation Research Record .
American Association of State Highway and Transportation Officials. (2005). AASHTO
M 320 Standard Specification for Performance-Graded Asphalt Binder. Washington DC: AASHTO.
American Association of State Highway and Transportation Officials. (2005). AASHTO T
313: Standard Test Method for Determining the Flexural Creep Stiffness of Asphalt Binder Using the Bending Beam. Washington DC: AASHTO.
American Association of State Highway and Transportation Officials. (2006). AASHTO T
315 Standard Method of Test for Determining the Rheological Properties of Asphalt Binder Using a Dynamic Shear Rheometer (DSR). Washington DC: AASHTO.
American Association of State Highway Officials. (2006). AASHTO T 316 Viscosity
Determination of Asphalt Binder using Rotational Viscometer. Washington DC: AASHTO.
American Society of Testing and Materials. (2001). D 6114 Standard Specification for
Asphalt Rubber Binder. In A. B. Standards, Road and Paving Materials: Vehicle Pavement Systems. West Conshohoken, PA: ASTM.
Amirkhanian, S. N. (2003). Establishment of an Asphalt-Rubber Technology Service
(ARTS). Proceedings of the Asphalt Rubber 2003 Conference, 2, pp. 577-588. Brasilia, Brazil.
Asphalt Institute. (2003). Performance Graded Asphalt Binder Specification and Testing,
Superpave Series No.1 (SP-1). Lexington, KY: Asphalt Institute. Bahia, H. U., & Davies, R. (1996). Factors Controlling the Effect of Crumb Rubber on
Critical Properties of Asphalt Binders. Journal of the Association of Asphalt Paving Technologists , 64, 130-162.
193
Bahia, H. U., & Davis, R. (1994). Effect of Crumb Rubber Modifiers (CRM) on Performance Related properties of Asphalt Binders. Journal of the Association of Asphalt Paving Technologists , 63, 414-449.
Blumenthal, M. H. (1994). Producing Ground Scrap Tire: A Comparison Between
Ambient and Cryogenic Technologies. Washington, D.C.: Rubber Manufacturer's Association.
California Department of Transportation. (2003). Asphalt Rubber Usage Guide.
Sacramento, CA. Chehoveits, J. G., Dunning, R. L., & Morris, G. R. (1982). Characteristics of Asphalt-
Rubber by the Sliding Plate Microviscometer. Association of Asphalt Paving Technologies , 240.
Cramer, S., & Swanson, M. (1973). An Evaluation of Ten Pairwise Multiple Comparison
Procedures by Monte Carlo Methods. Journal of the American Statistical Association , 66-74.
Dantas Neto, S. A., Farias, M. M., Pais, J. C., Pereira, .. A., & Picado Santos, L. (2003).
Behavior of Asphalt-Rubber Hot Mixes Obtained with High Crumb Rubber Contents. Proceedings of the Asphalt Rubber 2003 Conference, 2, pp. 147-158. Brasilia, Brazil.
Environmental Protection Agency. (2007, January 2007). Retrieved August 29, 2007,
from Management of Scrap Tires: http://www.epa.gov/garbage/tires/ Environmental Protection Agency. (2007, August 17). Green Buildings. Retrieved
August 29, 2007, from Why Build Green: http://www.epa.gov/greenbuilding/ Environmental Protection Agency. (2007, September 6). Management of Scrap Tires.
Retrieved January 7, 2008, from Tire Fires: http://www.epa.gov/garbage/tires/fires.htm
Environmental Protection Agency. (2006). Municipal Solid Waste Generation, Recycling,
and Disposal in the United States: Facts and Figures for 2006. Washington, DC: Environmental Protection Agency.
Eyring, H. (1936). Viscosity, Plasticity, and Diffusion as Examples of Absolute Reaction
Rates. Journal of Chemical Physics , 283-291. Fisher, R. A. (1949). The Design of Experiments. Edinburgh: Oliver and Boyd.
194
Griffith, J. M., & Puzinauskas, V. P. (1963). Relation of Empirical Tests to Fundamental Viscosity of Asphalt Cement. Philadelphia, PA: ASTM Special Technical Publication No. 328.
Jennrich, R. I. (1995). An Introduction to Computational Statistics: Regression Analysis.
Englewood Cliffs, NJ: Prentics-Hall, Inc. Khalid, H. A., & Artamendi, I. (2004, March). Mechanical Properties of used-tyre
Rubber. Engineering Sustainability , pp. 37-43. Kyari, M., Cunliffe, & Williams, P. (2005). Characterization of Oils, Gases, and Char in
Relation to the Pyrolysis of Different Brands of Scrap Automotive Tires. Energy and Fuels Vol. 19 .
Lee, K. W., & Mahboub, K. C. (2006). Asphalt Mix Design: Past, Present, and Future.
Washington, D.C.: American Society of Civil Engineers. Lee, S., Amirkhanian, S., Thodesen, C., & Shatanawi, K. (2006). Effect of Compaction
Temperatures on Rubber Asphalt Mixes. Asphalt Rubber Conference. Palm Springs, CA.
Lougheed, T. J., & Pappagiannakis, A. T. (1996). Viscosity Characteristics of Rubber
Modified Asphals. Journal of Materials in Civil Engineering , 153-156. Maze, M. (1996). Viscosity of EVA Modified Polymerzed Bitumens. Eurasphalt and
Eurobitume Congress (p. No. 5117). Strasbourg, France: Eurobitume. Oliver, J. W. (1982). Optimizing the Improvements Obtained by the Digestion of
Comminuted Scrap Rubbers in Paving Asphalts. Association of Asphalt Paving technologies , 169.
Ott, R. L., & Longnecker, M. (2001). An Introduction to Statistical Methods and Data
Analysis. In R. L. Ott, & M. Longnecker. Pacific Grove, CA, USA: Duxbury. Painter, P. C., & Coleman, M. M. (1997). Fundamentals of Polymer Science - An
Introductory Text. Lancaster, PA: Technomic Publishing Co. Inc. Pellinen, T. K., Witczak, M. W., & Bonaquist, R. F. (2002). Asphalt Mix Master Curve
Construction using Sigmoidal Fitting Function with Non-linear Least Squares Optimization. 15th ASCE Engineering Mechanics Conferences. New York, NY: ASCE.
195
Putman, B. J. (2005). Quantification of the Effects of Crumb Rubber in CRM Binders. PhD Dissertation, Clemson University, Department of Civil Engineering, Clemson, SC.
Putman, B. J., & Amirkhanian, S. N. (2006). Crumb Rubber Modification of Binders:
Interaction and Particle Effects. Proceedings of the Asphalt Rubber 2006 Conference, 3, pp. 655-677. Palm Springs,Ca.
Puzinauskas, V. P. (1967). Evaluation of Properties of Asphalt Cements with Emphasis
on Consistencies at Low Temperatures. Association of Asphalt Paving Technologists (pp. 489-540). Denver, CP: AAPT.
Rasmussen, R. O., Lytton, R. L., & Chang, G. K. (2002). Method to Predict Temperature
Susceptibilty of an Asphalt Binder. Journal of Materials in Civil Engineering , 246-252.
Rieck, J. (2005). Experimental Statistics 801: Statistical Methods Class Notes. Clemson,
SC: Clemson University. Roberts, F. L., Kandhal, P. S., Brown, E. R., Lee, D., & Kennedy, T. (1996). Hot Mix
Asphalt Materials Design and Construction. Lanham, MD, Md: NAPA Educational Fund.
Rubber Manufacturers Association. (2006). Scrap Tire Markets in the United States.
Washington DC: Rubber Manufacturers Association. Rubber Manufacturers Association. (2004). State Legislation of Scrap Tires. Washington
DC: Rubber Manufacturers Association. Salomon, D., & Zhai, H. (2003). Asphalt Binder Flow Activation Energy and its
Significance for Compaction Effort. Nampa, ID: Idaho Asphalt Supply, Inc. Specht, L. P., Khatchatourian, O., Teixeira Brito, L. A., & Pereira Ceratti, J. A. (2007).
Modeling of Asphalt-Rubber Rotational Viscosities by Statistical Analysis and Neural Networks. Materials Research , 69-74.
Stroup-Gardiner, M., Newcomb, D. E., & Tanquist, B. (1993). Asphalt-rubber
interactions. Transportation Research Record , 99-108. Stuart, K. D. (2001). Methodology for Determining Compaction Temperatures for
Modified Asphalt Binders (FHWA-RD-02-016). McLean, VA: FHWA. Takallou, B. (1991). Recycling Tires in Rubber Asphalt Pavign Yields Cost Disposal
Benefits. Elastomerics , pp. 19-24.
196
Tayebali, A. A., Vyas, B. B., & Malpass, G. A. (1990). Effect of Crumb Rubber Particle Size and Concentration on Performance Grading of Rubber Modified Asphalt Binders. ASTM Special Technical Publication , 30-47.
Toler, J. (2006). Experimental Statistics 805: Design and Analysis of Experiments Class
Notes. Clemson, SC: Clemson University. Toyo Tires. (2001). Toyo Global Web Page. Retrieved August 29, 2007, from Toyo Tire
Talk: http://www.toyojapan.com/tires/pdf/TTT_06.pdf Transportation Research Board. (1984). TRB Special Report 202: America's Highways:
Accelerating the Search for Innovation. Washington DC: TRB. Ucar, S., Karagoz, S., Yanik, J., Saglam, M., & Yuksel, M. (2005). Copyrolysis of Scrap
Tires with Waste Lubricant Oil. Fuel Processing Technology , 87, 53-58. US Army Corps of Engineers. (2000). Hot-Mix Asphalt Paving Handbook, AC 150/5370-
14A. Washington DC: Library of Congress. Ward, I. M., & Hadley, D. W. (1993). An Introduction to the Mechanical Properties of
Solid Polymers. New York, NY: Wiley. West, R. C., Page, G. C., Veilleux, J. G., & Choubane, B. (1998). Effect of Tire Grinding
Method on Asphalt Rubber Binder Characteristics. Transportation Research Record (1638), 134-140.
Xiao, F., Amirkhanian, S. N., & Juang, C. H. (2007). Rutting Resistance of Rubberized
Asphalt Concrete Pavements Containing Reclaimed Asphalt Pavement Mixtures. Journal of Materials in Civil Engineering , 19 (6), 475-483.