development of alkaline fuel cells - prod-ng.sandia.gov · single cell testing in a methanol-fueled...
TRANSCRIPT

SANDIA REPORT SAND2013-7764 Unlimited Release Printed September, 2013
Development of Alkaline Fuel Cells
Michael R. Hibbs, Janelle E. Jenkins, Todd M. Alam, Rajeswari Janarthanan, James L. Horan, Benjamin R. Caire, Zachary C. Ziegler, Andrew M. Herring,
Yuan Yang, Xiaobing Zuo, Michael H. Robson, Kateryna Artyushkova, Wendy Patterson, and Plamen Atanassov
Prepared by Sandia National Laboratories Albuquerque, New Mexico 87185 and Livermore, California 94550 Sandia National Laboratories is a multi-program laboratory managed and operated by Sandia Corporation, a wholly owned subsidiary of Lockheed Martin Corporation, for the U.S. Department of Energy's National Nuclear Security Administration under contract DE-AC04-94AL85000. Approved for public release; further dissemination unlimited.

2
Issued by Sandia National Laboratories, operated for the United States Department of Energy by Sandia Corporation. NOTICE: This report was prepared as an account of work sponsored by an agency of the United States Government. Neither the United States Government, nor any agency thereof, nor any of their employees, nor any of their contractors, subcontractors, or their employees, make any warranty, express or implied, or assume any legal liability or responsibility for the accuracy, completeness, or usefulness of any information, apparatus, product, or process disclosed, or represent that its use would not infringe privately owned rights. Reference herein to any specific commercial product, process, or service by trade name, trademark, manufacturer, or otherwise, does not necessarily constitute or imply its endorsement, recommendation, or favoring by the United States Government, any agency thereof, or any of their contractors or subcontractors. The views and opinions expressed herein do not necessarily state or reflect those of the United States Government, any agency thereof, or any of their contractors. Printed in the United States of America. This report has been reproduced directly from the best available copy. Available to DOE and DOE contractors from U.S. Department of Energy Office of Scientific and Technical Information P.O. Box 62 Oak Ridge, TN 37831 Telephone: (865) 576-8401 Facsimile: (865) 576-5728 E-Mail: [email protected] Online ordering: http://www.osti.gov/bridge Available to the public from U.S. Department of Commerce National Technical Information Service 5285 Port Royal Rd. Springfield, VA 22161 Telephone: (800) 553-6847 Facsimile: (703) 605-6900 E-Mail: [email protected] Online order: http://www.ntis.gov/help/ordermethods.asp?loc=7-4-0#online

3
SAND2013-7764 Unlimited Release
Printed September 2013
Development of Alkaline Fuel Cells
Michael R. Hibbs,1 Janelle E. Jenkins,2 Todd M. Alam,2 Rajeswari Janarthanan,3 James L. Horan,3 Benjamin R. Caire,3 Zachary C. Ziegler,3 Andrew M. Herring,3 Yuan Yang,4 Xiaobing Zuo,5 Michael H. Robson6, Kateryna Artyushkova6, Wendy Patterson6, and Plamen Atanassov6
1Materials, Devices, & Energy Technologies
2Electronic, Optical, & Nano Materials
Sandia National Laboratories P. O. Box 5800
Albuquerque, NM, 87185-0888
3Department of Chemical and Biological Engineering 4Department of Chemistry and Geochemistry
Colorado School of Mines
1500 Illinois St. Golden, CO 80401
5X-Ray Sciences
Advanced Photon Source Argonne National Laboratory
9700 S. Cass Ave. Argonne, IL, 60439
6Department of Chemical and Nuclear Engineering University of New Mexico
1 University Blvd. NE Albuquerque, NM 87131-0001.


5
ABSTRACT
This project focuses on the development and demonstration of anion exchange membrane (AEM) fuel cells for portable power applications. Novel polymeric anion exchange membranes and ionomers with high chemical stabilities were prepared characterized by researchers at Sandia National Laboratories. Durable, non-precious metal catalysts were prepared by Dr. Plamen Atanassov’s research group at the University of New Mexico by utilizing an aerosol-based process to prepare templated nano-structures. Dr. Andy Herring’s group at the Colorado School of Mines combined all of these materials to fabricate and test membrane electrode assemblies for single cell testing in a methanol-fueled alkaline system. The highest power density achieved in this study was 54 mW/cm2 which was 90% of the project target and the highest reported power density for a direct methanol alkaline fuel cell.

6
Acknowledgments This research was funded by the Sandia National Laboratories Laboratory Directed Research and Development (LDRD) program, Energy, Climate, and Infrastructure Strategic Management Unit.
Research in chapters 1, 6, 7, and 8 was supported in part by the ARO through a MURI award, W911NF-10-1-0520. Use of the Advanced Photon Source was supported by the U.S. Department of Energy, Office of Science, Office of Basic Energy Sciences, under Contract No. DE-AC02-06CH11357.

7
Contents
Abstract ........................................................................................................................................... 5
Acknowledgments........................................................................................................................... 6
General Introduction ..................................................................................................................... 13
1. Understanding Anion Transport in an Aminated Tri-Methyl Polyphenylene with High Anionic Conductivity .................................................................................................................................. 15
Introduction ............................................................................................................................. 15 Experimental ........................................................................................................................... 16
Results and Discussion ........................................................................................................... 17 Conclusions ............................................................................................................................. 26 References ............................................................................................................................... 26
2. Identification of Multiple Diffusion Rates in Mixed Solvent Anion Exchange Membranes Using High Resolution MAS NMR .............................................................................................. 29
Introduction ............................................................................................................................. 29 Discussion ............................................................................................................................... 29 References ............................................................................................................................... 34
3. Alkaline Stability of Poly(phenylene)-based Anion Exchange Membranes with Various Cations .......................................................................................................................................... 37
Introduction ............................................................................................................................. 37
Experimental ........................................................................................................................... 38 Results and Discussion ........................................................................................................... 40 Conclusions ............................................................................................................................. 45 References ............................................................................................................................... 46
4. Synthesis of Poly(phenylene alkylene)-based Ionomers for Use in Alkaline Fuel Cells ......... 47 Introduction ............................................................................................................................. 47 Experimental ........................................................................................................................... 48 Discussion ............................................................................................................................... 49 References ............................................................................................................................... 52
5. Non-platinum Carbon Supported Oxygen Reduction Catalyst Ink Evaluation Based on Poly(sulfone) and Poly(phenylene)-Derived Ionomers in Alkaline Media .................................. 53
Introduction ............................................................................................................................. 53
Experimental ........................................................................................................................... 56 Results and Discussion ........................................................................................................... 58 Conclusion .............................................................................................................................. 66 References ............................................................................................................................... 67
6. Direct methanol alkaline fuel cells with polyphenylene based anion exchange membranes ... 71
Introduction ............................................................................................................................. 71 Experimental ........................................................................................................................... 73 Results and Discussion ........................................................................................................... 74 Conclusions ............................................................................................................................. 80
References ............................................................................................................................... 81

8
7. Non-Platinum Cathode catalyst for direct methanol alkaline fuel cell ..................................... 83 Introduction ............................................................................................................................. 83 Experimental ........................................................................................................................... 83 Results and Discussion ........................................................................................................... 84 Conclusions ............................................................................................................................. 88
8. Non-platinum cathode catalysts for alkaline direct ethylene glycol fuel cell ........................... 89
Summary/Future Work ................................................................................................................. 91

9
Figures
Figure 1-1 A nine interval stimulated echo pulse sequence employed to measure time-dependent self- -100 ms. ............................................................ 17 Figure 1-2 1HNMR spectra of ATMPP at 25 oC and 100 oC. ....................................................... 18 Figure 1- – mass, solid line– set %RH, dotted line – measured %RH. ........................................................... 19 Figure 1-derived from DVS measurements at an equilibration time of 1h at each % RH. ......................... 20 Figure 1-5 (a) Water uptake and (derived from DVS measurements at an equilibration time of 20 min at each % RH. .................. 21 Figure 1-6 SAXS patterns of the ATMPP4 –Br- a function of relative humidity (- 95%RH; - 75%RH; -50% RH; - 25% RH) ( - Kapton peak). ......................................... 22 Figure 1-7 Structure of ATMPP ................................................................................................... 22 Figure 1-8 SAXS patterns of the ATMPP4 –CO32-
- - - - - Kapton peak). ................................ 23 Figure 1-9 Conductivity of A
.................................................................... 24 Figure 1-10 Measured self- oot of the effective
..................................................................................................................... 25 Figure 2-1. 1H HRMAS of hydrated ATMPP membrane at static (a) and 4 kHz MAS conditions (b). Free (F) and associated (A) water and methanol are labeled in the hydrated 1H HRMAS. 1H MAS NMR (c) of the dry dehydrated membrane exhibits broad resonances. .............................. 30 Figure 2-2 1H 2D NOESY exchange HRMAS NMR data of 1 N methanol swollen ATMPP membrane collected at a MAS rate of 6 kHz (a). A projection taken at the A-H2O resonances shows correlations to the membrane aromatic and methyl regions (b, blue), while the projection at F-H2O resonance exhibits no correlations to the membrane (b, red). A projection at the A-H2O shift with a shorter NOE mixing time shows correlation to the methyl of the trimethyl amine regions of the membrane (c, bottom). ................................................................................ 31 Figure 2-3 Normalized signal intensity decay of free and associated water and methanol in ATMPP as a function of gradient strength. .................................................................................. 34 Figure 3-1 Synthetic Scheme for Poly(phenylene)s with Benzylic Cations. ................................ 41

10
Figure 3-2 Synthetic Scheme for Poly(phenylene)s with Sidechain Tethered Cations. ............... 42 Figure 3-3 1H NMR Spectra of BrKC6PP (top) and BrC6PP (bottom). ...................................... 43 Figure 3-4 Changes in Chloride Ion Conductivity During Test in 4M KOH at 90 oC. ................ 44 Figure 4-1 Schematic of membrane-electrode assembly. ............................................................. 48 Figure 4-2 Synthetic scheme for the preparation of TMAC6PPC6. ............................................. 50 Figure 4-3 Hydroxide conductivity and water uptake values versus IEC. ................................... 51 Figure 5-1 Repeat unit structure of the poly(sulfone)-derived ionomer (top) and the poly(phenylene)-derived ionomers (bottom), where R = CH3 or CH2N+(CH3)3Br-. ................... 55 Figure 5-2 Experimental space. For each of the systems, 3 different ionomer to catalyst ratio, 3 different loadings, 3 different temperatures were tested at 5 different rotation speed. ................ 59 Figure 5-3 Polarization curve of the oxygen reduction reaction with Nafion® (---) and without ionomer binder (--- ........................................... 60 Figure 5-4 Polarization curves of the nonN- -PS- - - ---), 15% I:C (----), and 30% I:C (---). A.) plot Nafion® bound catalyst ORR curves, B.) bound with PS-A and PS-B, C.) PP-D and PP-E, and D.) plots of the best performing half-cell reactions with each of the 5 ionomers. All samples loaded as 400 ug/cm2, 1600 RPM, and 1 M KOH. ....................................................................... 61 Figure 5-5 Half-wave potentials of the non-PGM catalyst as a function of catalyst loading bound
- - - -Nafion®, B.) PS-A and PS-B, C.) PP-D and PP-E, and D.) all ionomers. The shade of gray in tiles A, B, and C indicates I:C ratio (3%, 15%, and 30%). ........................................................... 62 Figure 5-6 Limiting current as a function of catalysts loading for the non-PGM catalyst bound
- - - - A.) Plot of catalyst bound with Nafion®, B.) PS-A and PS-B, C.) PP-D and PP-E, and D.) all ionomers. ................................... 63 Figure 6-1. Structure of polymers used in membranes and electrodes. ........................................ 72 Figure 6-2. DMAFC performance curves for all four MEAs in 1M CH3OH at 80 C, 100 %RH 74 Figure 6-3. DMAFC performances as a function of the concentrations of methanol and KOH (: 1M-1M; : 1M-0.5M; : 2M-1M; :2M-2M; :1M-2M). ....................................................... 76 Figure 6-4. DMAFC performances of MEA-1 as a function of concentrations of methanol and KOH at 80 C, 100 %RH (: 1M-1M; : 1M-2M; : 1M -0.5M; : 2M-1M; : 2M-2M). .... 77
11
Figure 6-5. Durability test for MEA-2 in 1M Methanol and 1M KOH at 80 C, 100 %RH for 70h................................................................................................................................................. 79 Figure 6-6. Impedance spectra of MEA-1 in 1M Methanol at 80 C, 100% RH as a function of potential; (a) at OCV; (b) at 400 mV; (c) at 300 mV; (d) at 200 mV ........................................... 80 Figure 7-1. DMAFC performances of non-Pt cathode catalyst, MEA-1 (circles) against a Pt cathode catalyst (triangles) in 1M methanol at 80 C, 100% RH. ................................................ 85 Figure 7-2. DMAFC performances of non-Pt cathode catalyst (MEA-1, circles) against a Pt cathode catalyst (MEA-2, triangles) in 1M methanol and 1M KOH at 80 C, 100% RH. ........... 85 Figure 7-3. DMAFC performances of non-Pt cathode catalyst (MEA-3, squares) against a Pt cathode catalyst (MEA-4, triangles) in 1M methanol at 80 C, 100% RH. .................................. 86 Figure 7-4. DMAFC performances of MEA-3 with UNM G-2 cathode catalyst as a function of fuel - electrolyte concentrations (- 1M-1M; -2M-1M; - 1M-2M; - 2M-2M; -5M-1M)........................................................................................................................................................ 86 Figure 7-5. DMAFC performances of MEA-4 with both electrodes containing platinum catalyst as a function of concentrations of fuel and electrolyte (: 2M-1M; : 1M-1M; : 1M-2M; : 1M-0.5 M;: 2M-2M).................................................................................................................. 87 Figure 8-1. Alkaline direct ethylene glycol performances as a function of concentration (circles: 2M EG-2M KOH, triangles: 1M EG- 1M KOH, diamonds: 1M EG- 0.5 M KOH) at 80 C, 100 % RH (MEA was made of Pt/C, TKK as anode, HypermecTM as cathode and TMAC6PP membrane). ................................................................................................................................... 90 Figure 8-2. Alkaline direct ethylene glycol performances as a function of relative humidity (triangles: 50 % RH, squares: 75 % RH, diamonds: 100 % RH) at 60 C in 1M EG- 0.5 M KOH (MEA was made of Pt/C, TKK as anode, HypermecTM as cathode and TMAC6PP membrane)........................................................................................................................................................ 90

12
Tables
Table 1-1 IEC values for several ATMPP samples. ...................................................................... 18 Table 1-2 SAXS slope values derived from power law. ............................................................... 23 Table 2-1 Solvent Diffusion Properties Measured Utilizing 1H HR-MAS NMR in an Anion Exchange Membrane. ..................................................................................................................................... 32 Table 3-1 Anion Exchange Membrane Properties......................................................................... 41 Table 3-2 Stability of Anion Exchange Membranes in 4M KOH at 90 oC ................................... 44 Table 5-1 Coefficients for the properties of each of the novel ionomers, which are degree of functionality (DF), ion exchange capacity (IEC), water uptake or swelling, and ionic conductivity (Ω). ....................................................................................................................................................... 57 Table 6-1 Properties of AEMs and Ionomers. ............................................................................... 72 Table 6-2 Details of MEAs. ........................................................................................................... 73 Table 6- .................................... 75 Table 6- ....................................................................................................................................................... 77 Table 6-5 Resistance values from Impedance spectra. .................................................................. 80 Table 7-1 Materials used to fabricate MEAs. ................................................................................ 84

13
GENERAL INTRODUCTION
The general goal of this project has been to develop alkaline anion exchange membrane (AAEM) fuel cell technology to a point of proof of feasibility for portable power applications. This technology has the potential to revolutionize fuel cell use in portable power applications. Alkaline fuel cells without precious metal catalysts were developed years ago but these traditional alkaline fuel cells required a liquid electrolyte because they lacked a true AAEM and suffered from reliability problems because of the formation of solid carbonate in the presence of CO2. Current research on AAEM fuel cells (AAEMFCs) has shown that these membrane-based systems will not generate solid carbonate because of the absence of any mobile cation. They also mitigate potential corrosion problems by removing the liquid electrolyte. Research in this area has been limited however, and the power densities of AAEMFCs lag behind those of their proton exchange membrane (PEM) counterparts. A major contributor to the low power densities is poor reactant mass transport in the electrodes and this, in turn, is due largely to the lack of available ionomers to use as binders in the electrodes. The challenge for this project has been to demonstrate a methanol AAEMFC with a maximum power density comparable to that of a methanol PEM fuel cell and which does not utilize any precious metal catalyst. Mass transport within the electrodes is critical to performance and yet, no electrode architecture has been specifically tailored and optimized for use in an AAEMFC. Prior to this project, Sandia had developed cationic polymers for AAEMs and which could also be dissolved in solvents such as alcohols, thus placing us in a unique position to work with catalyst developers to experiment with the design of electrodes for AAEMFCs. This project has leveraged recent breakthrough performance of AAEMs developed at Sandia and electrocatalyst development at the University of New Mexico (UNM) and the Colorado School of Mines (CSM). All three institutions have worked closely together to optimize the design and fabrication of membrane electrode assemblies (MEAs) by combining experimental ionomers and catalysts. The key project deliverable was to demonstrate a direct methanol alkaline fuel cell (DMAFC) with a power density of 60 mW/cm2, a significant improvement relative to the then current state-of-the-art. The AME previously reported by Sandia, ATMPP, is based on a poly(phenylene) backbone with pendant trimethylbenzyl ammonium groups. ATMPP is very stable because the backbone is entirely aromatic. In a stability test of ATMPP with other AAEMs in which the membranes were subjected to 4M NaOH at 60 oC for 28 days, the ATMPP samples remained unchanged. So the initial fuel cell and catalyst testing done under this project were carried out using ATMPP, while a concurrent effort was focused on synthesizing a different, more stable AEM for later fuel cell testing. Prior to the project start, the UNM team had developed a templating method for catalyst synthesis which was based on the deposition of a precursor on a dispersed non-carbon carrier, e.g. amorphous silica particles. This was followed by pyrolysis of the compound and chemical extraction (removal) of the carrier. The resulting material was a highly dispersed, porous, self-supported nano-composite (surface area from 600–2400 m2/g) that demonstrated good electrocatalytic performance for oxygen reduction. With this background, the UNM team was selected to focus on the templating approach to achieve a tailored structure for a set of novel electrocatalysts for AAEMFC. Development of these electrocatalysts was dependent upon optimization of the catalysts ink based on the ionomers prepared by Sandia to be used in AAEMFC. The CSM group was selected to formulate catalyst inks from the metal impregnated carbons and the polymers formulated for the catalyst layer. A variety of MEA fabrication techniques would be tried,

14
utilizing a design of experiments approach to optimize the catalyst layer based on polymer, catalyst, carbon, loading, hydrophobicity and porosity. Ultimately, the MEAs were broken in and then tested in various modes to maximize durability and power density.

15
1. UNDERSTANDING ANION TRANSPORT IN AN AMINATED TRI-METHYL
POLYPHENYLENE WITH HIGH ANIONIC CONDUCTIVITY
Rajeswari Janarthanan,a James L. Horan,a Benjamin R. Caire,a Zachary C. Ziegler,a Yuan Yang,b Xiaobing Zuo,c Michael R. Hibbs,d and Andrew M. Herring.a,*
aDepartment of Chemical and Biological Engineering, and bDepartment of Chemistry and Geochemistry
Colorado School of Mines, Golden, CO 80401, USA cX-Ray Sciences, Advanced Photon Source, Argonne National Laboratory, Argonne, IL, USA
dMaterials, Devices, & Energy Technologies, Sandia National Laboratories, Albuquerque, NM, USA
Introduction In recent years, alkaline exchange membrane (AEM) fuel cells are receiving enormous attention due to their potential advantages over proton exchange membrane (PEM) fuel cells such as improved electrode reaction kinetics, the possibility of the use of non-precious metal catalysts, and advantages in the operation of a direct methanol fuel cell in terms of the direction of electro-osmotic drag. The AEM at the heart of these fuel cells have received considerable attention due to the challenge in developing a mechanically robust thin film with a stable cation that conducts anions with adequate conductivity for practical applications. Several review articles on these issues, and the challenges of using various polymers, have appeared in the recent literature.1,2 Among the challenges; understanding the transport of anions, water, and the fuel through AEMs is important with relevance to the overall cell performance.3-5 The degree of phase separation and morphology are known to play key roles in determining measurable properties such as ion conductivity, and diffusion coefficients within all types of ion exchange membranes. One attractive solution to the problem of obtaining an AEM for fuel cell applications are functionalized polyphenylenes. Thermally and chemically robust, high molecular weight sulfonated poly (phenylene) ionomers prepared by a Diels-Alder reaction and with high proton conductivity have been demonstrated for PEM fuel cells.6-8 Based on the previous success with these materials, an AEM based on the same poly- (phenylene) backbone and with benzyl trimethyl- ammonium cationic groups was also prepared.9,
10 The AEMs based on these aminated tri-methyl poly (phenylene) (ATMPP) homopolymers and copolymers were characterized by conductivity and water uptake. It was demonstrated that ATMPPs have good stability in NaOH, a hydroxide ion conductivity of 51 mS/cm at 30 C, measured in ambient air, and liquid water uptake up to 122 % for the ATMPP polymer with an IEC of 1.57 meq/g. Intrigued by the possibilities of the ATMPP membranes we decided to further characterize these materials in detail in order to more fully understand their high anionic conductivities. One of the inerrant difficulties with studying AEMs is that in their hydroxide form they rapidly react with ambient CO2 to form carbonate and bicarbonate.11 So not only must the relative humidity (RH), and temperature be controlled, but also CO2 must be excluded or added in order for transport measurements to be interpretable and attributable to a specific anion. Here we describe the use of an in situ hydroxide ion

16
exchange conductivity cell that allows us to exchange hydroxide ions in an inert atmosphere, resulting in more accurate hydroxide ion conductivity measurements. We also describe a method for measuring IEC by 1HNMR which gives results that are much more closely aligned with the predicted values than those previously reported. The transport data is further correlated with diffusion measurements from pulse field gradient spin echo (PFGSE) NMR, water swelling from dynamic vapor sorption (DVS), and morphological information from SAXS. Experimental Materials: ATMPPs were fabricated by a procedure previously reported.9, 10
Ion exchange capacity: Ion exchange capacity (IEC) was measured using a back titration technique that has been previously described.12 IEC was also measured by 1HNMR spectroscopy of ~5% solutions of ATMPP in DMF-d7 at 100 C. An explanation of the peak assignments follows in the discussion. A Bruker AVANCEIII NMR spectrometer operating at a 1H frequency of 500 MHz was used for these measurements. Dynamic vapor sorption: A DVS-advantage instrument from Surface Measurement Systems, Ltd. NA, USA was used to study water uptake of membranes. In a Dynamic vapor sorption (DVS) study, measurement of water vapor uptake and loss of vapor by the membrane is examined gravimetrically. First, the membrane is dried for 60 min at 60 C and 0% RH to obtain the dry mass. Following this, relative humidity is increased gradually in four steps to reach a maximum of 90% RH. At each step, the membrane was allowed to equilibrate at a particular relative humidity for 60 min. Small angle x-ray scattering: Small angle x-ray scattering (SAXS) measurements were taken on beamline 12 ID-B at the Advanced Photon Source (APS) located at Argonne National Laboratory, Argonne, IL. The beam energy was 12 keV and the sample to detector distance was 2000 mm. The 2D scatter was radially integrated providing plots of intensity versus the scattering vector q. The intensity units are arbitrary. The incoming x-ray wavelength (λ) was 1 ± 0.05 Å for all samples. Scattering was collected in a q range of 0.006 - 0.7 Å-1 at an exposure time of 1 second. The measurements were taken in a custom built humidity oven at 60 °C from wet to dry conditions (95%, 75%, 50%, and 25% relative humidity).13 The Membrane in bromide form was exchanged to carbonate form by soaking in sodium carbonate solution. Conductivity: In order to measure hydroxide ion conductivity in the absence of carbon dioxide, a BekkTech conductivity cell was modified by having the fuel cell hardware replaced with stainless steel endplates. The films were soaked in 1 M NaOH solution followed by rinsing with degassed deionized water until the rinsed water had a neutral pH. The system was purged with UHP N2 each time the cell was emptied. A check valve on the vent and positive pressure on the cell from the UHP N2 ensured that no outside gas was allowed into the cell across the duration of the conductivity test. Conductivity was measured once the membrane is converted to hydroxide form after thorough rinsing in D.I. water. Bromide ion conductivity was also measured in a Bekktech conductivity cell. However, the carbonate ion conductivity is measured by an ex situ method in which a Test Equity environmental chamber is employed to control the temperature and relative humidity. Conductivities were measured using AC impendence spectroscopy via a four-electrode conductivity cell across varying temperature and humidity. Conductivity, , was calculated using the equation,
, where l is the distance
between the electrodes, t and w are the thickness and width of the membrane respectively and R is the resistance from impedance spectra.

17
PFGSE NMR: A Bruker AVANCEIII NMR spectrometer and a wide bore Magnex Magnet operating at a 1H frequency of 400MHz were used. Proton diffusion measurements were made using a 5mm Bruker single-axis DIFF60L Z-diffusion probe. A Pulsed Field Gradient Stimulated Echo (PFGSE) block was used to encode diffusive displacements and a longitudinal eddy delay (LED) before the acquisition was also applied until the effects of the eddy currents have dissipated.14,15 The 90 degree pulse length was on the order of 5.0 s. Typical parameters at 25°C were Gz=0-128G/cm, incremented in 16 steps, =1ms, =10-100ms, and eddy current delay (te) of 4ms following the gradient pulses.
Figure 1-1 A nine interval stimulated echo pulse sequence employed to measure time-dependent self- -100 ms. In practice, E(g, 2) is measured as a function of g and fit to the expression:16 ,(
)- (1)
where γ is the gyromagnetic ratio of the proton (or the diffusing species being measured), D is the diffusion coefficient, g is the gradient constant, is the gradient pulse duration and is the time between gradient pulses. The pre-exponential factor E(0, 2τ) is proportional to the number of proton nuclei diffusing with diffusion coefficient D. The effective spin observation time between gradient pulses ( eff
= -/3)) takes into account the time loss of spin behavior due to the duration of the gradient pulse. Results and Discussion In order to fully describe the physical chemistry of these materials we first had to resolve some previously unresolved issues. In work previously describing ATMPP, it was noted that the IEC, which was measured using a back titration method, was always significantly lower than the theoretical IEC predicted from the number of functional groups on the parent polymer (as determined by 1HNMR spectroscopy).9 Typically, the titration-measured IECs were 55-75% of the theoretical IEC. It was
/2
te

18
speculated that this difference was because some of the functional groups in the parent polymer were not converted to benzyl trimethylammonium (BTMA) groups. More recently, we have been able to measure the IEC of ATMPP by 1HNMR at an elevated temperature which allows for precise integration of the requisite peaks. Figure 1-2 shows the 1HNMR spectra of ATMPP in DMF-d7 at 25 and 100 oC and it is clear that at the higher
Figure 1-2 1HNMR spectra of ATMPP at 25 oC and 100 oC.
temperature, overlap of the large water peak with peak c (N-CH3) is avoided. All the peaks of interest in Figure 1-2 (a, b, and c) appear as groups of peaks because of the irregularity of the polymer backbone and because of the random distribution of BTMA groups on each repeat unit. To calculate the IEC, the area ratio of peak c to peak b (Ar-CH2-N) is first confirmed to be 9:2. Then the relative areas of a (Ar-CH3) and c are used to calculate the average number of BTMA groups per repeat unit, the average formula weight of each repeat unit, and finally the IEC. Table 1-1 lists the results for several different batches of ATMPP and it is clear that the NMR-measured IECs are in very good agreement with the theoretical IECs. Thus it appears that all of
Table 1-1 IEC values for several ATMPP samples. IEC (meq/g) (OH- form) Theoretical Titration NMR ATMPP1 1.91 1.47 1.89 ATMPP2 2.10 1.58 2.05 ATMPP3 2.18 1.75 2.11 ATMPP4 2.40 1.81 2.43 ATMPP5 2.65 1.97 2.67 the functional groups in the parent polymer are converted to BTMAs during the quaternization step. The titration-measured IECs must be low because of a systemic error during the titration itself; possibly incomplete ion exchange, incomplete drying, or removal of water-soluble high IEC oligomers. Alternatively, as we have considerable experience of this technique some of the cationic groups are not accessible to facile exchange due to the unique nature of the polymer. Because of this uncertainty, all reported IECs for ATMPP samples used in this study were determined using the NMR method.

19
The IEC of the membranes can influence the water uptake, swelling behavior, and conductivity. The Water uptake of AEMs can have a significant effect on the anionic conductivity and the films mechanical properties. For practical operation it would be desirable to have enough water molecules that facilitate hydroxide ion transport and stability, but, not an excess amount of water that would reduce the mechanical strength of the membranes and lead to excessive swelling. Water vapor uptake of the membranes was measured by DVS. A typical water sorption isotherm measured at 60 C is shown in Figure 1-3. The trace shows that equilibrium was reached at all
Figure 1-3 – mass, solid line– set %RH, dotted line – measured %RH. RHs except the higher one, and even here the rate of water uptake is close to zero at the end of the step. The sorption profile traces the uptake when the humidity was increased from 0 to 95% RH. The desorption profile from 95% RH down to 0% RH measures the loss of vapor during each change in % RH. Water uptake at a specific % RH is calculated from Eq. 2,
Water uptakeRH % = 100*d
dw
mmm …………………………………………………….. (2)
where mw refers to the equilibrium mass at a specific %RH and md is the dry mass of the membrane. The water content, RH, the number of water molecules at a specific RH is calculated from Eq. 3,
RH = water
RH
MWIECeWaterUptak
* ………………………………………………………………. (3)
where, MWwater is the molecular weight of water = 18 g/mol.
0
20
40
60
80
100
1.4
1.5
1.6
1.7
1.8
1.9
0 200 400 600 800 1000
% R
H
Mas
s (m
g)
Time (min)

20
The second cycle in Figure 1-3 shows a loss in water uptake of ~ 5% when compared to first cycle. This could be due to partial decomposition of quarternary ammonium group in the membrane during the drying part of the cycle, or simply that the membrane irreversibly looses water when subjected to multiple drying cycles. A comparison of the IR spectra of the film before and after the DVS measurement showed no obvious changes. Water uptake and water content of membranes with two IEC values as a function of relative RH at 60 C are shown in Figure 1-4 a & b respectively after 1 h of equilibration at each %RH. The water uptake of both membranes is similar, increasing as the RH is increased. Water uptake in these membranes is significantly lower than the sulfonated analogues. A sulfonated polyphenylene analogue (2 mequiv/g) was found to exhibit 137 % liquid water uptake that corresponds to 30 water molecules.6 While liquid water uptake is always greater than water vapor uptake,17 the difference in the water uptake can be attributed to the lower solubility of the cationic functional groups as well as the fact that hydroxide is generally coordinated by 3-4 waters only.18 This indicates a low swelling and good dimensional stability of the ATMPP membranes. The water content of the membranes, derived from the water uptake and IEC of the membranes, shows an increasing trend with relative humidity. Water uptake of 6.6 and 27.2 %
Figure 1-4 from DVS measurements at an equilibration time of 1h at each % RH. for the low IEC membrane (ATMPP4, 2.43 mequiv/g) correspond to 1.5 and 6.2 water molecules per ATMPP unit. A slight increase in the IEC of the membrane (ATMPP5, 2.67 mequiv/g) increases the number of water molecules slightly, resulting in 1.4 and 6.0 per ATMPP unit. At the upper end the films, therefore, contain 2 excess water molecules.
0
5
10
15
20
25
30
35
20 40 60 80 100
Wat
er U
ptak
e (%
)
% RH
(a)
0
1
2
3
4
5
6
7
20 40 60 80 100
% RH
(b)
21
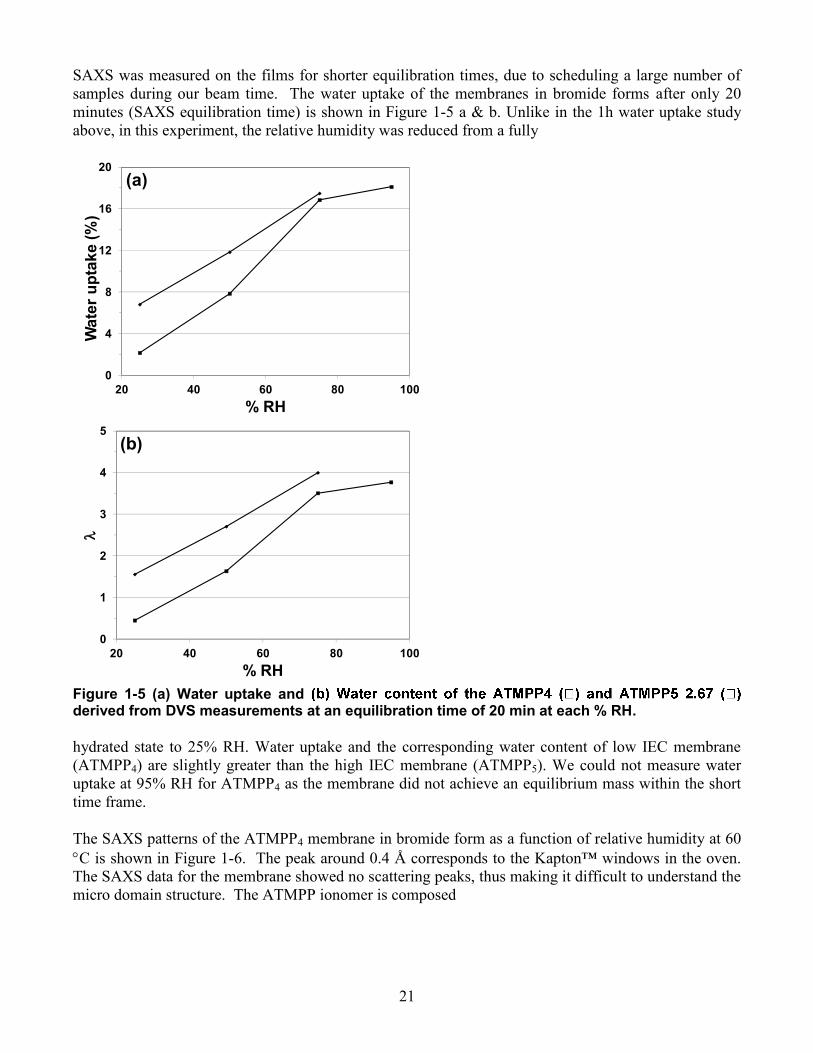
SAXS was measured on the films for shorter equilibration times, due to scheduling a large number of samples during our beam time. The water uptake of the membranes in bromide forms after only 20 minutes (SAXS equilibration time) is shown in Figure 1-5 a & b. Unlike in the 1h water uptake study above, in this experiment, the relative humidity was reduced from a fully
Figure 1-5 (a) Water uptake and derived from DVS measurements at an equilibration time of 20 min at each % RH. hydrated state to 25% RH. Water uptake and the corresponding water content of low IEC membrane (ATMPP4) are slightly greater than the high IEC membrane (ATMPP5). We could not measure water uptake at 95% RH for ATMPP4 as the membrane did not achieve an equilibrium mass within the short time frame. The SAXS patterns of the ATMPP4 membrane in bromide form as a function of relative humidity at 60 C is shown in Figure 1-6. The peak around 0.4 Å corresponds to the Kapton™ windows in the oven. The SAXS data for the membrane showed no scattering peaks, thus making it difficult to understand the micro domain structure. The ATMPP ionomer is composed
0
4
8
12
16
20
20 40 60 80 100
Wat
er u
ptak
e (%
)
% RH
(a)
0
1
2
3
4
5
20 40 60 80 100
% RH
(b)

22
Figure 1-6 SAXS patterns of the ATMPP4 –Br- (- 95%RH; - 75%RH; -50% RH; - 25% RH) ( - Kapton peak). of the poly (phenylene) aromatic backbone and BTMA ionic groups (Fig. 1-7). No scattering peak was observed for the ATMPP4 ionomer from 25 to 75% RH indicating almost no micro phase separation in the polymer. Under hydrated condition, at 95% RH, the membrane swells to show a peak at q value of ~ 0.124 Å-1, corresponding to 50 Å d- spacing, which can be assigned to the swollen hydrophilic ionomer. This is larger than the hydrated sulfonated analogue, which showed a peak upon hydration with a dimension of 32 Å.21 At low q range (0.007 to 0.017 Å-1) an upturn in intensity is observed which has been attributed to the presence of micro voids or heterogeneous distribution of clusters.19, 20 SANS study of sulfonated polyphenylene showed a similar high intensity scattering for both dry and hydrated membranes due to the large domains.21 In the low angle region, between 0.007 to 0.017 Å-1
, membranes were found to exhibit power law decay, I(q) ~ q-, with a slope of -3.4 at all conditions. Whereas, at the intermediate q region,
Figure 1-7 Structure of ATMPP
60.01
2
46
0.1
2
46
1
2I(
Q) (
cm-1
)
7 8 90.01
2 3 4 5 6 7 8 90.1
2 3 4 5 6
Q (Å-1)

23
between 0.018 and 0.035 Å-1, 95% RH membrane has a slope (-1.7) different from all other membranes (-2.3), suggesting a structural rearrangement from randomly branched polymer to a linear swollen polymer upon full hydration.22, 23 The crossover of slopes from low angle to intermediate region occurs at q= 0.02 Å-1 which corresponds to a d-spacing of 314 Å. In a similar SANS study of the sulfonated analogue of the polymer, crossover point is referred as the molecular dimensions.21
Figure 1-8 SAXS patterns of the ATMPP4 –CO32- - Figure 1
- - - - Kapton peak). ATMPP4 in carbonate form too exhibit different slope values as a function of relative humidity (Fig. 1-8). All membranes show an upturn in intensity at low intermediate q region between 0.007 and 0.017 Å-
1, with different slopes as described in table 1-2. Slopes were seen to change as a function of relative humidity in the intermediate region, 0.017 - 0.021 Å-1 as well (Table 1-2). The swelling in the pattern at high q region, 0.036 - 0.225 Å-1 for the 95% RH membrane is due to the water present in the free volume upon full hydration.
Table 1-2 SAXS slope values derived from power law. Membrane % RH Low q region Intermediate q region
ATMPP4-Br 95 -3.4 -1.7
75 -3.4 -2.3 50 -3.4 -2.3 25 -3.4 -2.3
ATMPP4-CO3 95 -3.1 * 75 -3.3 -3.0 50 * -3.2 25 -3.5 -2.6
*- not linear SAXS measurements reveal no change in the microstructure due to the rigid aromatic backbone of the ATMPP. However, the change in relative humidity has a small effect on the structure as evident from the change in slopes at different q regions. Overall the lack of swelling in these films is unsurprising as the DVS measurement suggests that only enough water to coordinate the anion has entered the material.
0.001
0.01
0.1
1
I(Q
) (cm
-1)
7 8 90.01
2 3 4 5 6 7 8 90.1
2 3 4 5 6
Q (Å-1)

24
Figure 1-9 exhibits the Br-, OH- and CO32- ion conductivities of the ATMPP4 at 95% RH as a function
of temperature. As expected, the conductivity increased over the temperature range tested for all forms of the membrane. When the bromide ion of the membrane is exchanged with hydroxide ion, the conductivity increased rapidly. At 50 C, the OH- form showed 4 times high conductivity when compared to the Br- form. At 90 C, the hydroxide ion showed highest conductivity of 86 mS/cm, ~6.6 times higher than that of bromide form. This value is lower than
Figure 1-9 Conductivity of ATMPP4 membrane in Figure 1 ity of ATMPP4 membrane in
. the proton conductivity of sulfonated polyphenylene membrane, 123 mS/cm.6 This response could be due to the variation in the structure as well as the mobility of OH- and H+ ions in the aminated and sulfonated polyphenylenes respectively. The carbonate ion conductivity is significantly lower than the hydroxide ion as expected. But still, the conductivity at 90 C is 1.28 times higher than bromide ion. Assuming, Arrehenius behavior, activation energies of the membranes are calculated from the equation, Ea = -slope x R, where R is the gas constant. Activation energies are 29.09, 23.45 and 11.02 kJ mol-1 for the carbonate, hydroxide and bromide forms of the membrane respectively at 95%RH. This value for hydroxide and carbonate ion conduction are higher than the lowest activation energies for hydroxyl in AEMs, 15.1 kJ mol-1 reported by Varcoe5 at 100%RH. Interestingly the Ea for bromide conductivity is much lower. Pulsed Field Gradient Stimulated Echo (PFG STE) proton diffusion measurements were used to determine the water self diffusion coefficients (D) in the hydroxide form of the ATMPP. Variable time delay () between gradient pulses of the PFG STE sequence can be used to determine the effects of tortuous diffusion through ionomer membranes on the measured diffusion coefficient.24 The relationship between apparent diffusion time () and spin migration by root mean square displacement (r) for fluid molecules exhibiting unrestricted diffusion undergoing random Brownian motion is shown by the following relationship:25 (2) The unrestricted bulk diffusion coefficient (D0) of water in the membrane is measured with very short time delays between the gradient pulses and thus the spin migration (r) of the diffusing species is smaller than the dimensional regime of the restricting geometry. For short time scales, D = D0. In the case of restricted diffusion in a membrane, as increases, the root mean square displacement increases until the geometric confinement of the heterogeneous media restricts the displacement of spin migration. Once restriction takes place, the diffusion coefficient decreases with increasing The root mean square
0
0.02
0.04
0.06
0.08
0.1
40 60 80 100
Cond
uctiv
ity (S
/cm
)
Temperature ( C)
25
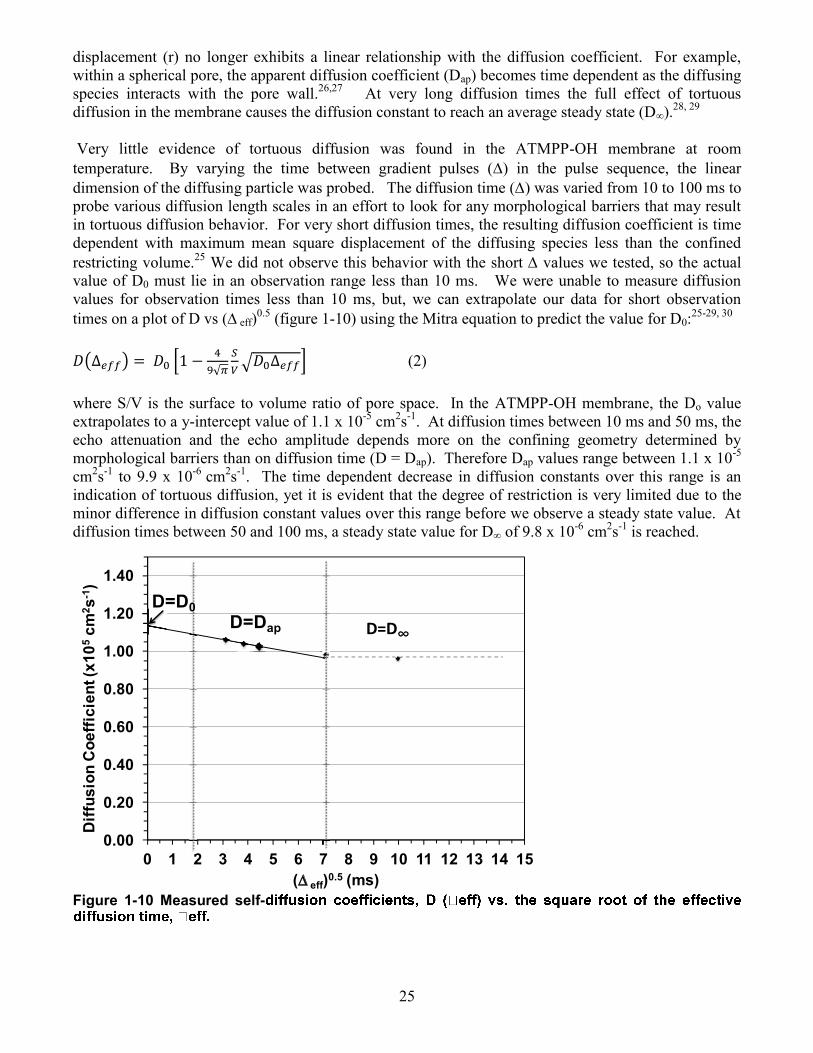
displacement (r) no longer exhibits a linear relationship with the diffusion coefficient. For example, within a spherical pore, the apparent diffusion coefficient (Dap) becomes time dependent as the diffusing species interacts with the pore wall.26,27 At very long diffusion times the full effect of tortuous diffusion in the membrane causes the diffusion constant to reach an average steady state (D∞).28, 29 Very little evidence of tortuous diffusion was found in the ATMPP-OH membrane at room temperature. By varying the time between gradient pulses () in the pulse sequence, the linear dimension of the diffusing particle was probed. The diffusion time () was varied from 10 to 100 ms to probe various diffusion length scales in an effort to look for any morphological barriers that may result in tortuous diffusion behavior. For very short diffusion times, the resulting diffusion coefficient is time dependent with maximum mean square displacement of the diffusing species less than the confined restricting volume.25 We did not observe this behavior with the short values we tested, so the actual value of D0 must lie in an observation range less than 10 ms. We were unable to measure diffusion values for observation times less than 10 ms, but, we can extrapolate our data for short observation times on a plot of D vs ( eff)0.5 (figure 1-10) using the Mitra equation to predict the value for D0:25-29, 30 ( ) *
√
√ + (2)
where S/V is the surface to volume ratio of pore space. In the ATMPP-OH membrane, the Do value extrapolates to a y-intercept value of 1.1 x 10⁻⁵ cm2s-1. At diffusion times between 10 ms and 50 ms, the echo attenuation and the echo amplitude depends more on the confining geometry determined by morphological barriers than on diffusion time (D = Dap). Therefore Dap values range between 1.1 x 10⁻⁵ cm2s-1 to 9.9 x 10⁻⁶ cm2s-1. The time dependent decrease in diffusion constants over this range is an indication of tortuous diffusion, yet it is evident that the degree of restriction is very limited due to the minor difference in diffusion constant values over this range before we observe a steady state value. At diffusion times between 50 and 100 ms, a steady state value for D∞ of 9.8 x 10⁻⁶ cm2s-1 is reached.
Figure 1-10 Measured self-Figure 1
0.00
0.20
0.40
0.60
0.80
1.00
1.20
1.40
0 1 2 3 4 5 6 7 8 9 10 11 12 13 14 15
Diff
usio
n C
oeffi
cien
t (x1
05cm
2 s-1
)
( eff)0.5 (ms)2
D=D0D=Dap D=D∞

26
Conclusions In this study, aromatic anion exchange membranes based on aminated poly (phenylene) homopolymers were synthesized and investigated in both bromide and hydroxide forms. Low water uptake and water content values calculated from dynamic vapor sorption studies revealed good mechanical stability of the membranes. These values were observed to decrease when the experiments were carried out in a short time to match the SAXS experimental time duration. From SAXS, the polymer exhibited structural rearrangement between low and intermediate q regions, when the membranes were subjected to different relative humidity. However, there was no specific feature observed due to the ionomer, indicating poor micro phase separation. This can be attributed to the rigid aromatic backbone of the polymer. In order to avoid exchange of hydroxide ions to carbonate or bicarbonate ions when exposed to air, we have performed in-situ hydroxide ion conductivity measurement. The OH- conductivity of the membrane was 86 mS/cm which is 6.6 times higher than its bromide form. We have also described a method for determining IEC by NMR which indicates that the formation of BTMA cations during the synthesis of ATMPP in nearly quantitative, contrary to our prior report. This ATMPP membrane with a low water content and high conductivity demonstrates a promising AEM for alkaline fuel cells applications. References
1. Varcoe, J.R.; Slade, R.C.T. Fuel Cells 2005, 5, 187. 2. Merle, G.; Wessling, M.; Nijmeijer, K. J. Membr. Sci. 2011, 377, 1. 3. Mamlouk, M.; Wang, X.; Scott, K.; Horsfall, J.A.; Williams, C. Proc. IMechE. Part A: J. Power
and Energy 2010, 225, 152. 4. Robertson, N.J.; Kostalik IV, H.A.; Clark, T.J.; Mutolo, P.F.; Abruna, H.D.;
Coates, G.W. J. Am. Chem. Soc. 2010, 132, 3400. 5. Varcoe, J.R. Phys. Chem. Chem. Phys. 2007, 9, 1479. 6. Fujimoto, Cy H.; Hickner, M.A.; Cornelius, C.J.; Loy, D.A. Macromol. 2005, 38, 5010. 7. Hickner, M.A.; Fujimoto, Cy H.; Cornelius, C.J. Polymer 2006, 47, 4238. 8. Stanis, R.J.; Yaklin, M.A.; Cornelius, C.J.; Takatera, T. ; Umemoto, A.; Ambrosini, A.;
Fujimoto, Cy H. J. Power Sources 2010, 195, 104. 9. Hibbs, M.R.; Fujimoto, Cy H.; Cornelius, C.J. Macromol. 2009, 42, 8316. 10. Hibbs, M.R.; Cornelius, C.J.; Fujimoto, Cy.H. U.S. Patent 7,888, 397, Feb 15, 2011. 11. Yan, J.; Hickner, M.A. Macromol. 2010, 43, 2349. 12. Hibbs, M.R.; Hickner, M.A.; Alam, T.M.; McIntyre, S.K.; Fujimoto, Cy H.; Cornelius, C.J.
Chem. Mater. 2008, 20, 2566. 13. Schlichting, G. J.; Horan, J. L.; Jessop, J. D.; Nelson, S. E.; Seifert, S.; Yang, Y.; Herring, A.M.
Macromol. 2012, 45, 3874. 14. Cotts, R. M.; Hoch, M. J. R.; Sun, T.; Markert, J. T. J. Magn Reson (1969) 1989, 83, 252. 15. Tanner, J. E. J. Chem. Phys. 1970, 52, 2523. 16. Strejskal, E. O.; Tanner, J. E. J. Chem. Phys. 1965, 42, 288. 17. Kusoglu, A.; Modestino, M.A.; Hexemer, A.; Segalman, R.A.; Weber, A.Z. ACS Macro Lett.
2012, 1, 33. 18. Tuckerman, M.E.; Marx, D.; Parrinello, M. Nature 2002, 417, 925. 19. Gebel, G.; Diat, O. Fuel Cells 2005, 5, 261. 20. Yarusso, D.J.; Cooper, S.L. Macromol. 1983, 16, 1871. 21. He, L.; Fujimoto, Cy H.; Cornelius, C.J.; Perahia, D. Macromol. 2009, 42, 7084. 22. Beaucage, G. J. Appl. Cryst. 1995, 28, 717. 23. Beaucage, G. J. Appl. Cryst. 1996, 29, 134. 24. Zhang, J.; Giotto, M.V.; Wen, W.Y.; Jones, A.A.; J. Membr. Sci. 2006, 269, 118. 25. Ohkubo, T.; Kidena, K.; Ohira, A. Macromol. 2008, 41, 8688.

27
26. Mitra, P.P.; Sen, P.N.; Schwartz, L.M.; Le Doussal, P. Phys. Rev. Lett. 1992, 68, 3555. 27. Wende, C.; Schonhoff, M. Langmuir 2010, 26, 8352. 28. Guillermo, A.; Bardet, M. Anal. Chem. 2007, 79, 6718. 29. Rollet, A.L.; Blachot, J.F.; Delville, A.; Diat, O.; Guillermo, A.; Porion, P.; Rubatat, L.; Gebel,
G. The European Phys. J E. Soft Matter and Biological Physics 2003, 12, 131. 30. Rollet, A.L.; Simonin, J.P.; Turq, P.; Gebel, G.; Kahn, R.; Vandais, A.; Noel, J.P.; Malveau, C.;
Canet, D. J. Phys. Chem. B 2001, 105, 4503.


29
2. IDENTIFICATION OF MULTIPLE DIFFUSION RATES IN MIXED SOLVENT ANION EXCHANGE MEMBRANES USING HIGH RESOLUTION MAS NMR
Janelle E. Jenkins,*,† Michael R. Hibbs,‡ and Todd M. Alam*,†
†Department of Electronic and Nanostructured Materials; ‡Department of Materials, Devices, and Energy Technologies; Sandia National Laboratories, Albuquerque, NM 87123
Introduction As we look at the present and towards the future, it is evident that alternative energy sources are needed. One avenue that is being heavily pursued in this race towards clean, efficient energy is the research and advancement of fuel cell technologies. Anion exchange membranes (AEM) are one type of polymer electrolyte that are being developed for applications in alkaline fuel cells.1 Many current fuel cells operate at low pH with the use of a proton exchange membrane such as the commercially available Nafion® membrane.2 AEM could potentially be utilized in high pH fuel cells, which would be beneficial for direct methanol fuel cells due to the fact that methanol oxidizes more easily at higher pH.3 At high pH non-precious metal catalysts can also be utilized, reducing the overall cost of fuel cells.3 The need to extend the operating range of fuel cells is actively driving current efforts towards new membranes development.1 One important aspect in understanding the performance of these materials is measuring the polymer-solvent interaction that occurs in these alkaline fuel cells. Due to a lack of commercial anion exchange membranes there have been few fundamental studies on the polymer-solvent interactions. High Resolution Magic Angle Spinning (HRMAS) NMR spectroscopy is a recently developed technique combining the power of MAS with the introduction of a magnetic field gradient along the magic angle axis. The technique allows for narrowing of line widths in materials that are not pure liquid or solid by further averaging the residual dipolar interactions and removing broadening caused by magnetic susceptibility with spinning. HRMAS studies have become very popular for heterogeneous soft biological samples such as tissue and lipid membranes where complete motional averaging is incomplete on the NMR time scale.4-6 In addition to biological materials, HRMAS NMR can be applied to swollen resins, polymer gels and membranes, surface modified nanoparticles andother material systems that are in the intermediate solid/liquid motional time regime.7-18 While these examples illustrate the power of HR-MAS NMR for the characterization and investigation of materials systems, current applications to study polymer membranes has been limited. The coupling of HRMAS to pulse field gradient (PFG) NMR to study diffusional processes in materials has also been reported. This work includes the diffusion of solvents in ceramics and zeolites, including the separation of different diffusion rates in mixed solvent systems.9, 10, 19-21 Discussion In this study, 1H HRMAS NMR is utilized to identify different solvent environments within the anion exchange membrane, aminated tetramethyl polyphenylene (ATMPP),22 and to provide a measurement of the diffusional processes occurring within the membrane. Figure 2-1a shows the 1H NMR spectra for the membrane swollen in a 1N methanol solution under static condition. In previous studies of methanol/water swollen polymer electrolyte membranes such as PVDFF-g-PSSA or Nafion® 117, individual resonances for methanol and water are observed at static conditions.23 However, the NMR spectrum of ATMPP only exhibits a broad resonance spanning 3 to 5 ppm, with the water and methanol species unresolved. Under these conditions the diffusion rate determined using PFG NMR is a weighted
30
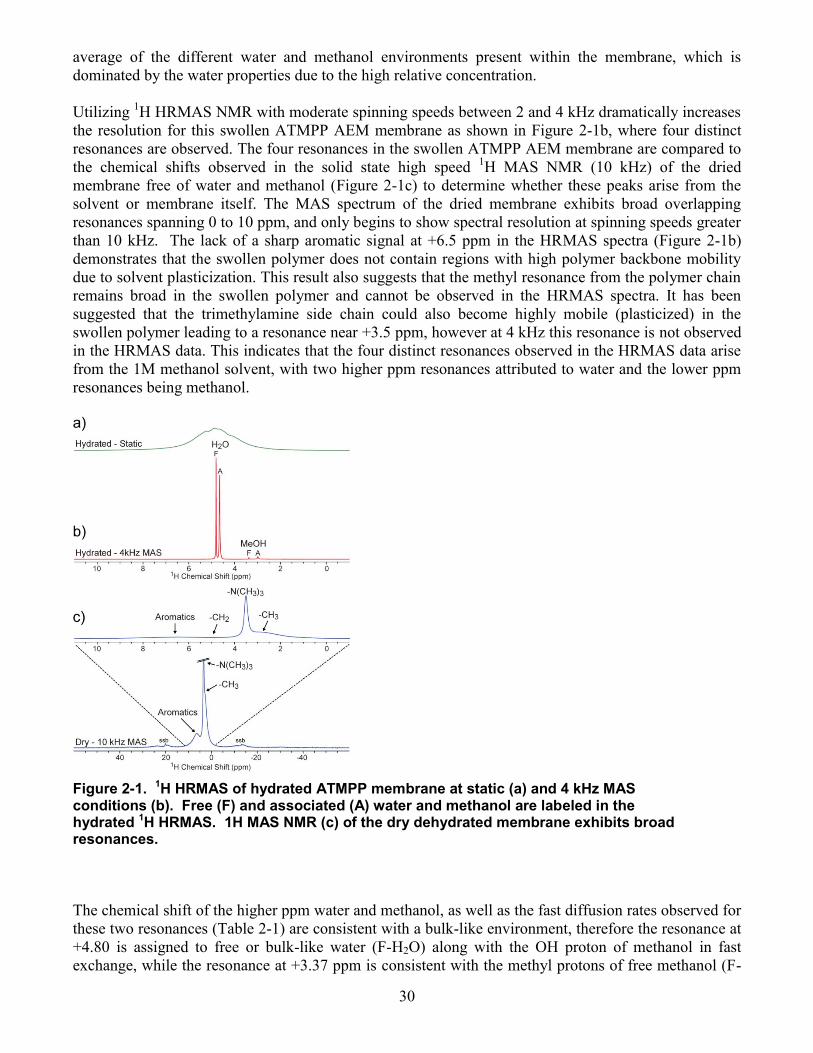
average of the different water and methanol environments present within the membrane, which is dominated by the water properties due to the high relative concentration. Utilizing 1H HRMAS NMR with moderate spinning speeds between 2 and 4 kHz dramatically increases the resolution for this swollen ATMPP AEM membrane as shown in Figure 2-1b, where four distinct resonances are observed. The four resonances in the swollen ATMPP AEM membrane are compared to the chemical shifts observed in the solid state high speed 1H MAS NMR (10 kHz) of the dried membrane free of water and methanol (Figure 2-1c) to determine whether these peaks arise from the solvent or membrane itself. The MAS spectrum of the dried membrane exhibits broad overlapping resonances spanning 0 to 10 ppm, and only begins to show spectral resolution at spinning speeds greater than 10 kHz. The lack of a sharp aromatic signal at +6.5 ppm in the HRMAS spectra (Figure 2-1b) demonstrates that the swollen polymer does not contain regions with high polymer backbone mobility due to solvent plasticization. This result also suggests that the methyl resonance from the polymer chain remains broad in the swollen polymer and cannot be observed in the HRMAS spectra. It has been suggested that the trimethylamine side chain could also become highly mobile (plasticized) in the swollen polymer leading to a resonance near +3.5 ppm, however at 4 kHz this resonance is not observed in the HRMAS data. This indicates that the four distinct resonances observed in the HRMAS data arise from the 1M methanol solvent, with two higher ppm resonances attributed to water and the lower ppm resonances being methanol.
The chemical shift of the higher ppm water and methanol, as well as the fast diffusion rates observed for these two resonances (Table 2-1) are consistent with a bulk-like environment, therefore the resonance at +4.80 is assigned to free or bulk-like water (F-H2O) along with the OH proton of methanol in fast exchange, while the resonance at +3.37 ppm is consistent with the methyl protons of free methanol (F-
Figure 2-1. 1H HRMAS of hydrated ATMPP membrane at static (a) and 4 kHz MAS conditions (b). Free (F) and associated (A) water and methanol are labeled in the hydrated 1H HRMAS. 1H MAS NMR (c) of the dry dehydrated membrane exhibits broad resonances.

31
MeOH). The increased resolution observed in the HRMAS spectra also enabled the use of 1H NOESY experiments to assist in resonance assignment. At longer mixing times (> 200ms) through space NOE correlations are observed between the water resonance at +4.80 ppm and the methanol resonance at +3.37 ppm (supplemental), indicating that this water and methanol species are spatially close consistent with both species being in the same bulk-like environment. The two resonances observed at +4.65 and +2.98 ppm also exhibit a NOE correlation at long mixing times (> 200ms), however no correlations between these resonances and the “free” methanol/water are observed indicating that these two resonances are spatially close to each other and separate from the “free” environment. With an increased MAS rate to 6 kHz, the membrane begins to become observable. Utilizing this faster spinning speed and a long mixing time of 500ms, through space correlations are observed between the +4.65 ppm water resonance and the membrane in Figure 2-2a indicating that this water environment is spatially close or associated with the membrane. This correlation is also observed for the methanol resonance at +2.98 ppm (data not shown). Therefore, the peaks at +4.65 and +2.98 ppm have been assigned to water (A-H2O) and methanol (A-MeOH) associated or bound to the polymer membrane, respectively. The observation of four distinct resonances, two for both water and methanol is surprising as previous studies on methanol/water membrane systems have only observed a single water and methanol resonance.23, 24 These distinct water and methanol shifts observed in ATMPP are not simply the result of regions with different magnetic susceptibility within the membrane as they reveal diffusion rates that are significantly slower than that observed for the free or bulk-like water and methanol species (see below). This argument is not consistent with the very fast diffusion constant observed for the +3.37 ppm resonance (see below). These results demonstrate that for this membrane system and conditions the polymer signal remains broad, is not readily observed under HRMAS conditions, and does not bias the investigation of the sharp signals arising from the solvent within the swollen membrane.
Figure 2-2 1H 2D NOESY exchange HRMAS NMR data of 1 N methanol swollen ATMPP membrane collected at a MAS rate of 6 kHz (a). A projection taken at the A-H2O resonances shows correlations to the membrane aromatic and methyl regions (b, blue), while the projection at F-H2O resonance exhibits no correlations to the membrane (b, red). A projection at the A-H2O shift with a shorter NOE mixing time shows correlation to the methyl of the trimethyl amine regions of the membrane (c, bottom).
The observation of water and methanol environments with distinct chemical shifts allows an upper limit on the exchange rate (k) between the different sites to be estimated. The chemical shift separation

32
between the free and associated water is Δδ = 90 Hz requiring the exchange correlation time (τ = 1/k) to be significantly longer than 3.5ms. Similarly, the chemical shift difference between the free and associated methanol environments was Δδ = 235 Hz, such that the exchange correlation time must be longer than 1.4ms. The ratio of the integrated intensities of the sum of the water to the sum of the methanol peaks is consistent with the ratio observed in the 1N methanol solution, 51±3:1 water to methanol, which demonstrates that the solvent uptake by the AEM membrane is non-preferential. The partitioning of the solvent within the membrane however exhibits preferential behavior within free and associated species. The ratio of F-H2O to F-MeOH in this ATMPP membrane is 100±5:1. In contrast the ratio of the A-H2O to A-MeOH is 30±2:1, suggesting that the methanol is preferentially associated to the polymer membrane in comparison to the bulk solvent. This partitioning may play a role in the performance of these membranes. For fuel cell membranes that utilize methanol/water solvents, it is also extremely desirable to determine the transport properties for each individual solvent environment observed in the membrane. Utilizing the increased resolution obtained from 1H HRMAS NMR, PFG NMR experiments were performed using a bipolar stimulated echo (BPSTE)25 pulse sequence to determine the individual diffusion constants of the solvent within ATMPP. The results are given in Table 1, where the methanol rates are measured from the methyl of methanol, while the water rates include a small contribution from the OH of methanol that is in fast exchange with water. The diffusion constant for the higher ppm water resonance is similar but slightly slower than water in 1N methanol solution, supporting the assignment as free unbound water. The lower ppm water resonance exhibits a slower molecular diffusion rate, is about 4 times slower than water in the bulk 1N methanol solution, and is assigned to water associated or bound to the membrane. Two different diffusion rates were also observed for the methyl protons of methanol, a faster rate consistent with methanol diffusion in a free or bulk-like 1N methanol environment, and a slower diffusing methanol species that is nearly 7 times slower than methanol in a 1N methanol solution. Like water this slow
Table 2-1 Solvent Diffusion Properties Measured Utilizing 1H HR-MAS NMR in an Anion
Exchange Membrane.
Chemical Shift (ppm) FWHM (Hz) Diffusion
Rate (m2/s)a b DMeOH/DH2O
c
F-H2O 4.80 8 1.8 (± 0.1) x 10-9 0.78 ± 0.16 -
A-H2O 4.65 18 5.4 (± 0.1) x 10-10 0.23 ± 0.05 -
1N MeOH- H2O 4.83 7 2.3 (± 0.1) x
10-9 1 -
F-MeOH 3.37 9 1.6 (± 0.1) x 10-9 1.1 ± 0.2 0.89 ± 0.11
A-MeOH 2.98 29 2.3 (± 0.1) x 10-10 0.15 ± 0.03 0.43 ± 0.03
1N MeOH- MeOH 3.39 2 1.5 (± 0.1) x
10-9 1 0.65 ± 0.07 aDiffusion rate at 298K with a diffusion delay of Δ=50ms.
b is the measured diffusion rate of water or methanol divide by
the diffusion rate of the corresponding water or methanol in the original 1N methanol solution. cRatio of diffusion rate for F-
MeOH/F-H2O and A-MeOH/A-H2O.

33
methanol resonance is assigned to methanol associated with the membrane. This slower methanol diffusion rate for the A-MeOH species in combination with preferential concentration of methanol within the membrane indicates that the methanol molecules are more strongly associated with the polymer than the water molecules with the membrane. There are some practical aspects that must be taken into consideration when performing PFG diffusion under HRMAS conditions. Difficulties with reproducibility have been outlined nicely by Viel et al.26 The diffusion data presented here was found to be highly consistent and reproducible, indicating that HRMAS diffusion measurements on this type of AEM system are feasible. The diffusion data shown in Figure 2-3 are predominantly single exponential decays, and clearly show four distinct diffusion constants correlating to discrete free and associated solvent environments in this hydrated ATMPP AEM. Deconvolution of multi-exponential decay was not required. The diffusion rate of A-H2O is in the range of values for the self-diffusion coefficient previously observed in AEM with similar IEC values.27 The A-H2O and A-MeOH values are slightly lower than values observed for methanol and water diffusion in Nafion®, ~3.5 x 10⁻¹⁰ m2/s and ~6.5 x 10⁻¹⁰ m2/s, respectively.24 Additional polymer electrolytes developed for direct methanol fuel cells exhibit diffusion rates for water that are slightly higher than A-H2O of ATMPP, however on average the A-MeOH rates in ATMPP are faster than these polymers.28 A portion of the free water/methanol environment likely arises from excess solvent in the HRMAS insert that could not be removed after packing the sample without dehydrating the membrane, or to solvent that may have been displaced by centrifugation forces under MAS conditions. On the other hand if it was truly a bulk like solvent the observed water diffusion rate would be expected to match the 1N solution, not have = 0.78 (Table 2-1), suggesting that a portion of the free water is within large pores or voids in the polymer membrane, and is partly slowed by polymer interactions. Because of the issue of excess solvent, no quantitative comparison between the free and associate solvent ratios are discussed. However, the diffusion rates can be compared between free and associated species. The diffusion rate of free methanol to water is 0.89 compared to the 0.43 ratio for the associated species. The associated ratio is similar to ratios observed in proton-conducting membranes.28 The low ratio of 0.43 highlights that the methanol is not being transported as quickly through the membrane compared to the water, reiterating the fact that methanol appears to be more strongly associated with the membrane as observed in the accumulation of methanol within the membrane. Deff = A-H2ODA-H2O + A-OHD A-HO (equation 1) The observation of distinct diffusion constants also allows a lower limit on the domain size within the membrane to be estimated by determining the length scale (l) of diffusion process during the inter-pulse delay (Δ) of the PFG NMR experiment using √ . For associated water which exhibits the measured diffusion rate of D=5.4 x 10⁻¹⁰ m2/s at Δ = 50ms, the domain size must be > 7 µm. For associated methanol with a diffusion rate of D=2.3 x 10⁻¹⁰ m2/s at Δ = 50ms, the domain size must be > 5 µm. The Δ was incremented to 500ms (data not shown) to investigate the diffusion rate dependence on Δ. No significant changes in the diffusion rate were observed. The line width and chemical shift of the individual resonances were also consistent with increasing Δ values, indicating that there are no additional overlapping species present other than F-H2O, F-MeOH, A-H2O, and A-MeOH within the methanol/water solvent in the ATMPP membrane. The ability to resolve these different solvent environments was simply not possible using standard static 1H PFG NMR techniques. It would be possible to obtain the water and methanol components using separate 1H and 13C detected PFG NMR experiments. However, by incorporating 1H HRMAS NMR techniques the different solvent environments are immediately resolvable. This resolution allowed the

34
measurement of diffusion rates for each different species thus providing additional insight into the transport properties of solvents within fuel cell membranes. This study furthers the applications of HRMAS NMR in materials science. It also demonstrates the benefit of this technique to the field of AEM and other similar materials, by enabling diffusion measurements to be performed on mixed solvent systems which otherwise would be inaccessible utilizing standard static NMR diffusion methods. HRMAS PFG experiments will open new insights into the characterization of diffusion behavior of anion exchange polymer membranes and has the potential for multiple applications in fuel cell research.
References
1. Zhang, H.; Shen, P. K. Chem. Soc. Rev. 2012, 41, 2382-2394. 2. Pourcelly, G. Petroleum Chemistry 2011, 51, (7), 480-491.
3. Varcoe, J. R.; Slade, R. C. T. Fuel Cells 2005, 5, (2), 187-200.
4. Zietkowski, D.; Davidson, R. L.; Eykyn, T. R.; De Silva, S. S.; deSouza, N. M.; Payne, G. S.
NMR Biomed. 2010, 23, 382-390.
5. Lindon, J. C.; Beckonert, O. P.; Holmes, E.; Nicholson, J. K. Prog. Nucl. Mag. Res. Sp. 2009,
55, 99-100.
6. Beckonert, O.; Coen, M.; Keun, H. C.; Wang, Y.; Ebbels, T. M. D.; Holmes, E.; Lindon, J. C.;
Nicholson, J. K. Nat. Protoc. 2010, 5, (6), 1019-1032.
7. Iqbal, S.; Rodríguez-LLansola, F.; Escuder, B.; Miravet, J. F.; Verbruggen, I.; Willem, R. Soft
Matter 2010, 6, 1875-1878.
Figure 2-0-3 Normalized signal intensity decay of free and associated water and methanol in ATMPP as a function of gradient strength.

35
8. Sizun, C.; Raya, J.; Intasiri, A.; Boos, A.; Elbayed, K. Micropor. Mesopor. Mat. 2003, 66, 27-
36.
9. Carrara, C.; Pagès, G.; Delaurent, C.; Viel, S.; Caldarelli, S. J. Phys. Chem. C. 2011, 115,
18776- 18781.
10. Gratz, M.; Hertel, S.; Wehring, M.; Stallmach, F.; Galvosas, P. New J. Phys. 2011, 13, 045016.
11. Posset, T.; Guenther, J.; Pope, J.; Oeser, T.; Blümel, J. Chem. Commun. 2011, 2011, (47), 2059-
2061.
12. Posset, T.; Blümel, J. J. Am. Chem. Soc. 2006, 128, 8394-8395.
13. Blümel, J. Coordination Chemistry Reviews 2008, 252, 2410-2423.
14. Guenther, J.; Reibenspies, J.; Blümel, J. Adv. Synth. Catal. 2011, 353, 443-460.
15. Siddiki, M. K.; Venkatesan, S.; Qiao, Q. Phys. Chem. Chem. Phys. 2012.
16. Rousselot-Pailley, P.; Maux, D.; Wieruszeski, J.-M.; Aubagnac, J.-L.; Martinex, J.; Lippens, G.
Tetrahedron 2000, 56, 5163-5167.
17. Schröder, H. Combinatorial Chemistry & High Throughput Screening 2003, 6, (741-753), 741.
18. Burba, C. M.; Rice, C. V. Mol. Cryst. Liq. Cryst. 2012, 555, 280-294.
19. Fernandez, M.; Kärger, J.; Freude, D.; Pampel, A.; van Baten, J. M.; Krishna, R. Micropor.
Mesopor. Mat. 2007, 105, 124-131.
20. Fernandez, M.; Pampel, A.; Takahashi, R.; Sato, S.; Freude, D.; Kärger, J. Phys. Chem. Chem.
Phys. 2008, 10, 4165-4171.
21. Romanova, E. E.; Grinberg, F.; Pampel, A.; Kärger, J.; Freude, D. J. Magn. Reson. 2009, 196,
110-114.
22. Hibbs, M. R.; Fujimoto, C. H.; Cornelius, C. J. Macromolecules 2009, 42, 8316-8321.
23. Hietala, S.; Maunu, S. L.; Sundholm, F. J. Polym. Sci. B Polym. Phys. 2000, 38, 3277-3284.
24. Hallberg, F.; Vernersson, T.; Pettersson, E. T.; Dvinskikh, S.; Lindbergh, G.; Furó, I.
Electrochim. Acta 2010, 55, 3542-3549.
25. Cotts, R. M.; Hoch, M. J. R.; Sun, T.; Markert, J. T. J. Magn. Reson. 1989, 83, (2), 252-566.
26. Viel, S.; Ziarelli, F.; Pagès, G.; Carrara, C.; Caldarelli, S. J. Magn. Reson. 2008, 190, 113-123.
27. Hibbs, M. R.; Hickner, M. A.; Alam, T. M.; McIntyre, S. K.; Fujimoto, C. H.; Cornelius, C. J.
Chem. Mater. 2008, 20, 2566-2573.
28. Huang, Y. F.; Chuang, L. C.; Kannan, A. M.; Lin, C. W. J. Power Sources 2009, 186, 22-28.


37
3. ALKALINE STABILITY OF POLY(PHENYLENE)-BASED ANION EXCHANGE MEMBRANES WITH VARIOUS CATIONS
Michael R. Hibbs
Department of Material, Devices, & Energy Technologies Sandia National Laboratories, Albuquerque, NM 87185
Introduction Recently, there has been increased interest in the development of anion exchange membrane fuel cells (AEMFCs). The fundamental difference between AEMFCs and the more widely studied proton exchange membrane fuel cells is that the former operate at high pH thus requiring the membrane to conduct hydroxide ions from the cathode to the anode. The key advantage of operating a fuel cell under alkaline conditions is the potential to forgo noble metal catalysts due to the low overpotentials associated with many electrochemical reactions at high pH.1 The improved electrokinetics also allow for the possible use of high energy density fuels such as ethanol which is also a renewable resource as it can be produced directly by fermentation of biomass. A major challenge in the development of AEMFCs is the need for an anion exchange membrane (AEM) that is chemically stable under the conditions within an AEMFC.2,3 AEMs are typically made with polymers that have pendant cationic groups. By far the most commonly reported cationic group is the benzyl trimethylammonium (BTMA) cation. AEMs have been prepared with BTMA cations attached to polymer backbones such as poly(phenylene),4 poly(tetrafluoroethene-co-hexafluoropropylene),5 poly(phenylene oxide),6 poly(ether-imide),7 poly(arylene ether sulfone),8,9,10,11 and poly(ether ether ketone).12 Many of these BTMA-containing membranes are reported to have good chemical stability. For example, the ion exchange capacity of a radiation-grafted perfluorinated AEM with BTMA cations was shown to decrease by less than 5% after a 233 hour fuel cell test at 50 oC.13 Another study of the degradation mechanisms of tetraalkylammonium compounds concluded that maintaining hydration around the cations is critical to stability and that, under the correct conditions, such cations possess reasonable stability at temperatures above 60 oC.14 Despite reports such as this, BTMA cations are generally considered to have insufficient stability for long-term use in AEMFCs. Thus the investigation of cationic groups with improved chemical stability is of paramount importance to the development of AEMFCs. One relatively early study of cation stabilities found that quaternized 4,4’-diazobicyclo-[2.2.2]-octane cations had improved stability to alkaline conditions when compared to BTMA cations.15 Another approach to preparing more stable cations is to reduce susceptibility to nucleophilic attack by using resonance-stabilized cations such as guanidinium16,17 or imidazolium18,19 groups. Other reports have included the use of coordinated metal cations20 or phosphonium cations with bulky electron-donating substituents to both sterically protect the ion from nucleophilic attack and to lessen the charge density on the phosphorous atom.21 Additionally, it has been reported that attachment of quaternary ammonium groups to the polymer backbone via an alkylene spacer

38
of >3 carbon atoms can lead to improved chemical stability.22 Attachment of imidazolium23 and guanidinium24 groups with alkylene spacers have also been reported. We have previously described the preparation of AEMs with BTMA cations on a poly(phenylene) backbone that is very stable under alkaline conditions and in AEMFC testing.25 The present chapter will discuss the attachment and stability of benzylic resonance-stabilized cations on the poly(phenylene) backbone as well as ammonium cations attached by flexible spacers. Experimental Materials All reagents were purchased from commercial vendors and used without further purification unless specified. 1,1,2,3,3-Pentamethylguanidine (PMG) was prepared according to the procedure of Wang et al.16 TMPP, BTMPP, and ATMPP were prepared as described previously.4 DAPP was prepared according to the procedure of Fujimoto et al.26 Synthesis and casting of ImTMPP. BTMPP (1.25 g, 2.6 –CH2Br/repeat unit) was dissolved in N,N-dimethylacetamide (DMAc) (38 mL) in a flask under argon. N-methylimidazole (0.75 mL, 9.4 mmol) was added and the solution was heated to 80 oC for 30 min. After cooling to room temperature, the solution was filtered and poured onto a glass casting dish (5 x 5 inch). The dish was held in a vacuum oven at room temperature for 4 h and then at 50 oC for 18 h. The resulting membrane was then immersed in 0.5 M HBr for 2 hours and then in deionized water for at least 24 hours to yield the ImKC6PP membrane in its bromide counterion form. Synthesis and casting of PMGTMPP. BTMPP (1.25 g, 2.3 –CH2Br/repeat unit) was dissolved in DMAc (52 mL) in a flask under argon. PMG (3.3 g, 25 mmol) was added and the solution was heated to 80 oC for 30 min. After cooling to room temperature, the solution was filtered and poured onto a glass casting dish (5 x 5 inch). The dish was held in a vacuum oven at room temperature for 4 h and then at 50 oC for 18 h. The resulting membrane was then immersed in 0.5 M HBr for 2 hours and then in deionized water for at least 24 hours to yield the ImKC6PP membrane in its bromide counterion form. Synthesis of BrKC6PP. The degree of functionalization (DF) could be controlled by varying the amount of acylating reagent. Details for the reaction resulting in BrKC6PP with DF = 2.02 are given here. DAPP (1.73 g, 2.28 mmol) was dissolved in dichloromethane (110 mL) in a flask under argon. The flask was chilled in an ice/water bath and 6-bromohexanoyl chloride (0.80 mL, 5.35 mmoles) was added. Aluminum chloride (x g, x mmol) was added to the flask, the bath was removed, and the reaction was allwed to warm to room temperature over 5 hours while stirring. The solution was poured into a beaker containing 200 mL deionized water and the beaker was heated to 60 oC to evaporate the organic solvent. After cooling to room temperature the mixture was filtered and the solid was blended with acetone in a Waring blender. The mixture was filtered and the solid was dried at room temperature under vacuum to yield BrKC6PP as an off-white solid (2.28 g, 85%).

39
Synthesis of TMAKC6PP. A solution of BrKC6PP (440 mg) in chloroform (10 mL) was filtered through a syringe filter into a circular glass dish with a 3.75 inch diameter. An inverted beaker was placed over the dish and the solvent was allowed to evaporate over 18 h. The resulting film was removed from the dish and immersed in a trimethylamine solution (50 wt % in water) for 48 hours. The resulting membrane was then immersed in 0.5 M HBr for 2 hours and then in deionized water for at least 24 hours to yield the TMAKC6PP membrane in its bromide counterion form. Synthesis of BrC6PP. To a solution of BrKC6PP (1.50 g, 1.16 mmol)) in chloroform (40 mL) was added trifluoroacetic acid (20 mL) and triethylsilane (1.90 mL, 11.91 mmol). The solution was heated to reflux for 48 hours, then cooled to room temperature and poured into a beaker containing NaOH (9.6 g) dissolved in water (300 mL). The beaker was heated to 60 oC to evaporate the organic solvent. After cooling to room temperature the mixture was filtered and the solid was blended with acetone in a Waring blender. The mixture was filtered and the solid was dried at room temperature under vacuum to yield BrC6PP as a white solid (1.30 g, 89%). Synthesis of TMAC6PP. A solution of BrC6PP (1.20 g) in chloroform (30 mL) was filtered through a syringe filter into a glass casting dish (5 x 5 inch). An inverted beaker was placed over the dish and the solvent was allowed to evaporate over 18 h. The resulting film was removed from the dish and immersed in a trimethylamine solution (50 wt % in water) for 48 hours. The resulting membrane was then immersed in 0.5 M HBr for 2 hours and then in deionized water for at least 24 hours to yield the TMAC6PP membrane in its bromide counterion form. Conversion of membranes to chloride or hydroxide form Membranes with bromide counterions were soaked in either 1 M NaCl or 1 M KOH aqueous solutions at room temperature for 48 h to exchange the bromide ions for chloride or hydroxide ions. Afterward the membranes were immersed in deionized water for at least 24 h prior to analysis. Hydroxide stability testing Membranes in bromide form were immersed in a 4 M KOH aqueous solution solution in a stirred reactor at 90 oC for 14 days. At designated intervals, samples were removed from the reactor and were checked for IEC and Cl- conductivity. Used samples were not returned to the reactor. Samples for IEC measurements were immersed in deionized water for at least 48 with the water frequently replaced prior to analysis. Samples for chloride ion conductivity measurements were immersed in 1 M HCl for 48 h and then in deionized water for at least 24 h prior to analysis. Characterization and Measurements Gel permeation chromatography (GPC) was performed with a liquid chromatograph equipped with a Viscotek VE2001 isocratic pump and autosampler and a Viscotek VE3580 refractive index detector. The mobile phase was tetrahydrofuran and the system was operated at 25 °C with a flow rate of 1.0 mL min-1. The weight-average molecular weights were measured by calibration with polystyrene standards. 1H NMR spectra of the polymers were obtained on a Bruker 500 MHz spectrometer using 5 mm o.d. tubes. Sample concentrations were about 5 % (w/v) in CDCl3 or CD2Cl2 for non-ionic

40
samples. DMSO-d6 was used for polymers with attached cations and the spectra were obtained at 90 oC. Ion exchange capacities (IECs) were determined by a back titration procedure described previously with one modification.8 After the titration, the membrane samples were immersed in 0.5 M KOH to convert them to hydroxide form and the wet and dry masses were measured for these samples. So the water uptake values and IECs reported here are for the membranes in hydroxide form. Ionic conductivities were measured using an impedance spectroscopy method also described previously.26 All measurements were performed in deionized water at room temperature with the membranes in chloride form. Results and Discussion The preparation of poly(phenylene)s with three different benzylic cations is shown in Figure 3-1. All three are prepared by the nucleophilic substitution of a benzylic bromine atom by a nitrogen-containing base. The preparation of the polymer with BTMA cations (ATMPP) differs from the other two because the BTMA cations are formed with the polymer in the solid state.4 Attempts to make AEMs by immersing films of BTMPP in aqueous solutions of either N-methylimidazole or PMG failed, yielding only polymers with few, if any, attached cationic groups. N-methylimidazole and PMG are each much larger molecules than trimethylamine and the lack of substitution products in this case is probably due to their inability to penetrate the solid polymer matrix to react with the bromomethyl groups. Instead, ImTMPP and TMGTMPP were prepared by addition of the appropriate base to a solution of BTMPP in DMAc. Membranes could be cast directly from the reaction solution and excess base was removed by soaking the membranes in aqueous acid. Conversion of the bromomethyl groups to resonance-stabilized cations was quantitative. The structures of the imidazolium- and guanidinium-containing polymers were confirmed by 1H NMR spectroscopy and the peak assignments were in good agreement with the previously reported results for polymers with the same pendant ionic groups.16,27 For simplification, the ionomer structures in Figure 1 each show exactly two cations per repeat unit. In reality, the number of cationic groups is controlled by the number of bromomethyl groups formed in the first reaction step and the average number of cations per repeat unit can range from zero to four. The exact number of bromomethyl groups per repeat unit (DF) for each polymer discussed here was determined by NMR and the results are given in Table 3-1.

41
Figure 3-1 Synthetic Scheme for Poly(phenylene)s with Benzylic Cations. The attachment of sidechains to the poly(phenylene) backbone was accomplished by a Friedel-Crafts acylation of 6-bromo-1-hexanoyl chloride on the parent polymer, DAPP. In Figure 3-2, the acylated polymer, BrKC6PP, is depicted as having one sidechain per repeat unit for simplicity, although samples with up to 2.7 sidechains per repeat unit were prepared. The acylation could take place at any available position on any of the aryl rings in DAPP, however because of their steric bulk, the six pendant rings probably prevent the backbone rings from taking part in the reaction. The distribution of aryl substitution patterns could not be determined due to the overlapping peaks in the aryl region of the 1H NMR spectrum of BrKC6PP (Figure 3-3). The average number of sidechains attached to each repeat unit (DF) for BrKC6PP was determined from the 1H NMR spectrum by comparing the total aromatic peak area to the combined areas of the peaks assigned to the methylene units in the sidechains and these values are listed in Table 3-1.
Table 3-1 Anion Exchange Membrane Properties. Measured IEC
(meq/g)
DF Theoretical IEC (meq/g)
Titration 1H NMR Water Uptakea (wt. %)
Cl- Conductivity (mS/cm)
ATMPP 2.88 2.79 2.21 2.69 148 17.7 PMGTMPP 2.51 2.12 1.51 2.05 66 10.0 ImTMPP 2.51 2.36 1.79 2.35 59 9.7 TMAKC6PP 2.48 2.08 1.46 N/Ab 91 13.0 TMAC6PP 2.48 2.15 1.73 2.18 100 15.7 aHydroxide form. bMembrane was not soluble in any solvent tested.

42
Protons in the α-position of ketones are known to be somewhat acidic due to the formation of enolate ions. Since the present study is concerned with chemical stability under strongly alkaline conditions, it was foreseen that the α-protons on the side chains in BrKC6PP might be a weak point that could lead to unwanted degradation reactions. To test this possibility and to potentially avoid it, BrKC6PP was treated with triethylsilane to reduce the ketone to a methylene group. In Figure 3-3 the disappearance of the peak assigned to the α-protons (e) and the appearance of the peak assigned to the protons adjacent to phenyl ring (f’) are clear evidence for the reduction. The resulting polymer, BrC6PP, has purely alkyl sidechains which cannot form enolate ions. Formation of hexane-1-one-6-trimethylammonium ions on BrKC6PP and
Figure 3-2 Synthetic Scheme for Poly(phenylene)s with Sidechain Tethered Cations.

43
hexane-6-trimethylammonium (HTMA) ions on BrC6PP was accomplished by casting films of the parent polymers and then soaking them in aqueous trimethylamine. The data in Table 3-1 show that the measured IEC values for all of the polymers were lower than the theoretical values (70-80% of theoretical) and this is consistent with reported results for
Figure 3-3 1H NMR Spectra of BrKC6PP (top) and BrC6PP (bottom). several other AEMs.8,28,29 All of the ionomers in Table 3-1 except for TMAKC6PP were soluble in either DMF or DMSO, so their IECs could also be checked by 1H NMR spectroscopy. In all four cases, the NMR-measured IEC values were in close agreement with the theoretical values, indicating that the bromomethyl and bromoalkyl groups in the parent polymers were essentially all converted to ammonium groups. Thus the titration-measured IECs must be low because of a systemic error during the titration itself; possibly incomplete ion exchange, incomplete drying, or removal of water-soluble high IEC oligomers. The titration-measured IECs are self-consistent however since titrations of replicate samples gave results within ±5% of each other. Ionic conductivities were measured with the membranes in chloride form in order to avoid issues with the formation of carbonate ions in hydroxide form membranes when exposed to atmospheric CO2. Based on the dilute-solution mobilities of hydroxide and chloride anions, the conductivity for AEMs in OH- form can be predicted to be about 2.6 times greater than the chloride form conductivity.30,31 This has been demonstrated for a different class of AEMs and it can reasonably be assumed that a similar relationship holds for the conductivities listed in Tables 3-1 and 3-2.20 The chloride conductivities in Table 3-1 trend very well with the water uptakes, suggesting that for these AEMs, the ion conductivity depends more strongly on the water content than on the identity or mobility of the cation. Since the two AEMs with resonance-stabilized cations, PMGTMPP and ImTMPP, have low water uptakes, they also have the two lowest conductivities. This is in contrast with reports of different guanidinium- and imidazolium-

44
containing polymers for which high conductivity values are surmised to be due to delocalization of the positive charge. The stabilities of the various cations under alkaline conditions were tested by exposing membrane samples to 4M KOH at 90oC for 14 days and results are given in Table 3-2. The decreases in conductivity are all accompanied by similar decreases IEC, confirming that the
Table 3-2 Stability of Anion Exchange Membranes in 4M KOH at 90 oC (Cl- conductivity / IECa).
0 days 1 day 2 days 7 days 14 days ATMPP 18/2.2 15/2.2 14.0/2.1 13/1.9 13/1.8 PMGTMPP 10/0.70 0.60/0.06 0.60/0.01 0.40/0.004 0.40/0.001 ImTMPP 9.7/1.5 4.0/1.1 4.0/1.1 3.8/1.1 2.3/1.0 TMAKC6PP 13/1.4 6.0/1.0 5.4/0.92 1.1/0.70 0.80/0.65 TMAC6PP 16/1.7 13/1.7 13/1.5 12/1.5 12/1.5 aMeasured by titration because all samples were insoluble after testing. conductivity losses are due to cation degradation and not some other phenomenon such as morphological change. For comparative ease, Figure 3-4 shows the conductivity results as percentages of each membrane’s initial conductivity. All of the membranes remained tough and flexible throughout the test due to the exceptional stability of the poly(phenylene)
Figure 3-4 Changes in Chloride Ion Conductivity During Test in 4M KOH at 90 oC.
0
10
20
30
40
50
60
70
80
90
100
0 5 10 15
% o
f ini
tial c
ondu
ctiv
ity
Time (days)
ATMPP
TMAKC6PP
ImTMPP
PMGTMPP
TMAC6PP

45
backbone.25 The cations showed a wide range of stabilities with the ATMPP (BTMA cations) and TMAC6PP (HTMA, cations) being the most stable. These two membranes each had a decrease in conductivity of about 20-30% over the first seven days of the test and virtually no further change over the next seven days. This leveling out behavior was unexpected and might be due to an initial, slow degradation of the cations on the surface of these membranes which creates a hydrophobic protective “skin” that prevents access by hydroxide ions to the interior of the membrane. It is interesting to note that TMAC6PP retains a slightly higher portion of its conductivity than ATMPP despite the fact that HTMA cations are susceptible to Hofmann elimination reactions while BTMA cations (which lack β-hydrogens) are not. Thus the stability advantage that HMTA cations gain by not having the methylene which is both benzylic and adjacent to a positive charge in BTMA cations is greater than the disadvantage imposed by the presence of two β–hydrogen atoms. TMAKC6PP showed poor stability (90% conductivity loss over 7 days) and this must be due to the ketone functional group, given the good stability of TMAC6PP. The exact role of the ketone in the degradation reactions is unclear but a likely explanation is the formation of an enolate anion which can than act as a nucleophile in an intramolecular reaction with the cation at the end of the chain. Both ImTMPP and PMGTMPP showed very large decreases in conductivity after only one day of testing (59 and 94%, respectively). This was unexpected given previous reports of the alkaline stabilities of AEMs with benzylic guanidinium and imidazolium groups.16,18 However, the KOH concentration and the temperature of the test in the present study were both higher than in the previous studies and this might account for the apparent differences in stability. Both BTMA and HTMA cations showed much greater stability than the resonance-stabilized cations when attached to the poly(phenylene) backbone and the ATMPP and TMAC6PP AEMs appear to be the most promising candidates for use in AEMFCs. Conclusions A series of anion exchange membranes based on a Diels-Alder poly(phenylene) backbone and having a variety of different attached cations have been synthesized. All five membranes were tough and flexible before and after exposure to KOH solution at elevated temperature. All five membranes had water uptake and ionic conductivity values that are considered reasonable for use in AEMFCs. The membranes with resonance-stabilized cations (benzylic guanidinium and imidazolium groups) and the membrane with hexane-1-one-6-trimethylammonium sidechains showed poor stability under alkaline conditions (>50% loss of conductivity after 1 day). The membrane with hexane-6-trimethylammonium sidechains was the only one that showed greater stability than the previously-reported AEM with BTMA cations (20% vs. 30% conductivity loss after 14 days). Thus the replacement of a benzylic methylene spacer with a hexamethylene spacer results in greater stability despite the possibility of Hofmann elimination reactions which are not possible in the former case. For future reports, we intend to study the degradation mechanisms of these cations in order to further develop stable AEMs for AEMFCs.

46
References 1. Varcoe, J. R.; Slade, R. T. C. Fuel Cells, 2004, 4, 1-14. 2. Couture, G.; Alaaeddine, A.; Boschet, F.; Ameduri, B. Prog. Polym. Sci. 2011, 36, 1521-
1557. 3. Merle, G.; Wessling, M.; Nijmeijer, K. J. Membr. Sci. 2011, 377, 1-35. 4. Hibbs, M. R.; Fujimoto, C. H.; Cornelius, C. J. Macromol. 2009, 42, 8316-8321. 5. Danks, T. N.; Slade, R. T. C.; Varcoe, J. R. J. Mater. Chem., 2003, 13, 712-721. 6. Tongwen, X.; Weihua, Y. J. Membr. Sci. 2001, 190, 159-166. 7. Wang, G.; Weng, Y.; Chu, D.; Xie, D.; Chen, R. J. Membr. Sci. 2009, 326, 4-8. 8. Hibbs, M. R.; Hickner, M. A.; Alam, T. M.; McIntyre, S. K.; Fujimoto, C. H.; Cornelius, C. J. Chem. Mater. 2008, 20, 2566-2573. 9. Wang, J.; Wang, J.; Li, S.; Zhang, S. J. Membr. Sci. 2011, 368, 246-253. 10. Yan, J.; Hickner, M. A. Macromol. 2010, 43, 2349-2356. 11. Tanaka, M.; Fukasawa, K.; Nishino, E.; Yamaguchi, S.; Yamada, K.; Tanaka, H.; Bae,
B.; Miyatake, K.; Watanabe, M. J. Am. Chem. Soc. 2011, 133, 10646-10654. 12. Yan, X.; He, g.; Gu, S; Wu, X.; Du, L.; Zhang, H. J. Membr. Sci. 2011, 375, 204-211. 13. Varcoe, J. R.; Slade, R. T. C.; Lam How Yee, E. Chem. Commun. 2006, 1428-1429. 14. Macomber, C. S.; Boncella, J. M.; Pivovar, B. S.; Rau, J. A. J. Therm. Anal. Calorim.
2008, 93, 225-229. 15. Bauer, B.; Strathmann, H.; Effenberger, F. Desalination 1990, 79, 125-144. 16. Wang, J.; Li., S.; Zhang, S. Macromol. 2010, 43, 3890-3896. 17. Kim, D. S.; Labouriau, A.; Guiver, M. D.; Kim, Y. S. Chem. Mater. 2011, 23, 3795-
3797. 18. Qiu, B.; Lin, B.; Qui, L.; Yan, F. J. Mat. Chem. 2012, 22, 1040-1045. 19. Guo, M.; Fang, J.; Xu, H.; Li, W.; Lu, X.; Lan, C.; and Li, K. J. Mem. Sci., 2010, 362,
97-104. 20. Zha, Y.; Disabb-Miller, M. L.; Johnson, Z. D.; Hickner, M. A.; Tew, G. N. J. Am. Chem.
Soc. 2012, 134, 4493−4496. 21. Gu, S.; Cai, R.; Luo, T.; Chen, Z.; Sun, M.; Liu, Y.; He, G.; Yan, Y. Angew. Chem. Int. Ed., 2009, 48, 6499-6502. 22. Tomoi, M.; Yamaguchi, K.; Ando, R.; Kantake, Y.; Aosaki, Y.; and Kubota, H. J. Appl.
Polym. Sci., 1997, 64, 1161-1167. 23. Lin, B.; Qiu, L.; Qiu, B.; Peng, Y.; Yan, F. Macromol., 2011, 44, 9642-9649. 24. Zhang, Q.; Li, S.; Zhang, S. Chem. Commun. 2010, 46, 7495-7497. 25. Fujimoto, C.; Kim, D.-S.; Hibbs, M.; Wrobleski, D.; Kim, Y. S. paper submitted to J.
Membr. Sci. 26. Fujimoto, C. H.; Hickner, M. A.; Cornelius, C. J.; Loy, D. A. Macromol. 2005, 38, 5010-
5016. 27. Yan, X.; He, G.; Gu, S.; Wu, X.; Du, L.; Wang, Y. Int. J. Hydrogen Energy 2012, 37,
5216. 28. Danks, T. N.; Slade, R. C. T.; Varcoe, J. R. J. Mater. Chem. 2003, 13, 712-721. 29. Herman, H.; Slade, R. C. T.; Varcoe, J. R. J. Membr. Sci. 2003, 218, 147. 30. Dean, J. A. Lange’s Handbook of Chemistry, 15th ed.; McGraw Hill: New York, 1999. 31. Vanysek, P. In CRC Handbook of Chemistry and Physics, 83rd ed.; Lide, D. R., Ed.; CRC
Press: Boca Raton, FL, 2002.

47
4. SYNTHESIS OF POLY(PHENYLENE ALKYLENE)-BASED IONOMERS FOR USE IN ALKALINE FUEL CELLS
Michael R. Hibbs
Department of Materials, Devices, & Energy Technologies
Sandia National Laboratories, Albuquerque, NM 87185 Introduction This polymer described herein was developed as part of a project to develop alkaline fuel cell technology to a point of proof of feasibility. This technology has the potential to revolutionize fuel cell use in automotive and portable power applications. Alkaline fuel cells without precious metal catalysts were developed years ago but these traditional alkaline fuel cells required a liquid electrolyte because they lacked a true anion-exchange membrane (AEM) and suffered from reliability problems because of the formation of solid carbonate in the presence of CO2. Current research on alkaline AEM fuel cells (AAEMFCs) has shown that these membrane-based systems will not generate solid carbonate because of the absence of any mobile cation. They also mitigate potential corrosion problems by removing the liquid electrolyte. Research in this area has been limited however, and the power densities of AAEMFCs lag behind those of their proton exchange membrane (PEM) counterparts. Figure 4-1 shows a schematic of how a fuel cell membrane-electrode assembly (MEA) is constructed. The membrane is sandwiched between the two electrodes which consist of catalyst particles coated with an ionomer. The ionomer serves as both an adhesive to hold the electrodes to the membrane and as a carrier of ions between the membrane and the catalyst. The electrodes must also be designed so that fuel and water can move easily through them to facilitate the electrochemical reactions. A major contributor to the low power densities of AAEMFCs is poor reactant (fuel and/or oxygen) mass transport in the electrodes and this, in turn, is due largely to the lack of available ionomers to use in the electrodes.

48
Figure 4-1 Schematic of membrane-electrode assembly. Frequently the polymer that comprises the membrane and the ionomer are the same but that is not necessarily an ideal solution. In contrast to membrane polymers, polymers used as ionomers in fuel cell electrodes should have a high permeability to the fuel. The hydrophilicity of the ionomer also needs to be tuned to help manage the removal of the water that is formed (in the case of an AAEMFC) at the anode. The polymer described herein, TMAC6PPC6, was designed specifically to be used as an ionomer in an AAEMFC because of the flexible hexamethylene segments in the polymer backbone. Backbone flexibility is known to increase the permeability of small molecules through polymer films (permeability of fuels in TMAC6PPC6 such as methanol is discussed in chapter 5). The backbone flexibility should also lower the glass transition temperature (Tg) of the polymer and this in turn should lead to improved adhesion between the membrane and the electrodes during the hot press step of the MEA fabrication process. It is also important for fuel cell electrodes to exhibit an amount of swelling upon hydration that is similar to that of the membrane in order to maintain good contact between the two components. Thus as TMAC6PPC6 is tested in AAEMFCs, it will be important to control the water swelling of the polymer either by adjusting the ion exchange capacity (the number of cationic sidechains) or by adding hydrophobic groups (hydrocarbon or fluorocarbon sidechains). Experimental Experimental details for one batch of TMAC6PPC6 are given below:

49
Synthesis of DAPPC6. The polymerization was based on the procedure of Fujimoto et al. with a few modifications.1 1,4-Bis(2,4,5-triphenylcyclopentadienone)benzene (2.999 g, 4.341 mmol), 1,9-decadiyne (0.583 g, 4.341 mmol), and diphenyl ether (47 mL) were charged to a flask under argon. The mixture was frozen in a dry ice/acetone bath and was freeze-thaw degassed (2 times) before heating at 160 oC for 24 h. The reaction was cooled to 100 oC and toluene (40 mL) was added to thin the solution before cooling to room temperature. The solution was poured into excess acetone and the precipitate was dried, redissolved in methylene chloride (40 mL), and reprecipitated in acetone. The resulting solid was dried under vacuum at 180 oC to yield a tan solid (2.07 g, 62%). Synthesis of BrKC6PPC6. DAPPC6 (1.40 g, 1.82 mmol) was dissolved in dichloromethane (88 mL) in a flask under argon. The flask was chilled in an ice/water bath and 6-bromohexanoyl chloride (1.55 g, 7.28 mmoles) was added. Aluminum chloride (0.971 g, 7.28 mmol) was added to the flask and the mixture was allowed to stir for 2 hours. The bath was removed, and the reaction was allowed to warm to room temperature over 2 hours while stirring. The solution was poured into a beaker containing 200 mL deionized water and the beaker was heated to 60 oC to evaporate the organic solvent. After cooling to room temperature the mixture was filtered and the solid was blended with ethanol in a Waring blender. The mixture was filtered and the solid was dried at room temperature under vacuum to yield BrKC6PPC6 as an off-white solid (2.19 g, 81%). Synthesis of BrC6PPC6. To a solution of BrKC6PPC6 (2.13 g, 1.69 mmol) in dichloroethane (100 mL) was added trifluoroacetic acid (25 mL) and triethylsilane (1.25 mL, 7.83 mmol). The solution was heated to reflux for 24 hours, then cooled to room temperature and poured into a beaker containing KOH (17 g) dissolved in water (150 mL). The beaker was heated to 80 oC to evaporate the organic solvent. After cooling to room temperature the mixture was filtered and the solid was blended with ethanol in a Waring blender. The mixture was filtered and the solid was dried at room temperature under vacuum. The solid was dissolved in methylene chloride (30 mL), reprecipitated in ethanol, blended with more ethanol, and dried at room temperature under vacuum to yield BrC6PPC6 as an off-white solid (2.03 g). Synthesis of TMAKC6PPC6. To a solution of BrC6PPC6 (1.20 g) in N,N-dimethylacetamide (27 mL) was added trimethylamine (3.8 mL of a 33 wt. % solution in ethanol) and the solution was allowed to stir at room temperature for 18 h. The solution was filtered through a syringe filter onto a square glass casting plate with 5.0 inch sides. The dish was held in a vacuum oven at room temperature for 4 h and then at 50 oC for 18 h. The resulting membrane was then immersed in 0.5 M HBr for 2 hours and then in deionized water for at least 24 hours to yield a TMAC6PPC6 membrane in its bromide counter-ion form. Discussion The new ionomer is an extension of the work described in chapter 3. The new polymer backbone is no longer a pure poly(phenylene), but is instead a poly(phenylene alkylene) because one of the phenyl rings in the backbone of TMAC6PP has been replaced with a flexible hexamethylene unit. Figure 4-2 shows the synthetic steps required to prepare the new ionomer, TMAC6PPC6. The key difference between the synthesis of TMAC6PP and TMAC6PPC6 is the

50
replacement of the monomer 1,4-diethynylbenzene with 1,9-decadiyne in the very first step. Note that the 1,9-decadiyne is responsible for the new alkylene portion of the backbone and that a wide variety of diynes could be used to change the backbone and thus the membrane properties.
Figure 4-2 Synthetic scheme for the preparation of TMAC6PPC6. As described in chapter 3, the side chains on the current invention can contain a wide variety of functional groups which would allow the design polymers and membranes with a range of properties. The example given in figure 2 is the attachment of flexible hydrocarbon side chains with a halide atom (bromine) at the terminal carbon atom. That halide atom can be displaced by a variety of tertiary amines or amine-containing heterocyclic molecules to produce polymers with tethered cations which can be used as AEMs. The side chains are attached using a Friedel-Crafts acylation reaction. Since none of the aryl rings in DAPPC6 are deactivated, the acylation reaction could take place anywhere on DAPPC6. The peripheral phenyl rings are the most accessible and therefore the most likely points of attachment. Only one acylation reaction can occur per ring because the resulting ketone deactivates the ring. The number of sidechains is controlled by the amount of acylating reagent used, so polymers with varying degrees of functionalization can be prepared. Figure 4-3 shows hydroxide conductivity and water uptake data versus ion exchange capacity (IEC) for ATMPP, TMAC6PP, and TMAC6PPC6. Samples of TMAC6PPC6 with two different IEC values have been prepared and the data indicates that their conductivities and water uptakes are very similar to those of the other AEMs that we have developed. Thus, TMAC6PPC6 could be used as a membrane as well as an ionomer although the increased permeability of fuel through

51
TMAC6PPC6 would probably lead to high fuel crossover from the anode to the cathode (in the case of an AAEMFC) which would hurt the efficiency of the fuel cell. To prepare an MEA, TMAC6PPC6 can be dissolved in a variety of solvents (usually methanol). Note that TMAC6PPC6 is soluble in pure methanol but not in mixtures of water and methanol, so polymer dissolution would not be an issue in a methanol-fueled AAEMFC. The solution is then mixed with the catalyst and the resulting ink is then either sprayed or painted onto either the membrane or the gas diffusion layer prior to assembling the fuel cell. MEA fabrication and testing is described in detail in chapter 6. ATMPP can also be dissolved and used as an ionomer but TMAC6PP will not dissolve in any solvent yet tried and thus cannot be used as an ionomer. TMAC6PPC6 has been designed as an ionomer to compliment TMAC6PP membranes. The similarity of the two structures should make them compatible and improve the quality of the interface between the membrane and the electrodes.
Figure 4-3 Hydroxide conductivity and water uptake values versus IEC.

52
References
1. Fujimoto, C. H.; Hickner, M. A.; Cornelius, C. J.; Loy, D. A. Macromolecules 2005, 38, 5010.

53
5. NON-PLATINUM CARBON SUPPORTED OXYGEN REDUCTION CATALYST INK EVALUATION BASED ON POLY(SULFONE) AND POLY(PHENYLENE)-DERIVED IONOMERS IN ALKALINE MEDIA
Michael H. Robson†, Kateryna Artyushkova†*, Wendy Patterson†, Plamen Atanassov†, and
Michael R. Hibbs‡
University of New Mexico Department of Chemical and Nuclear Engineering, 1 University of New Mexico, Albuquerque, NM 87131-0001.
‡Sandia national Laboratories, P.O. Box 5800, Mailstop 0888, Albuquerque, New Mexico 87185 Introduction The alkaline fuel cell (AFC) has certain advantages over its acidic counterpart; the polymer electrolyte membrane fuel cell (PEMFC). Among the most favorable attributes of AFCs is the ability to utilize any catalyst and the favorable thermodynamics of oxygen reduction [1]. Because of the high pH of the electrolyte, non-platinum group metal (non-PGM) catalysts are remarkably stable [2], in comparison to precious metal based catalysts. This avenue to circumvent the use of expensive precious metals makes the AFC very attractive and warrants further development. The alkaline system does bring added complexity and other challenges to the fore, specifically in reference to the liquid electrolyte. Carbon dioxide in the system forms carbonates in aqueous electrolyte due to the presence of potassium and sodium [3], and a liquid electrolyte is prone to leakage. The implementation of a solid-polymer electrolyte sidesteps the aforementioned penalties paid when using a liquid electrolyte [4] while preserving the pH dependent advantages afforded by the alkaline system. This anion exchange membrane fuel cell (AMFC) concept has trailed in development behind PEMFC, due, in no small part, to the ready supply of highly developed proton conducting ionomers and membranes. The industry standard, Nafion®, and other perfluoronated sulfonic acid polymers have been the focus of the fuel cell community [5-7], but no such commercially available benchmark ionomer exists for alkaline media. Advancement of the AMFC technology is dependent upon such an ionomer. The emphasis in AMFC development has centered on the two issues alluded to: non-PGM catalysts and improved ionomers. Cost is the common limiting factor with almost every aspect of fuel cell technology, and the cost of the catalytic material, especially the cathodic catalyst, is most prohibitive. Platinum is the catalyst of choice, but the precious metal status that it has equates to the high cost. Great efforts have been made to circumvent this problem by developing non-PGM catalysts [8-10], yet even the best are deficient in limiting current and experience higher voltage losses and overpotentials compared to platinum. However, this can be compensated for with more material for a fraction of the cost. Typically, these novel catalysts are carbon supported [11-12], which adds some new challenges and introduces another component into, an already complex, fuel cell system. The carbon is

54
conductive but introduces higher electrical resistance into the system [13]. This energy is lost as heat and can cause unwanted material expansion [14]. The carbon is bulky compared to many of the nanoscale self-supported precious metal catalysts, and this adds volume and decreases the amount of surface area available for catalysis on a mass basis. In spite of these shortcomings, non-PGM catalysts are still highly desirable due to cost constraints. The second research focus, the ionomer, has centered on the membrane. Until recently, most anion exchange membranes were made by cross-linking a functionalized polystyrene, which suffers from instability at high pH [15]. A variety of approaches to this problem have been tried by several groups, having synthesized poly(sulfone)s [16], poly(vinyl alcohol)s [17], and poly(ether-imide)s [18], where they were functionalized for anion conductivity in a postpolymerization reaction. This involves lengthy reaction times and toxic reactants, which in turn increases costs. Novel synthetic routes have been developed to circumvent this step via bromomethylation of the polymer before conversion to anionically conductive quaternary amine groups [19-20]. Both poly(sulfone) and poly(phenylene) based ionomers have been shown to be thermally and chemically stable, and blendable with other polymers to improve their mechanical properties when in membranous form [21]. Additionally, the membranes can be made to be thin enough as not to increase the resistance of the cell. Therefore, they are promising candidates to fill the niche for a standard alkaline membrane ionomer. Ionomers are also used as binders for the catalyst in the electrode [22]. Usually, the ionomer-catalyst complex is more robust in the face of diffusion currents than catalyst alone while maintaining porosity and permitting access to the surface area of the catalyst. Additionally, electrical conductivity within the matrix of the catalyst is an essential property, and the ionomer must have low resistance to electric current to allow the fuel cell to be efficient. The electrocatalytic electrodes are complex structures that require many processes to be balanced and to occur continuously during operation [23]. Each reaction in gas fed fuel cells requires a gas reactant, an aqueous reactant, and electrons. These three different phases must converge at the catalyst active site. Formation of this tri-phase boundary is facilitated by the ionomer. It is believed that in the alkaline system that the catalyst surface is populated by hydroxyl ions, which is the product of the cathodic reaction. The hydroxyl layer constitutes the inner-Helmholtz plane, and, therefore, the aqueous and gaseous reactants reside in the outer-Helmholtz plane. The ionomer populates the boundary of the two planes with gas and water, and then conducts the product away to the membrane, allowing a newly formed hydroxyl to replace the ions that have migrated to the membrane. Due to the nature of the AMFC design, and all other solid electrolyte fuel cells, it is essential that the electrode be in direct contact with the membrane [24]. Additionally, the complexity of an alkaline system favors symmetry of the materials contained within. Issues such as thermal expansion, corrosion, and conductivity between the materials are important for proper function of the cell. Hatanaka, et al [25] demonstrated that the interfacial resistance between the membrane and catalyst binder is higher when the ionomers are different. For this reason, in addition to only one catalyst for both the anode and cathode, it is preferential to have one ionomer as the binder and membrane constituent. Differences in local pH can give rise to

55
corrosion currents [26], and variation in thermal expansion at higher temperatures can lead to power loss. Described in this work is an electrochemical evaluation of quaternary amine functionalized poly(sulfone)s and poly(phenylene)s employed in the role of catalyst binder (Figure 5-1). Due to the nature of the experiment, an optimization procedure also emerges. Two representatives from the poly(sulfone) class (PS-A and PS-B), and two from the poly(phenylene) class (PP-D and PP-E) have been evaluated using a rotating ring disk electrode (RRDE). The interclass samples of ionomers vary in the degree of functionality (DOF) and, therefore, in their ion exchange capacity (IEC). Additionally, there is a range in the variability of the water uptake that they undergo as a percentage of weight, and in their ionic conductivity (Table 5-1 functionality of ionomers).
Figure 5-1 Repeat unit structure of the poly(sulfone)-derived ionomer (top) and the poly(phenylene)-derived ionomers (bottom), where R = CH3 or CH2N+(CH3)3Br-. The relationship between the ionomer and the catalyst is explored and evaluated on the basis of the ionomeric impact on catalysis of the oxygen reduction reaction (ORR). Herein, the ionomer-catalyst complex is modified with respect to the ratio of ionomer to catalyst (I:C), using a well described non-PGM catalyst from the same batch in all treatments. The effects of electrode loading, diffusion, and temperature on the complex are also evaluated in order to determine a path forward for an improved anion exchange ionomer to serve as the benchmark for alkaline systems. Due to the absence of such an ionomer, the two poly(sulfone)s and the two poly(phenylene)s were evaluated alongside Nafion®, which was subjected to the same variables.

56
Due to the emphasis on non-PGM catalysts in AMFC systems, all experiments were conducted using an iron and cyanamide derived carbon supported catalyst [27]. We have reported on large surface area, openly structured, active cyanamide-based electrocatalysts for oxygen reduction in both acid and alkaline media, which were created by a micro-emulsion process [28]. The carbon supported non-PGM catalyst is likely to be encountered for most systems, and therefore it is crucial that the support surface chemistry is taken into account. The nature of the interaction between the ionomer and the catalyst will be examined with careful attention to the functional properties of the different ionomers. Experimental Materials All reagents were purchased from commercial vendors and used without any further purification. The hydrochloric acid (37%, ACS grade, diluted to 0.01 N), sulfuric acid (95% ACS grade, diluted to 2.0 M), potassium hydroxide (ACS grade), and sucrose (ACS grade) were purchased from EMD Chemicals, gmbh (Darmstadt, Germany). Acetone (production grade) was purchased from VWR International (West Chester, PA). Cyanmamide (>98% pure) was purchased from Alfa Aesar (Ward Hill, MA). Iron(II) sulfate heptahydride (>99%, ACS grade), 2-Propanol (>99.99%), tetraethylorthosilicate (TEOS, Purum >98%), hexadecane (99%), and cetyltrimethylammonium bromide (CTAB, >99%) was purchased from Sigma-Aldrich (St. Louis, MO). Ethanol (99.7%) was purchased from Koptec (King of Prussia, PA). Polyether-polysiloxane/dimethicone copolyol surfactant (ABIL EM 90) was purchased from Evonik, gmbh (Essen, Germany). Nafion® (1100EW, 5%) is a product of DuPont, and was acquired from Solution Technology, Inc (Mendenhall, PA). Synthesis of mesoporous silica
The monodispersed mesoporous silica particles were fabricated using the method of Carroll et al [28], yielding a material with a surface area, determined by BET surface area analysis, to be on the order of 818.2622 m2/g. The aqueous phase of the precursor solution was prepared by dissolving CTAB (1.82 g) in diH2O (20 g), stirring rapidly at 40 C until the solution cleared. The solution was then cooled to room temperature and TEOS (5.2 g) and 1 N HCl (0.57) was added and stirred for 30 min. The pH was then adjusted to 2.0. Preparation of the oil phase began by first dissolving ABIL EM90 in hexadecane at 3% by weight. The two phases were then blended together and shaken vigorously before being transferred to a 1000 mL round-bottom flask where it was heated to 80 C for 3 hrs and at 70 mTorr. The solution was centrifuged to separate the phases, and the oil phase was decanted off. The aqueous phase was placed in a Rotovap for 40 min, and then calcined in the air at 500 C for 5 hrs. Synthesis of iron-cyanamide derived catalyst
The non-platinum catalyst for oxygen reduction in alkaline media was a derivation of a material first prepared and described by Chung et al [27], whereby the precursor material was deposited onto mesoporous silica in lieu of carbon black as is described by Artyushkova et.al [28]. Deposition of the precursor material was performed via the dry-impregnation method of Pylyplenko et al [30] to deposit platinum particles onto similar silica material.

57
Synthesis began by dissolving sucrose (150.0 mg) (the carbon source), cyanamide (100 mg), and FeSO47H2O (100 mg) in acetone (1.8 mL) and 2 M sulfuric acid (0.9 mL). The solution was sonicated at 3 W for 2 min until all solids were dissolved, and more 2M H2SO4 is added drop wise until any remaining solids were dissolved. The solution was dropped in 100 μL aliquots onto the silica, folded in, stirred with a glass rod, and allowed to dry before the next deposition. The material was dried for 1 hr at 150C after the 14th addition (the halfway point) before the remainder of the precursor solution was deposited. After the final deposition, the material was allowed to dehydrate overnight in a vented oven at 150 C. The vessel was then scraped, and the material was ground to a fine powder with mortar and pestle, and placed in a ceramic boat. The material was pyrolyzed in a tube furnace under an ultra-high purity N2 atmosphere. The temperature was ramped up to 200 C at 3 C/min for 60 min before the temperature was increased to 850 C at 10 C/min for 4 hrs. The material was subsequently allowed to cool back to room temperature before it was reground to a fine powder using the mortar and pestle. To remove the silica template and to leach away excess metal, the material was placed in a Corning 50 mL centrifuge tube and etched for 24 hrs in HF buffer solution. It was then centrifuged, decanted, and rinsed a minimum of 4 times before being allowed to dry at 55 C overnight. It was then ground one final time to a fine powder. Table 5-1 Coefficients for the properties of each of the novel ionomers, which are degree
of functionality (DF), ion exchange capacity (IEC), water uptake or swelling, and ionic conductivity (Ω).
Sample DFa IEC (mequiv/g)
Water uptake (weight %)
Ω (mS/cm)
PS-A 1.26 2.01 224 54 PS-B 1.12 1.74 87 27 PP-D 2.28 2.03 76 41 PP-E 1.80 1.89 60 31
aDegree of functionalization equates to the average number of bromomethyl groups per monomer unit
Synthesis of trimethyl aminated poly(benzylmethyl sulfone) (ATMPS)
The poly(sulfone) based class of ionomer was synthesized in accordance to the methods of Yan and Hickner [31]. Two samples of ATMPS were made (PS-A and PS-B), which vary in degree of functionality, ion exchange capacity, water uptake percentage, and ion conductivity, and those values are listed in Table 5-1. Synthesis of trimethyl aminated poly(phenylene) (ATMPP)
The poly(sulfone) based class of ionomer was synthesized in accordance to the methods of Hibbs, Fujimoto, and Cornelius [19]. As with the ATMPS polymers, two samples were made (PP-D and PP-E), and their corresponding values for the same functional parameters are listed in Table 5-1.

58
Ink Preparation
Each experimental ionomer solution was prepared in three dilutions: 1%, 0.5%, and 0.1% by weight. The dilution was performed by adding a portion of the stock solution to an 80%-20% mixture of diH2O to isopropyl alcohol (80:20) in the appropriate proportions to make the aforementioned solutions for each of the four new ionomers and Nafion. In a 1.6 mL microfuge tube, a 10 mg/mL ink was made by starting with a known mass of catalyst, mcatalyst (in mg), and then performing the following calculations: (1) (2) (3) The volume of the catalyst is negligible; therefore we do not adjust the volume of the liquid to account for the volume of the catalyst. To prevent clumping of the catalyst and to establish artificially high local concentrations of ionomer directly on the catalyst, the 80:20 volume (3) was added to the tube, followed by the ionomer (2). The ink was then sonicated for 2 min at 3W with a probe tip sonicator before use for better dissolution of the particles. From the 10 mg/mL catalyst ink solution, inks of 5 mg/mL and 1 mg/mL were also made by transferring a portion of the 10 mg/mL ink solution into 80:20 in appropriate ratios to make the dilutions. They were then sonicated under like conditions as above. Electrochemical analysis All electrochemical experiments were performed using a Pine Instrument Company (Grove City, PA) CPB Bipotentiostat System, rotor, glassy carbon rotating ring disk electrode, and PineChem 2.8 software. The temperature of the cell was regulated with a Thermo heater. A Hg/HgO reference electrode from Hach (Loveland, CO) was used in conjunction with a platinum wire counter electrode. The electrolyte used was 50 mL 1 M KOH, made by dissolving 28.05 g in a final volume of 500 mL of diH2O. Results and Discussion Effective electrode design requires a balance of the transport processes that drive the AMFC. At the core of this balancing act is the catalyst surface coverage by the ionomer. The rate of transport of reactants to the active site and removal of the product is dependent on this ratio, as well as the catalyst loading per unit area, diffusion rate of the reactants, and the temperature. All of these parameters influence the interaction of the reactants with the catalyst surface and, therefore, the reaction kinetics. Figure 5-2 shows the experimental matrix designed for this study, where 5 systems (Nafion ®, poly(sulfone)s (PS-A and PS-B), and poly(phenylene)s (PP-D and PP-E)) were investigated as a function of ionomer-catalyst ratio, electrode loading, and temperature at 5 rotation speed as described in the experimental section.

59
Figure 5-2 Experimental space. For each of the systems, 3 different ionomer to catalyst ratio, 3 different loadings, 3 different temperatures were tested at 5 different rotation speed. Dependence of the ionomer fraction to reaction kinetics
The role of the ionomer within the electrode is significant. It not only binds the catalytic material together and integrates it with the membrane, but it also plays an integral role in the kinetics of the ORR [32], as illustrated in Figure 5-3. The kinetic dependence on the mass ratio of ionomer to catalyst is examined here for Nafion®, poly(sulfone)s (PS-A and PS-B), and poly(phenylene)s (PP-D and PP-E). There exists an optimal Nafion content when constructing an oxygen reduction electrocatalytic electrode, which is 0.33619 for platinum on carbon catalysts in PEMFC cathodes as determined by Song, et al [33]. This ratio of ionomer to catalyst changes somewhat with each individual catalyst from 330 g of ionomer to 1 mg of catalyst and hence an optimization study is required to find it. It can reasonably be assumed that this paradigm will hold true for alkaline anion exchange polymers. To confirm this, variants of ionomer-catalyst complex were formed using each of the aforementioned ionomers, whereby the I:C was also varied. The I:C ranged from low (3%), to medium (15%), to high (30%) within catalyst loadings of 400 g/cm2. Again, the non-Nafion® ionomers are listed in Table 1 with their corresponding values for DF, IEC, water uptake, and conductivity.

60
Figure 5-3 Polarization curve of the oxygen reduction reaction with Nafion® (---) and without ionomer binder (--- For this work, Nafion® serves as the benchmark ionomer by which the catalyst performance will be evaluated in the presence of the 4 other ionomers, and it is, therefore, instructive to examine it alone. Figure 5-4 shows polarization curves and Figures 5-5 and Figure 5-6 show half-wave potential and limiting currents, respectively, as a function of catalyst loading for all 5 systems, i.e. Nafion®, PS-A, PS-B, PP-D and PP-E. Figure 5-4A shows polarization curves and ring current data for the ORR of the non-PGM catalyst at the three I:C ratios using Nafion® as the catalyst binder. Several trends emerge from the plots when the I:C ratio is adjusted from low to high. The half-wave potential becomes more positive, the magnitude of the limiting current increases, and H2O2 evolution is diminished. It is assumed that desorption of the H2O2 reduction intermediate species is inhibited by the increased presence of the ionomer [34], allowing for it to be completely reduced to H2O.

61
Figure 5-4 Polarization curves of the nonN- -A
- - - ---), 15% I:C (----), and 30% I:C (---). A.) plot Nafion® bound catalyst ORR curves, B.) bound with PS-A and PS-B, C.) PP-D and PP-E, and D.) plots of the best performing half-cell reactions with each of the 5 ionomers. All samples loaded as 400 ug/cm2, 1600 RPM, and 1 M KOH. Further evaluation of the data reveals that the number of electrons transferred in the process, i.e. the efficiency of the ionomer-catalyst complex, is affected by the I:C. Calculation of efficiency accounts for the peroxide that desorbs from the surface that results in incomplete reduction of oxygen, yielding only 2 electrons of the possible 4. The ring current was corrected for collection

62
efficiency (37%), and normalized to 1 cm2 in accordance to the disk current. The values for efficiency were calculated using the following equation from Jaouen, et al [35]:
(4)
where is the theoretical maximum of electrons available per catalytic event, in this case 4, and IDisk is the normalized disk current and IRing is the normalized ring current. Figure 4 reveals the trend to higher efficiency as the I:C is increased, which is intuitive because of the increased limiting current and the decreased peroxide evolution. It should be noted that the calculated efficiency at potentials higher than the half-wave potential, and certainly higher than the turn on voltage, are not suitable for discussion of catalyst kinetics due those potentials residing outside the normal operating range of a system that employs the catalyst.
Figure 5-5 Half-wave potentials of the non-PGM catalyst as a function of catalyst loading Figure 5
- -PGM catalyst as a function of catalys
-PGM catalyst as a function of catalysPGM catalyst as a function of catalys
-PGM catalyst as a function of catalyst loading PGM catalyst as a function of catalys
with Nafion®, B.) PS-A and PS-B, C.) PP-D and PP-E, and D.) all ionomers. The shade of gray in tiles A, B, and C indicates I:C ratio (3%, 15%, and 30%). Similar trends to that of Nafion® were observed as the I:C ratio was varied using ionomers PS-A and PS-B (Figure 5-4B). As the I:C ratio was adjusted from low to high, the half-wave potential shifted to higher potentials, the limiting current increased, peroxide desorption was suppressed and, therefore, the efficiency increased. Mass transport limitations are evident at the lowest I:C

63
for both PS-A and PS-B, and they become more pronounced as the I:C is increased (Figure 5-4B). The amount of peroxide that is able to desorb is greater in catalyst inks made with PS-A than inks made with PS-B, but the limiting current and the half-wave potentials are consistent between the two. PS-A has a higher IEC (8.6%), ionic conductivity (14.8%), and a much higher WU% (157.5%) than PS-B. The high WU% of PS-A is likely responsible for the increased desorption of the peroxide due to the high degree of swelling, whereby a less obstructed path from the catalyst surface to the bulk electrolyte is created. Although the improvement in the limiting current (Figure 5-6B), half-wave potential (Figure 5-5B), and transport (Figure 5-4B) that are observed with PS-A over PS-B are unappreciable, it can be attributed to the ability of the ionomer to bring aqueous reactant in the proximity to the active site and simultaneously conduct product away.
Figure 5-6 Limiting current as a function of catalysts loading for the non-PGM catalyst
- - - -with Nafion®, B.) PS-A and PS-B, C.) PP-D and PP-E, and D.) all ionomers. The poly(phenylene) ionomers, PP-D and PP-E, also exhibit similar trends to Nafion® and the poly(sulfone)s as the I:C increases (Figure 5-4C); more positive half-wave potentials (Figure 5-
A B
C D

64
5C), more limiting current (Figure 5-6C), less peroxide evolution, and slightly more obstruction to the transport of reactant and product (Figure 5-4C). Again, as an artifact of the suppression of peroxide evolution, the efficiency of the reaction improves with the amounting presence of ionomer per unit mass of catalyst. Directly comparing the two ionomers on the basis of functionality shows that ionomer PP-D has a 7.4% higher IEC, 26.6% higher WU%, and 32.3% higher conductivity, yet the ORR performance between the two tracks very closely to one another. The lack of distinguishability between the catalytic performance in the presence of the ionomers may be indicative of the fact that the two ionomers are actually quite similar in functionality to one another when compared to PS-A and PS-B, where their values of the aforementioned functionalities are very close to the median. On this basis, it is difficult to extrapolate any correlations on activity from this data, except to say that the poly(phenylene) complexed catalysts exhibit steep ohmic regions and somewhat plateaued mass transfer regions of their polarization curves. Although it cannot conclusively be stated that the ohmic resistance at the higher potentials is mitigated by the poly(phenylene)s, it is highly likely to be the scenario. Benchmarking the I:C ratios of the four ionomers on a class basis reveals more about the nature of the ionomers. When the collective performance data of PS-A and PS-B are juxtaposed to Nafion®, it is evident that poly(sulfone) derived polymers suffer from an intrinsic incompatibility with the carbon support of the non-PGM catalyst, whereas the perfluorinated polymer Nafion® does not (Figure 5-4D). The nature of this incompatibility is outside the scope of this work but should be acknowledged. The Nafion® complexed catalysts demonstrated superior performance in every aspect over the poly(sulfone) derived ionomers, especially in respect to half-wave potential and limiting current. The shortcomings of PS-A and PS-B are even more apparent when taken into consideration the fact that Nafion® has been designed for PEMFC operation and the poly(sulfone)s were explicitly designed for AFCs and AMFCs. By contrast, the poly(phenylene) complexed catalysts performed much more in line with the Nafion® complexed catalyst. Peroxide desorption was higher in PP-D and PP-E (Figure 5-4C), the half-wave potential was shifted lower (Figure 5-5C), and there was less current produced than with Nafion® (Figure 5-6C), but mass transport regime and ohmic region have similar profiles (Figure 5-4D). Effects of loading on catalyst performance.
Material loading onto the working electrode affects the half-wave potential, limiting current, and peroxide evolution non-linearly as the loading increases [9, 36]. In the presence of Nafion®, the half-wave potential moves higher (Figure 5-5A), where a greater shift is observed from 40 g/cm2 to 200 g/cm2 than from 200 g/cm2 to 400 g/cm2. A similar trend was observed over the same increments with respect to the limiting current as the loading increased (Figure 5-6A). Peroxide evolution decreases as the loading increases, which is directly attributable to the tortuous path through the thicker catalyst layer that the peroxide must take to make its way into the bulk electrolyte. For this same reason, current limitations due to mass transport issues increase with thicker catalyst layers.

65
It is expected that both the limiting current and the half-wave potential will increase in the previously described non-linear fashion for catalyst bound with poly(sulfone) derived ionomer. As the loading increases, an increase in the half-wave potential is observed, but the observed potentials tend to be lower for both PS-A and PS-B than for those of Nafion®. The magnitude of the limiting current increases, as predicted, as loading is raised from 40 g/cm2 to 200 g/cm2. However, the limiting current does not improve as more catalyst is loaded onto the electrode (Figure 5-6B). As the loading is increased from 200 g/cm2 to 400 g/cm2 the magnitude of the limiting current shows no improvement. This can be explained by the inability of the ionomer to allow the reactants to access the inner layers of the catalyst. The high degree of water swelling by both PS-A and PS-B suggest that H2O is not the limiting reagent, but most likely O2, the passage of which through pores in the electrode is impeded by the swollen polymer. This underscores the importance of controlling the polymer swelling since some swelling is required for ion conductivity while too much swelling can limit the transport of oxygen, especially at higher loadings. There is no indication that electrical conductivity is reduced in catalyst layers bound with poly(sulfone) derived ionomers. When the catalyst is complexed with the poly(phenylene) derived ionomers, the expected trends are once again observed. The half-wave potentials observed with both PP-D and PP-E were consistent with one another, increasing with higher loadings, and matched those of Nafion® complexed catalysts. To the same end, the limiting current magnitude increased. PP-D had a greater limiting current at low loading, but PP-E tended to yield more current at higher loadings, but the differences in both observations may fall within the bounds of error. The poly(phenylene) derived ionomers yielded much better performance characteristics than the poly(sulfone) derived ionomers at all loadings. The explanation for this most likely lies within the backbone structure of the ionomer and how it interacts with the surface of the catalyst. The aromatic hydrocarbon motif of the poly(phenylene) may better absorb to and wet the catalyst surface than the poly(sulfone). The lack of polar sulfone groups in the poly(phenylene) ionomers may also be more conducive to the formation of the tri-phase boundary, striking the proper balance of water (and the dissolved O2) to, and removal of product from the active site region. Temperature dependence of activity.
The effect of temperature on the rate of reduction of oxygen on iron [37] has been described, as well as its influence on Nafion® at the interface with platinum [38]. Corroborating the findings of these two works, our representative non-PGM catalyst complexed with Nafion® showed an increase in limiting current, but no appreciable loss in half-wave potential as the temperature was increased from 25 C, to 40 C, and finally to 55 C. However, peroxide evolution increased as the energy input allows the intermediate specie to desorb from the active site more readily. There appears to be no change in the properties of mass transport as the temperature is raised. The poly(sulfone) derived ionomer catalyst complexes both shifted to lower half-wave potentials as the temperature increased over the same temperature increments. Higher temperatures diminished the magnitude of the limiting current, in contrast to the Nafion® trials. The ability of peroxide to desorb also increased in the presence of PS-A and PS-B, which results in loss of efficiency of the catalyst to complete the 2x2 reaction pathway. Limitations to the transport of

66
reactant through the catalyst-ionomer matrix appear to be unaffected by the change in temperature as the polarization curves for that region show no steepening or plateauing. The mechanism of ORR on Non-PGM catalyst of this class of electrocatalysts follows a 2+2 electron mechanism, which is characterized by hydrogen peroxide generation as intermediate and involves two distinct sites (bifunctional mechanism). [39]. Such a mechanism places an additional requirement on the ionomer stability as the presence of hydrogen peroxide evolved in the cathodic reaction may play a destructive role. Mitigation of that undesired effect resides in the development of catalysts that are active in electrochemical hydrogen peroxide reduction and or heterogeneous disproportionation of the peroxide to yield molecular oxygen and water.[40] The breakdown of reaction kinetics that accompanies elevated temperatures is indicative of poor adsorption to the catalyst surface. The loss of wettability stemming from increased system energy is the result of the backbone structure of the ionomer. The poly(sulfone)s have a strong dipole, whereby it does not adsorb as strongly to the carbon support. There may also be some indication of less hydrolytic stability of poly(sulfone)s than previously reported [41, 42]. The poly(phenylene)s fared better in the face of rising temperatures than did the poly(sulfone)s. In every aspect of catalytic performance, both PP-D and PP-E trended similarly to Nafion®. There was a small negative shift in half-wave potential accompanying an increase in limiting current. Peroxide desorption increased, and reaction efficiency decreased but remained high. And as with Nafion®, no change in mass transport properties were observed with temperature change. The stability of the reaction kinetics is attributable to polymer structure. The strong adsorption of the ionomer to the carbon support maintains wetting of the catalyst at high temperatures. The poly(phenylene)s have a preponderance of benzene rings with almost no dipole, whereas every benzene ring within the poly(sulfone)s has a dipole. The smaller dipole of the poly(phenylene)s allows for better wettability of the carbon support. However, Nafion® has a very strong dipole, but it is much more flexible and, therefore, allows for better surface contact with the support, whereas the novel ionomers are much more rigid. The poly(phenylene)s were as robust over the narrow temperature range used as the Nafion® on account of the reaction kinetics of catalyst bound with the PP-D and PP-E.
Conclusion Electrochemical evaluation of the non-PGM catalyst bound with the featured alkaline ionomer classes over a range of conditions gives insight into how they behave, as well as provide information on how the varying functionalities enhance or inhibit the rate of oxygen reduction. Additionally, an optimization procedure, that is instructive for all carbon supported non-PGM catalyst inks using poly(sulfone)s or poly(phenylene)s, emerges from the data. As with Nafion®, the optimal I:C for both poly(sulfone)-derived and poly(phenylene)-derived ionomers resides at a value equal to or greater than 30%. The exact optimum may lie at some point outside than the range explored in this work, but other reports using Nafion® and Pt/C catalyst suggests that it is close to 30%. The highest I:C performed most favorably in all cases than the lower I:C ratios, regardless of loading or temperature.

67
The polymer backbone structure had more influence on facilitating favorable reaction kinetics than did I:C. The poly(sulfone)-derived ionomers, PS-A and PS-B, had a negative influence on the half-wave potential and the limiting current when compared to those of Nafion® and the poly(phenylene)s. They also exhibited more peroxide desorption and greater limitation in the mass transport regime. The poly(sulfone)s also stifled performance gain from increased electrode loading, with maximum current density being achieved at 200 g/cm2. This loss is likely due to the structure of the ionomer, which limits the amount of O2 that is able to reach the innermost actives sites of the catalyst layers due to lack of solubility. The poly(sulfone)s also suffer from poor performance characteristics at elevated temperatures with negative implications for half-wave potential, limiting current, and peroxide desorption. The high WU% of PS-A and PS-B, combined partial desorption of the ionomer, prove problematic for the catalyst to reduce oxygen efficiently. The poly(phenylene)-derived polymers performed much more favorably and more in line with the benchmark ionomer, Nafion®. The catalyst showed no significant loss in voltage of the half-wave potential with either PP-D or PP-E. The magnitude of the limiting current was smaller than with Nafion® but close to it and much greater than what was observed using poly(sulfone)-derived ionomers. Desorption of the peroxide intermediate was higher than the benchmark, and mass transport limitations were also observed, but they are not appreciably worse than Nafion®. Because of their largely non-polar, aromatic structure, the poly(phenylene)s appear to wet the surface of the carbon-supported catalyst better than the poly(sulfone)s. In addition to conducting product away from the active sites, the poly(phenylene)s solvate O2 and H2O in sufficient quantities such that the maximum oxygen reduction kinetics for the catalyst is realized. The low WU% of the poly(phenylene)-derived ionomers may be a primary determining factor in the rate of reaction. A head to head comparison of the four ionomers illustrates a correlation between the WU% and the magnitude of the limiting current with the ring current taken into account. PS-A has over 400% higher water swelling than PP-E, resulting in less current density and more peroxide desorption, which equates to very poor efficiency. The poly(phenylene)-derived ionomers show promise as fruitful line of research in establishing an anion conducting ionomer for alkaline electrolyte fuel cells. Both PP-D and PP-E complexed catalysts performed favorably over a range of loadings and temperatures at all I:C ratios. Although the Nafion® benchmark outperformed the poly(phenylene)-derived ionomers, there is reason to assume that significant improvements can be made to this new class of ionomer. It should also be noted that Nafion® has the benefit of almost 50 years of intensive engineering and research focus while benzyltrimethylammonium poly(phenylene) is a much newer development. References
1. Damjanovic, A, and V Brusic. "Electrode kinetics of oxygen reduction on oxide-free platinum electrodes." Electrochemical Acta 12, no. 6 (1967): 615-628.
2. Varcoe, John R, Robert C. T. Slade, Graham L Wright, and Yanling Chen. "Steady-State dc and Impedance Investigations of H2/O2 Alkaline Membrane Fuel Cells with

68
Commercial Pt/C, Ag/C, and Au/C Cathodes." The Journal of Physicial Chemistry B 110, no. 42 (2006): 21041-21049.
3. Wang, Yang, Li Li, Lin Zhuang, Juntao Lu, and Boqing Xu. "A feasibility analysis for alkaline membrane direct methanol fuel cell: thermodynamic disadvantages versus kinetic advantages." Electrochemistry Communications 5, no. 8 (2003): 662-666.
4. Varcoe, John R, and Robert CT Slade. "Prospects for Alkaline Anion-Exchange Membranes in Low Temperature Fuel Cells." Fuel Cells 5, no. 2 (2005): 187-200.
5. Connolly, Donald James, and William Franklin-Gresham. Fluorocarbon Vinyl Ether Polymers. United States Patent 3282875. November 1, 1966.
6. Yeo, R S, and J McBreen. "Transport Properties of Nafion Membranes in Electrochemically Regenerative Hydrogen/Halogen Cells." Journal of the Electrochemical Society 126, no. 10 (1979): 1682-1687.
7. Heitner-Wirguin, Carls. "Recent advances in perfluorinated ionomer membranes: structure, properties, and applications." Journal of Membrane Science 120, no. 1 (1996): 1-33.
8. Jasinski, Raymond. "A New Fuel Cell Cathode Catalyst." Nature 201 (1964): 1212-1213.
9. Jaouen, Fredric, et al. "Cross-Laboratory Experimental Study of Non-Noble-Metal Electrocatalysts for Oxygen Reduction Reaction." ACS Applied Material & Interfaces 1, no. 8 (2009): 1623-1639.
10. Pylyplenko, Svitlana, Sanjeev Mukerjee, Timothy Olson, and Plamen Atanassov. "Non-platinum oxygen reduction electrocatalysts based on pyrolyzed transition metal macrocycles." Electrochemical Acta 53 (2008): 7875–7883.
11. Gojkovic, S L, S Gupta, and R F Savinell. "Heat-treated iron(III) tetramethoxyphenyl porphyrin supported on high-area carbon as an electrocatalyst for oxygen reduction-I. Characterization of the electrocatalyst." Journal of the Electrochemical Society 145 (1998): 3493-3499.
12. Gouerec, P, and M Savy. "Oxygen reduction electrocatalysis: ageing of pyrolyzed cobalt macrocycles dispersed on an active carbon." Electrochemical Acta 44 (1999): 2653-2661.
13. Kinoshita, Kim. Carbon: Electrochemical and physicochemical properties. New York, New York: John Wiley & Sons, Inc., 1988.
14. Haile, Sossina M. "Fuel cell materials and components." Acta Materialia 51 (2003): 5981-6000.
15. Ottewill, R H, and J N Shaw. "Stability of monodisperse polystyrene latex dispersions of various sizes." Discussions of the Faraday Society 42 (1966): 154-163.
16. Hibbs, Michael R, Michael A Hickner, Todd M Alam, Sarah K McIntyre, Cy H Fujimoto, and Chris J Cornelius. "Transport Properties of Hydroxide and Proton Conducting Membranes." Chemistry of Materials 20, no. 7 (2008): 2566.
17. Xiong, Ying, Jun Fang, Qing Hua Zeng, and Lin Liu Qing. "Preparation and characterization of cross-linked quaternized poly(vinyl alcohol) membranes for anion exchange membrane fuel cells." Journal of Membrane Science 311, no. 1-2 (2008): 319-325.
18. Wang, Guigui, Yiming Weng, Chu Deryn, Dong Xie, and Rongrong Chen. "Preparation of alkaline anion exchange membranes based on functional poly(ether-
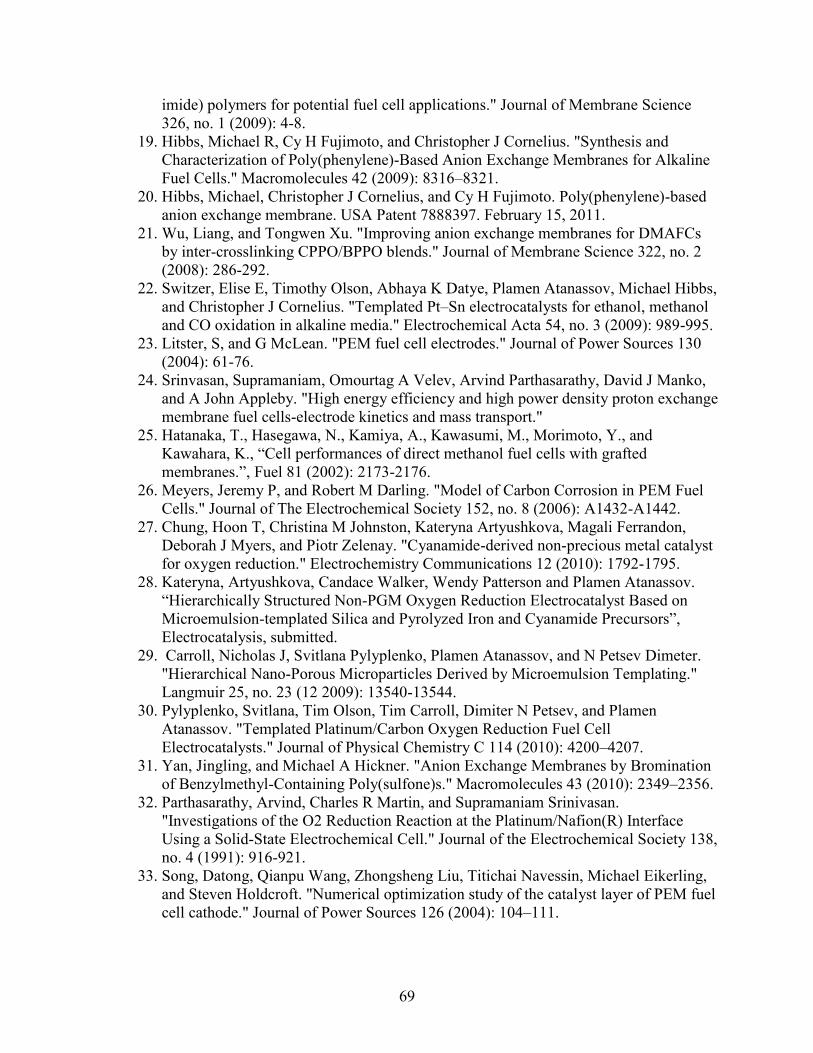
69
imide) polymers for potential fuel cell applications." Journal of Membrane Science 326, no. 1 (2009): 4-8.
19. Hibbs, Michael R, Cy H Fujimoto, and Christopher J Cornelius. "Synthesis and Characterization of Poly(phenylene)-Based Anion Exchange Membranes for Alkaline Fuel Cells." Macromolecules 42 (2009): 8316–8321.
20. Hibbs, Michael, Christopher J Cornelius, and Cy H Fujimoto. Poly(phenylene)-based anion exchange membrane. USA Patent 7888397. February 15, 2011.
21. Wu, Liang, and Tongwen Xu. "Improving anion exchange membranes for DMAFCs by inter-crosslinking CPPO/BPPO blends." Journal of Membrane Science 322, no. 2 (2008): 286-292.
22. Switzer, Elise E, Timothy Olson, Abhaya K Datye, Plamen Atanassov, Michael Hibbs, and Christopher J Cornelius. "Templated Pt–Sn electrocatalysts for ethanol, methanol and CO oxidation in alkaline media." Electrochemical Acta 54, no. 3 (2009): 989-995.
23. Litster, S, and G McLean. "PEM fuel cell electrodes." Journal of Power Sources 130 (2004): 61-76.
24. Srinvasan, Supramaniam, Omourtag A Velev, Arvind Parthasarathy, David J Manko, and A John Appleby. "High energy efficiency and high power density proton exchange membrane fuel cells-electrode kinetics and mass transport."
25. Hatanaka, T., Hasegawa, N., Kamiya, A., Kawasumi, M., Morimoto, Y., and Kawahara, K., “Cell performances of direct methanol fuel cells with grafted membranes.”, Fuel 81 (2002): 2173-2176.
26. Meyers, Jeremy P, and Robert M Darling. "Model of Carbon Corrosion in PEM Fuel Cells." Journal of The Electrochemical Society 152, no. 8 (2006): A1432-A1442.
27. Chung, Hoon T, Christina M Johnston, Kateryna Artyushkova, Magali Ferrandon, Deborah J Myers, and Piotr Zelenay. "Cyanamide-derived non-precious metal catalyst for oxygen reduction." Electrochemistry Communications 12 (2010): 1792-1795.
28. Kateryna, Artyushkova, Candace Walker, Wendy Patterson and Plamen Atanassov. “Hierarchically Structured Non-PGM Oxygen Reduction Electrocatalyst Based on Microemulsion-templated Silica and Pyrolyzed Iron and Cyanamide Precursors”, Electrocatalysis, submitted.
29. Carroll, Nicholas J, Svitlana Pylyplenko, Plamen Atanassov, and N Petsev Dimeter. "Hierarchical Nano-Porous Microparticles Derived by Microemulsion Templating." Langmuir 25, no. 23 (12 2009): 13540-13544.
30. Pylyplenko, Svitlana, Tim Olson, Tim Carroll, Dimiter N Petsev, and Plamen Atanassov. "Templated Platinum/Carbon Oxygen Reduction Fuel Cell Electrocatalysts." Journal of Physical Chemistry C 114 (2010): 4200–4207.
31. Yan, Jingling, and Michael A Hickner. "Anion Exchange Membranes by Bromination of Benzylmethyl-Containing Poly(sulfone)s." Macromolecules 43 (2010): 2349–2356.
32. Parthasarathy, Arvind, Charles R Martin, and Supramaniam Srinivasan. "Investigations of the O2 Reduction Reaction at the Platinum/Nafion(R) Interface Using a Solid-State Electrochemical Cell." Journal of the Electrochemical Society 138, no. 4 (1991): 916-921.
33. Song, Datong, Qianpu Wang, Zhongsheng Liu, Titichai Navessin, Michael Eikerling, and Steven Holdcroft. "Numerical optimization study of the catalyst layer of PEM fuel cell cathode." Journal of Power Sources 126 (2004): 104–111.

70
34. Ohma, Atsushi, Fushinobua Kazuyoshi, and Ken Okazaki. "Influence of Nafion® film on oxygen reduction reaction and hydrogen peroxide formation on Pt electrode for proton exchange membrane fuel cell." Electrochemical Acta 55, no. 28 (2010): 8829-8838.
35. Jaouen, F, Dodelet, J. P., “Average turn-over frequency of O2 electro-reduction for Fe/N/C and Co/N/C catalysts in PEFCs.” Electrochemical Acta 52, no. 19 (2007): 5975-5984.
36. Bonakdarpour, Arman, Michel Lefevre, Yang Ruizhi, Frederic Jaouen, Tara Dahn, and Jean-Pol Dodelet. "Impact of Loading in RRDE Experiments on Fe–N–C Catalysts: Two- or Four-Electron Oxygen Reduction?" Electrochemical and Solid-State Letters 11, no. 6 (2008): B105-B108.
37. Gojković, S Lj. "Oxygen reduction on iron. Part VII. Temperature dependence of oxygen reduction on passivated iron in alkaline solutions." Journal of electroanalytical chemistry 399, no. 1-2 (1995): 127.
38. Parthasarathy, Arvind, Srinivasan Supramaniam, and John Appleby. "Temperature dependence of the electrode kinetics of oxygen reduction at the platinum/Nafion interface-a microelectrode investigation." Journal of the Electrochemical Society 139, no. 9 (1992): 2530-2537.
39. Olson, Timothy, Svitlana Pylyplenko, Plamen Atanassov, Koichiro Asazawa, Koji Yamada, and Hirohisa Tanaka. "Anion-Exchange Membrane Fuel Cells: Dual-Site Mechanism of Oxygen Reduction Reaction in Alkaline Media on Cobalt-Polypyrrole Electrocatalysts." Journal of Physical Chemistry C 114 (2010): 5049–5059.
40. M.H. Robson, A. Serov, K. Artyushkova and P. Atanassov, A Mechanistic Study of 4-Aminoantipyrine and Iron Derived Non-Platinum Group Metal Catalyst on the Oxygen Reduction Reaction, Electrochimica Acta, 90 (2013) 656–665.
41. Zschocke, P, and D Quellmalz. "Novel ion exchange membranes based on an aromatic polyethersulfone." Journal of Membrane Science 22, no. 2-3 (1985): 325-332.
42. C. Fujimoto, D.-S. Kim, M. Hibbs, D. Wrobleski, Y. S. Kim, J. Memb. Sci., 423-424, 438 (2012).

71
6. DIRECT METHANOL ALKALINE FUEL CELLS WITH
POLYPHENYLENE BASED ANION EXCHANGE MEMBRANES
Rajeswari Janarthanan,a Michael R. Hibbs,b and Andrew M. Herring.a
aDepartment of Chemical and Biological Engineering, Colorado School of Mines, Golden, CO 80401, USA
bMaterials, Devices, & Energy Technologies Sandia National Laboratories, Albuquerque, NM, USA
Introduction Direct methanol fuel cells have received considerable attention over the hydrogen fuel cells due to their system simplicity, high energy density, easy fuel storage and supply[1, 2]. In particular, direct methanol alkaline fuel cells (DMAFCs) which employ an anion exchange membrane (AEM) electrolyte are more attractive as they provide improved electrode kinetics, simple water management, low methanol permeability and use of non- platinum metal catalysts[3-6]. Solid state AEM electrolytes are more attractive than the conventional liquid KOH electrolytes as the formation of carbonates and bicarbonates can be minimized to large extent in solid AEMs [7, 8]. In spite of these advantages, it is important to note that except few reports, high performance in DMAFCs are achieved only in the presence of liquid electrolyte even for commercially available AEMs[9, 10]. In general, alkaline DMFC studies employ commercially available AEMs, such as Tokuyama A-006, A-010, Fumatech FAA-2 and Morgane ADP from Solvay[9-16]. Still great amount of research is being focused on improving the performance of present commercial AEMs as well as on development of new AEMs to get stable, highly conducting and mechanically robust membranes to achieve fuel cells with high performance and long durability. Radiation grafted membranes were demonstrated to be promising AEMs for DMAFCs with a KOH free methanol fuel [17, 18]. It is very crucial to fabricate stable AEMs to achieve long term stability in hydroxide environment [19]. The most commonly reported cationic head group used in AEMs, the benzyl trimethylammonium (BTMA) cation based membrane has been shown to have good stability[20]. It has been demonstrated that improved stability can be achieved when the quaternary ammonium group is attached to the polymer backbone via an alkylene spacer with at least four carbon atoms [21-23]. In this work, we aim to study the DMAFC performances of two AEMs, ATMPP and TMAC6PP developed at Sandia National Laboratories. Both membranes are based on a poly(phenylene) backbone but one of them, ATMPP contains BTMA cations and the other one, TMAC6PP, has hexamethylene spacers ( Figure 6-1). One of the authors has described the preparation and properties of ATMPP and TMAC6PP membranes in previous reports [24, 25]. Both AEMs showed little or no decrease in their conductivity and IEC values even after 14 days under highly alkaline conditions at elevated temperature. The authors’ previous work was focused on the study of ATMPP based on polyphenylene backbones to understand the transport properties[26]. Low water uptake, water content and high ion conductivities up to 86 mS/cm at 90 C for the ATMPP membrane

72
demonstrated its promising application in fuel cells. A summary of the properties of the membrane used in the present study is available in Error! Reference source not found.. In addition to the AEM, a cationic polymer is also required in the electrodes to facilitate transport and immobilize the catalyst. Often the ionomer used in the electrodes is the same polymer that comprises the membrane. This is not always the best solution however, since the transport requirements in these two components can be quite different. In a previous study, a fluorinated polymer with guanidinium cations attached was found to be a very effective ionomer when paired with hydrocarbon ATMPP
Table 6-1 Properties of AEMs and Ionomers. AEM/Ionomer Measured IEC
(meq/g) 1H NMR Cl- Conductivity (mS/cm)a
Water Uptake (%)b
ATMPP 2.43 18.0 117 TMAC6PP 2.42 17.4 121 TMAC6PPC6I 2.13 16.1 121 TMAC6PPC6h 2.60 18.3 190 aConductivity of polymer film without catalyst bHydroxide form membranes. For the present study, a hydrocarbon ionomer, TMAC6PPC6, was prepared to be used with TMAC6PP membranes. TMAC6PPC6 is a poly (phenylene alkylene) with quarternary ammonium cations attached by hexamethylene sidechains. As with TMAC6PP, the IEC of TMAC6PPC6 can be varied by changing the number of sidechains per repeat unit. The structure of TMAC6PPC6 is shown in Figure 6-1 and its synthesis has been described. It is designed to be chemically compatible with TMAC6PP while allowing for greater transport of water and methanol within the electrodes. TMAC6PPC6 is soluble in low boiling alcohols and this helps to incorporate the ionomer in the catalyst ink. This work is a follow up of the authors’ previous work and we intend to study the fuel cell performance of the characterized AEMs for alkaline direct methanol fuel cell. The current work is focused on benchmarking the alkaline direct methanol fuel cell performance of the ATMPP and TMAC6PP membranes with platinum catalyst.
Figure 6-1. Structure of polymers used in membranes and electrodes.

73
Experimental Membrane Electrode Assembly Error! Reference source not found. gives the details of MEAs studied in this work. We used latinum catalysts from two commercial sources, 20% Pt/C, Etek and 50% Pt on high surface area carbon, TEC10E50E from Tanaka. Gas diffusion layers, GDLs from two different sources, GDL LT 1400-W, E-tek carbon cloth and carbon fiber fabric
Table 6-2 Details of MEAs. MEA Anode
Catalyst Anode GDL
Anode Ionomer
Cathode Catalyst
Cathode GDL
Cathode Ionomer
AEM
MEA-1
Pt/C, Tanaka
Zoltek TMAC6PPC6h Pt/C, Tanaka
Etek TMAC6PPC6I TMAC6PP
MEA-2
Pt/C, Tanaka
Etek TMAC6PPC6h Pt/C, Tanaka
Etek TMAC6PPC6I TMAC6PP
MEA-3
Pt/C, Tanaka
Etek ATMPP Pt/C, Tanaka
Etek ATMPP ATMPP
MEA-4
Pt/C, Etek
Etek ATMPP Pt/C, Etek
Etek ATMPP ATMPP
(Carbonized woven fabric, Panex 30, Zoltek) are used. MEA-1 and 2 are based on TMAC6PP membrane with TMAC6PPC6 ionomers but differ in the anode GDLs, keeping all other components identical. MEA-3 and 4 are based on ATMPP membrane with ATMPP ionomer and with identical GDLs on both electrodes but they contain different catalysts. In general, catalyst inks were made by mixing 50% Pt/C (TEC10E50E, Tanaka Kikinzoku Kogyo) or 20% Pt/Vulcan XC72R (Etek), Millipore water, isopropanol and ATMPP or TMAC6PP ionomer (3% solution in methanol) with a catalyst to ionomer ratio of 4:1. Ionomer solution was obtained by dissolving the polymer films in methanol. Catalyst inks were painted on 5.48 cm2 gas diffusion layers to obtain a loading of 1.4 mg of Pt cm-2. The electrodes were hot pressed on ATMPP or TMAC6PP membranes using a digital combo multi- purpose press, DC14, Geo Knight & Co. Inc at 66 C and 80 psig for 90s. Prior to any tests, MEAs were soaked in 1M NaOH for 2h to convert the membrane from Br- form to OH- form. Following this, MEAs were subsequently soaked in water with frequent changes of water to ensure complete removal of NaOH and to obtain a neutral pH. For better understanding, the components of all four MEAs are listed in Table 6-2. Fuel Cell Testing A single cell from fuel cell technologies, Inc with a working area of 5.48 cm2 and single serpentine flow fields was used. Stainless steel end plates were used to withstand the alkaline conditions. The effluent from the fuel cell reaches the back pressure regulators, followed by water trap which separates out any condensed liquid in the exit lines. An isocratic HPLC pump (Chromtech) was used to pump the methanol or methanol and KOH to the anode. Oxygen is fed to the cathode through a modular gas handling/gas metering system (Lynntech Industry, Inc.)

74
through a humidity bottle maintained at 80 C. The purge gas N2 and flow rate of oxygen was controlled using FC power software (Lynntech Industry, Inc.). A MSTAT4+ multi-potentiostat (Arbin Instruments) was used to conduct polarization experiments. The polarization curves were obtained by stepping down the potential from open circuit potential until the limiting current is achieved. In situ impedance spectra were measured potentiostatically at different potentials on the polarization curve using a Gamry Instruments. The frequencies were set between 100000 and 0.1 Hz with the data points being 10 per decade. The ac voltage was 10 mV root mean squared. The internal cell resistance that includes ohmic resistances from the membrane, electrode and their interfaces are measured from the high frequency x-axis intercepts [27]. The charge transfer resistances (Rct) have been calculated from the diameter of the semi-circular feature of the spectra. Results and Discussion In order to benchmark the two AEMs, we made four MEAs, two with TMAC6PP and two with ATMPP and investigated their methanol fuel cell performances. Details of the MEA components are given in Error! Reference source not found.. The polarization curves (I-V characteristics) nd the power density performances are shown in Figure 6-2. To overcome mass transport limitations and to enhance a facile transport of fuel and hydroxide ions, it is worth to employ a hydrophilic gas diffusion layer at the anode side. This is achieved
Figure 6-2. DMAFC performance curves for all four MEAs in 1M CH3OH at 80 C, 100 %RH by using a hydrophilic Zoltek carbon cloth in MEA-1. As expected, certainly there is an improvement in the OCV (20 mV), current and power densities for the hydrophilic Zoltek anode GDL containing MEA-1 as compared to MEA-2 with a hydrophobic anode GDL (Figure 6-2). From the curves, it can also be realized that the ATMPP based MEA-3 & 4 exhibit OCVs of 0.5 and 0.46V, which is lower than 0.56 and 0.54 V obtained for MEA-1 and 2 respectively. The curves also demonstrate slightly high OCV and power densities for the TMAC6PP MEA-2 when compared to ATMPP MEA-3, all other components being identical for these two MEAs (Error! eference source not found.). It can be observed that the OCV dropped to 0.46 V, giving rise to
00.511.522.533.544.5
0
0.1
0.2
0.3
0.4
0.5
0.6
0 5 10 15 20 25 30
Volta
ge (V
)
Current density (mA cm-2)

75
a decreased current and power densities for MEA-4 but here the catalyst used has only 20% Pt unlike 46% Pt in the Tanaka catalyst. In just methanol with no hydroxide ions in the fuel, the performances appear to be unaffected by the anode gas diffusion layers. There are very few alkaline direct methanol fuel cell reports where only methanol is used. With a poly(ethylene-co-tetrafluoroethylene) based AAEM of 51± 2 µm thickness, Varcoe et al., achieved a peak power density of 2.8 mW cm-2 and an OCV of 0.48V at 50 C in aqueous 2M methanol [17]. Their study also demonstrated an increasing OCV and decreasing peak power density when the thickness of the membrane was increased. At 50 C, with a 153 ± 4 µm AAEM, an OCV of 0.7 V and a peak
Table 6-3 MEA OCV (V) Current density at 0.1
V (mA/cm2)
Peak Power density (mW/cm2)
MEA-1 0.56 29.5 3.97 MEA-2 0.54 26.7 3.6 MEA-3 0.5 26.0 3.1 MEA-4 0.46 7.2 0.85 power density of 1.2 mW cm-2 were obtained. In another report by Varcoe et al., 1.17 mW cm-2 power density was yielded with a cross linked AEM at 50 C [28]. Our values are superior than the values (0.15 to 0.3 mW cm-2) obtained with a commercial Fumatech FAA-2 in different concentrations of methanol [12]. Our MEAs perform better than a QPVA/SiO2/GA membrane which obtained only 0.18 or 0.27 mW cm-2 in 2M methanol [29]. In general, AEMs show improved performance in the presence of hydroxide ions in the fuel even though it is not preferred as they form carbonates. Methanol oxidation requires stoichiometric amount (6 OH-) of hydroxide ions. In addition, the presence of hydroxide ions certainly improves the conductivity. We have chosen the high performing MEA-1 & 2 for the fuel cell performance studies in the presence of KOH. Figure 6-3 demonstrates the fuel cell performances of MEA-2 in the presence of an alkaline electrolyte as a function of methanol and KOH concentrations. We observed a significant difference in the performance when KOH is added to the fuel tank. Comparing the performance of 1M MeOH-1M KOH (Figure 6-3) to 1M MeOH (Figure 6-2) anode feed, the OCV increased from 0.54 V to 0.75 V with several

76
Figure 6-3. DMAFC performances as a function of the concentrations of methanol and KOH (: 1M-1M; : 1M-0.5M; : 2M-1M; :2M-2M; :1M-2M). folds increase in the current density in the presence of 1M KOH at 0.1 V. With a constant methanol concentration (1M) and different KOH concentrations (0.5M to 2M), the OCV remain unaltered showing difference in the current densities and power densities. From 0.5 to 1M, there was no difference in the performances up to 20 mA cm-2, but significant improvement was evident thereafter in the medium to high current density regions. This observation agrees with the fact that increased electrolyte concentration would increase ion conductivity. A further raise to 2M KOH in the fuel did not yield any better performance but the values were close to 1M KOH. Under these experimental conditions, for the current MEA-2, a further raise in the OH- concentration to 2M might have decreased the methanol concentration, leading to low performance. The peak power densities were 16.1, 25.0 and 24.2 mW cm-2 for 0.5, 1 and 2M KOH respectively. The current densities were 80, 125 and 117 mA cm-2 for 0.5, 1 and 2M KOH respectively. On the other hand, with 1M MeOH-1M KOH as the control, increasing fuel concentration to 2M methanol resulted in low performance. When compared to the control 1M MeOH-1M KOH, the current and power densities of 2M MeOH-1M KOH were 2 times reduced while the 2M MeOH-2M KOH showed 1.8 times less current and power densities. Loss in performance and reduced OCVs (0.68 and 0.62 for the 2M-1M and 2M-2M respectively) could be related to the relative methanol crossover at higher concentrations of methanol. Highest peak power and maximum current densities were observed for the fuel containing 1M MeOH-1M KOH with 25mW cm-2 and 125 mA cm-2 respectively (Error! Reference source not found.).
0
5
10
15
20
25
30
00.10.20.30.40.50.60.70.8
0 50 100 150
Pow
er d
ensi
ty (m
W/c
m2 )
Volta
ge (V
)
Current density (mA/cm2)

77
Table 6-4 100% RH.
We also investigated the effect of fuel and electrolyte concentrations on the performances for MEA-1 with a hydrophilic anode GDL (Figure 6-4). While there was only slight improvement in just methanol fuel for MEA-1 over MEA-2, in the presence of KOH considerably high performance was observed for MEA-1 compared to MEA-2 with a hydrophobic GDL (Error! eference source not found.). While there is no significant increase in OCV when KOH concentration was raised from 0.5 M to 1M, relatively better current and power densities
Figure 6-4. DMAFC performances of MEA-1 as a function of concentrations of methanol and KOH at 80 C, 100 %RH (: 1M-1M; : 1M-2M; : 1M -0.5M; : 2M-1M; : 2M-2M).
0
10
20
30
40
50
60
00.10.20.30.40.50.60.70.80.9
0 50 100 150 200 250
Pow
er d
ensi
ty (m
W/c
m2 )
Volta
ge (V
)
Current density (mA/cm2)
MeOH – KOH (concentration in M)
MEA-1 MEA-2
OCV (V)
Current density (mAcm-
2)
Peak Power Density (mWcm-
2)
OCV (V)
Current Density (mAcm-
2)
Peak Power Density (mWcm-
2)
1M – 0.5 M 0.81 190.3 45.5 0.75 80.8 16.1
1M – 1M 0.84 226 53.8 0.75 125.0 25.0
1M – 2M 0.76 212.9 50.4 0.75 117.8 24.2
2M – 1M 0.84 166.4 43.4 0.68 48.3 12.0
2M – 2M 0.74 100.3 20.0 0.62 68.1 13.6

78
were seen. The maximum current and peak power densities obtained in 1M KOH are 226 mA cm-2 and 53.8 mW cm-2, compared to 190.3 mA cm-2 and 45.5 mA cm-2 for a 0.5 M KOH. A further raise to 2M resulted in performance decline, with 80 mV loss in OCV, a maximum current density of 212.9 mAcm-2 and a peak power density of 50.4 mWcm-2 were achieved. As observed in MEA-2, increasing the methanol concentration to 2M resulted in poor performances with the lowest being 2M MeOH in 2M KOH. In the presence of KOH, the hydrophilic carbon cloth GDL (Zoltek) at the anode generated significant improvement in the performance. The best performances of MEA-1 and MEA-2 were observed in 1M MeOH-1M KOH with a two fold increase in power density for MEA-1. In the literature, it has been examined and demonstrated that hydrophobic cathode and hydrophilic anode enhances the performance. It was shown by Kim et al., that hydrophobicity decreases the methanol exposure to catalyst [30]. Similarly, in their study Suryaprakash et al., have shown that a hydrophilic anode GDL would enhance the diffusion of aqueous electrolyte and methanol and a hydrophobic cathode GDL would prevent flooding at the cathode [14]. Our results agree with this observation, MEA-1 with hydrophilic Zoltek GDL at the anode and hydrophobic Etek GDL at the cathode performs better than MEA-2 with both sides hydrophobic GDLs. In the presence of hydroxide ions in the methanol, DMAFC performances of the membranes, ATMPP and TMAC6PP are superior when compared to some commercial membranes as well as on other AEMs [9, 11, 13, 16, 29, 31]. As expected from their previous studies, the current AEMS, ATMPP and TMAC6PP are shown to be promising candidates for alkaline fuel cell application. Figure 6-5 presents the durability of MEA-2 in 1M MeOH-1M KOH at an applied current density of 35 mA/cm2 at 80 C. The voltage dropped over time, the voltage lost after 67 h was ~ 30 mV from an initial voltage of 0.4 V. When stopped at 36h and started again, the voltage recovered back to 0.4 V but again voltage degradation was observed with an overall degradation rate of 0.4 mV h-1. This preliminary work for a short durability time and fast degradation is still encouraging as the voltage did not degrade rapidly to zero and we are continuing our work to achieve a more durable fuel cell. In their work, Varcoe et al., demonstrated a degradation rate of 95 ± 10 µV h-1, i.e. ~ 0.1 mV h-1 for a 233h ADMFC test with a cross-linked AEM in a KOH free fuel at 50 C.

79
Figure 6-5. Durability test for MEA-2 in 1M Methanol and 1M KOH at 80 C, 100 %RH for 70h. Nyquist plots of the fuel cell as a function of potential has been studied by electrochemical impedance spectra in situ under fuel cell conditions (Figure 6-6). Impedance spectra studied on MEA-1 in a KOH free methanol fuel at 80 C as a function of d. c potentials c.a. OCV, 0.3 V and 0.2 V could be seen from figure 6-6. At all potentials, one large semicircle was seen. The potential dependent semicircle tends to reach the x - axis as the cell potential is decreased down from open circuit voltage (OCV) to 0.2 V. Except the cell potential, all other components and conditions are same for all the plots. Hence, this can be contributed to the charge transfer resistance on the electrodes as a function of the cell potential. At the open circuit voltage, when no current is drawn, as anticipated the charge transfer resistance was at its maximum, 3.02 Ω cm-
2. When the cell potential was stepped down, due to increasing current density and decreasing overpotential, the charge transfer resistances decreased down from 3.02 Ω cm-2 at OCV to 0.85 Ω cm-2 at 0.2 V. The second aspect examined from all the spectra is the cell resistance at high frequency intercept; this is an indication of internal resistance of the fuel cell. Internal resistance is a sum of resistances from various fuel cell components. It was observed to be almost the same at all potentials (Error! Reference source not found.). This remained almost same at all otentials as expected owing to identical components in the fuel cell at all potentials.
0
0.1
0.2
0.3
0.4
0.5
0.6
0 10 20 30 40 50 60 70
Vo
ltag
e (
V)
Time (h)
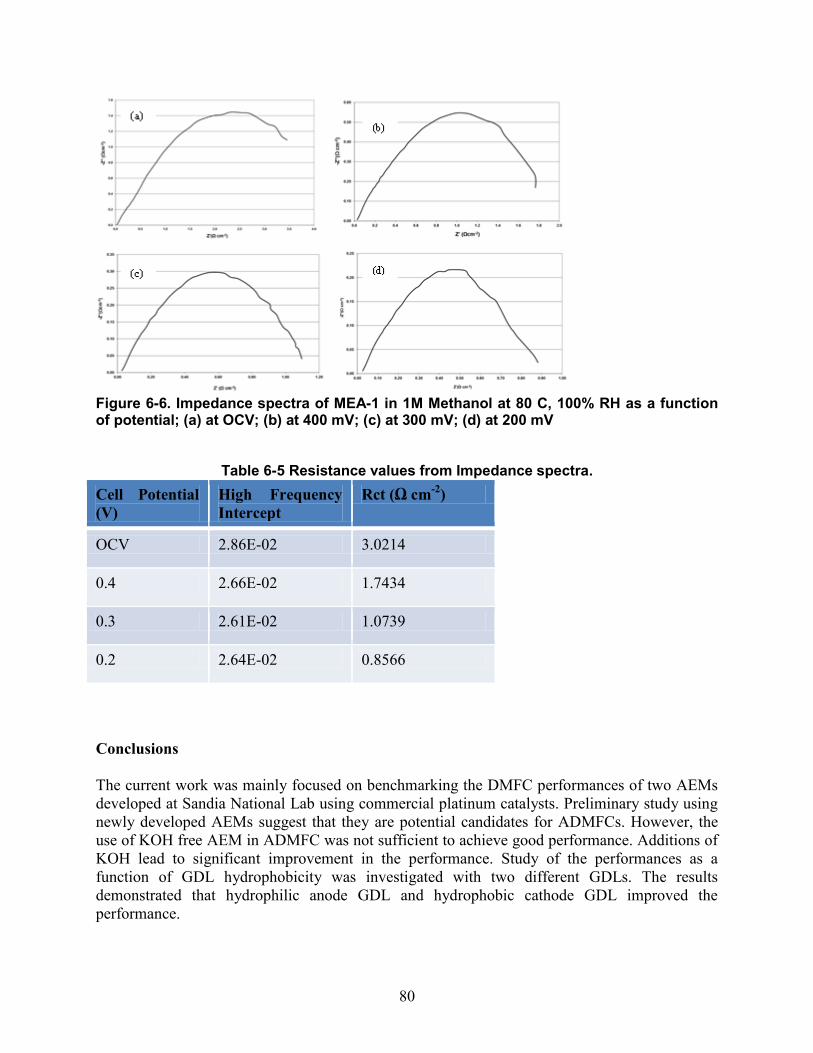
80
Figure 6-6. Impedance spectra of MEA-1 in 1M Methanol at 80 C, 100% RH as a function of potential; (a) at OCV; (b) at 400 mV; (c) at 300 mV; (d) at 200 mV
Table 6-5 Resistance values from Impedance spectra. Cell Potential (V)
High Frequency Intercept
Rct (Ω cm-2)
OCV 2.86E-02 3.0214
0.4 2.66E-02 1.7434
0.3 2.61E-02 1.0739
0.2 2.64E-02 0.8566
Conclusions The current work was mainly focused on benchmarking the DMFC performances of two AEMs developed at Sandia National Lab using commercial platinum catalysts. Preliminary study using newly developed AEMs suggest that they are potential candidates for ADMFCs. However, the use of KOH free AEM in ADMFC was not sufficient to achieve good performance. Additions of KOH lead to significant improvement in the performance. Study of the performances as a function of GDL hydrophobicity was investigated with two different GDLs. The results demonstrated that hydrophilic anode GDL and hydrophobic cathode GDL improved the performance.

81
References 1. A.S. Arico, S. Srinivasan, V. Antonucci, Fuel Cells 1 (2001) 133-161. 2. K.M. McGrath, G.K.S. Prakash, G.A. Olah, J Ind Eng Chem 10 (2004) 1063-1080. 3. E.H. Yu, U. Krewer, K. Scott, Energies 3 (2010) 1499-1528. 4. E.H. Yu, X. Wang, U. Krewer, L. Li, K. Scott, Energ Environ Sci 5 (2012) 5668-5680. 5. E. Antolini, E.R. Gonzalez, Journal of Power Sources 195 (2010) 3431-3450. 6. J.S. Spendelow, A. Wieckowski, Physical Chemistry Chemical Physics 9 (2007) 2654- 2675. 7. J.R. Varcoe, R.C.T. Slade, Fuel Cells 5 (2005) 187-200. 8. G. Merle, M. Wessling, K. Nijmeijer, J Membrane Sci 377 (2011) 1-35. 9. E.H. Yu, K. Scott, Journal of Power Sources 137 (2004) 248-256. 10. V. Bambagioni, C. Bianchini, A. Marchionni, J. Filippi, F. Vizza, J. Teddy, P. Serp, M. Zhiani, Journal of Power Sources 190 (2009) 241-251. 11. E.H. Yu, K. Scott, Electrochemistry Communications 6 (2004) 361-365. 12. A. Santasalo-Aarnio, S. Hietala, T. Rauhala, T. Kallio, Journal of Power Sources 196 (2011) 6153-6159. 13. J.-H. Kim, H.-K. Kim, K.-T. Hwang, J.-Y. Lee, International Journal of Hydrogen Energy 35 (2010) 768-773. 14. G.K.S. Prakash, F.C. Krause, F.A. Viva, S.R. Narayanan, G.A. Olah, Journal of Power Sources 196 (2011) 7967-7972. 15. E.H. Yu, K. Scott, J Appl Electrochem 35 (2005) 91-96. 16. J. Kim, T. Momma, T. Osaka, Journal of Power Sources 189 (2009) 999-1002. 17. J.R. Varcoe, R.C.T. Slade, E. Lam How Yee, S.D. Poynton, D.J. Driscoll, D.C. Apperley, Chemistry of Materials 19 (2007) 2686-2693. 18. J.R. Varcoe, R.C.T. Slade, Electrochemistry Communications 8 (2006) 839-843. 19. S. Chempath, B.R. Einsla, L.R. Pratt, C.S. Macomber, J.M. Boncella, J.A. Rau, B.S. Pivovar, The Journal of Physical Chemistry C 112 (2008) 3179-3182. 20. J.R. Varcoe, R.C.T. Slade, E. Lam How Yee, Chem Commun (2006) 1428-1429. 21. Q. Zhang, S. Li, S. Zhang, Chem Commun 46 (2010) 7495-7497. 22. B. Lin, L. Qiu, B. Qiu, Y. Peng, F. Yan, Macromolecules 44 (2011) 9642-9649. 23. M. Tomoi, K. Yamaguchi, R. Ando, Y. Kantake, Y. Aosaki, H. Kubota, J Appl Polym Sci 64 (1997) 1161-1167. 24. M.R. Hibbs, Journal of Polymer Science Part B: Polymer Physics (2012) n/a-n/a. 25. M.R. Hibbs, C.H. Fujimoto, C.J. Cornelius, Macromolecules 42 (2009) 8316-8321. 26. R. Janarthanan, J.L. Horan, B.R. Caire, Z.C. Ziegler, Y. Yang, X. Zuo, M.W. Liberatore, M.R. Hibbs, A.M. Herring, Journal of Polymer Science Part B: Polymer Physics (2012) n/a-n/a. 27. C. Tamain, S.D. Poynton, R.C.T. Slade, B. Carroll, J.R. Varcoe, The Journal of Physical Chemistry C 111 (2007) 18423-18430. 28. J.R. Varcoe, R.C.T. Slade, E.L.H. Yee, S.D. Poynton, D.J. Driscoll, Journal of Power Sources 173 (2007) 194-199. 29. C.-C. Yang, S.-S. Chiu, S.-C. Kuo, T.-H. Liou, Journal of Power Sources 199 (2012) 37- 45. 30. H. Kim, J. Zhou, M. Ünlü, I. Anestis-Richard, K. Joseph, P.A. Kohl, Electrochimica Acta

82
56 (2011) 3085-3090. 31. H. Liu, S. Yang, S. Wang, J. Fang, L. Jiang, G. Sun, J Membrane Sci 369 (2011) 277- 283.

83
7. NON-PLATINUM CATHODE CATALYST FOR DIRECT METHANOL ALKALINE FUEL CELL
Rajeswari Janarthanan,a Michael R. Hibbs,b Plamen Atanassov,c and Andrew M. Herring.a
aDepartment of Chemical and Biological Engineering, Colorado School of Mines, Golden, CO 80401, USA
bMaterials, Devices, & Energy Technologies Sandia National Laboratories, Albuquerque, NM, USA
cDepartment of Chemical and Nuclear Engineering University of New Mexico, Albuquerque, NM 87131-0001.
Introduction High cost, CO poisoning, slow cathode reaction kinetics of platinum catalyst lead to the search of alternate catalysts and the development of non-platinum catalysts which can overcome these problems to a greater extent. A non-platinum cathode catalyst can remain methanol tolerant and hence would reduce the voltage loss due to mixed potentials that is seen while methanol cross-over to the cathode. Attempts are focused on the development of non-Pt catalysts with high performance and long durability. In the current work, we studied the alkaline direct methanol fuel cell using non-Pt cathode catalysts developed at University of New Mexico, USA and anion exchange membranes developed at Sandia National Laboratories, USA. The non-Pt cathode catalysts are based on iron. Both membranes are based on a poly (phenylene) backbone but one of them, ATMPP contains BTMA cations and the other one, TMAC6PP, has hexamethylene spacers. Experimental Platinum catalysts from two different sources, 20% Pt/C from Etek and 46% Pt/C from Tanaka, TKK were used as anode catalysts in all four MEAs in Table 7-1. MEA-2 and MEA-4 are control MEAs with both sides Platinum, whereas MEA-1 and MEA-2 have non-Pt cathode catalysts. Gas diffusion layers, GDLs from two different sources, GDL LT 1400-W, E-tek carbon cloth and carbon fiber fabric (Carbonized woven fabric, Panex 30, Zoltek) are used. In general, catalyst inks were made by mixing 50% Pt/C (TEC10E50E, Tanaka Kikinzoku Kogyo) or 20% Pt/Vulcan XC72R (Etek), Millipore water, isopropanol and ATMPP or TMAC6PPC6 ionomer (3% solution in methanol) with a catalyst to ionomer ratio of 4:1. Ionomer solution was obtained by dissolving polymer films in methanol. Catalyst inks were painted on 5.48 cm2 gas diffusion layers to obtain a loading of 1.4 mg of Pt cm-2 (MEA-1 and 2). The anode and cathode loadings for MEA-3 were 2.7 mg cm-2 and 5.5 mg cm-2 respectively. Both anode and cathode loadings were about 2.7 mg cm-2 for MEA-4. The electrodes were mechanically pressed in a fuel cell or hot pressed on ATMPP or TMAC6PP membranes using a digital combo multi- purpose press, DC14, Geo Knight & Co. Inc at 66 C and 80 psig for 90s. Prior to any tests, MEAs were soaked in 1M NaOH for 2h to convert the membrane from Br- form to OH- form. Following this,

84
MEAs were subsequently soaked in water with frequent changes of water to ensure complete removal of NaOH and to obtain a neutral pH.
Table 7-1 Materials used to fabricate MEAs. MEA Anode
Catalyst Anode GDL Cathode Cathode
GDL Ionomer for catalyst ink
AEM
MEA-1
20% Pt/C, Etek
Etek UNM G-1 Etek ATMPP ATMPP
MEA-2
20% Pt/C, Etek
Etek 20% Pt/C, Etek
Etek ATMPP ATMPP
MEA-3
46% Pt/C, TKK
Ztek UNM G-2 Etek TMAC6PPC6 TMAC6PP
MEA-4
46% Pt/C, TKK
Ztek 46% Pt/C, TKK
TMAC6PP TMAC6PPC6 ATMPP
Fuel Cell Testing A single cell from fuel cell technologies, Inc with a working area of 5.48 cm2 and single serpentine flow fields was used. Stainless steel end plates were used to withstand the alkaline conditions. The effluent from the fuel cell reaches the back pressure regulators, followed by water trap which separates out any condensed liquid in the exit lines. An isocratic HPLC pump (Chromtech) was used to pump the methanol or methanol and KOH to the anode. Oxygen is fed to the cathode through a modular gas handling/gas metering system (Lynntech Industry, Inc.) through a humidity bottle maintained at 80 C. The purge gas N2 and flow rate of oxygen was controlled using FC power software (Lynntech Industry, Inc.). A MSTAT4+ multi-potentiostat (Arbin Instruments) was used to conduct polarization experiments. The polarization curves were obtained by stepping down the potential from open circuit potential until the limiting current is achieved. Results and Discussion The direct methanol fuel cell data in 1M methanol for the non-Pt cathode catalyst is presented in Figure 7-1. This has been compared to a Platinum cathode catalyst (MEA-2, Table 7-1) using the same anode catalyst, ionomer and membrane. It is quite clear that the non-Pt cathode catalyst (MEA-1) performs better than the Pt cathode catalyst as seen from the open circuit potential, current and power densities. The peak power density of non-Pt cathode catalyst is more than three times its platinum counterpart with 240 mV higher open circuit potential. The maximum current density observed were 19.1 and 7.2 mAcm-2 for MEA-1 and MEA-2 respectively.

85
Figure 7-1. DMAFC performances of non-Pt cathode catalyst, MEA-1 (circles) against a Pt cathode catalyst (triangles) in 1M methanol at 80 C, 100% RH.
Figure 7-2. DMAFC performances of non-Pt cathode catalyst (MEA-1, circles) against a Pt cathode catalyst (MEA-2, triangles) in 1M methanol and 1M KOH at 80 C, 100% RH. Figure 7-2 demonstrates higher power and current densities for both MEAs in the presence of KOH indicating that the use of KOH increases the performance of cell significantly. Even with a 100 mV high open circuit potential, MEA-2 showed only 50.7 mA cm-2 current and 17.7 mW cm-2 power densities as compared to 150 mA cm-2 and 24.7 mW cm-2 for MEA-1 with a non-Pt cathode catalyst. We observe a limitation in MEA-2 beyond 0.35 V, whereas there is no limiting factor for the non-Pt cathode catalyst.
0
0.5
1
1.5
2
2.5
3
0
0.1
0.2
0.3
0.4
0.5
0.6
0.7
0.8
0 5 10 15 20 25
Po
we
r d
en
sity
(m
W c
m-2
)
Vo
ltag
e (
V)
Current density (mA cm-2)
0
5
10
15
20
25
30
0
0.1
0.2
0.3
0.4
0.5
0.6
0.7
0.8
0.9
1
0 20 40 60 80 100 120 140
Pow
er d
ensi
ty (
mW
cm
-2)
Volta
ge (V
)
Current density (mA cm-2)

86
Figure 7-3. DMAFC performances of non-Pt cathode catalyst (MEA-3, squares) against a Pt cathode catalyst (MEA-4, triangles) in 1M methanol at 80 C, 100% RH. Figure 7-3 presents the fuel cell performance of TMAC6PP membrane based MEAs with non-platinum based cathode catalyst and its control MEA with platinum catalyst. Unlike MEA-1 & 2 which showed higher performance for non-Pt cathode catalyst in 1M methanol, here we observed better performance from the platinum containing MEA. MEA-4 with both electrodes containing platinum catalysts exhibited 2.8 times more power density and 3 times more current density. The peak power and maximum current densities observed for the non-platinum catalysts were 1.4 mw cm-2 and 9.8 mA cm-2 respectively.
Figure 7-4. DMAFC performances of MEA-3 with UNM G-2 cathode catalyst as a function of fuel - electrolyte concentrations (- 1M-1M; -2M-1M; - 1M-2M; - 2M-2M; -5M-1M).
0
0.5
1
1.5
2
2.5
3
3.5
4
4.5
0
0.1
0.2
0.3
0.4
0.5
0.6
0.7
0.8
0 5 10 15 20 25 30
Pow
er d
ensi
ty (m
W c
m-2
)
Volta
ge (V
)
Current density (mA cm-2)
0
10
20
30
40
50
60
0
0.1
0.2
0.3
0.4
0.5
0.6
0.7
0.8
0.9
1
0 50 100 150 200 250
Pow
er d
ensi
ty (m
W c
m-2
)
Volta
ge (V
)
Current density (mA cm-2)
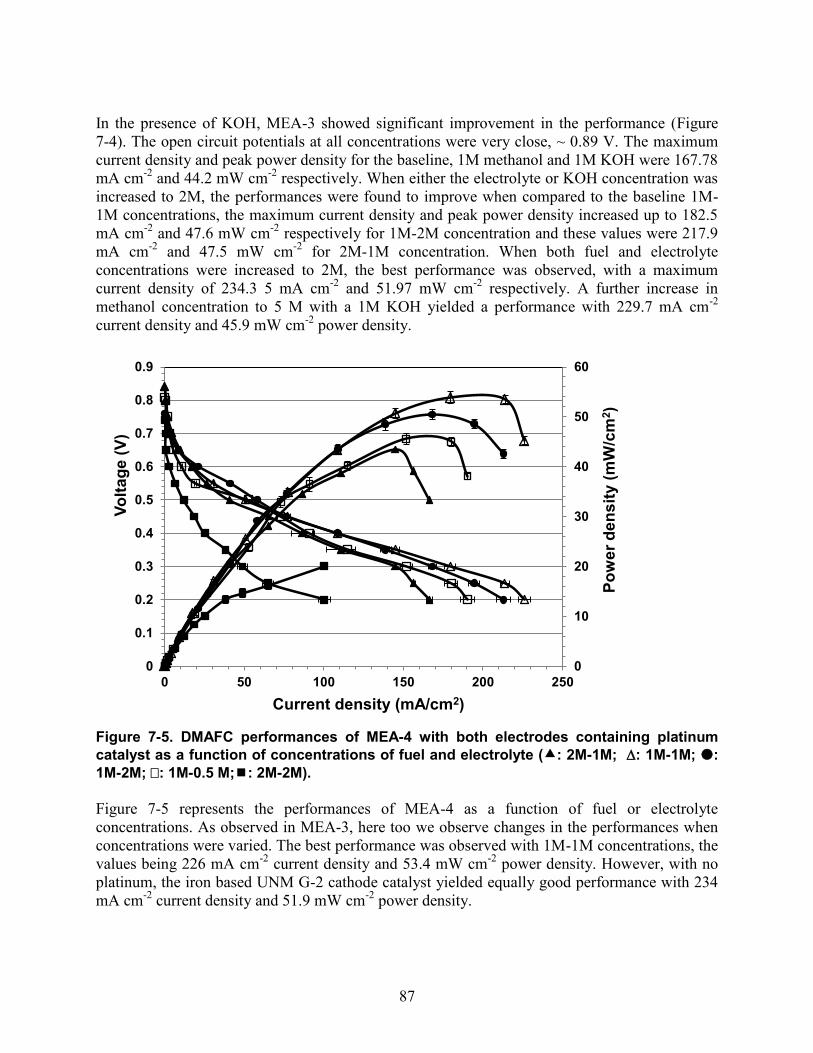
87
In the presence of KOH, MEA-3 showed significant improvement in the performance (Figure 7-4). The open circuit potentials at all concentrations were very close, ~ 0.89 V. The maximum current density and peak power density for the baseline, 1M methanol and 1M KOH were 167.78 mA cm-2 and 44.2 mW cm-2 respectively. When either the electrolyte or KOH concentration was increased to 2M, the performances were found to improve when compared to the baseline 1M-1M concentrations, the maximum current density and peak power density increased up to 182.5 mA cm-2 and 47.6 mW cm-2 respectively for 1M-2M concentration and these values were 217.9 mA cm-2 and 47.5 mW cm-2 for 2M-1M concentration. When both fuel and electrolyte concentrations were increased to 2M, the best performance was observed, with a maximum current density of 234.3 5 mA cm-2 and 51.97 mW cm-2 respectively. A further increase in methanol concentration to 5 M with a 1M KOH yielded a performance with 229.7 mA cm-2 current density and 45.9 mW cm-2 power density.
Figure 7-5. DMAFC performances of MEA-4 with both electrodes containing platinum catalyst as a function of concentrations of fuel and electrolyte (: 2M-1M; : 1M-1M; : 1M-2M; : 1M-0.5 M;: 2M-2M). Figure 7-5 represents the performances of MEA-4 as a function of fuel or electrolyte concentrations. As observed in MEA-3, here too we observe changes in the performances when concentrations were varied. The best performance was observed with 1M-1M concentrations, the values being 226 mA cm-2 current density and 53.4 mW cm-2 power density. However, with no platinum, the iron based UNM G-2 cathode catalyst yielded equally good performance with 234 mA cm-2 current density and 51.9 mW cm-2 power density.
0
10
20
30
40
50
60
0
0.1
0.2
0.3
0.4
0.5
0.6
0.7
0.8
0.9
0 50 100 150 200 250
Pow
er d
ensi
ty (m
W/c
m2 )
Volta
ge (V
)
Current density (mA/cm2)

88
Conclusions For the ATMPP based MEAs, MEA-1 and MEA-2, the non-Pt cathode catalyst, UNM G-1 showed better performance both in the presence and absence of methanol. Whereas in the absence of KOH, platinum based MEA-4 showed better performance than non-Pt catalyst, in KOH, the performances were very close, indicating the replacement of high cost platinum with a non-Pt cathode catalyst. This current work is a preliminary study demonstrating the possibility of using a non-Pt cathode catalyst and we aim to work on the durability study.

89
8. NON-PLATINUM CATHODE CATALYSTS FOR ALKALINE DIRECT ETHYLENE GLYCOL FUEL CELL
Rajeswari Janarthanan,a Michael R. Hibbs,b Plamen Atanassov,c and Andrew M. Herring.a
aDepartment of Chemical and Biological Engineering, Colorado School of Mines, Golden, CO 80401, USA
bMaterials, Devices, & Energy Technologies Sandia National Laboratories, Albuquerque, NM, USA
cDepartment of Chemical and Nuclear Engineering University of New Mexico, Albuquerque, NM 87131-0001.
In addition to the direct methanol fuel cells described in the previous two chapters, we also studied the alkaline direct ethylene glycol (EG) oxidation in the presence of KOH using the same membranes and ionomers as with methanol. The MEA was prepared by mechanically pressing anode (46% Pt/C, Tanaka), cathode (Iron based catalyst, UNM G-2 or HypermecTM) and the membrane. The membrane, TMAC6PP is based on polyphenylene backbone with hexamethylene spacers. In general, catalyst inks were made by mixing the catalyst with millipore water, isopropanol and TMAC6PPC6 ionomer (3% solution in methanol) with a catalyst to ionomer ratio of 4:1. Ionomer solution was obtained by dissolving polymer films in methanol. Catalyst inks were painted on 5.48 cm2 gas diffusion layer (Etek) to obtain an anode loading of 1.4 mg of Pt cm-2 and a catalyst loading of 5 mg of total mass per cm2. Prior to any tests, MEAs were soaked in 1M NaOH for 2h to convert the membrane from Br- form to OH- form. Following this, MEAs were subsequently soaked in water with frequent changes of water to ensure complete removal of NaOH and to obtain a neutral pH. The fuel 1M EG in KOH was pumped by an isocratic HPLC pump (Chromtech) to the anode. Oxygen is fed to the cathode through a modular gas handling/gas metering system (Lynntech Industry, Inc.) through a humidity bottle maintained at 80 C. The purge gas N2 and flow rate of oxygen was controlled using FC power software (Lynntech Industry, Inc.). A MSTAT4+ multi-potentiostat (Arbin Instruments) was used to conduct polarization experiments. The polarization curves were obtained by stepping down the potential from open circuit potential until the limiting current is achieved. Figure 8-1 demonstrates the EG fuel cell performance as a function of the concentrations of fuel and electrolyte. With 1M EG and 0.5 M KOH, the OCV observed was 0.8 V with maximum current density and peak power density being 117 mA cm-2 and 17 mW cm-2. When the KOH concentration was increased to 2M, the fuel solution with 1M EG and 2M KOH resulted in 50 mV higher OCV and the performances were very close in low current density region. The performances were observed to be better at this concentration with 1.35 fold higher current density and 1.43 times higher power density. As the concentrations of both fuel and electrolyte concentrations were increased up to 2M, the performances remained closer up to 25 mA cm-2 but significant improvement was observed at high current densities. The best performance of 222 mA cm-2 and 36 mW cm-2 was observed with the fuel solution containing 2M EG and 2M KOH.

90
Figure 8-1. Alkaline direct ethylene glycol performances as a function of concentration (circles: 2M EG-2M KOH, triangles: 1M EG- 1M KOH, diamonds: 1M EG- 0.5 M KOH) at 80 C, 100 % RH (MEA was made of Pt/C, TKK as anode, HypermecTM as cathode and TMAC6PP membrane).
Figure 8-2. Alkaline direct ethylene glycol performances as a function of relative humidity (triangles: 50 % RH, squares: 75 % RH, diamonds: 100 % RH) at 60 C in 1M EG- 0.5 M KOH (MEA was made of Pt/C, TKK as anode, HypermecTM as cathode and TMAC6PP membrane). The performances were studied as a function of relative humidity at 60 C (Figure 8-2). It is observed that the performances remained close at 75% and 100 % RH, with the peak power density (14.5 mW cm-2) being slightly higher for 75% RH. The maximum current density observed was almost the same, 95 mA cm-2. At 50% RH, the OCV decreased at least 100 mV less than 75 and 100 % RH. The peak power and maximum current densities were 12.6 mW cm-2 and 86 mA cm-2.
0
5
10
15
20
25
30
35
40
0
0.1
0.2
0.3
0.4
0.5
0.6
0.7
0.8
0.9
0 50 100 150 200 250
Po
we
r d
en
sity
(m
W c
m-2
)
Vo
ltag
e (
V)
Current density (mA cm-2)
0
2
4
6
8
10
12
14
16
0
0.1
0.2
0.3
0.4
0.5
0.6
0.7
0.8
0.9
0 10 20 30 40 50 60 70 80 90 100
Po
we
r d
en
sity
(m
W c
m-2
)
Vo
ltag
e (
V)
Current density (mA cm-2)

91
SUMMARY/FUTURE WORK
Initially in this study, aromatic anion exchange membranes (AEM)s based on aminated poly (phenylene) homopolymers with benzyltrimethyl ammonium (BTMA) cations were synthesized and investigated in both bromide and hydroxide forms. These membranes (ATMPP) were found to have good mechanical stability based on low water uptake and water content values calculated from dynamic vapor sorption studies. In order to avoid exchange of hydroxide ions to carbonate or bicarbonate ions when exposed to air, a technique for performing in-situ hydroxide ion conductivity measurements was developed. A method for determining IEC by NMR was also developed and the results indicated that the formation of BTMA cations during the synthesis of ATMPP is nearly quantitative, contrary to our prior understanding. ATMPP membranes were also determined to be soluble in methanol (but not water/methanol mixtures) which enabled their use as catalyst binder (ionomer) in fuel cell electrodes. The mobilities of both water and methanol (in both free and bound states) within the AEMs and ionomer films were probed by novel solid state NMR techniques. The ability to resolve these different solvent environments was simply not possible using standard static 1H PFG NMR techniques. However, by incorporating 1H HRMAS NMR techniques the different solvent environments became immediately resolvable. This resolution allowed the measurement of diffusion rates for each different species thus providing additional insight into the transport properties of solvents within fuel cell membranes. This study furthered the applications of HRMAS NMR in materials science and it also demonstrated the benefit of this technique to the field of AEMs and other similar materials, by enabling diffusion measurements to be performed on mixed solvent systems which otherwise would be inaccessible utilizing standard static NMR diffusion methods. To improve upon the properties of ATMPP, a series of AEMs based on a Diels-Alder poly(phenylene) backbone and having a variety of different attached cations were synthesized. All of the membranes were tough and flexible before and after exposure to KOH solution at elevated temperature and they had water uptake and ionic conductivity values that are considered reasonable for use in anion exchange membrane fuel cells (AEMFC)s. However, the membrane with hexane-6-trimethylammonium sidechains (TMAC6PP) was the only one that showed greater stability than ATMPP. Thus the replacement of a benzylic methylene spacer with a hexamethylene spacer results in greater stability despite the possibility of Hofmann elimination reactions which are not possible in the former case. In addition, a new polymer with a structure similar to TMAC6PP, but with a more flexible backbone (TMAC6PPC6) was also synthesized for use as an ionomer to put in the electrodes that contact TMAC6PP membranes. Additional solid state NMR studies demonstrated that the mobility of methanol within the new ionomer was indeed greater than it was in ATMPP, as expected. As part of the development of non-precious metal group (PGM) catalysts, the new catalysts were tested with two ionomers (ATMPP and a polysulfone-based ionomer). Electrochemical evaluation of the non-PGM catalyst bound with the featured alkaline ionomer classes over a range of conditions gave insight into how they behaved, as well as provided information on how the varying functionalities enhanced or inhibited the rate of oxygen reduction. Additionally, an optimization procedure, that was instructive for all carbon supported non-PGM catalyst inks using poly(sulfone)s or poly(phenylene)s, emerged from the data. The poly(phenylene)-derived polymers performed much more favorably and more in line with the benchmark ionomer, Nafion®. The catalyst showed no significant loss in voltage of the half-wave potential with ATMPP. Because of its largely non-polar, aromatic structure, ATMPP appeared to wet the surface of the carbon-supported catalyst better than the poly(sulfone)s. In addition to conducting product away from the active sites, ATMPP solvated O2 and H2O in sufficient quantities such that the maximum oxygen reduction kinetics for the catalyst was realized.

92
Fuel cell testing was mainly focused on benchmarking the DMFC performances of ATMPP and TMAC6PP using commercial platinum catalysts and non-PGM catalysts developed at UNM. The cells utilizing the TMAC6PP/TMAC6PPC6 membrane/ionomer combination always outperformed those made with ATMPP as both membrane and ionomer both in terms of power density and cell durability. However, the use of KOH-free AEMs in direct methanol AEMFCs was not sufficient to achieve good performance. The addition of KOH to the fuel supply led to significant improvement in the performance. The highest power density achieved in this study was 54 mW/cm2 (90% of the project goal). A study of the performances as a function of gas diffusion layer (GDL) hydrophobicity was also performed with two different GDLs. The results demonstrated that hydrophilic anode GDL and hydrophobic cathode GDL improved the performance. This project has led to the development of new materials for alkaline fuel cells and it has demonstrated a state-of-the-art power density from a fuel cell utilizing these materials. The testing focused almost entirely on methanol as the fuel for portable power applications. There are many other fuels of interest for various applications in fuel cell research such as hydrogen, ethanol, ethylene glycol, etc. A great deal of future research could be dedicated to MEA fabrication techniques and optimizing conditions for alkaline fuel cells utilizing the materials from this project with other fuels. In addition, the durability of the quaternary cations used in the membranes and ionomers for this project has not been proven to be great enough for long term use in commercial systems. More extensive durability tests in operational fuel cells are needed. Also, new cation chemistries such as immobilized metal ions need to be explored and paired with the extremely stable poly(phenylene) backbone chemistry utilized in this project.

Distribution External Andrew Herring (electronic copy) 464 Alderson Hall Chemical and Biological Engineering Department Colorado School of Mines Golden, CO 80401 [email protected] Plamen Atanassov (electronic copy) Farris Engineering Center - Room 247 Department of Chemical and Nuclear Engineering University of New Mexico Albuquerque, NM 87131 [email protected] Internal 1 MS0734 Tony Martino 6124 (electronic copy) 1 MS0886 Todd Alam 1816 (electronic copy) 1 MS0888 Michael Hibbs 6124 (electronic copy) 1 MS0359 D. Chavez, LDRD Office 1911 (electronic copy) 1 MS0899 Technical Library 9536 (electronic copy)
