development of a soil erosion classification system for ... · technical paper development of a...
TRANSCRIPT
TECHNICAL PAPER
Development of a Soil Erosion Classification Systemfor Cut and Fill Slopes
David Hernando1 & Manuel G. Romana1
Accepted: 8 June 2015 /Published online: 23 June 2015# Springer New York 2015
Abstract The Universal Soil Loss Equation (USLE) has been widely used to predictthe long-term average annual soil loss associated with sheet and rill erosion caused byrainfall and runoff. Initially developed for agricultural purposes, it was later modifiedand extended for estimating soil loss on cut and fill slopes. In addition to this valuableequation, management of cut and fill slopes also requires a classification system inorder to prioritize erosion control measures and maintenance operations based onestimated soil loss. Currently available erosion classifications (focused on soil produc-tivity and sustainable agriculture) may not be relevant to transportation infrastructureslopes, in which soil loss rates are dramatically higher and primarily concern opera-tional service conditions. Therefore, the objective of this study was to develop aclassification system based on soil loss rates computed by the USLE model that canbe valuable for management of cut and fill slopes. It was assumed that erosionclassifications developed for agriculture could be used in cut and fill slopes as longas the ratio between respective soil loss rates was applied. It was found that thetopographic factor, which accounts for the length and steepness of the slope, mayexplain most of the difference in respective soil loss rates. For typical values of thetopographic factor, soil loss rates on cut and fill slopes were found to be roughly tentimes greater than those on agriculture. Based on this finding, a new classification withsix erosion levels was developed. Finally, validation analysis showed that the proposedclassification successfully ranked soil loss rates reported in the literature into differentcategories.
Keywords Soil erosion . Universal Soil Loss Equation . Slopemanagement .
Classification system . Cut and fill . Transportation infrastructure
Transp. Infrastruct. Geotech. (2015) 2:155–166DOI 10.1007/s40515-015-0024-9
* David [email protected]
Manuel G. [email protected]
1 Department of Civil Engineering—Transport, Technical University of Madrid, Profesor Aranguren3, 28040 Madrid, Spain
Introduction
Soil erosion is a major concern for its long-term effects on soil productivity, sustainableagriculture, and water quality. It is a problem of wider significance occurring addition-ally on land devoted to forestry, transportation, and recreation [1]. The Universal SoilLoss Equation (USLE) developed by Wischmeier and Smith [2–4] is the most widelyused equation for soil erosion analysis all over the world. It is an empirical model thatpredicts the long-term average annual soil loss associated with sheet and rill erosioncaused by rainfall and runoff:
A ¼ R⋅K⋅LS⋅C⋅P ð1Þwhere A is the long-term average annual soil loss rate (in units of mass area−1 year−1), Ris the rainfall erosivity factor, K is the soil erodibility factor, LS is the topographic factor(length and steepness of slope), C is the cover and management factor, and P is theconservation practice factor.
Israelsen et al. [5] modified and extended the USLE model for estimating soil losspotential on cuts and fills of construction sites, resulting in the following equation:
A ¼ R⋅K⋅LS⋅VM ð2Þin which A is the long-term average annual soil loss rate; R, K, and LS are those definedfor Eq. 1; and VM is the erosion control factor. Equation 2 was successfully applied toslopes up to 84 % [5], which are in the order of the slopes commonly found onhighways, railways, parking lots, and other construction sites. In addition to thisvaluable prediction model proposed by Israelsen et al. [5], management of cutand fill slopes requires a classification system such that erosion control mea-sures and maintenance operations can be assessed and prioritized according toestimated soil loss rates. Currently available erosion classifications focus on theconcept of tolerable soil loss, which is mainly related to the maximum rate thatcould occur indefinitely without adversely affecting soil productivity [1, 3, 6,7]. However, classification systems based on soil productivity may not begenerally applicable to evaluate soil erosion on transportation infrastructures,in which maintaining fully operational service is of paramount importance.Therefore, the objective of this study was to develop an erosion classificationsystem based on soil loss rates that can be truly valuable for management ofcut and fill slopes on highways, railways, and other transportationinfrastructures.
Problem Statement
Several classifications based on soil loss or soil removal have been reported in theliterature for sheet and rill erosion. Zachar [8] proposed six grades of soil removalintensity: insignificant, slight, moderate, severe, very severe, and catastrophic erosion,which ranged from <0.5 m3 ha−1 year−1 (insignificant) to >200 m3 ha−1 year−1
(catastrophic). Wall et al. [9] defined five classes of potential soil loss ranging fromvery low or tolerable erosion (<6 t ha−1 year−1) to severe erosion (>33 t ha−1 year−1).
156 Transp. Infrastruct. Geotech. (2015) 2:155–166
Morgan et al. [10] developed a classification to appraise soil erosion in the field thatranged from very slight (<6 t ha−1 year−1) to catastrophic (>500 t ha−1 year−1). One ofthe most extensively used references in soil erosion classification was proposed byFAO-PNUMA-UNESCO [11]. This classification (Table 1) defined four erosion levelsbased on soil loss rates computed using the USLE model. Low erosion level wasdefined for soil loss rates <10 t ha−1 year−1, whereas very high erosion was establishedas that occurring at rates >200 t ha−1 year−1.
The aforementioned classifications were primarily developed for agricultureand may not be fully applicable to cut and fill slopes for two major reasons.First, concerns in slope management are not related to soil productivity, butoperational service conditions associated with deposition of sediments along theinfrastructure right-of-way. Eroded material accumulates on ditches, culverts,and sediment traps and may eventually reach the shoulder, constituting apotential hazard for infrastructure users. In addition, a clogged drainage systemmay result in overflow, washout, undermining, and collapse of earthworks andstructures [12, 13]. Secondly, soil loss rates on cut and fill slopes are reportedto be dramatically higher than those on agricultural lands. Navarro [14] statedthat soi l loss on construction sites typically ranges from 125 to600 t ha−1 year−1. Soil loss rates from 62 to 887 t ha−1 year−1 weremeasured on highway cuts in Georgia [15]. Haigh [16] reported values from373 to 426 t ha−1 year−1 in Oklahoma. Soil loss rates up to 248 t ha−1 year−1
were measured on granitic cut slopes in Idaho [17]. In the Qinghai-Tibethighway (China), Xu et al. [18] found soil losses of 24 and 109 t ha−1 forperiods of 28 and 78 days, respectively, which would be equivalent to averageannual rates of 310–510 t ha−1 year−1. In Spain, rates from 79 to962 t ha−1 year−1 were predicted on slopes of highways and railways, as wellas peak values near 1100 t ha−1 year−1 under severe rainfall events [19, 20].
As shown above, soil erosion on cut and fill slopes of transportationinfrastructures clearly exceeds the maximum soil loss rates defined by agricul-tural classifications. The approach followed in this study consisted of identify-ing the ratio of typical soil loss rates on cut and fill slopes to those onagricultural lands. It was assumed that erosion classifications developed foragriculture could be used in cut and fill slopes as long as the identified ratiobetween respective soil loss rates was applied. This ratio was the basis for thedevelopment of a new classification system based on soil loss rates estimatedaccording to the USLE model.
Table 1 Level of erosion based onaverage annual soil loss rate foragriculture [11]
Soil loss rate(t ha−1 year−1)
Erosion level
<10 Low
10–50 Moderate
50–200 High
>200 Very high
Transp. Infrastruct. Geotech. (2015) 2:155–166 157
Relationship Between Soil Loss Rates on Cut and Fill Slopes to Thoseon Agricultural Lands
The factors contained in the USLE model (Eqs. 1–2) were analyzed in this section toestimate the ratio of typical soil loss rates on cut and fill slopes to those on agriculturallands. The following observations were made:
& Rainfall erosivity and soil erodibility are prefixed by nature and cannot be alteredby human activities [5]. Thus, R and K factors are preset and do not necessarilydiffer between agricultural lands and cut and fill slopes.
& The effect of land use and management on soil loss is taken into account by theterm C·P in Eq. 1 and by VM factor in Eq. 2, respectively. For agricultural fields,C·P includes crop type, tillage system, and support practices (e.g., contouring,contour stripcropping, terracing). For cut and fill slopes, Israelsen et al. [5] con-densed all erosion control measures that can be implemented on any cut and fillslope in a single factor (VM). Reported values for C·P and VM suggest that landuse and management may not explain the substantial difference in soil loss ratesbetween agricultural lands and cut and fill slopes [4, 5].
& Conversely, the topographic factor definitely presents distinct values because of thedifferent nature in length and steepness. Relatively flat slopes and long lengths arefrequent on agriculture, whereas steep slopes and short lengths are commonly used oncuts and fills.
The above discussion led to the assumption that the dramatic difference in soil lossrate may be primarily explained by the different values in topographic factor. Thefollowing equation was given by Wischmeier and Smith [4] to determine the topo-graphic factor (LS):
LS ¼ λ22:13
� �m
⋅ 65:41⋅sin2θþ 4:56 � sinθþ 0:065� � ð3Þ
in which λ represents the distance from the point of origin of overland flow to the pointwhere either deposition begins or the runoff water exits the slope, θ is the angle of the slope(°), and m is an exponent dependent upon slope steepness (m=0.2 for s<1 %, m=0.3 fors=1–3 %, m=0.4 for s=3.5–4.5 %, and m=0.5 for s>5 %). Although some studies haveindicated that Eq. 3 might overpredict the topographic factor on natural steep slopes[21–24], Israelsen et al. [5] proved its validity for cut and fill slopes with steepness up to84 %. Thus, Eq. 3 was selected in this study to evaluate the topographic factor for a widerange of slope height and steepness. For cut and fill slopes, steepness ranged from 25 to100 % according to common values used in highways, railways, and other infrastructures[25], while a maximum steepness of 12 % was considered for agricultural lands [1, 26].Figure 1 shows the average values of the topographic factor (LS) for cut and fill slopes andfor agricultural lands as well as the ratio between them (LS ratio, Eq. 4):
LS ratio ¼ LS on cut and fill slopes
LS on agricultural landsð4Þ
158 Transp. Infrastruct. Geotech. (2015) 2:155–166

As can be seen in Fig. 1, LS for agricultural lands rarely exceeds 5, whereasvalues >10 are obtained for cut and fill slopes just 3 m high. The LS ratio wasfound to be roughly 10 for any given height. Assuming that the topographicfactor accounts for most of the difference in soil loss rate, it can be stated thatsoil loss rates on cut and fill slopes are expected to be ten times greater thanthose on agriculture.
Soil Loss Classification System for Cut and Fill Slopes
Proposal of Erosion Levels
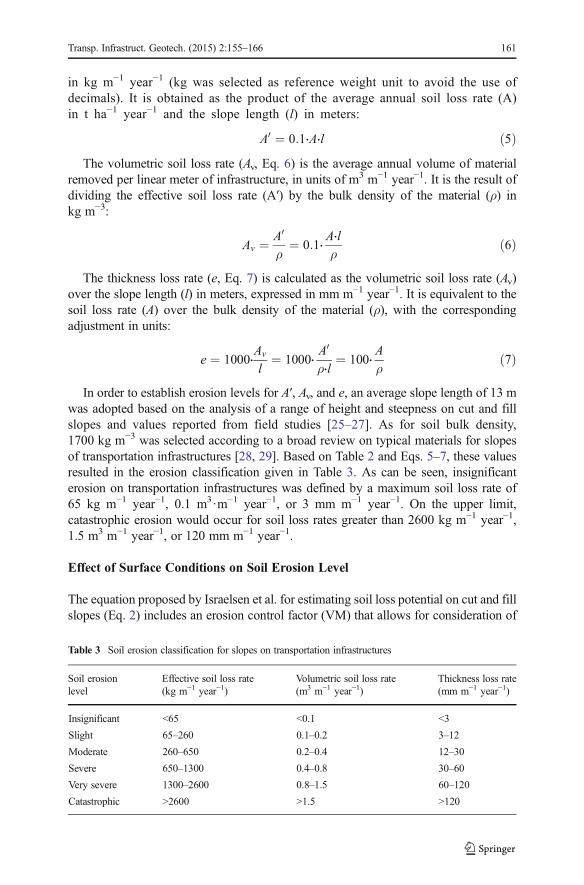
The identified ratio of ten was used to convert the maximum soil loss rate of200 t ha−1 year−1 defined by FAO-PNUMA-UNESCO for agriculture to a maximumsoil loss rate of 2000 t ha−1 year−1 for cut and fill slopes. Six levels of erosion wereestablished following the qualitative classification defined by Zachar [8]: insignificant,slight, moderate, severe, very severe, and catastrophic erosion. The proposedclassification is given in Table 2. As can be seen, erosion causing an average annualsoil loss below 50 t ha−1 year−1 was considered as insignificant (i.e., tolerable) for cutand fill slopes.
Validation
The classification proposed in Table 2 was validated using soil loss rates fromcut and fill slopes available in the literature. Figure 2 shows the range of soilloss rates reported by different authors [14–20], along with the proposederosion levels. While most reported soil loss rates would simply fall underthe category of very high erosion according to the limits proposed by FAO-PNUMA-UNESCO (>200 t ha−1 year−1), this new classification ranked soil loss
0
3
6
9
12
15
0
5
10
15
20
25
0 5 10 15
LS R
a�o
Topo
grap
hic
fact
or (d
imen
sionl
ess)
Slope height (m)
Cut and fill slopes Agricultural lands LS Ra�o
Fig. 1 Determination of the LS ratio based on typical values of the topographic factor for cut and fill slopesand agricultural lands
Transp. Infrastruct. Geotech. (2015) 2:155–166 159
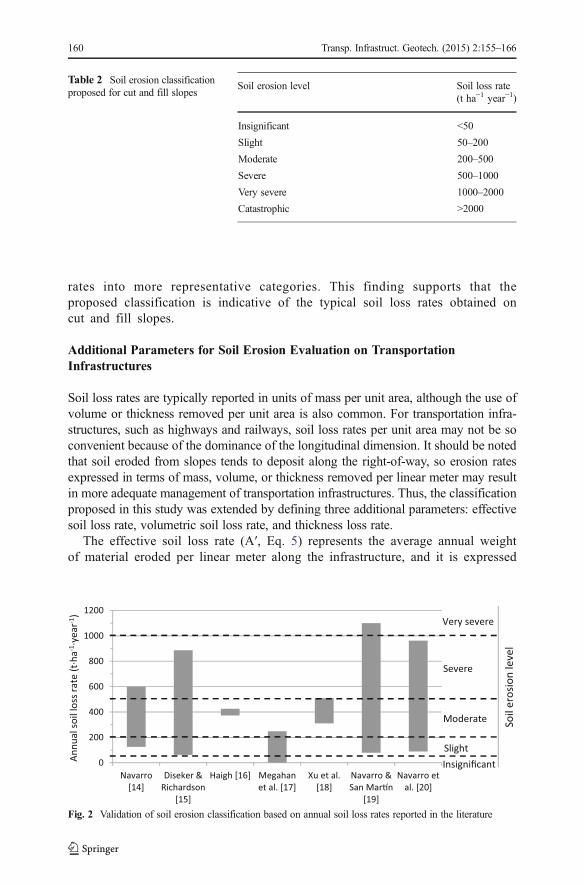
rates into more representative categories. This finding supports that theproposed classification is indicative of the typical soil loss rates obtained oncut and fill slopes.
Additional Parameters for Soil Erosion Evaluation on TransportationInfrastructures
Soil loss rates are typically reported in units of mass per unit area, although the use ofvolume or thickness removed per unit area is also common. For transportation infra-structures, such as highways and railways, soil loss rates per unit area may not be soconvenient because of the dominance of the longitudinal dimension. It should be notedthat soil eroded from slopes tends to deposit along the right-of-way, so erosion ratesexpressed in terms of mass, volume, or thickness removed per linear meter may resultin more adequate management of transportation infrastructures. Thus, the classificationproposed in this study was extended by defining three additional parameters: effectivesoil loss rate, volumetric soil loss rate, and thickness loss rate.
The effective soil loss rate (A′, Eq. 5) represents the average annual weightof material eroded per linear meter along the infrastructure, and it is expressed
0
200
400
600
800
1000
1200
Navarro[14]
Diseker &Richardson
[15]
Haigh [16] Megahanet al. [17]
Xu et al.[18]
Navarro &San Mar�n
[19]
Navarro etal. [20]
Annu
al so
il lo
ss ra
te (t
·ha-1
·yea
r-1)
InsignificantSlight
Moderate
Severe
Very severe
Soil
eros
ion
leve
l
Fig. 2 Validation of soil erosion classification based on annual soil loss rates reported in the literature
Table 2 Soil erosion classificationproposed for cut and fill slopes
Soil erosion level Soil loss rate(t ha−1 year−1)
Insignificant <50
Slight 50–200
Moderate 200–500
Severe 500–1000
Very severe 1000–2000
Catastrophic >2000
160 Transp. Infrastruct. Geotech. (2015) 2:155–166
in kg m−1 year−1 (kg was selected as reference weight unit to avoid the use ofdecimals). It is obtained as the product of the average annual soil loss rate (A)in t ha−1 year−1 and the slope length (l) in meters:
A0 ¼ 0:1⋅A⋅l ð5ÞThe volumetric soil loss rate (Av, Eq. 6) is the average annual volume of material
removed per linear meter of infrastructure, in units of m3 m−1 year−1. It is the result ofdividing the effective soil loss rate (A′) by the bulk density of the material (ρ) inkg m−3:
Av ¼ A0
ρ¼ 0:1⋅
A⋅lρ
ð6Þ
The thickness loss rate (e, Eq. 7) is calculated as the volumetric soil loss rate (Av)over the slope length (l) in meters, expressed in mm m−1 year−1. It is equivalent to thesoil loss rate (A) over the bulk density of the material (ρ), with the correspondingadjustment in units:
e ¼ 1000⋅Av
l¼ 1000⋅
A0
ρ⋅l¼ 100⋅
A
ρð7Þ
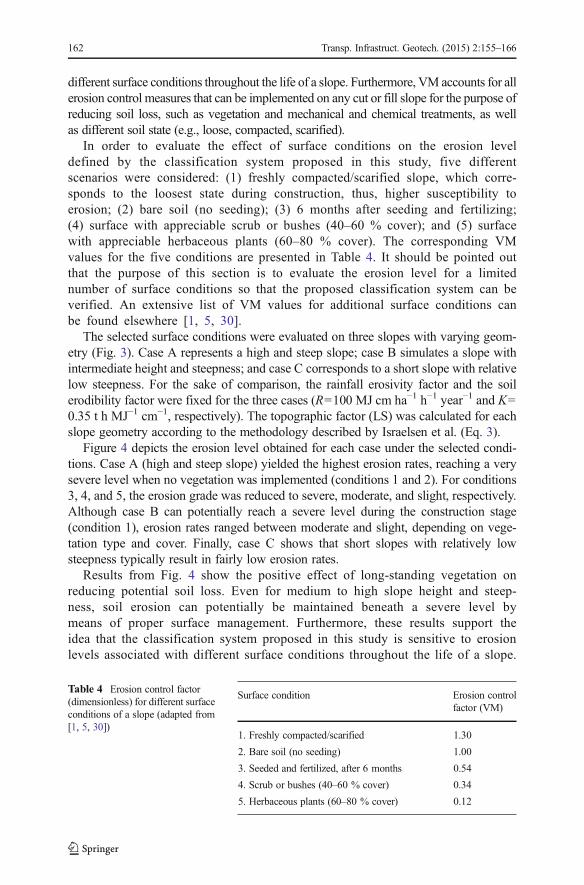
In order to establish erosion levels for A′, Av, and e, an average slope length of 13 mwas adopted based on the analysis of a range of height and steepness on cut and fillslopes and values reported from field studies [25–27]. As for soil bulk density,1700 kg m−3 was selected according to a broad review on typical materials for slopesof transportation infrastructures [28, 29]. Based on Table 2 and Eqs. 5–7, these valuesresulted in the erosion classification given in Table 3. As can be seen, insignificanterosion on transportation infrastructures was defined by a maximum soil loss rate of65 kg m−1 year−1, 0.1 m3·m−1 year−1, or 3 mm m−1 year−1. On the upper limit,catastrophic erosion would occur for soil loss rates greater than 2600 kg m−1 year−1,1.5 m3 m−1 year−1, or 120 mm m−1 year−1.
Effect of Surface Conditions on Soil Erosion Level
The equation proposed by Israelsen et al. for estimating soil loss potential on cut and fillslopes (Eq. 2) includes an erosion control factor (VM) that allows for consideration of
Table 3 Soil erosion classification for slopes on transportation infrastructures
Soil erosionlevel
Effective soil loss rate(kg m−1 year−1)
Volumetric soil loss rate(m3 m−1 year−1)
Thickness loss rate(mm m−1 year−1)
Insignificant <65 <0.1 <3
Slight 65–260 0.1–0.2 3–12
Moderate 260–650 0.2–0.4 12–30
Severe 650–1300 0.4–0.8 30–60
Very severe 1300–2600 0.8–1.5 60–120
Catastrophic >2600 >1.5 >120
Transp. Infrastruct. Geotech. (2015) 2:155–166 161
different surface conditions throughout the life of a slope. Furthermore, VM accounts for allerosion control measures that can be implemented on any cut or fill slope for the purpose ofreducing soil loss, such as vegetation and mechanical and chemical treatments, as wellas different soil state (e.g., loose, compacted, scarified).
In order to evaluate the effect of surface conditions on the erosion leveldefined by the classification system proposed in this study, five differentscenarios were considered: (1) freshly compacted/scarified slope, which corre-sponds to the loosest state during construction, thus, higher susceptibility toerosion; (2) bare soil (no seeding); (3) 6 months after seeding and fertilizing;(4) surface with appreciable scrub or bushes (40–60 % cover); and (5) surfacewith appreciable herbaceous plants (60–80 % cover). The corresponding VMvalues for the five conditions are presented in Table 4. It should be pointed outthat the purpose of this section is to evaluate the erosion level for a limitednumber of surface conditions so that the proposed classification system can beverified. An extensive list of VM values for additional surface conditions canbe found elsewhere [1, 5, 30].
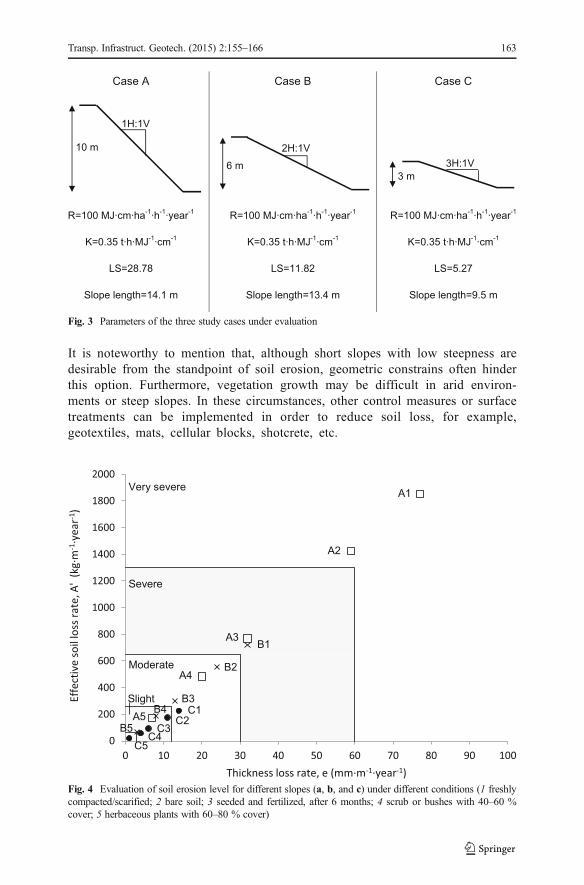
The selected surface conditions were evaluated on three slopes with varying geom-etry (Fig. 3). Case A represents a high and steep slope; case B simulates a slope withintermediate height and steepness; and case C corresponds to a short slope with relativelow steepness. For the sake of comparison, the rainfall erosivity factor and the soilerodibility factor were fixed for the three cases (R=100 MJ cm ha−1 h−1 year−1 and K=0.35 t h MJ−1 cm−1, respectively). The topographic factor (LS) was calculated for eachslope geometry according to the methodology described by Israelsen et al. (Eq. 3).
Figure 4 depicts the erosion level obtained for each case under the selected condi-tions. Case A (high and steep slope) yielded the highest erosion rates, reaching a verysevere level when no vegetation was implemented (conditions 1 and 2). For conditions3, 4, and 5, the erosion grade was reduced to severe, moderate, and slight, respectively.Although case B can potentially reach a severe level during the construction stage(condition 1), erosion rates ranged between moderate and slight, depending on vege-tation type and cover. Finally, case C shows that short slopes with relatively lowsteepness typically result in fairly low erosion rates.
Results from Fig. 4 show the positive effect of long-standing vegetation onreducing potential soil loss. Even for medium to high slope height and steep-ness, soil erosion can potentially be maintained beneath a severe level bymeans of proper surface management. Furthermore, these results support theidea that the classification system proposed in this study is sensitive to erosionlevels associated with different surface conditions throughout the life of a slope.
Table 4 Erosion control factor(dimensionless) for different surfaceconditions of a slope (adapted from[1, 5, 30])
Surface condition Erosion controlfactor (VM)
1. Freshly compacted/scarified 1.30
2. Bare soil (no seeding) 1.00
3. Seeded and fertilized, after 6 months 0.54
4. Scrub or bushes (40–60 % cover) 0.34
5. Herbaceous plants (60–80 % cover) 0.12
162 Transp. Infrastruct. Geotech. (2015) 2:155–166
It is noteworthy to mention that, although short slopes with low steepness aredesirable from the standpoint of soil erosion, geometric constrains often hinderthis option. Furthermore, vegetation growth may be difficult in arid environ-ments or steep slopes. In these circumstances, other control measures or surfacetreatments can be implemented in order to reduce soil loss, for example,geotextiles, mats, cellular blocks, shotcrete, etc.
Case A Case B Case C
R=100 MJ·cm·ha-1
·h-1
·year-1
K=0.35 t·h·MJ-1
·cm-1
LS=28.78
Slope length=14.1 m
R=100 MJ·cm·ha-1
·h-1
·year-1
K=0.35 t·h·MJ-1
·cm-1
LS=11.82
Slope length=13.4 m
R=100 MJ·cm·ha-1
·h-1
·year-1
K=0.35 t·h·MJ-1
·cm-1
LS=5.27
Slope length=9.5 m
3H:1V
10 m
6 m
2H:1V
1H:1V
3 m
Fig. 3 Parameters of the three study cases under evaluation
0
200
400
600
800
1000
1200
1400
1600
1800
2000
0 10 20 30 40 50 60 70 80 90 100
m·gk('A,etarssollios
evitceffE-1
·yea
r-1)
Thickness loss rate, e (mm·m-1·year-1)
Slight
A1
A2
A3
A4
A5
B1
B2
B3
B4
B5
C1
C2C3
C4
C5
Moderate
Severe
Very severe
Fig. 4 Evaluation of soil erosion level for different slopes (a, b, and c) under different conditions (1 freshlycompacted/scarified; 2 bare soil; 3 seeded and fertilized, after 6 months; 4 scrub or bushes with 40–60 %cover; 5 herbaceous plants with 60–80 % cover)
Transp. Infrastruct. Geotech. (2015) 2:155–166 163
Summary and Conclusions
Available soil erosion classifications, which were primarily developed for agri-cultural purposes, may not be directly applicable for the study of cut and fillslopes. Maximum soil loss rates proposed by these classifications wereestablished to guarantee adequate soil productivity over time, and therefore,their values are not significant in the context of infrastructures. Proper man-agement of transportation infrastructures is primarily concerned with operationalservice conditions rather than soil productivity, and as such, a valuable erosionclassification should take into consideration the relative difference in soil lossrates.
With that goal in mind, an analysis of the different factors contained in the USLEmodel was conducted in this study to estimate the ratio of typical soil loss rates on cutand fill slopes to those on agriculture. It was found that the topographic factor, whichaccounts for slope length and steepness, may explain most of the relative difference insoil loss rate. A broad study of typical values of the topographic factor showed thataverage values on cut and fill slopes were roughly ten times those on agricultural landsfor any slope height. This finding led to the conclusion that soil loss rates on cut and fillslopes were expected to be ten times greater than those on agriculture. The identifiedratio of ten was used to convert the maximum soil loss rate of 200 t ha−1 year−1
established by FAO-PNUMA-UNESCO for agriculture to a maximum soil loss rate of2000 t ha−1 year−1 for cut and fill slopes. Then, six levels of erosion were proposedfollowing the qualitative classification defined by Zachar [8]: insignificant, slight,moderate, severe, very severe, and catastrophic. The developed classification wasvalidated using soil loss rates from cuts and fills reported in the literature. It wasobserved that reported soil loss rates fell into a broad spectrum of categories, whichconfirms that the classification developed in this study is relevant for the typical soilloss rates that can be found on cut and fill slopes. Furthermore, three additionalparameters were defined to simplify the application of the proposed classification ontransportation infrastructures, which are characterized by the dominance of thelongitudinal dimension. These parameters were successfully employed to show theeffect of surface conditions (e.g., soil state, long-standing vegetation, and other surfacetreatments) on soil erosion level for three different slope geometries.
This study constitutes a first attempt to develop a valuable classification for soilerosion analysis on cut and fill slopes of infrastructures. Limited verification of theerosion levels was obtained on the basis of soil loss rates reported in the literature.Therefore, it is highly recommended that further verification efforts be continued onadditional slopes with different erosion control measures, in which both a quantitativeand a qualitative evaluation of soil erosion can be obtained.
References
1. Morgan, R.P.C.: Soil erosion and conservation. Blackwell Publishing, Oxford (2005)2. Wischmeier, W.H., Smith, D.D.: A universal equation for predicting rainfall-erosion losses—an aid to
conservation farming in humid regions. ARS Special Report 22–66. U.S. Department of Agriculture,Washington, D.C. (1961)
164 Transp. Infrastruct. Geotech. (2015) 2:155–166

3. Wischmeier, W.H., Smith, D.D.: Predicting rainfall erosion losses from cropland East of the RockyMountains. Agriculture Handbook No. 282. U.S. Department of Agriculture, Washington, D.C. (1965)
4. Wischmeier, W.H., Smith, D.D.: Predicting rainfall erosion losses. A guide to conservation planning.Agriculture Handbook No. 537. U.S. Department of Agriculture, Washington, D.C. (1978)
5. Israelsen, C.E., Clyde, C.G., Fletcher, J.E., Israelsen, E.K., Haws, F.W., Packer, P.E., Farmer, E.E.:Erosion control during highway construction. Manual on principles and practices. National CooperativeHighway Research Program. Report 221. Transportation Research Board, National Research Council,Washington, D.C. (1980)
6. Roose, E.: Land husbandry: components and strategy. FAO Soils Bulletin No. 70. Food and AgriculturalOrganization of the United Nations, Rome (1996)
7. Li, L., Du, S., Wu, L., Liu, G.: An overview of soil loss tolerance. Catena 78(2), 93–99 (2009)8. Zachar, D.: Soil erosion. Developments in Soil Science 10. Elsevier, Amsterdam (1982)9. Wall, G.J., Coote, D.R., Pringle, E.A., Shelton, I.J.: RUSLEFAC—Revised Universal Soil Loss Equation
for Application in Canada: a handbook for estimating soil loss from water erosion in Canada. ContributionNo. 02–92. Research Branch, Agriculture and Agri-Food Canada, Ottawa (Ontario) (2002)
10. Morgan, R.P.C., Hann, M.J., Shilston, D., Lee, E.M., Mirtskhoulava, T.E., Nadirashvili, V., Topuria, L.,Clarke, J., Sweeney, M.: Use of terrain analysis as a basis for erosion risk assessment: a case of study frompipeline rights-of-way in Georgia. International Conference on Terrain and Geohazard Challenges facingOnshore Oil and Gas Pipelines. BP/ICE, London (2004)
11. FAO-PNUMA-UNESCO: Metodología provisional para la evaluación de la degradación de los suelos[Provisional methodology to evaluate soil erosion]. Food and Agricultural Organization of the UnitedNations, Rome (1980)
12. Clyde, C.G., Israelsen, C.E., Packer, P.E.: Erosion control during highway construction: Volume 1. NCHRP Projects 16–3 & 16–3/1. Utah Water Research Laboratory, Utah (1979)
13. Walker, D., Entine, L., Kummer, S.: Drainage Manual. Local Road Assessment and Improvement.University of Wisconsin-Madison, Transportation Information Center, Wisconsin (2000)
14. Navarro, J.: Control de la erosión en desmontes originados por obras de infraestructura viaria: aplicaciónal entorno de Palencia capital [Erosion control on highway cut slopes: application to Palencia outskirts].Ph.D. Dissertation. Technical University of Madrid, Madrid (2002)
15. Diseker, E.G., Richardson, E.C.: Roadside sediment production and control. Trans. Am. Soc. Agric. Eng.4(1), 62–64, 68 (1961)
16. Haigh, M.J.: Geomorphic evolution of Oklahoma roadcuts. Z Geomorphol 29(4), 439–452 (1985)17. Megahan, W.F., Wilson, M., Monsen, S.B.: Sediment production from granitic cutslopes on forest roads in
Idaho. USA Earth Surf Process Landf 26, 153–163 (2001)18. Xu, X., Zhang, K., Kong, Y., Chen, J., Yu, B.: Effectiveness of erosion control measures along the
Qinghai-Tibet highway, Tibetan plateau, China. Transp Res D Transp Environ 11(4), 302–309 (2006)19. Navarro, J., San Martín, R.: Primeros datos sobre la erosión hídrica real en las obras viarias del entorno de
Palencia [Preliminary results on water erosion on several construction sites nearby Palencia]. Rutas 80, 4–14 (2000)
20. Navarro, J., Vélez, M., Rojo, A., Cruz, P.: Estudio de la revegetación, producción y emisión de sedimentosdurante las obras de la autovía Oviedo-Salas [study of re-vegetation and sediment production during theconstruction of the Oviedo-Salas highway]. I Congreso de Medio Ambiente en Carreteras, Santander(2006)
21. Moore, I.D., Burch, G.J.: Physical basis of the length-slope factor in the Universal Soil Loss Equation.Soil Sci Soc Am J 50, 1294–1298 (1986)
22. McCool, D.K., Brown, L.C., Foster, G.R., Mutchler, C.K., Meyer, L.D.: Revised slope steepness factorfor the Universal Soil Loss Equation. Trans Am Soc Agric Eng 30(5), 1387–1396 (1987)
23. Liu, B.Y., Nearing, M.A., Risse, L.M.: Slope gradient effects on soil loss for steep slopes. Trans Am SocAgric Eng 37(6), 1835–1840 (1994)
24. Nearing, M.A.: A single, continuous function for slope steepness influence on soil loss. Soil Sci Soc Am J61(3), 917–919 (1997)
25. Kraemer, C., Pardillo, J.M., Rocci, S., Romana, M.G., Sánchez Blanco, V., Del Val, M.A.: Ingeniería decarreteras [highway engineering]. McGraw-Hill, Madrid (2004)
26. Vaught, H.C.: Controlling soil erosion with agronomic practices. AGR-University of Kentucky,Cooperative Extension Service (1983)
27. Navarro, J., Jonte, M.A.: La erosión hídrica en los desmontes de la N-610 y N-611 en la circunvalación dela ciudad de Palencia [Water erosion on the cut slopes of N-610 and N-611 highways in Palenciaoutskirts]. Rutas 54, 35–42 (1996)
Transp. Infrastruct. Geotech. (2015) 2:155–166 165

28. Navarro, J.: Experiencias sobre control de erosión en desmontes margosos en Palencia [Erosion controlexperience on marly cut slopes in Palencia]. Rutas 102, 11–22 (2004)
29. FHWA: Project Development and Design Manual. Federal Highway Administration, Federal LandsHighway Programs, Washington, D.C. (2008)
30. Gray, D.H., Sotir, R.B.: Biotechnical and soil bioengineering slope stabilization. A practical guide forerosion control. Wiley, New York (1996)
166 Transp. Infrastruct. Geotech. (2015) 2:155–166