development of a dry deposition model for atmospheric coarse particles
TRANSCRIPT

DEVELU~~E~T OF A DRY DEPOSITION MODEL FOR AT~~~P~~RIC COARSE PARTICLES
KENNETH E. NOLL and KENNETH Y. P. FANG
Pritzker Department of Environmental Engineering, Illinois Institute of Technology, Chicago, IL, U.S.A.
(First receioed 4 December 1987 and inflnalform 8 September 1988)
Abstract-Atmospheric inertial deposition of coarse part&s has been quantified by the evaluation of particle dry deposition flux data colkected simuitaneousiy on the top and bottom surfaces of a smooth pIate with a sharp ieading edge that was pointed into the wind by a wind vane. The deposited part&es were weighed and counted. The airborne concentration of coarse particles was measured with a Rotary Impactor. Deposition velocity was determined by dividing the mass flux (plate) by the airborne concentration (Rotary Impactor). The deposition velocity was considered to be due to gravitational settling ( vsT) and inertial deposition (V,). Deposition to the upper plate surface (V,,“) was given by: V,, = I’s, + I’,, wbtle deposition to the lower plate surface ( VdL) was given by: V,, = - V, + V,. The inertial deposition velocity was defined as: V, = ii,, U *, where ZA is the particle effective inertial coefIIcient and U* is friction velocity. Based on these equations, ,?A was evaluated as a function of particle size as: aA= 1.12e- ao.aa’dg, where de is the particle aerodynamic diameter Quo). Tire correlation coefftcient was 0.92, EA varied from 0.1 to I.0 for particles between 5 and ffl0 +mn diameter.
The particle dry deposition fluxes obtained for the top and bottom surfaces of the plate were extended to the free atmosphere. A particle Rux ratio (FR) was defined as: Fa = V&V,,. The mass median aerodynamic diameter MUD, for the atmospheric coarse particle size distribution correlated closely with the geometric mean values of F,. The flux ratio was also related to the shape of the coarse particle mass distribution. The flux ratio was less than 0.1 for particles smaller than 3 pm diameter and did not increase significantly with wind speed. This corresponded to a minimum in the coarse particle mass distribution that was present for particles smaller than 3 pm diameter, The flux ratio was also small for particles larger than SO pm diameter but increased rapidly with wind speed. This indicated that larger particles could remain suspended under high wind speed conditions. The measured mass distributions for atmospheric coarse particles showed an increase in targer particles with an increase in wind speed. This was in accordance with the increase in the particle Rux ratio.
Key ward index: Coarse particles, deposition, particulate inertia, deposition model, particle flux, turbulent depo! W, settling velocity, inertial velocity, Stokes settling velocity, size distribution.
NOMENCLATURE
Total airborne coarse particie concentration, i.e. Rotary Impactor A stage ~~~ntration (pgrn-s) airborne coarse particle con~ntration in particle size interval i (pgrne3) datum displacement (m) aerodynamic diameter (pm) equivalent volume diameter (fit@ particle diameter (pm) projected area diameter (pm) Stokes diameter (m) mass flux of deposited particie (,ug mW2 s- ’ ) mass gux of deposited particle in size inter& i (converted from plate count data) (~gm-2s-z) mass flux of deposited particle to the bottom of deposition plate (~gm-2s-1) particle flux ratio
s -V
SV
V dL
V db
Y dU
GJ+ mass flux of deposited particle to the top of the deposition plate (~a me2 s- l) v, geometric mean ‘or atmospheric coarse particle II ux ratio distribution C, Rotary Impactor mass size intervafs (&S-IIS, IIS-24.7, 24.7-36.5, 3&S--IOOflm aerodynamic V, diameter) r;;< Van Karma& constant (0.4) mass median aerodynamic diameter of atmos- I& pberic coarse particle (pm) dynamic shape factor z
585
vomme shape factor average voIume shape factor for ail the particles deposited on the plate average wind speed at height Z (cm s-r) friction velocity (cm s- ’ ) average Friction velocity (cm s- i) average particle depositian velocity (cm s* ’ ) average particle deposition velocity in particle size interval i (ems-‘) particle deposition velocity to the bottom of the deposition plate (cm s- “) average particle deposition veIocity to the bottom of the deposition plate in particle size interval i (ems-‘f particIe deposition velocity to the top of the deposition plate (ems- *) average particle deposition velocity to the top of the deposition velocity in particle size interval i (ems-‘) particle inertial deposition velocity due to at- mospheric turbulence (cm s- t ) average particle inertial deposition velocity in parti& size interval i &ms-‘f particle g~~tationaI settling velocity (cm s- ‘) average particle settling vefocity in partide size interval i (ems-r) particle Stokes settling velocity with Reynolds number drag correction (cm s- ‘) height of wind speed measurement (m)

KENNETH E. NOLL and KENNETH Y. P. FANG
surface roughness (m) slope of particle number distribution curve geometric standard deviation of atmospheric coarse particle size distribution bulk particle density (gcme3) actual particle density (g cm- 3, atmospheric particle effective inertia coeflicient atmospheric particle effective inertia coefficient in particie size interval i atmospheric particle effective inertia coefficient in particle size interval i near the bottom of the deposition plate atmosoheric oarticle effective inertia coefficient in &tide size interval i near the top of the depo- sition plate.
INTRODUCTION
When a turbulent air stream containing suspended particles flows along a surface, particles can be depos- ited by the action of fluid turbulence, as well as other mechanisms that may be operative, such as gravita- tional settling and Brownian diffusion. For particles in the inertial deposition range, the fluid imparts a direct motion to the particles that is sufbcient to cause them to undergo turbulent deposition on the surface. For atmospheric conditions, particle inertial deposition is generally considered applicable to particles larger than a few microns (atmospheric coarse particles).
In this paper, particle inertial deposition has been quantified by determination of the atmospheric par- ticle effective inertia1 coefficient (E,). This has been accomplished by the evaluation of ex~rimental par- ticle dry deposition fluxes data collected simulta- neously on the top and bottom surfaces of a smooth plate exposed in the ambient air. These data, along with the airborne concentration of coarse particles, permit reasonable estimates of the effects of gravity and particle inertial deposition on atmospheric depo- sition velocities.
This study overcomes the major disadvantage of wind tunnel studies, i.e. the need to extrapolate to atmospheric conditions. This is important because the atmospheric turbulent regime is difficult to simulate in the laboratory. This study includes particles larger than 100 /*rn diameter because they were present in the atmospheric samples. These large particles are difficult to generate and stabilize in wind tunnel studies as seen by the upper particle size of 28 pm diameter used by Sehmel (1973).
The major disadvantage associated with conducting inertial deposition experiments in the ambient air is lack of experimental control. Turbulent deposition experiments are difficult to perform with accuracy, even under controlled conditions in the laboratory. In the atmosphere, the particle size, shape, density and total mass are uncontrolled and vary with time and location. Atmospheric turbulence is also highly vari- able and difficult to quantify. In spite of these prob- lems, the ambient data collected during this study have produced a predictive deposition model based on a statistical evaluation of the data. Large variations
for individual samples are observed however, due to the uncontrolled nature of the experiments and the need to sample over several hours, in order to obtain sufficient material to weigh. Therefore, average or ‘effective’ values are used to define the model par- ameters. Deposition velocities were ex~rimentally defined for four coarse particle size intervais and were extended to other particle sizes through the model developed to describe the data. The model includes parameters that consider the effect of gravity settling, inertial deposition and friction velocity.
The ratio of the deposition velocities to the lower and upper deposition surfaces were used to define a particle flux ratio. The flux ratio was related to the shape of the atmospheric coarse particle mass dis- tribution and provided an explanation for the peak that is present in the atmospheric coarse particle mass distribution (Lundgren et al., 1984; No11 et al., 1985). The coarse particles typically have a mass peak be- tween 10 and 30 pm diameter. An increase in the mass of the larger particles (~25 pm diameter) was ob- served when the wind speed increased. This increase was related to an increase in the flux ratio for these larger particles and also to an increase in the location of the transition zone where ,the slope of the coarse particle number distribution changes from b-3 to 8-6 (No11 and Pilat, 1971).
EXPERIME~AL DESIGN
The ex~~mental methods used in this study have been previously described (No11 and Fang, 1986; No11 et ai, 1988). The airborne concentration of coarse particles (>6.5 nm aerodynamic diameter) was measured with a Rotary Impac- tor simultaneously with the measurement of particle dry deposition fluxes to a smooth surrogate surface with a sharp leading edge, mounted on a wind vane. The deposition surface was designed to provide minimum air flow disruption and thus provides an estimate of the lower limit for dry deposition flux. The deposited particles were weighed and counted. Microscopic count data generated the mass dis- tribution of particles collected on the deposition plate. The results demonstrated that 99% of the mass deposited on the plate was due to particles larger than 2 nm diameter. Because both the measured dry deposition mass and the measured airborne concentrations were due to coarse particles, the two data sets were combined to evaluate the dynamics of at- mospheric coarse particle deposition.
Deposition giate
The deposition plate developed for this study was similar to that used in wind tunnel studies (McCready, 1986). It was made from polyvinyl chloride (PVC), 16 cm long, 7.6 cm wide and 0.55 cm thick, with a sharp leading edge (less than a ten degree angle) that was pointed into the wind by a wind vane, A two mil(O.002 inch) thick Mylar film with a dimension of 7.6 cm long and 2.5 cm wide was used as the collection surface. One film was placed on the upper surface of the plate, a second film was placed direct& below the upper film on the lower side of the plate.
Important features assumed applicable to the deposition plate (smooth, surrogate surface) are:
(A) A smooth surface produces minimum deposition vei- ocities for surrogate collectors under atmospheric conditions (Davidson et al., 1985).

Dry deposition model for coarse partick% 587
(B) An aerodynamic boundary layer that developed over a smooth, flat, acrylic plate with a sharp leading edge in wind tunnel studies (M&ready, 1986) will also be present over the same type of plate exriosed in the atmosphere. Therefore, the plate may be considered to provide a deposition environment that includes an aerodynamic boundary layer.
(C) Particles will be deposited on the surrogate plate due to interaction between the particles and the turbulent motion of the atmosphere if the particles are in the inertial deposition range.
(D) The greased surfaces prevent particle bounce.
Rotary impactor
The coarse particle airborne concentration was measured with a No11 Rotary Impactor fNol1 and Fang, 19g6). This type of inst~ment is required because coarse particles are characterized by their low number count and larger inertia. The Rotary Xmpactor is ideally suited to co&%% large par- tic&s while conventional samplers preclude iarge particles. Conventional samplers usually sample into a duct and have an upper particle size near 15 pm aerodynamic diameter that can be sampled without segregation as a function of wind speed. The Rotary Impactor collects large particles by mov- ing four rectangular collector stages of different dimensions through the aerosol at high speeds, relative to expected wind speeds. The primary advantage is that isokinetic sampling which is necessary for collecting coarse particles, occurs over a wide range of meteorological conditions.
The performance of the open face inertial impactor is a function of Stokes and Reynolds number. The collector widths and velocity of rotation, are varied to achieve different collection efficiencies. Higher velocities and smaller widths favor high efficiencies. Particles are impacted on coated Mylar film strips and each impactor stage provides a mass ~n~ntration~ based on the weight gain of the collected particles on the Mylar l&n.
For this study, the fmpactor was operated at 320 r.p.m and the data from Stage A, which collected atmospheric particles greater than 6.5 pm aerodynamic diameter was used to obtain total airborne coarse particles con~ntration. The mass median aerodynamic diameter (MM?,) was calculated for the coarse particle mass concentration drstribution, based on the measurement of the mass on the four Impactor stages.
SAMP~~G PROGRAM
Atmospheric samples were taken on the roof of a four story building (12 m height) located in a mixed institutional, commercial, and residential area on the south side of Chicago. Hourly observations of wind speed were obtained from Midway Airport, located 7 miles southwest of the sampling site.
Forty-one samples were collected between 31 July and 2 September 1986. Twenty-two daytime samples were collected from approximately 0800 to 1600 (8 h) and 19 night-time samples from 1500 to 0800 (16 h). Only 17 samples were analyzed in this study because only these samples had complete data far airborne mass and mass fluxes to the upper and lower depo- sition plate. These data have been evaluated by No11 et al. (1988).
MJZTEOROLOGICAL VARIABLES
TWO meteorological parameters that influence at- mospheric turbulence are friction velocity (u*) and
surface roughness (2,). The relationship between these psrarneters for near neutral atmospheric stabil- ity condition is:
u* z-a u=p-
-%I (1)
where U is the measured average wind speed, Z is the measured height above ground (12 m), U* is the frictian velocity and k is a constant, approximately equal to 0.4. Z, is the surface roughness taken as 0.25 m for the present site (No11 et al., 1985). d is the datum displacement. The friction velocities for wind speeds measured in this study were calculated using Equation (1).
MASS COUNT DATA FOR ~E~SI~ON
Particles collected by the deposition plate were counted with an optical microscope. Particles were grouped into seven successive size ranges of less than 3.3 pm, 3.3-5.7 pm, 5.7-12.4 pm, 12.4-18.2 pm, 18.2-35.4 pm, 3X4-70.7 pm, and greater than 70.7 pm. These size ranges were selected based on the Rotary Impactor cut size intervals. The count data were converted to a number distribution by plotting the results on log-probability graph paper as a cumulative per dent for each grdup, vs the upper size limit of that group.
A correction factor was necessary, in order to convert the count data to a particIe mass equivalent to the weight mass data. We can define:
d w=Svde (3
where dpA is the projected area diameter, Sv is the volume shape factor and d, is the equivalent volume diameter (the diameter of the sphere having the same volume as the irregular particle), for a sphere and Sv equal to unity. The count converted mass and weight mass ratio can be described as:
count ~~~(~/6)d~~ -= weight Z; p,(n/6) d:
(3)
where pb is the bulk particle density and pp is the actual particle density. Since pp is usually unknown, if we further assume pp = pb for all particles deposited, Equation (3) can be simplified to:
count Gd;?, =-““---=&
3
weight Cd:
where $ is the average volume shape factor for all the particles deposited 0~ the plate. By analysis of vari- ance far calculated Sv at the 95 per cent confidence level, there was no difference between the upper and lower plates. Therefore, an overall average sv of 1.89 20.38 was obtained for this study.
To further relate de to the Stokes diameter d, or aerodynamic diameter d,, a dynamic shape factor S, has to be applied. However, the S, values for at- mospheric particles were not readily available and can

588 KENNETH E. NOLL and KENNETH Y. P. FANG
only be determined experimentally. Adopting the ex- perimental measured Sn average val_ue of 1.41 for dust particles from Davies (1979) and Sv from the plate data in this study (1X9), the relationship between dpA and 4 for the atmospheric coarse particles become:
i&= 1.39& (5)
This correction factor allows the conversion from particle number count data to particle mass that is equivalent to the total mass weight data for each plate. The converted mass data for the plates can also be divided into particle size intervals that are equivalent to the Rotary Impactor collected mass size intervals. The individual fv value obtained from each plate (instead of the overall average <v) was used to calcu- late the correction factor in Equation (5) for appli- cation to each sample. Detailed information about count/mass conversion was described by No11 et al. (1988).
The shape factors determined in this study agree well with the experimental values measured by Stein et nl. (1969). Their measurements did not indicate a systematic variation in shape factor with size (Stein et al., 1966) which supports our use of an average correction factor independent of size. However, there was a large variation in shape factor from sample to sample (1.40-3.15). This also agrees with the work of the other investigators. The variation in shape factor certainly accounts for some of.the data scatter in Figs 1 and 2 because variations in the shape factor can cause variations in the calculated particle size. This is
- LINEAR REGRESSION, r*=ab
---- 95XC.f.
--- BEST FIT CURVE. rz=0.8
Fig. 1. Comparison of the _experimentally determined average settling velocities (V&) and theoretical Stokes . settlmg velocltles (V&).
do, w
Fig. 2. Atmospheric coarse particle effective inertial coefficient as a function of particle
size.
one reason why ‘effective’ parameters based on the statistical correlation ofthe data are used in the model.
MODEL DEVELOPMENT
Most particle deposition models that consider turbulent removal are based on Friedlander and Johnstone’s (1957) work. For particles larger than 1 hrn diameter, the predominant deposition mechan- ism in vertical pipes has been shown to be particle inertia (Liu and Agarwal, 1974). These investigators considered that particles were transported from the center of a vertical pipe toward the wall by turbulent fluctuations normal to the mean flow. Particles had to traverse the viscous sublayer adjacent to the wall in order to be deposited. It was argued that particles are injected into the sublayer with a velocity approxi- mately equal to 0.9 U*, and that deposition occurs when particle inertia resulting from this initial velocity is sufficient to carry the particles across the sublayer and onto the wall. However, Owen (1967) suggested that larger particles are convected to the surface from the region of energetic turbulent motion outside the viscous sublayer by the occasional large eddies that encroach on it. The eddies that transport particles toward the surface can be thought of as occurring in response to the sporadic violent eruption from the viscous sublayer, as observed by Kline et al. (1967). This concept is similar to that observed by Joukowski as described in Goncharov’s book (1964), that the particles are convected across the sublayer by the advancing of elliptical eddies that originate from the turbulent vortex flow outside the sublayer. Slinn (1976) further proposed a deposition model based on these concepts and calculated the empirical viscous jet impinge collection efficiency. Despite the diverse argu- ments about how particles actually cross the viscous

Dry deposition model for coarse particks 589
sublayer and deposit onto a surface, it is clear that the particle turbulent deposition velocity is closely related to the magnitude of the fluctuation of fluid eddies in the main stream. Large particles that encounter these turbulent eddies are provided with sufficient inertia to cross the sublayer and deposit. For horizontaf sur- faces, gravitational settling is also important (Sehmel, 1971). Sehmel(l973) has developed a deposition mo- del for the prediction of atmospheric particle depo- sition. The model uses a particle eddy diffusion coefficient determined from wind tunnel studies for the inertial deposition range (> 1 p diameter).
In this section, a model is developed for prediction of atmospheric coarse particle deposition to a smooth, horizontal surface. The model is based on the assump- tion that an aerodynamic boundary layer with equal boundary layer thickness developed near the top and bottom surfaces of the deposition plate that was exposed in the ambient air. The deposition plate has been designed to provide a quasi-laminar sublayer which is as small as possible. Thus the influence of the plate geometry on the partide motion in the vicinity of the plate is small. Using these assumptions~ the mass of deposited material to the upper and lower plate surfaces can be used to (i) measure particle deposition and (ii) separate the contribution of particle depo- sition due to gravitational settling and turbulent depo- sition.
F,;sdry deposition mass flux in particle size interval i (converted from plate count data)
C,,=airbome concentration in particle size intec- val i
i= Rotary Impactor stage’s cut size intervals (62-l $2, 11.~24.7, 24.7-36.5, 36.5-100 ,um aerodynamic diameters).
The subscript, i, indicates the particle size interval. fn this case there are four size intervals that corre- spond to the particle size intervals obtained for the airborne concentration with the Rotary Impactor. These particle size intervals are also obtained for the deposition plate data by counting the particles collec- ted on the plate and converting to a count mass distribution equal to that for the Rotary Impactor (see Experimental section in No11 et al., 1988).
Efict of inertia on particle behavior near the deposition plates
The deposition velocity for particles adjacent to a smooth surface can be characterized as (~ham~rIain~ 1960):
For supermicron particles we expect that the up- ward facing @ate will collect particfes deposited by s~rne~~t~on and inertia1 motion across the sublayer. In contrast, the downward facing plate wilt collect only those particles whose upward inertial motion is great enough to overcome sedimentation. Assuming equal turbulent air motion on both sides of the plate, the deposition velocities can be represented by:
$$; 0
mass flux (ta smoothed, greased deposition plate) =
airborne concentration (Rotary Impactor)
(6)
where
Yd”dcr= I$s+ v, (upper plate) (8)
I&_= - V,+ V, (lower plate). (9)
Where V,, and V,, are deposition velocity to the upper and lower deposition surface, respectively. Equations (8) and (9) can be further written to corre- spond to the Rotary Impactor size interval as follows:
VdUi = v,, + 6‘ (upper plate) (10)
Y& = - Ys, + Pr (Iower ptate) (IV
where c, = average atmospheric particle deposition veloc-
ity (ems-‘) F= total dry deposition mass flux from weight
(pgcm-as-l)
I&,,, &, = average deposition velocity to upper and lower deposition surface in particle size interval i
CO = total airborne concentration (pg cm- 3). Fs, = average particle settling velocity in particle size interval i
The particle deposition velocity is a function of particle diameter. Therefore, for a parMe size dis-
&=average particle inertial deposition velocity due to atmospheric turbulence in particre size inter-
tribution: val i.
count mass flux in particle size interval =
airborne concentra~on in particle size interval
(7)
where
F,,=average deposition velocity in particle size interval i
‘Effective” or average condition for the particle size interval i and experimental sampling time is indicated by the bar over the various terms.
As indicated in the Introduction to this section, the inertial deposition velocity has been investigated by many investigators and they have shown that both particle inertia and turbulent intensity_~nt~bu~ to particle deposition velocity and that V,, can be rep- resented by:
V,,=E;, ti* (12)

590 KENNETH E. NOLL and KENNETH Y. P. PANG
where
ZA, = atmospheric particle effective inertial coeffic- ient for particle size interval i
V * = average friction velocity.
Equation (12) assumes that atmospheric turbulent is sufficient to provide a uniform particle concentra- tion at the top of the boundary layer near the plate surface. The friction velocity, ii*, is a measure of the turbulent intensity of the air and is indicative of the particle free flight velocity, imparted by the turbulent air at the edge of the boundary layer toward the deposition surface. However, this physical description is merely an approximation to the true complex process by which particles reach the plate. Neverthe- less, the physical description is a useful way to view inertial deposition and allows the development of a simple model that can be evaluated by collection of atmospheric turbulent deposition data. It is assumed that Vs increases as dz while V, increases with d, in a more complex manner (VI increases monotonicaily with turbulence intensity, U*, and particle size). c* values can be calculated based on measured average wind speed, surface roughness and height of measure- ment (Equation 1). This leaves only the particle iner- tial coefficient as an unknown, which can be evaluated as a function of particle size.
MODEL EVALUATION
An important parameter obtained from the sub- traction of the deposition Equations 10 and 11 for the upper and lower plate is the experimental value of the average gravitational deposition velocity (vsi) as a function of particle size. These gravitational depo- sition velocities can be compared to theoretical gravi- tational deposition velocities obtained by application of Stokes Law. Figure 1 shows a comparison of the experimentally determined average settling velocities (&J obtained from the plate data and theoretical settling velocities (V&) obtained from the application of Stokes Law. In order to provide the comparisons, a linear relationship was assumed between the two sets ofdata. The data have a slope of one at the 95 per cent confidence level. The correlation coefficient between the two data sets is 0.6. There is considerable variation for individual samples as shown by the jndividual data points in the figure. Even though the data in Fig. 1 showed a significant lack of fit when a linear relation- ship is assumed and suggests that an exponential relationship would better fit the data (r2=0.8), as discussed in the Introduction, we believe that much of this can be attributed to experimental problems asso- ciated with the uncontrolled nature of the atmospheric experiments and not to problems with the model. This includes variations in particie mass, shape, density and size distribution and the need to use average density and shape factor when converting from plate count data to equivalent mass data. Variations in atmos-
pheric turbulence are also difficult to document and average over the sampling time needed for sample collection. In order to avoid the problem with data scatter shown in Fig. 1, the calculated Stokes law settling velocity will be used in the deposition model.
Let us take another look at Equations (8) and (9). If the inertial deposition mechanism is the same to the top and bottom of the plate, then the values of .ZAUI (top surface) and s,,~ (bottom surface) in the mode1 will be equal. Equation (10) and (11) can be rearranged to -provide EAu, =_( Vdui - P&U* and &,, =( V&, + V&)/U*, where V,, is the particle settling velocity (theoretical Stokes settling velocity is assumed to apply). A statistical analysis of the data showed that there was no significant difference between &, and
%L, at the 95 per cent confidence interval. This conclusion supports the assumption that particles experience the same inertia1 deposition near the top and bottom surface of the plate, i.e. the resistance due to the viscous sublayer on particle transport to the plate is statistically the same on both sides of the plate.
Figure 2 shows a plot of =$ obtained by adding the data from the upper and lower deposition plate (Equa- tions 10 and 11) as a function of particle diameter. A exponential curve fit to the data produced the equa- tion:
,A=1.12e-30.36/d.. 03)
Where & is defined as the atmospheric particle effec- tive inertial coefficient and da is particle aerodynamic diameter (pm). The correlation comment was 0.92. Again, there is considerable scatter for individual data points due to the uncontrolled nature of the exper- iments. ZA can be considered as an inertia1 coefficient to be applied to the maximum potential particle turbulent deposition velocity (equal to the fluid turbu- lent velocity, U*) at the top of the boundary layer. Therefore, 5, can be expected to vary between zero and one and a non-linear fit was assumed for the correlation. Zero represents no inertial interaction while one represents maximum inertial interaction between the particle and the turbulent fluid. Figure 2 shows that turbulent interactions for the atmospheric particles begins at about 5 pm diameter (EA ‘v 0.1). The inertial interaction increases rapidly with particle size up to about 100 ,um diameter, after which it is nearly constant (En N 1.0). Therefore, the atmosphe~c coarse particle size range of importance to inertial deposition begins at about 5 pm diameter. The inertial deposition velocity depends on both 5* and U * between 5 and 100 pm diameter and is a function of U * only above 100 pm diameter.
MODEL APPL~~A~O~
Figure 3 is a plot of coarse particle dry deposition velocity in a general form for Equation (8):
vdu= vs,+~Au*. (14)

Dry deposition mode! for coarse particles
da 3 PM
Fig. 3. Model calculated deposition ve- locities to the upper surface of the depo- sition plate as a function of particle size
and friction velocity.
this equation uses theoretical Stokes gravitational settling velocities with Reynolds number drag correc- tion and &, from Equation (13). This figure represents the deposition velocity to a smooth, flat, greased surface under atmospheric conditions as a function of particle size and friction velocity. For particles of a few micron, inertial deposition begins to become signifi- cant and results in a value of P’& above that expected by gravitational ~d~rnen~~on itlone. The influence of inertial deposition reaches a maximum at about 40 pm. For superlarge particles, settling velocity be- comes increasingly dominant.
Figure 4 presents upward coarse particle velocities in a general form for Equation (9):
v&.= - v,ss,u*. ($5)
Again, using theoretical set&g velocities and EA from Equation (13). The unusual shape of the curve in Fig. 4 merits discussion, Smait particles have little inertia, and are therefore unable to overcame gravitational settling velocities to cross the boundary layer and deposit onta the bottom plate. Very large particles have considerable inertia but also considerable gravi- tational settling velocities, they are unable to travel across the boundary layer. However, particles between these two extremes have sufficient inertia to carry them upward across the sublayer before gravitational settling changes their direction, and some of them can reach the bottom plate. The interaction between 5, and U* can be seen to be dominate in this figure for particles between 5 and 100 pm diameter.
Figure 5 shows a comparison of the average depo- sition velocities to the upper and lower surface for the 17 samples evaluated in this study (average fi* of 32 ems-I) to data from other investigators. Also shown in this figure, are model predictions using Equations (14), (15) and Sehmel’s model. The figure shows that the most important advantage to using
LOWER PLATE
Fig. 4. Model calculated deposition veloci- ties to the bottom surface of the deposition plate as a function of particle size and friction
velocity.
SEHMEL. 1973 (rf-*tCI’VS) -I” FLOOR WRFilCE VK?JlH CElLlffi SURFACE
Fig. 5. Comparison of the average depo- sition velocities to the upper and lower plate to Sehmel’s model and other inves-
tigators’ data.
Equations (14) and (15) is the abiEty to predict the deposition velocity for /arge, particfe sizes (i.e. > 30 pm diameter). These particles have a significant deposition velocity? due to inertial deposition, that is not accounted for in Sehmel’s model. The deposition velocities to the bottom surface are much higher than those obtained from Sehmel”s wind tunnel studies for deposition to a coated, smooth ceiling surface.
The atmosphere is a large mixing chamber where particles generated from all sources are brought to- gether. The observations that large particles can be transported great distances and that atmospheric

592 KENNETH E. NOLL and KENNETH Y. P. FANG
coarse particles generally have a mass peak near 15 pm diameter lead one to consider extension of the concepts developed in this paper to particle behavior in the free atmosphere far from deposition surfaces. This behavior can then be used to help understand deposition on the ground.
Figure 6 shows hypothetical paths traversed by particles of three different sizes in the free atmosphere. Very small particles with no significant inertia will tend to follow the air eddies completely. For these particles, deposition to the ground is rate-limited by transport across the sublayer and interaction with the surface. Very large particles will ignore air eddies and will simply deposit to the ground under the influence of gravity. Particles of intermediate size, however, will follow the air eddy to a certain extent, but will also tend to continue moving along straight lines when the air changes direction.
The inability of intermediate-sized particles to fol- low air eddies can influence the atmospheric residence times of these particles. Consider that particles have roughly equal probabilities of traveling upward or downward on air eddies. Particles traveling down- ward near the ground will tend to deposit more quickly than smaller particles, while particles traveling upward will tend to continue their upward motion slightly longer. This upward motion (essentially a measure of 5) can far exceed gravity; in fact, the V,& is greatest for these intermediate-sized particles. This was illustrated in Fig. 4 for the deposition plates, but it applies equally well to particles crossing a horizontal plane at any height above the ground.
Since vertical wind speeds in both positive and negative directions increase with height, it follows that
inertia effects on particles will also increase with height for motion in both directions. Any upward motion will carry the particles into regions of larger eddies and faster winds, promoting their ability to remain sus- pended in the atmosphere. Because inertial effects dominate over gravity for intermediate-sized particles at sufficient wind speeds, we might expect such par- ticles to remain airborne for longer time periods than smaller particles with lower values of Vd.
Based on the concepts developed above, it is pos- sible to relate the information obtained from the top and bottom surface of the plate to the particle behav- ior in the free air when no plate is present. A particle flux ratio (FR) can be defined as follows:
where F, is particle upward flux and F, is particle downward flux. A small value of F, means that the upward flux is much smaller than the downward flux and particles are likely to deposit to the ground. While a large value of S, means that particle upward flux is comparable to the downward flux and particles can be transported horizontally longer distances.
Figure 7 shows a plot of the flux ratio as a function of particle size and atmospheric turbulence (U*). It can be seen that there is a maximum in the curves at 15 pm diameter for all U* conditions. This corre- sponds to the inflection point in the I, curve in Fig. 2, which also is at 15 pm diameter. As the friction velocity increases from 10 to 30 cm s- ’ the maximum in the particle flux ratio increase from 0.38 to 0.74 for 15 ,um diameter particles.
v VI :,I
VST +’ vI 0
“I VST I I VI
5um 201im IOOum
Fig. 6. Hy~theti~l paths travel by particles of three different sizes in air eddies (at U+ = 15 ems-‘). (a) The vectors in the figure are not to scale but are proportions within each size range. (b) Only the 20 pm particle have a resultant velocity (V,) that is up due to turbulence. (c) The 20 pm V, vector is + 95 x of the
5 pm vector and - 3 x of the 100 pm vector.
Dry deposition model for coarse particles 593
t
NOLLS ROTARY IMPACTOR STAGE lNTEWPL
/.A-a+ B-c++--- D
IO -4
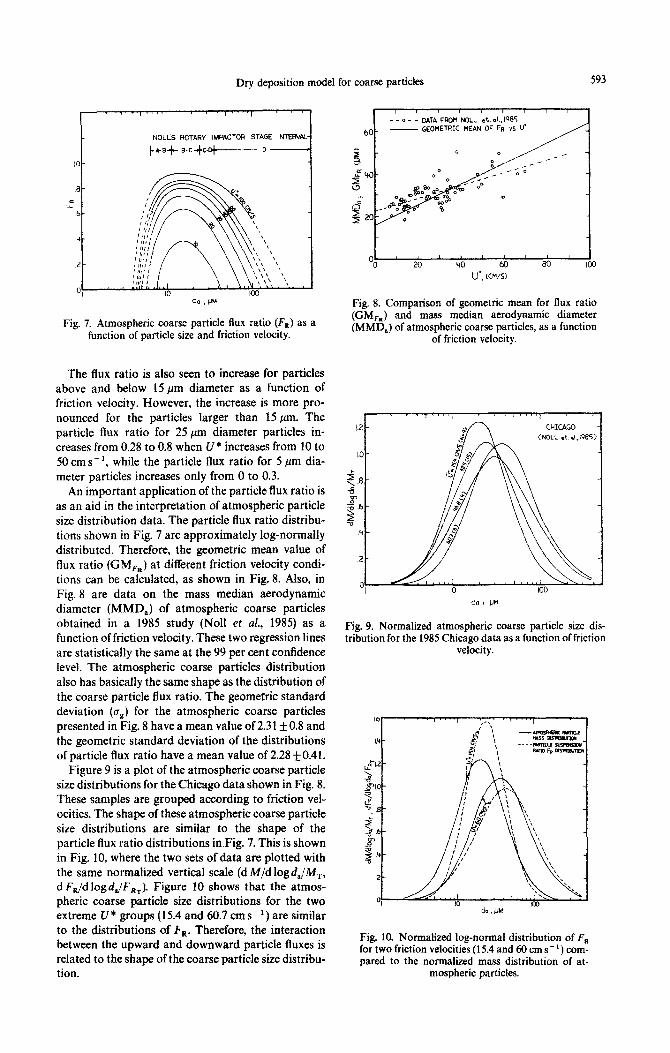
Fig. 7. Atmospheric coarse particle flux ratio (FR) as a function of particle size and friction velocity.
The flux ratio is also seen to increase for particles above and below 15 pm diameter as a function of friction velocity. However, the increase is more pro- nounced for the particles larger than 15 pm. The particle flux ratio for 25 pm diameter particles in- creases from 0.28 to 0.8 when U* increases from 10 to 50cms-‘, while the particle flux ratio for 5 pm dia- meter particles increases only from 0 to 0.3.
An important application of the particle flux ratio is as an aid in the interpretation of atmospheric particle size distribution data. The particle flux ratio distribu- tions shown in Fig. 7 are approximately log-normally distributed. Therefore, the geometric mean value of flux ratio (GM,,) at different friction velocity condi- tions can be calculated, as shown in Fig. 8. Also, in Fig. 8 are data on the mass median aerodynamic diameter (MMD,) of atmospheric coarse particles obtained in a 1985 study (No11 et al., 1985) as a function of friction velocity. These two regression lines are statistically the same at the 99 per cent confidence level. The atmospheric coarse particles dist~bution also has basically the same shape as the distribution of the coarse particle flux ratio. The geometric standard deviation (og) for the atmospheric coarse particles presented in Fig. 8 have a mean value of 2.31+ 0.8 and the geometric standard deviation of the distributions of particle flux ratio have a mean value of 2.28 + 0.41.
Figure 9 is a plot of the atmospheric coarse particle size dist~butions for the Chicago data shown in Fig. 8, These samples are grouped according to friction vel- ocities. The shape of these atmospheric coarse particle size distributions are similar to the shape of the particle flux ratio distributions in.Fig. 7. This is shown in Fig. 10, where the two sets of data are plotted with the same normalized vertical scale (d M/d log d.JM,, d FJdlogdJF,,). Figure 10 shows that the atmos- pheric coarse particle size dist~butions for the two extreme U * groups (15.4 and 60.7 cm s - 1 ) are similar to the distributions of FR. Therefore, the interaction between the upward and downward particle fluxes is related to the shape of the coarse particle size distribu- tion.
Fig, 8. Comparison of geometric mean for flux ratio (GM,) and mass median aerodynamic diameter (MMD,) of atmospheric coarse particles, as a function
of friction velocity.
do I UN
Fig. 9. Normalized atmospheric coarse particle size dis- tribution for the 1985 Chicago data as a function of friction
velocity.
Fig. 10. Normalized tog-normal distribution of FR for two friction velocities (15.4 and 40 cm s- ’ ) com- pared to the normalized mass distribution of at-
mospheric particles.

594 KENNETH E. NOLL and KENNETN Y. P. FANG
CONCLCJSIONS REFERENCES
An experimental method that employs a smooth deposition plate with collection on the top and bottom surfaces has been used to measure the atmospheric particte inertial coefficient. The coe%cient is a funda- mental parameter that can be used to quantify the effect of inertia on the deposition of atmospheric coarse particles. This study has demonstrated that there is both a downward and upward flux for at- mospheric coarse particles. The two fluxes are related to the inertial deposition velocity and increase with particle size and wind speed. The main conclusions that can be obtained from the application of this inertial coefftcient can be summa~~d as follows:
Chamberlain A. C. (1960) Aspects of the deposition of radioactive and other gases and particles. In Aerodynamic Cuprure of Particles (edited by Richardson E. G.), pp. 63-88. Fergamon Press, Oxford.
Davidson C,r., Lindberg S. E., Schmidt J. A., Cartwright L. G, and Landis L. R. 11985) Dry deposition of sulfate onto surrogate surfaces. j. geiphyi. Rek 9t_?, 2123-2130.
Davies C. N. (1979) Particle-fluid interaction. J. Aerosol SC!. 10,477-513.
Friedlander S. K. and Johnstone W. F. (1957) Deposition of suspended particles from turbulent gas streams. Ind. Eng.
Chem. 49, 1151-1156.
Goncharov V. N. (1964) Dynamics o~.C~~~ne~ Fkw. Trans- lated from Russian and Available from NTIS as OTS 64. I 1003,3-X
KIine S, J., Reynolds W. C., Schraub F. A. and Runstadler P. W. (f967) The structure af turbuient boundaiy layers. J. Fluid Mech. 30, 741-773. f4
09
(Cl
(Di
The particle inertial deposition velocity is sig- nificant for atmospheric particles larger than about 5 pm diameter. The particle inertial deposition velocity is a function of friction velocity and atmospheric particle inertial coefficient for particles between 5 and 100 pm diameter but only a function of friction velocity for particles larger than 100 pm diameter. The upward particle deposition flux divided by the downward particle deposition flux can be related to the shape of the atmospheric coarse particle size distribution. The peak in the flux ratio distribution corresponds to the peak in the atmospheric coarse particle mass distribu- tion. The Aux ratio and the MMD, of coarse particles show a similar increase with friction velocity. The small value of the particle flux ratio for particles below 5 ,um diameter produces a mini- mum in the coarse particle mass distribution for particles in the 1-5 pm diameter range. This minimum is present even at high friction vel- ocities.
It must be emphasized at this point that the model presented in this paper needs to be further evaluated by collection of data at other locations. This is necess- ary because of the large variation in the ambient air data used to evaluate the model (Figs 1 and 2). The peak in F, (Fig. 71, and the interpretation of the peak in the atmospheric aerosol spectrum, depends on the linear and non-linear data evaluations presented in Figs 1 and 2, respectively. However, the deposition model permits reasonable estimates of the effect of turbulent inertial deposition on atmospheric depo- sition velocities based on the use of an ‘effective’ atmospheric particle inertial coefficient determined from a statistical correlation of the ambient air data. The usefulness of the model is shown by the fact that model predictions of devotion velocity are cornpar- able to deposition velocities measured in wind tunnels (Fig. 5).
Liu B. Y, H. and Agarwal J. K. (1974) Experimental observa- tion of aerosol deposition in turbulent flow. J. Aerosol Sci.
5, 145-155. Lundgren D. A., Hausknecht B. J. and Burton R. M. (1984)
Large particle size distribution in five U.S. cities and the effect of a new ambient particulate matter standard (PM t *f. Aerosol Sci. Technoi. 3,46747X
Mc&readv D. I. 119861 Wind tunnel modefine of small particle deposition. Aerosol Sci. Tech&. 5, 30%3 12
McMahon T. A. and Qenison F. J. (1979) Empirical at- mospheric deposition parameters-a survey. Atmospheric
Enoironment 13, 571-585. Nell K. E. and Pilat M. J. (1971) Size distribution of
atmospheric giant particles. Atmospheric Enuironmenf 5,
527-540. No11 K. IE., Fontius A., Frey R. and G&d M. (1985)
Comparison of atmospheric coarse particles at an urban and non-urban site_ Atmospheric E~~~r~~~~f X9$
1931-1943. Nell K. E. and Fang K. Y. P. (1986) A Rotary fmpadtor for
size selective sampling of atmospheric coarse particles, Paper presented at the 79th Meeting, Air Pollution Con- trol Association, Minneapolis, Minnesota. paper No. 86-
Noy2k. E., Fang K. Y. P. and Watkins L. A. (1988) Characterization of the deposition of pa&&s from the atmosphere to a Rat plate. Afmospkrie ~~~ir~n~~f 22, 1461-1468.
Owen P. R. (1969) Pneumatic transport. J. F&d Me&. 39, 407-432.
Sehmel G. A. (1971) Particle diffusivities and depositicm velocities over a horizontal smooth surface. J. Colloid Interface Sci. 37,891-906.
Sehmel G. A. (1973) Particle eddy diffusivities and deposition velocities for isothermal flaws and smooth surfaces. J. Aerosot Sci. 4, 125-138.
Siinn W. 6. N. (1976) Dry deposition and resuspension of aerosol particles--a new look at some OM problems. In Afma~p~er~S~~~e Exchange of P~f~~~~~fe and Gaseous
Pollutants-1974 {co-ordinated by Engelmann R. J. and S&me1 G. A.), pp. l-40. ERDA Symposium Series, CONF-740921, available from NTIS, Springfield, VA.
Stein F., Quinlan R. and Corn M. (1966) The ratio between projected area diameter and equivalent diameter of par- ticulates in Pittsburgh air. Amer, ind. Hyg. Ass. J. 27, w-&l __ .-.
Stein F., Esmen N. A. and Corn M. fl969) The shape of atmospheric part&s in Pittsburgh air. Afm#~p~ric En- oironmefft 3, 443-453.