development and validation of liquid … indian journal of pharmaceutical ... development and...
TRANSCRIPT
558 Indian Journal of Pharmaceutical Sciences September - October 2011
*Address for correspondence E-mail: [email protected]
Development and Validation of Liquid Chromatography-Mass Spectrometry Method for the Estimation of Rifampicin in PlasmaJ. S. PATIL*, SARASIJA SURESH1, A. R. SURESHBABU2 AND M. S. RAJESH3
Department of Pharmaceutics, BLDEA’s College of Pharmacy, BLDE University Campus, Bijapur-586 103, 1Pharmaceutics, Al-ameen College of Pharmacy, Hosur Road, Near Lalbhag Main Gate, Bangalore-560 027, 2Bioanalytical/ DMPK, G-7 Synergon Pvt. Ltd., Tata Nagar, Sahakara Nagar, Bangalore-560 092, 3Pharmacology, Government College of Pharmacy, 2-P, Kalinga Rao Road, Subbaiah Circle, Bangalore-560 027, India
Patil, et al: Plasma Estimation of Rifampicin by LCMS/MS Method
A selective, rapid and sensitive liquid chromatography-mass spectrometry method was developed for the quantitative estimation of rifampicin in plasma. With phenacetin as internal standard, sample pretreatment involved a one-step extraction with ethyl acetate from plasma. The sample was analyzed using methanol: 2mM ammonium acetate: 80:20 v/v as mobile phase. Chromatographic separation was achieved on a BDS Hypersil Gold C
18 column which
was followed by detection with mass spectrometry. Linear calibration curves were obtained in the concentration range of 5.021-1008.315 ng/ml. The inter- and intra-day accuracy values were below 15% at all quality control levels. Percent recoveries for rifampicin at high, middle and low quality control samples was obtained 55.15, 48.65 and 49.62%, respectively and for internal standard was 60.22%. Rifampicin was found stable through all validation parameters. Developed method was found to be simple, precise, accurate and rapid for estimation of rifampicin in plasma. Thus, the method can be employed for routine pharmacokinetic and bioequivalence studies.
Key words: Liquid chromatography mass spectroscopy, plasma, rifampicin
Research Paper
Rifampicin (3-[4-methyl piperazinyl-iminomethyl] rifamycin) is a first-line semi-synthetic agent along with isoniazid and pyrazinamide in the treatment of pulmonary and extrapulmonary tuberculosis[1,2]. Method of estimating drugs in biological fluids are increasingly important problems related to bioavailability and bioequivalence studies, new drug development, drug abuse, clinical pharmacokinetics and drug research are highly dependent on accurate estimation of drugs in biological fluids[3]. The literature survey revealed that only few HPLC methods are available for estimation of rifampicin (RIF) in human plasma involving solid phase extraction, precipitation or liquid-liquid extraction[4-8]. However, the reported methods are not ideal for large number of sample determination as either tedious, arduous sample preparation and long chromatographic run time of 10-15 min. A few LCMS/MS methods are also reported to estimate the rifampicin in biological
fluids[9]. Compared to HPLC, liquid chromatography mass spectroscopy (LCMS/MS) is considered to the more suitable technology since this provides higher peak capacity, increased sensitivity, high speed of analysis, powerful and rugged method. The present study describes development and validation of a new, simple, rapid, precise, sensitive and accurate LCMS/MS method for the determination of rifamicin in plasma.
MATERIALS AND METHODS
Pure RIF (working standard, 99.8% of purity) and phenacetin (PHN) (Internal standard, 99.4% of purity) drug substances were obtained as gift samples from Micro Labs, Bangalore, India, Methanol and ethyl acetate used were of HPLC grade obtained from Merck, Mumbai India. The chemicals, ammonium acetate, sodium citrate were of analytical grade purchased from S. D. Fine Chemicals. High purity water was prepared through a Milli-Q water purification system. Blank sodium citrate pooled plasma was stored at -80º prior to use.
www.ijpsonline.com
September - October 2011 Indian Journal of Pharmaceutical Sciences 559
Instrumentation and chromatographic conditions:The liquid chromatographic system (Triple Quadrupole LCMS 6410, Agilent technologies) equipped with binary solvent manager, column manager, auto sampler with turbo spray positive polarity detector. The separation of the compounds was made on a BDS Hypersil Gold C18 (3×50 mm) column. A mixture of methanol: 2 mM ammonium acetate::80:20 v/v was used as mobile phase and was filtered through 0.45 μ membrane filters before use and degassed in an ultrasonic bath. All analysis was performed under isocratic condition at a flow rate of 0.2 ml/min without splitter (Binary flow) at ambient temperature and the sample volume injected was 5 μl with run time of 2.5 min.
Preparation of standards and quality control samples:Standard stock solution of RIF and PHN were prepared in a mixture of methanol and water (50:50% v/v) at the concentration of 1000 μg/ml. The internal standard solution was further diluted to prepare the working solution with a final concentration 0.5 μg/ml. The stock solution of RIF was then serially diluted with methanol and water (50:50% v/v) to provide working standard solution of desired concentration. Calibration standards were prepared by spiking of blank plasma with RIF working standard solutions. The effective concentration in standard plasma samples were 5.021, 10.043, 50.214, 100.428, 241.996, 806.652 and 1008.315 ng/ml each containing 500 ng/ml of PHN solution as an internal standard. The quality control sample (QCs) was prepared with plasma at low, middle and high concentration of LQC (50.691 ng/ml), MQC (482.769 ng/ml) and HQC (804.615 ng/ml).The standards and quality controls were extracted with the same procedure for plasma samples as described below.
Plasma sample preparation:Required set of calibration curve standard and QCs along with subject samples were withdrawn from freezer or deep freezer and allowed them to thaw at room temperature. Thawed samples were vortexed to ensure complete mixing of contents. Pippeted out 100 μl of samples in to respectively labeled vials and 50 μl of internal standard (0.5 μg/ml) was added into respectively labeled vials and vortexed. 0.5 ml of extraction solvent (ethyl acetate) was added to all the vials, capped and kept on a vibramax for 10 min at 2500 rpm. All the samples were
centrifuged at 10000 rpm for 5 min in a refrigerator centrifuge. Transferred 0.4 ml of organic layer into respectively labeled vials and evaporated to dryness under nitrogen at 40º. Separated residue was reconstituted with 100 μl of mobile phase and vortexed. The reconstituted samples were transferred in to respectively labeled auto injection vials. 5 μl of test and standard solutions were injected separately into LCMS/MS system.
Data processing:The chromatograms were acquired using the computer based Analyst software supplied by Agilent techniques. The data was processed by peak area ratio. The concentration of the unknown was calculated from the following method using regression analysis of spiked calibration standard with the reciprocal of the square of the drug concentration as weighing factor (1/concentration × concentration). The concentration of the analyte in unknown sample was calculated using calibration curve developed using standard rifampicin.
Validation procedures:Validation runs were conducted on three consecutive days. Each validation run consisted of a minimum of one set of calibration standards and six sets of QC plasma samples at three concentrations.
Linearity and lower limits of quantification (LLOQ):Calibration curves were prepared by assaying plasma samples at eight concentrations of RIF ranging 5.021-1008.315 ng/ml. The linearity of each calibration curve was determined by plotting the peak area ratio(y) of RIF to PHN versus the nominal concentration (x) of RIF. The calibration curves were constructed by weighed (1/x) least square linear regression. The limit of detection was defined, as analyte responses are at least five times the response compared to blank responses. The lowest standard on the calibration curve was defined as limit of quantification as an analyte peak was identifiable, discrete and reproducible with a precision of less than or equal to 20% and accuracy of 80-120%.
Precision and accuracy:The method precision and accuracy were evaluated by using replicate analysis of QCs at three concentrations of LQC, MQC and HQC. Intra-day evaluation was done on the same day, whereas inter-day was done
www.ijpsonline.com
560 Indian Journal of Pharmaceutical Sciences September - October 2011
on three consecutive days. The mean concentration, standard deviation (SD) and coefficient of variation (%CV) were evaluated.
Extraction recovery:According to the guidance of USFDA[10,11], recovery analysis was repeated for six replicates at three concentrations (LQC, MQC and HQC). The extraction recovery of RIF from spiked samples were determined by comparing the peak areas obtained by extraction of freshly prepared plasma extracts with those found by direct injection of an aqueous standard solution at equivalent concentrations.
Stability:The bench top stability (BT4) was evaluated by keeping replicates of the LQC and HQC samples at room temperature for approximately 4 h. Freeze-thaw stability (FT4) of the samples was obtained over four freeze-thaw cycles, by thawing at room temperature for 4 h. For each concentration, six replicates were analyzed in one analytical batch. The concentration of rifampicin after each storage period was related to the initial concentration as determined for the samples.
RESULTS AND DISCUSSION
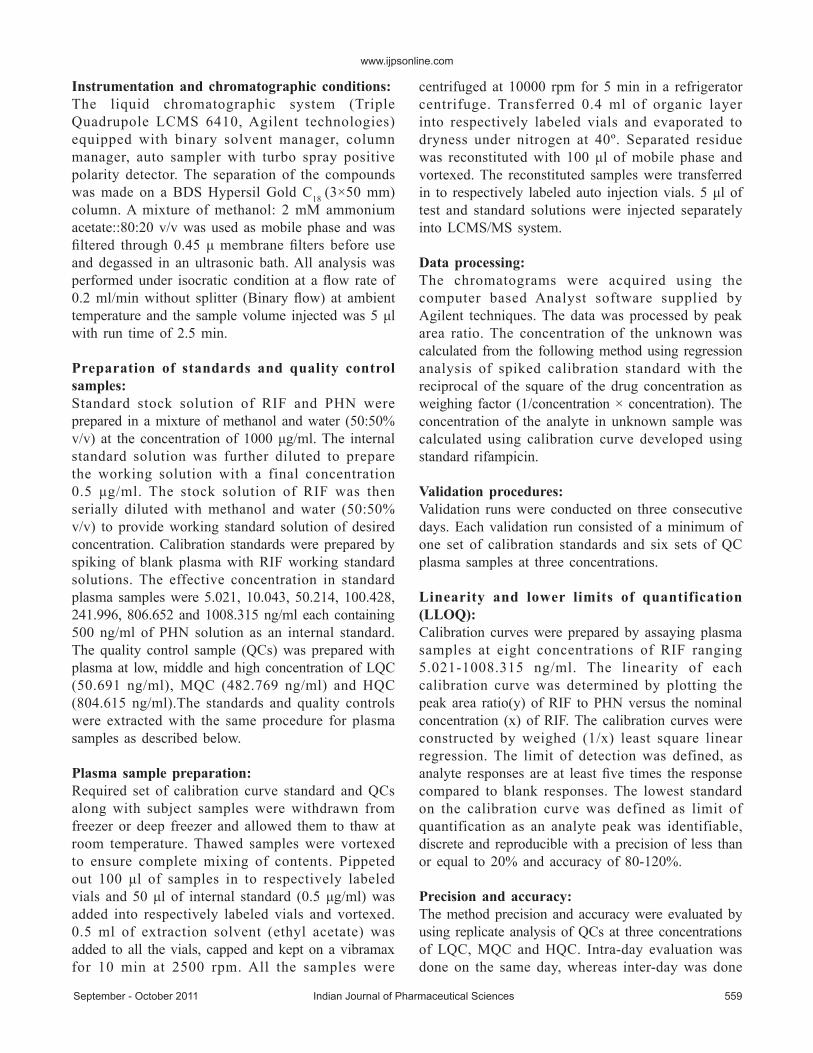
Under the chromatographic conditions described above, both RIF and PHN were readily eluted with retention times of 1.54 and 1.70 min respectively (fig. 1). The analysis time for rifampicin in literature by HPLC method was in the range from 10-15 min[5,6]. The short analysis time may meet the requirement for high sample throughput in bioanalysis. The method is highly economic in terms of solvent consumption
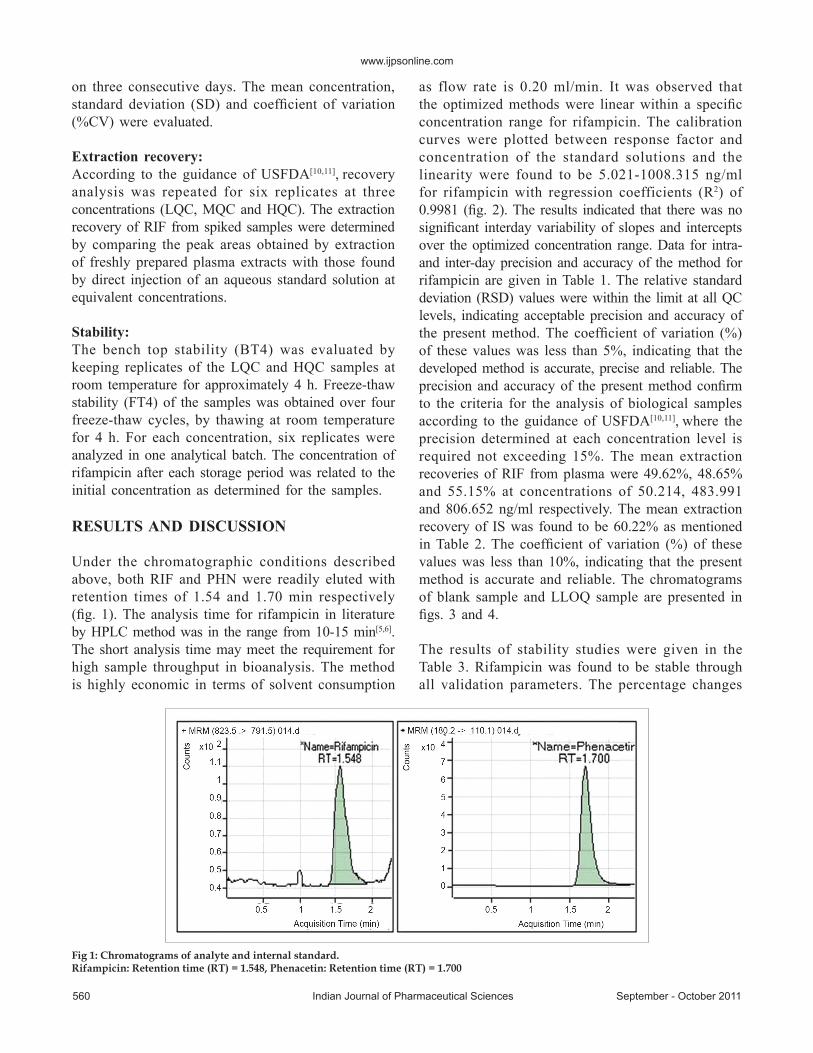
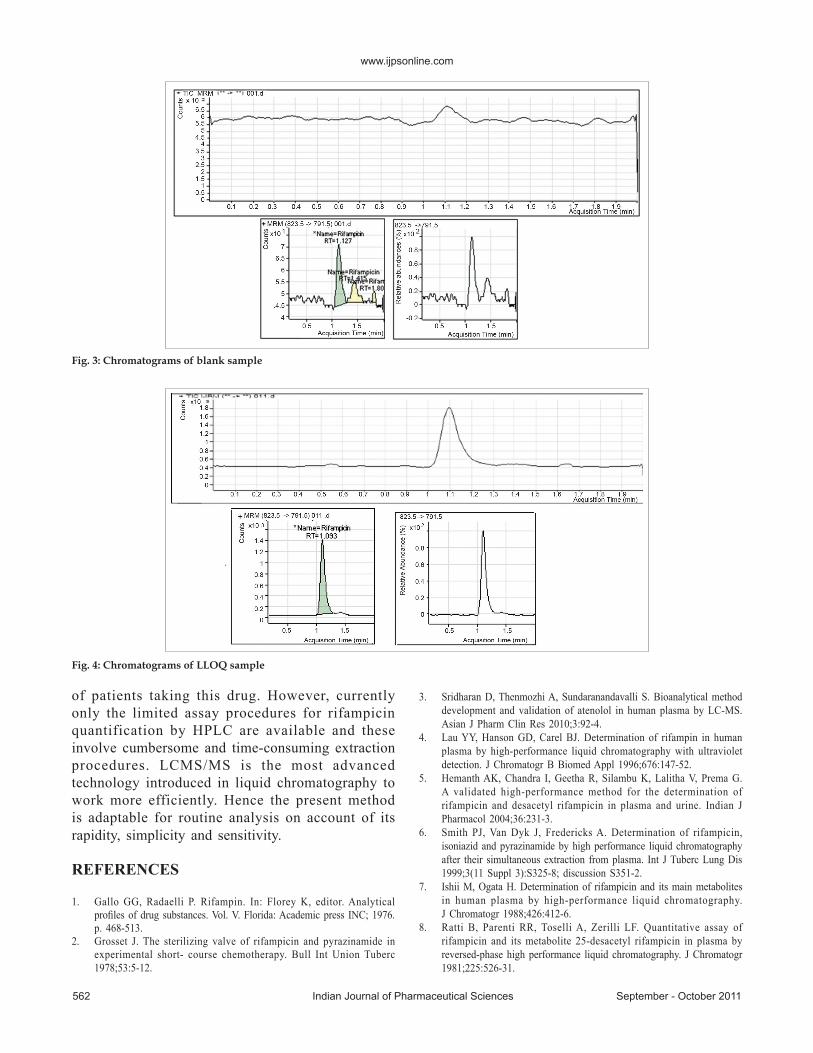
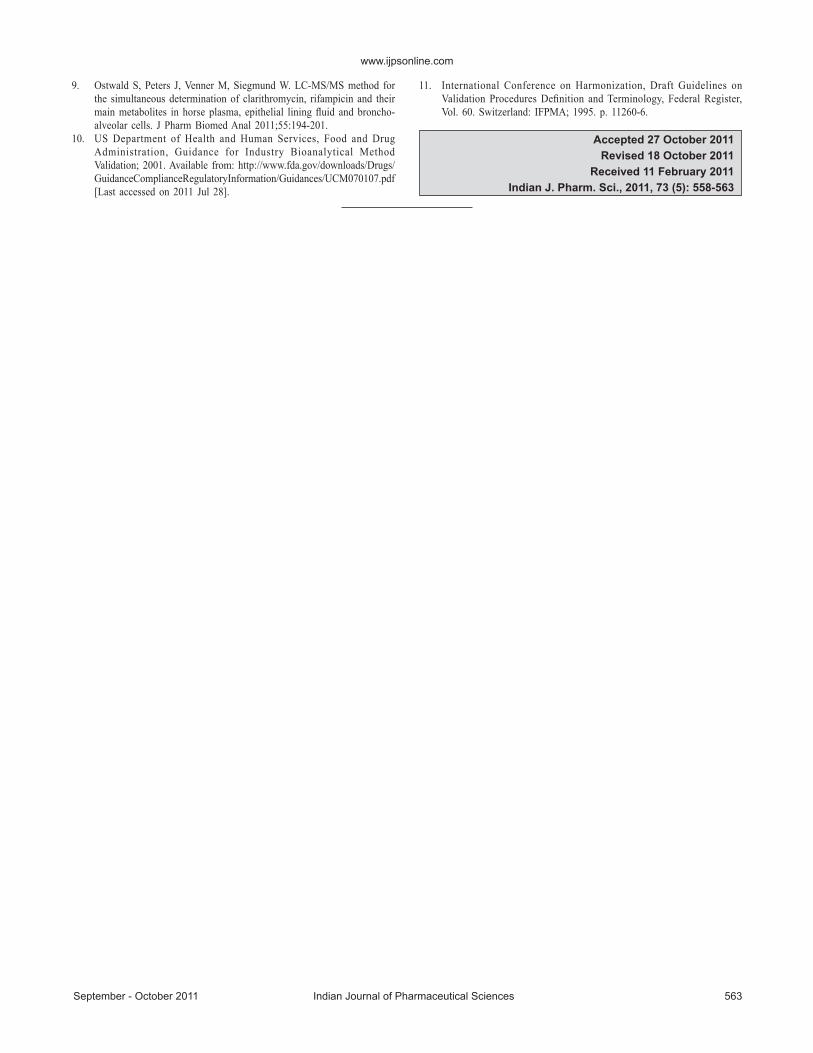
as flow rate is 0.20 ml/min. It was observed that the optimized methods were linear within a specific concentration range for rifampicin. The calibration curves were plotted between response factor and concentration of the standard solutions and the linearity were found to be 5.021-1008.315 ng/ml for rifampicin with regression coefficients (R2) of 0.9981 (fig. 2). The results indicated that there was no significant interday variability of slopes and intercepts over the optimized concentration range. Data for intra-and inter-day precision and accuracy of the method for rifampicin are given in Table 1. The relative standard deviation (RSD) values were within the limit at all QC levels, indicating acceptable precision and accuracy of the present method. The coefficient of variation (%) of these values was less than 5%, indicating that the developed method is accurate, precise and reliable. The precision and accuracy of the present method confirm to the criteria for the analysis of biological samples according to the guidance of USFDA[10,11], where the precision determined at each concentration level is required not exceeding 15%. The mean extraction recoveries of RIF from plasma were 49.62%, 48.65% and 55.15% at concentrations of 50.214, 483.991 and 806.652 ng/ml respectively. The mean extraction recovery of IS was found to be 60.22% as mentioned in Table 2. The coefficient of variation (%) of these values was less than 10%, indicating that the present method is accurate and reliable. The chromatograms of blank sample and LLOQ sample are presented in figs. 3 and 4.
The results of stability studies were given in the Table 3. Rifampicin was found to be stable through all validation parameters. The percentage changes
Fig 1: Chromatograms of analyte and internal standard.Rifampicin: Retention time (RT) = 1.548, Phenacetin: Retention time (RT) = 1.700
www.ijpsonline.com
September - October 2011 Indian Journal of Pharmaceutical Sciences 561
having known concentration and was found to be suitably applicable and validated.
There has been an increasing demand for a suitable method for assay of rifampicin in biological fluids
Fig. 2: Calibration curve of rifampicin in plasmaSlope = 0.0016, Intercept = 0.057 and R2 = 0.9981.
TABLE 1: PRECISION AND ACCURACY FOR THE DETERMINATION OF RIFAMPICIN IN PLASMANominal concentration (ng/ml) n=6 series/day, 3days
S.N LOQQC LQC MQC HQC5.069 50.691 482.769 804.615
Mean 4.4952 44.5000 441.2640 865.9510S.D (±) 0.1600 1.5422 21.8291 18.3861RSD 0.035 0.0346 0.0494 0.0213C.V (%) 3.5593 3.4600 4.9400 2.1230Intra-day accuracy (%) 85.9-94.7 83.5-91.5 86.3-98.5 103.8-110.6Inter-day accuracy (%) 85.9-103.4 71.4-108.4 86.3-100.3 91.3-112.7LOQQC: Limits of quantification quality control sample, LQC: Low quality control sample, MQC: Medium quality control sample and HQC: High quality control sample
TABLE 2: EXTRACTION RECOVERY DATA OF ANALYTE AND INTERNAL STANDARDDrug Nominal Conc (ng/ml) % Recovery % Coefficient of variation (CV) % Mean recovery Rifampicin LQC :50.214 49.62 11.48 51.14±3.51
(%CV):6.86MQC :483.991 48.65 08.98HQC :806.652 55.15 15.27
Phenacetin 500.000 60.22 05.43 60.22n=6, LQC: Low quality control sample, MQC: Medium quality control sample and HQC: High quality control sample
TABLE 3: STABILITY OF RIFAMPICIN IN PLASMA AT TWO QC LEVELS (N=6)Fresh samples
(Mean accuracy)Stability samples (Mean accuracy)
BT4 FT4
LQC HQC LQC HQC LQC HQC93.85 98.283 86.95 99.05 90.55 102.0667
S.D. (±) 7.17 11.15 3.87 10.80 6.37 4.76C.V.(%) 7.64 11.35 4.45 10.90 7.04 4.66LQC: Low quality control sample, MQC: Medium quality control sample and HQC: High quality control sample
of mean accuracy values of QC samples were found not more than and not less than 15% and are acceptable. The developed method was checked for its applicability and validity by analyzing laboratory samples of spiked plasma containing rifampicin
www.ijpsonline.com
562 Indian Journal of Pharmaceutical Sciences September - October 2011
of patients taking this drug. However, currently only the limited assay procedures for rifampicin quantification by HPLC are available and these involve cumbersome and time-consuming extraction procedures. LCMS/MS is the most advanced technology introduced in liquid chromatography to work more efficiently. Hence the present method is adaptable for routine analysis on account of its rapidity, simplicity and sensitivity.
REFERENCES
1. Gallo GG, Radaelli P. Rifampin. In: Florey K, editor. Analytical profiles of drug substances. Vol. V. Florida: Academic press INC; 1976. p. 468-513.
2. Grosset J. The sterilizing valve of rifampicin and pyrazinamide in experimental short- course chemotherapy. Bull Int Union Tuberc 1978;53:5-12.
3. Sridharan D, Thenmozhi A, Sundaranandavalli S. Bioanalytical method development and validation of atenolol in human plasma by LC-MS. Asian J Pharm Clin Res 2010;3:92-4.
4. Lau YY, Hanson GD, Carel BJ. Determination of rifampin in human plasma by high-performance liquid chromatography with ultraviolet detection. J Chromatogr B Biomed Appl 1996;676:147-52.
5. Hemanth AK, Chandra I, Geetha R, Silambu K, Lalitha V, Prema G. A validated high-performance method for the determination of rifampicin and desacetyl rifampicin in plasma and urine. Indian J Pharmacol 2004;36:231-3.
6. Smith PJ, Van Dyk J, Fredericks A. Determination of rifampicin, isoniazid and pyrazinamide by high performance liquid chromatography after their simultaneous extraction from plasma. Int J Tuberc Lung Dis 1999;3(11 Suppl 3):S325-8; discussion S351-2.
7. Ishii M, Ogata H. Determination of rifampicin and its main metabolites in human plasma by high-performance liquid chromatography. J Chromatogr 1988;426:412-6.
8. Ratti B, Parenti RR, Toselli A, Zerilli LF. Quantitative assay of rifampicin and its metabolite 25-desacetyl rifampicin in plasma by reversed-phase high performance liquid chromatography. J Chromatogr 1981;225:526-31.
Fig. 4: Chromatograms of LLOQ sample
Fig. 3: Chromatograms of blank sample
www.ijpsonline.com
September - October 2011 Indian Journal of Pharmaceutical Sciences 563
9. Ostwald S, Peters J, Venner M, Siegmund W. LC-MS/MS method for the simultaneous determination of clarithromycin, rifampicin and their main metabolites in horse plasma, epithelial lining fluid and broncho-alveolar cells. J Pharm Biomed Anal 2011;55:194-201.
10. US Department of Health and Human Services, Food and Drug Administration, Guidance for Industry Bioanalytical Method Validation; 2001. Available from: http://www.fda.gov/downloads/Drugs/GuidanceComplianceRegulatoryInformation/Guidances/UCM070107.pdf [Last accessed on 2011 Jul 28].
11. International Conference on Harmonization, Draft Guidelines on Validation Procedures Definition and Terminology, Federal Register, Vol. 60. Switzerland: IFPMA; 1995. p. 11260-6.
Accepted 27 October 2011Revised 18 October 2011
Received 11 February 2011Indian J. Pharm. Sci., 2011, 73 (5): 558-563