development and validation of a food frequency questionnaire for korean americans
TRANSCRIPT

Development and validation of a food frequency questionnaire for KoreanAmericans
Jeongseon Kim1, Mabel M. Chan2 and Roy E. Shore3
1Department of Food and Nutrition in Oriental Medicine, Semyung University, San 21–1 Shinwol-dong,Chechon, 390–711, Chungbuk, Korea, 2Department of Nutrition and Food Studies, School of Education,New York University, 10th Fl. 4th St., New York, NY 10012, USA and 3Department of EnvironmentalMedicine, New York University School of Medicine, 650 1st Ave., New York, NY 10016, USA
A food frequency questionnaire for Korean Americans (KFFQ) was developed bymodifying Block’s Health Habits and History Questionnaire (HHHQ). The finalKFFQ contained 118 food items taking into account culturally specific dietarypatterns. Validation of the KFFQ was conducted to compare the nutrient intakesassessed by the KFFQ against those measured by seven-day dietary records in 73Korean Americans. The mean nutrient values from the KFFQ differed at most by25% from those of the dietary records with the exception of vitamin A, and 70% ofthe nutrients (16 out of 23 nutrients) were within 15%. Adjusted Spearman rank-order correlation coefficients for nutrients ranged between 0.45 and 0.84. Theoverall degree of agreement between the KFFQ and the dietary records was 68%with a range 56% to 79%. This validation study indicates that the KFFQ givesreasonably accurate estimates of the usual dietary intakes among the studypopulation. The results also verify that it is possible to use a FFQ that is bothculturally specific and comprehensive with the benefit of being easy to self-administer. This high degree of correlation between the KFFQ and the dietaryrecords demonstrates that the KFFQ provides an easier yet accurate method in large-scale epidemiological studies of relationships between nutrition intakes and diseasesin Korean Americans.
Introduction
There has been much interest in and need forconducting nutrition and health studies on AsianAmericans (Hankin & Wilkens, 1994). KoreanAmericans represent one of the fastest growingAsian American groups in the US, and thepopulation has more than doubled during thepast decade (U.S. Department of Commerce,1991). Based on a recent census of KoreanAmericans conducted by the Ministry of For-eign Affairs of the Republic of Korea,
2,209,407 Koreans were reported to be living inthe US as of December 1996 (Korean Ministryof Foreign Affairs, 1997). New York and NewJersey are the second and third leading statesafter California in order of intended residenceof Korean Americans.
In spite of this increase in immigration, therehave been no reports of the development andvalidation of ethnically specific food frequencyquestionnaires (FFQs) for Koreans in the US.
Correspondence to: Jeongseon Kim. Fax: +82 43 649 1349; E-mail: [email protected] r
ISSN 0963-7486 printed/ISSN 1465-3478 online02/020129-14 © 2002 Taylor & Francis LtdDOI: 10.1080/09637480220132148
International Journal of Food Sciences and Nutrition (2002) 53, 129–142
Int J
Foo
d Sc
i Nut
r D
ownl
oade
d fr
om in
form
ahea
lthca
re.c
om b
y Q
UT
Que
ensl
and
Uni
vers
ity o
f T
ech
on 1
1/21
/14
For
pers
onal
use
onl
y.

130 J. Kim et al.
Most of the studies of Korean Americans havefocused primarily on food patterns and therehave been few studies specific to nutritionalstatus (Chung, 1995). Fundamental to suchresearch is the need for accurate and efficientmethods of obtaining information on the dietaryhabits and nutritional status specific to apopulation or culture.
Of the commonly accepted tools for assess-ing dietary intake in epidemiological studies,the one that is most often used in populationsurveys is the FFQ. A FFQ consists of apredetermined list of food items, and respon-dents are asked to state how frequently and howmuch of each item they consume. This surveyinformation is then converted and analyzed toestimate nutrient intake (Zulkifli & Yu, 1992).One advantage of using a FFQ is that it requiresneither specialized training for respondents nora lengthy interview process. Therefore, a lighterburden is placed on respondents, which canincrease participation rates compared to otherdietary assessment methods. A second advan-tage is that the FFQ can be self-administeredand has often been used in large-scale epide-miological studies to determine habitual dietaryintake (Briefel et al., 1992; Kushi, 1994).
One of the most extensively tested FFQs isthe Health Habits and History Questionnaire(HHHQ) developed by Block and coworkers atthe National Cancer Institute (Lee & Nieman,1996). The HHHQ has been tested against otherdietary assessment methods within the generalAmerican population, and modified versions forsome ethnic groups in the US have beenavailable, but not for the Korean Americanpopulation (Coates et al., 1991, 1995; Block etal., 1992; Serdula et al., 1993). This studydescribes the development of a FFQ specific forKorean Americans (KFFQ), using the originalHHHQ as a model. The KFFQ may serve as adietary assessment instrument to reflect theusual dietary habits of Korean Americans.
Once a FFQ has been developed, the nextstep is to assess the accuracy of the FFQ againsta standard. In dietary assessment, such astandard is not always available. Ideally bio-chemical markers could be used as a standard;unfortunately biomarkers do not exist for manyof the dietary components usually studied(Sinha et al., 1993; Block et al., 1994).Alternatively, one could conduct a non-intrusiveobservation of individual diets (e.g. months or
years); but this is difficult and impractical.Therefore, self-reported food records or foodrecalls of multiple days are often substituted asthe standard to be used when validating a newlydeveloped dietary assessment tool (Hankin &Wilkens, 1994; Thompson & Byers, 1994).
When validating a FFQ, the number of daysof a dietary record, which is chosen as areference method, should be considered care-fully to ensure the best possible measurement ofthe efficacy of a FFQ (Briefel et al., 1992). Forsome macronutrients (protein, total fat, sat-urated fat, and carbohydrate), three to five-daydietary recalls would be necessary to reducemeasurement error (Rimm et al., 1992; Eck etal., 1996). In the case of micronutrients (choles-terol, vitamin C, riboflavin, and niacin), muchlonger than five record days would be needed(Sempos, 1992). Although there is controversyabout whether or not one week can fullyrepresent the usual intake of a study population,the seven-day dietary record is considered to bea reasonable attempt to achieve greater repre-sentation of actual intakes, in terms of itsfeasibility, such as the participants’ responsive-ness (Willett et al., 1985). In this study, theseven-day dietary record was used as a refer-ence method to validate the KFFQ.
Methods
The development of the KFFQBlock’s HHHQ using the nutrient database ofthe second National Health and NutritionExamination Survey (Block et al., 1986) wasmodified by the current authors to better reflectfoods commonly consumed by Korean Amer-icans. Some food items considered unfamiliar toKorean Americans were deleted and additionalfood items representative of the traditionalKorean diet were added, based on other studies(Chung, 1995; Yom et al., 1995) and observa-tion of local Korean supermarkets of foodavailability in the New York and New Jerseymetropolitan area.
A pilot study was conducted to evaluate theinclusion or exclusion of food items by examin-ing the foods reported in 24-hour dietary recallsof 101 Korean Americans (34 male and 67female), recruited from a dental office in NewJersey. Each respondent between the ages of 17and 71 (mean age: 39 years old) was askedabout all food items, including an approximate
Int J
Foo
d Sc
i Nut
r D
ownl
oade
d fr
om in
form
ahea
lthca
re.c
om b
y Q
UT
Que
ensl
and
Uni
vers
ity o
f T
ech
on 1
1/21
/14
For
pers
onal
use
onl
y.

Food frequency questionnaire for Korean Americans 131
description of portion sizes that were consumedone day prior to the interview. Those food itemsconsumed by less than 5% of the KoreanAmericans were deleted from a preliminaryfood item list. The food items collated fromthese 24-hour dietary recalls were then com-pared with the food items listed from Block’sFFQ. This joint comparison selected the spe-cific food items commonly consumed byKorean Americans with the added stipulationthat all food items must be locally available.This information was useful in designing thefood list for the final KFFQ.
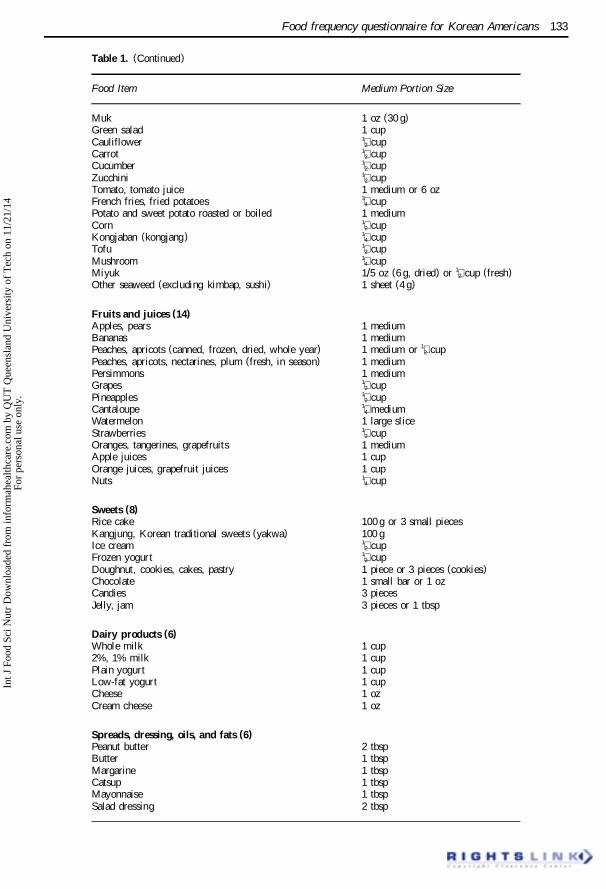
The KFFQ food list was structured into ninecategories of food groups (grain, starch, andcereal; mixed dishes; meat, fish, poultry, andeggs; vegetables; fruits and juices; sweets; dairyproducts; spreads, dressing, oils, and fats;beverages), taking into consideration culturallyspecific dietary patterns. The standard measures(portion size, weight, or volume) identified foreach food item were also determined based onthe portion size information obtained in the pilotstudy, together with the standardized portionsizes set by the Korean Nutrition Association(Korean Nutrition Association, 1995). House-hold utensils commonly used by Korean Amer-icans were incorporated into the portion sizecalculations to obtain a more accurate consump-tion figure for this study. Table 1 presents all 118food items and medium portion size of each fooditem listed in the KFFQ.
SampleEstimates of minimum detectable differencesbetween the KFFQ and the dietary records inthe means of frequencies of consumption forfood items and nutrient intakes were calculatedfor the chosen target sample size of 60 partici-pants, with a = .05, two-tailed, b = .2, and aplausible range of correlation coefficients (Zar,1996). The minimum detectable difference isless than or equal to 40% of the standarddeviation of the raw variables (assuming equalstandard deviations for the two variables).Cohen (1988) considered a medium-effect sizeto be a difference of 50% of the standarddeviation and a small-effect size to be 20% of astandard deviation.
After the pilot study was used to developthe KFFQ, a validation study was conductedon a separate sample to estimate the validity ofthe KFFQ. Based on the statistical power
calculation, 73 participants were recruited fromthe congregation of a Korean American Presby-terian Church located in Bergen County, NewJersey. All volunteers who participated in thisstudy were of Korean heritage and at least 18years of age. They all agreed to participate inthis study by signing a consent form. This studywas reviewed and approved by New YorkUniversity Human Subjects Committee.
InstrumentsThe questionnaire included demographic infor-mation such as age, gender, household income,occupation, and length of residence in the US.The KFFQ was administered to each participantto identify both usual frequency consumptionand average portion size of 118 food items. Allparticipants were also asked to record all foodsand beverages consumed each day for sevenconsecutive days (five weekdays and twoweekend days) in the seven-day dietary recordform. All written instruments given to the studyparticipants were provided in both English andKorean. The translations were checked using atranslation/back translation process.
Data collectionDuring lunch hour after Sunday service, thechurch members were instructed in detail (both inKorean language and English) about the comple-tion of the questionnaire. An additional explana-tion was provided on the recording of seven-daydietary record and the estimation of portion sizesof food and beverages consumed. All instrumentsdistributed in the instruction session were col-lected the following week after the churchservice. To encourage volunteers to complete theforms, the researcher contacted each participantby telephone during the week to answer anyquestions. All the answers were reviewed aftercollection and participants were asked to clarifyany ambiguous or incomplete information. Allinformation collected in this study was keptstrictly confidential since each questionnaire wascoded for record keeping only.
Data analysesDescriptive statistics, such as means, standarddeviation, and testing for normality were calcu-lated on all relevant data using the SPSS-8.0software package (SPSS Inc., 1998). DietSys®,a computer software program, was modified toanalyze the nutrient intake estimated from the
Int J
Foo
d Sc
i Nut
r D
ownl
oade
d fr
om in
form
ahea
lthca
re.c
om b
y Q
UT
Que
ensl
and
Uni
vers
ity o
f T
ech
on 1
1/21
/14
For
pers
onal
use
onl
y.

132 J. Kim et al.
Table 1. Food items list of a food frequency questionnaire for Korean Americans (KFFQ)
Food Item Medium Portion Size
Grain, starch and cereal (9)Rice 1 medium bowlMixed rice with barley, bean and other grains 1 medium bowlPorridge, thin gruel 1 medium bowlBread (white, dark, corn bread) 2 slicesBagel 1 medium bagelMuffin, biscuits 1 medium piece or 2 small piecesWaffles, pancakes 2 piecesCereal 1 cupCooked cereal 1 packet or 1�2 cup cereal (dried)
Mixed dishes (16)Noodles, udong 1 medium bowlMandu 8 piecesBibimbap 1 medium bowlFried rice 1 medium bowlCurry rice, hirice 1 medium bowlKimbap 8 small piecesSullnongtang, komtang, kalbitang 1 medium bowlSoybean paste chigae 1 medium bowlStewed chicken 1 medium bowlYukgejang 1 medium bowlSaengsun chigae 1 medium bowlKimchi chigae 1 medium bowlChapchae 1 medium dishPindaedduk, pajeon 3 small piecesSpaghetti, lasagna, other pasta with tomato sauce 1 cupPizza 1 large piece
Meat, fish, poultry and eggs (18)Bulgogi, kalbi 4 oz (120 g)Beef steak (roast meat) 4 oz (120 g)Pork steak 4 oz (120 g)Jangjorim 2 oz (60 g)Fried chicken 1 large piece or 2 small piecesRoasted or broiled turkey 1 large piece or 2 small piecesHamburgers, cheeseburger s 1 medium sliceHam, lunch meats 2 slices or 2 oz (60 g)Sausage 2 oz (60 g)Bacon 2 slicesFried fish or fish sandwich 4 oz (120 g) or 1 medium sandwichSashimi, sushi 4 pcs with rice or 8 pcs without riceShellfish (shrimp, lobster, crab, oyster, etc.) 1/3 cupOther fish, broiled or baked 4 oz (120 g)Dried anchovy, dried squid 1�4 cupSaengsunmuk (fish cake) 3 oz (90 g)Jutgal 2 oz (60 g)Eggs 1 egg
Vegetables (24)Kimchi, kakdoogi 50 gBean sprouts, mung sprouts 50 gSpinach, leek 1�2 cup or 50 gLettuce (romaine) 1�2 cupCabbage 1�2 cupBroccoli 1�2 cupWhite radish (excluding kakdoogi) 50 gDoraji 50 gKaetnip muchim 4 pieces
Int J
Foo
d Sc
i Nut
r D
ownl
oade
d fr
om in
form
ahea
lthca
re.c
om b
y Q
UT
Que
ensl
and
Uni
vers
ity o
f T
ech
on 1
1/21
/14
For
pers
onal
use
onl
y.
Food frequency questionnaire for Korean Americans 133
Table 1. (Continued)
Food Item Medium Portion Size
Muk 1 oz (30 g)Green salad 1 cupCauliflower 1�2 cupCarrot 1�2 cupCucumber 1�2 cupZucchini 1�2 cupTomato, tomato juice 1 medium or 6 ozFrench fries, fried potatoes 3�4 cupPotato and sweet potato roasted or boiled 1 mediumCorn 1�2 cupKongjaban (kongjang ) 1�4 cupTofu 1�2 cupMushroom 1�4 cupMiyuk 1/5 oz (6 g, dried) or 1�2 cup (fresh)Other seaweed (excluding kimbap, sushi) 1 sheet (4 g)
Fruits and juices (14)Apples, pears 1 mediumBananas 1 mediumPeaches, apricots (canned, frozen, dried, whole year) 1 medium or 1�2 cupPeaches, apricots, nectarines, plum (fresh, in season) 1 mediumPersimmons 1 mediumGrapes 1�2 cupPineapples 1�2 cupCantaloupe 1�4 mediumWatermelon 1 large sliceStrawberries 1�2 cupOranges, tangerines, grapefruits 1 mediumApple juices 1 cupOrange juices, grapefruit juices 1 cupNuts 1�4 cup
Sweets (8)Rice cake 100 g or 3 small piecesKangjung, Korean traditional sweets (yakwa) 100 gIce cream 1�2 cupFrozen yogurt 1�2 cupDoughnut, cookies, cakes, pastry 1 piece or 3 pieces (cookies)Chocolate 1 small bar or 1 ozCandies 3 piecesJelly, jam 3 pieces or 1 tbsp
Dairy products (6)Whole milk 1 cup2%, 1% milk 1 cupPlain yogurt 1 cupLow-fat yogurt 1 cupCheese 1 ozCream cheese 1 oz
Spreads, dressing, oils, and fats (6)Peanut butter 2 tbspButter 1 tbspMargarine 1 tbspCatsup 1 tbspMayonnaise 1 tbspSalad dressing 2 tbsp
Int J
Foo
d Sc
i Nut
r D
ownl
oade
d fr
om in
form
ahea
lthca
re.c
om b
y Q
UT
Que
ensl
and
Uni
vers
ity o
f T
ech
on 1
1/21
/14
For
pers
onal
use
onl
y.

134 J. Kim et al.
KFFQ (Block et al., 1993). Supplementaryinformation on nutrient composition for thefood items not available in the DietSys® wasreferenced from both Nutritionist IV (version4.0) and the recommended daily allowances forKoreans, 6th edition and then incorporated intothe DietSys®. All frequencies of consumptionfor each food item were transformed into dailyfrequencies of consumption. The data editingprocedures (range, logical consistency, andmissing data) were applied using the modifiedDietySys®. Nutrient intakes from the seven-daydietary record data were also analyzed using thedatabase of the modified DietSys®.
The equivalence of mean nutrient intake bythe two methods was evaluated using pairedt-tests for each nutrient (protein, total fat,carbohydrate, calcium, phosphorus, iron,sodium, potassium, vitamins A [RE], B1, B2,C, E, B6, niacin, cholesterol, dietary fiber,folate, Zn). The similarity in the ranking ofparticular nutrient intakes by the two methodswas assessed by calculating Spearman rank-order correlations. Calorie-adjusted nutrientintakes in the analysis were used to com-pensate for the effect of errors in energy intakeand also to help reduce between-person varia-tions due to general over-reporting or under-reporting (Willett, 1998). This approach isuseful to remove extraneous variations due to
body size, physical activity, and metabolicefficiency. The calorie adjustment was done bycomputing residuals from regression models,with nutrient intake as the dependent variableand total energy intake as the independentvariable. The residuals were added to theexpected nutrient intake for a hypotheticalparticipant who had the mean caloric intake(Tabachnick & Fidell, 1996). An attenuationcorrection of the correlations was used tocorrect for the day-to-day variation withinsubjects in the seven-day dietary records (Ros-ner & Willett, 1988). To deattenuate correla-tions between KFFQ and dietary records, theobserved correlations were multiplied by thefactor (1+SW
2/SB2)
1�2 where SW2 equals within-
individual variance and SB2 between- individ-
ual variance. To measure the degree of agree-ment, respondents were categorized by nutrientvalues into quartiles based on the two dietaryassessment methods. This comparison exam-ined the percentage with good agreement (thesame quartiles or disparities of one quartile,e.g., first quartile on both the KFFQ and theseven-day dietary records or first quartile onthe KFFQ and second quartile on the seven-day dietary records) and the percentage withpoor agreement (disparities of two or threequartiles, e.g., first quartile on the KFFQ butthird or fourth quartile on the dietary records).
Table 1. (Continued)
Food Item Medium Portion Size
Beverages (17)Regular soft drinks 12 oz can or bottleDiet soft drinks 12 oz can or bottleBeer 12 oz can or bottleSoju, chungju 2 oz glassWine 1 medium glassOther hard liquor (such as scotch, bourbon, gin andcocktails) 1 medium glassCoffee, caffeinated 1 medium cupDecaffeinated coffee 1 medium cupTea (hot or iced) 1 medium cupNon-dairy creamer in coffee or tea 1 tbspMilk in coffee or tea 1 tbspWhite sugar, brown sugar in coffee or tea 2 tsp or 2 packetsArtificial sweeteners in coffee or tea 1 packetGinseng 1 packetHoney, sugar in ginseng tea 1 tbspSikhe, sweet rice beverage, lightly brewed 1 medium cupBarley (corn) water 1 medium cup
Int J
Foo
d Sc
i Nut
r D
ownl
oade
d fr
om in
form
ahea
lthca
re.c
om b
y Q
UT
Que
ensl
and
Uni
vers
ity o
f T
ech
on 1
1/21
/14
For
pers
onal
use
onl
y.

Food frequency questionnaire for Korean Americans 135
Results
The majority (89% of the study subjects)responded to the questionnaire in Korean. Fourrespondents out of 73 were excluded for reasonsof fasting (more than two days), illness, orunusual nutrient intakes (extremely high or lowvalues).
Demographic informationTable 2 describes the profile of the participantswho completed the KFFQ. The majority wasfemale (67%), middle-aged (39 years old), andfrom middle-income households (49% rangedfrom $ 25,000 to $ 75,000). Most were born inSouth Korea (87%) and were married (71%).The average length of residence and educationwere 9.8 and 14.3 years, respectively and theaverage body mass index (BMI) was 22.3 kg/m2. Most respondents reported that they did notsmoke (81%), did not exercise (81%), and didnot take vitamin/mineral supplements (64%).Over half (61%) answered that their dietaryhabits had changed since they had immigratedto the US. Thirty percent of the participantswere housewives.
Comparison of nutrient intakesTable 3 shows the comparison of daily nutrientintakes between the two dietary assessmentmethods. The mean absolute nutrient intakesestimated by the KFFQ were statistically equiv-alent to those calculated from the seven-daydietary records in energy, protein, carbohydrate,% protein, % carbohydrate, phosphorus, iron,sodium, potassium, vitamins B1, B2, B6, cho-lesterol, and fiber. However, the KFFQ tendedto underestimate nutrient intakes for total fat, %total fat, calcium, vitamins A, E, niacin, folate,and Zn calculated from the seven-day dietaryrecords, while vitamin C estimated from theKFFQ was higher compared to the seven-daydietary records. The mean values from theKFFQ differed at most by 25% from those ofthe dietary records with the exception ofvitamin A, and 70% of the nutrients (16 out of23 nutrients) were within 15%.
Unadjusted Spearman rank-order correlationcoefficients between the nutrient intakes basedon the KFFQ and those based on the dietaryrecords varied between 0.30 for vitamin A and0.66 for potassium (Figure 1). The energy-adjusted correlations affected the range only
slightly (0.28 for vitamin A to 0.67 for potas-sium). Correlations after energy-adjustment formost nutrients improved but not for sodium orvitamins A and B1. There were no changes inthe correlations for carbohydrate, phosphorus,and fiber after adjustment. Thus, the changesdue to energy adjustment were quite small.However, the changes in correlations due tocorrection for attenuation (i.e., correcting forunreliability in the seven-day dietary records)were more appreciable. With correlations forattenuation, the correlations increased andranged from 0.45 (carbohydrate) to 0.84(potassium).
Another approach to examine the agreementbetween the KFFQ and dietary records is tocross-classify the respondents’ distribution. Therespondents were divided into quartiles bynutrient intakes according to the two methods(Figure 2). Cross-classification into the samequartiles ranged from 27% for % total fat to61% for vitamin B6 with a mean of 41%. Onequartile differences were greatest for Zn (43%)and least for vitamin B2 (12%). Overall, therewas 68% of a ‘good agreement’ (i.e., samequartile or adjacent quartile) between the twodietary assessment methods. Using the goodagreement criterion, vitamin A and fiber werethe nutrients with the least agreement (56%),while fat, cholesterol, calcium, phosphorus ,iron, potassium, zinc, folate, niacin, vitaminsB2, B6, C, and E all showed at least 70% goodagreement. Overall, on average, only 5% of thesubjects were classified by disparities of threequartiles. No subjects differed by three quartilesfor carbohydrate, potassium, or folate.
Discussion
Development of the KFFQThe food items in the KFFQ can be reclassifiedinto seven categories when compared to theoriginal HHHQ (Block et al., 1993). They are:(1) the same food items in the exact same foodgroups that were also used in the originalHHHQ (29 food items out of 118); (2) modifiedfood items categorized either by collapsing twoor more into one food item or by separating onefood item food in the HHHQ into two or morein the KFFQ (6 food items); (3) the same fooditem as in the original HHHQ, but placed in adifferent food group (16 food items); (4) thesame food item set with a different portion size
Int J
Foo
d Sc
i Nut
r D
ownl
oade
d fr
om in
form
ahea
lthca
re.c
om b
y Q
UT
Que
ensl
and
Uni
vers
ity o
f T
ech
on 1
1/21
/14
For
pers
onal
use
onl
y.

136 J. Kim et al.
Table 2. Demographic profile of the respondents (N = 69)
Characteristic N (%)
GenderMale 23 (33.3)Female 46 (66.7)
Incomeunder $10,000 8 (11.6)$10,000—$14,999 6 (8.7)$15,000—$24,999 12 (17.4)$25,000—$34,999 15 (21.7)$35,000—$49,999 9 (13.0)$50,000—$74,999 10 (14.5)$75,000—$99,999 4 (5.8)$100,000 or more 5 (7.2)
Place of birthKorea 60 (87.0)USA 9 (13.0)
Marital statusSingle 15 (21.7)Married 49 (71.0)Other (widowed, divorced, separated) 5 (7.2)
SmokerYes 7 (10.1)No 62 (89.9)
ExerciseYes 13 (18.8)No 56 (81.2)
Vitamin/mineral supplementsYes, fairly regularly 7 (10.1)Yes, but not regularly 18 (26.1)No 44 (63.8)
Dietary habits change after immigrationStrongly disagree 8 (11.6)Disagree 10 (14.5)Don’t know 0 (0)Agree 37 (53.6)Strongly agree 5 (7.2)n/a 9 (13.0)
OccupationProfessional specialty 4 (5.8)Managerial, administrative support, clerical 9 (13.0)Sales, technical 7 (10.1)Service 1 (1.4)Precision production, craft, repairs 9 (13.0)Operators, fabricators, laborers 9 (13.0)Students 9 (13.0)Housewives 21 (30.4)
Age (y) 38.6 ± 11.7a
Length of residence in the US (y) 9.8 ± 5.7a
Education (y) 14.3 ± 2.9a
Height (cm) 163.8 ± 8.0a
Weight (kg) 60.3 ± 13.1a
Body mass index (kg/m2) 22.3 ± 3.4a
a Mean ± standard deviation.
Int J
Foo
d Sc
i Nut
r D
ownl
oade
d fr
om in
form
ahea
lthca
re.c
om b
y Q
UT
Que
ensl
and
Uni
vers
ity o
f T
ech
on 1
1/21
/14
For
pers
onal
use
onl
y.

Food frequency questionnaire for Korean Americans 137
(2 food items); (5) the same food item both in adifferent food group and with a different portionsize (6 food items); (6) Korean ethnic fooditems added (41 food items); and (7) non-Korean ethnic food items added (18 fooditems). In total, 59 food items from the originalDietSys® database were included in the mod-ified DietSys®.
There have been two previous attempts todevelop FFQs for Korean Americans (Chung,1995; Lee, 1998). However, the FFQs used inthe Korean American studies were not vali-dated. Chung (1995) modified the 122-itemWillett FFQ by adding 17 ethnic foods and threevegetables. The Chung FFQ was structuredaccording to seven food groups based on ninefrequency categories with one stated portionsize. Lee (1998) developed a new FFQ, whichwas composed of 108 food items categorizedinto 11 groups with five frequency codes, butportion sizes were disregarded. The KFFQdeveloped in this study took into considerationculturally specific food items, portion size, foodgroups, and nutrient intakes through a prelimi-nary pilot study of 24-hour dietary recalls as
well as considering the FFQs used in previousKorean American studies.
Validation of the KFFQ against dietaryrecordsThe nutrient intakes analyzed by the KFFQ tendto be lower than those by the seven-day dietaryrecords in this study, which is consistent withthe results of the majority of other studies(Willett et al., 1987; Block et al., 1992; Martin-Moreno et al., 1993). However, a few reportshave shown the opposite: their FFQs give anapproximately 20% higher nutrient intake esti-mate than dietary records (Pietinen et al., 1988;Kim & Yang, 1998). The latter studies showedoverestimation of vitamins A and C intakes,whereas underestimation of vitamin A andoverestimation of vitamin C were observed inthis study. Willett (1998) pointed out thatdiscrepancies in vitamin A intake are in part dueto usage of different versions of the UnitedStates of Department of Agriculture (USDA)nutrient database, which has drastically changedvitamin A values for several vegetables andfruits.
Table 3. Mean daily nutrient intakes (±standard deviation) estimated by the KFFQ and seven-day dietary records (DR)(N = 69)
Nutrients KFFQ DR KFFQ ´ 100%/DR
Energy (kcal) 1837 ± 306 2098 ± 424 88Protein (g) 74.5 ± 24.2 80.4 ± 32.6 93Total fat (g) 49.6 ± 15.5** 61.1 ± 12.2 81Carbohydrate (g) 268.2 ± 40.0 302.1 ± 65.0 89% Protein 16.2 ± 3.5 15.3 ± 3.2 106% Total fat 24.3 ± 4.6* 26.2 ± 2.1 93% Carbohydrate 58.4 ± 8.1 57.6 ± 7.3 101Calcium (mg) 724.2 ± 120.9* 927.4 ± 135.8 78Phosphorus (mg) 982.8 ± 289.5 1052.6 ± 256.7 93Iron (mg) 13.5 ± 3.6 14.6 ± 2.2 92Sodium (mg) 3298 ± 902 3158 ± 806 104Potassium (mg) 1982 ± 465 2038 ± 457 97Vitamin A (RE) 859.7 ± 324.6*** 1196.8 ± 392.7 72Vitamin B1 (mg) 1.31 ± 0.41 1.50 ± 0.37 87Vitamin B2 (mg) 1.59 ± 0.65 1.74 ± 0.71 91Vitamin C (mg) 128.6 ± 55.3* 112.4 ± 60.1 114Vitamin E (mg) 10.67 ± 5.23*** 13.63 ± 3.29 78Vitamin B6 (mg) 1.97 ± 0.78 2.17 ± 0.58 91Niacin (mg) 21.1 ± 6.4** 24.8 ± 5.9 85Cholesterol (mg) 206.2 ± 98.9 226.5 ± 102.1 91Fiber (g) 12.4 ± 4.1 10.3 ± 5.1 120Folate (mg) 291.4 ± 111.1** 378.7 ± 93.0 77Zn (mg) 9.63 ± 2.88* 10.87 ± 1.93 89
*p < .05, **p < .01, ***p < .001
Int J
Foo
d Sc
i Nut
r D
ownl
oade
d fr
om in
form
ahea
lthca
re.c
om b
y Q
UT
Que
ensl
and
Uni
vers
ity o
f T
ech
on 1
1/21
/14
For
pers
onal
use
onl
y.

0.7
0.6
0.5
0.4
0.3
0.2
0.1
0
Phosp
horo
us Iron
Calcium
% ca
rboh
ydra
te
% to
tal fa
t
% p
rote
in
Carbo
hydr
ate
Tota
l fat
Prote
in
Energ
y
Observedcorrelation
Energy-adjustedcorrelation
Deattenuatedcorrelation
(a)
0.9
0.5
0.4
0.3
0.2
0.1
0
Folate Zn
Fiber
Choles
tero
l
Niacin
Vitam
in B6
Vitam
in E
Vitam
in C
Vitam
in B2
Vitam
in B1
Observedcorrelation
Energy-adjustedcorrelation
Deattenuatedcorrelation
(b)
Vitam
in A
Potas
sium
Sodium
0.6
0.7
0.8
138 J. Kim et al.
Figure 1. Spearman rank-order coefficients comparing nutrient intake from two dietary assessment methods (N = 69).
There were statistically significant differ-ences in total fat, % total fat, calcium, vitaminsA, C, E, niacin, folate, and Zn between the twodietary assessment methods by paired t-tests inthis study. Similarly, Lee et al. (1994) alsoreported statistically significant differences intotal calories, total fat, saturated fat, cholesterol,vitamin A, and b-carotene for the FFQ devel-oped for Chinese Americans.
The discrepancy between the two assessmentmethods is partly explained by errors in recalland data processing; limitation of the nutrientdatabase may be another reason. There aremany other variations in nutrient values due toother factors, such as the ingredients of foods orpreparation/cooking methods. The nutrientintakes vary depending on when or how thefood was produced, whether it was cooked or
Int J
Foo
d Sc
i Nut
r D
ownl
oade
d fr
om in
form
ahea
lthca
re.c
om b
y Q
UT
Que
ensl
and
Uni
vers
ity o
f T
ech
on 1
1/21
/14
For
pers
onal
use
onl
y.

60
50
40
30
20
10
0
Energ
y
Concordantclassification
One quartiledifference
Two quartiledifferences
(a)
Prote
in FatCHO
% p
rote
in%
fat
% C
HO Ca P Fe Na K
% Three quartiledifferences
50
40
30
20
10
0
Folate Zn
Fiber
Choles
tero
l
Niacin
Vitam
in B6
Vitam
in E
Vitam
in C
Vitam
in B2
Vitam
in B1
(b)
Vitam
in A
60
70
%
Mea
n
Concordantclassification
One quartiledifference
Two quartiledifferences
Three quartiledifferences
Food frequency questionnaire for Korean Americans 139
Figure 2. Cross-classification of nutrient distribution quartiles from two dietary assessment methods (N = 69).
raw or broiled or stir-fried, and what was addedto food (e.g., butter on toast). There may also bea certain amount of ‘social desirability’ report-ing, whereby heavy eaters under-report con-sumption to different degrees on the KFFQ andthe dietary records (Thompson & Byers,1994).
Correlation coefficients of nutrients varydepending on what nutrients are used as para-meters for validation, the kind of referencemethod used (selection of the number of daysfor dietary records or recalls), the type ofadministration method of the FFQ (interviewed
or self-administered), or the statistical methodperformed (with or without energy-adjustmentand deattenatuation). Following are some exam-ples of studies where a large range of correla-tion coefficients were observed. High valueswere reported by Balough et al. (1968); thecorrelation coefficients for fat were 0.94 and forenergy, 0.74. Low values have been reported byStuff et al. (1983); 0.04 for fat and 0.09 forenergy, with the highest for calcium, 0.24.Calculating intakes of energy and some nutri-ents, such as macronutrients (excluding alcohol)and vitamin A, is more problematic, while
Int J
Foo
d Sc
i Nut
r D
ownl
oade
d fr
om in
form
ahea
lthca
re.c
om b
y Q
UT
Que
ensl
and
Uni
vers
ity o
f T
ech
on 1
1/21
/14
For
pers
onal
use
onl
y.

140 J. Kim et al.
alcohol, cholesterol, vitamin C, and some Bvitamins are easier (Pietinen et al., 1988).
In this study, correlation coefficients rangedfrom 0.30 (vitamin A) to 0.66 (potassium) forcrude correlations and from 0.28 (vitamin A) to0.67 (potassium) after energy adjustment. Thecorrection for within-person variation improvedthe correlations from 0.45 (carbohydrate) to0.84 (potassium). A validation study of a FFQfor Koreans in Korea showed that the correla-tion coefficients varied from 0.26 to 0.59, whichis similar to the results of this study, althoughslightly lower (Kim & Yang, 1998). In the studyby Lee et al. (1994), the correlation coefficientranged from 0.21 (total fat) to 0.66 (calcium).Those two studies did not use energy-adjust-ment and deattenuation methods.
Two statistical techniques that reflect dietarycomposition adjusted to energy intake are:dividing nutrient intakes by caloric intake(nutrient densities) and adjusting nutrientsbased on energy intakes using regression analy-sis. According to Rimm et al. (1992), energyadjustment by regression analysis would be abetter technique than nutrient densities becausethe latter procedure will not fully control forconfounding by total energy intake in theepidemiological analysis.
In this study, however, energy adjustment byregression analysis did not help improve thecrude correlation coefficients. The effect ofadjustment by total caloric intake was minimalas in other studies (Pietinen et al., 1988; Lee etal., 1994). Therefore, the relationship betweenenergy and other nutrients may have been stableeven after energy adjustment.
The correction for attenuation in this studyimproved the crude correlation substantiallymore than energy adjustment, as has beenshown in some studies (Martin-Moreno, 1993;Hernandez-Avila et al., 1998), although not asmuch as in certain other studies (Willett et al.,1985; Mannisto et al., 1996). This improvementsuggests that within-person day-to-day variabil-ity in nutrient intake can be large (Bonifacj,1997). Also one week of dietary records maynot be sufficient to correctly classify theaverage intake for all nutrients. Therefore, inthis study, the within-person and between-person variances were assessed in weeklynutrient intake from the dietary records and thecrude correlations for this day-to-day variabilitywere corrected (deattenuated) in nutrient intake
using the ratio of the within-person to thebetween-person variance components.
In this study, overall, there was 68% of goodagreement of the respondents in the samequartiles or one quartile discrepancies and 5%in the three quartile differences between the twodietary assessment methods, which was similarto the studies of Pietinen et al. (1988) andBonifacj et al. (1997), but lower than thatreported by Willett et al. (1985). In the study byWillett et al. (1985), about 50% of the respon-dents fell into the same lowest or highestquintile with both methods and 75% fell into thesame or the next quintile. A source of mis-classification that may also explain some of thelow correlations, may be due to the lack ofadequate nutrient composition in the revisedDietSys®. Nutritional information for someKorean ethnic foods, which are not availablefrom the USDA database, was provided by theKorean Nutrition Association and Korean cook-books. This error would result in a discrepancyin the agreement between the two dietaryassessment methods.
Conclusion/application
This study was the first to develop and validatea culturally specific FFQ for Korean Americans.This study may be limited since participantswere recruited from one local church in theGreater New York metropolitan area. In addi-tion, this study selectively included food itemschosen based on the results of the pilot study.However, according to a national mail surveyon Korean Americans’ dietary habits, a statis-tical difference was not found in food itemsconsumed, regardless of regional locations inthe US (Lee et al., 1999). Despite the limitation,the agreement between the KFFQ and seven-day dietary records was generally satisfactoryand compared favorably with previous inves-tigations among other ethnic populations.
The final goal of the dietary assessment studyis its application to epidemiological studies ofthe health aspects of nutrition. As the under-standing of the relationship between diet anddisease increases, it becomes more importantthan ever to develop an easy yet accuratedietary assessment method for any specifictarget study population. The KFFQ can be usedas a dietary assessment tool to measure nutri-tional status of Korean Americans in a less
Int J
Foo
d Sc
i Nut
r D
ownl
oade
d fr
om in
form
ahea
lthca
re.c
om b
y Q
UT
Que
ensl
and
Uni
vers
ity o
f T
ech
on 1
1/21
/14
For
pers
onal
use
onl
y.
Food frequency questionnaire for Korean Americans 141
labor-intensive and less expensive process thanother dietary assessment methods. While thetarget group for this study was Korean Amer-icans, the multidimensional processes outlinedhere should provide a solid foundation in the
development of a FFQ for other ethnic popula-tion subgroups.
Acknowledgement—This study was partially supported bythe New York University School of Education ResearchChallenge Fund.
References
Balough M, Medalie JH, Smith H & Groen JJ (1968): Thedevelopment of a dietary questionnaire for an ischemicheart disease survey. Isr. J. Med. Sci. 4, 195– 203.
Block G, Hartman AM, Dresser CM, Carrol MD, Gannon J& Gardner L (1986): A data-based approach to dietquestionnaire design and testing. Am. J. Epidemiol. 124,453–469.
Block G, Thompson FE, Hartman AM, Larkin FA & GuireKE (1992): Comparison of two dietary questionnairesvalidated against multiple dietary records collected duringa 1-year period. J. Am. Diet. Assoc. 92, 686– 693.
Block G, Coyle LM, Hartman AM & Scoppa SM (1993):HHHQ-DIETSYS analysis software, version 3.0.Bethesda, MD: National Cancer Institute.
Block G, Coyle LM, Hartman AM & Scoppa SM (1994):Revision of dietary analysis software for the HealthHabits and History Questionnaire. Am. J. Epidemiol. 139,1190–1196.
Bonifacj C, Gerber M, Scali J & Daures JP (1997):Comparison of dietary assessment methods in a SouthernFrench population: use of weighed records, estimated-diet records and a food frequency questionnaire. Eur. J.Clin. Nutr. 51, 217– 231.
Briefel RR, Flegal KM, Winn DM, Loria CM, Johnson CL& Sempos C (1992): Assessing the nation’s diet:limitations of the food frequency questionnaire. J. Am.Diet. Assoc. 92, 959–962.
Chung SS (1995): Dietary Change: Food habits of Koreansin New Haven, dissertation. New Haven, CT: Universityof Connecticut.
Coates RJ, Eley JW, Block G, Gunter EW, Sowell AL,Grossman C & Greenberg RS (1991): An evaluation of afood frequency questionnaire for assessing dietary intakeof specific carotenoids and vitamin E among low-incomeblack women. Am. J. Epidemiol. 134, 658– 671.
Coates RJ, Serdula MK, Byers I, Mokdad A, Jewell S,Leonard SB, Ritenbaugh C, Chavez N & Block G (1995):A brief, telephone-administered food frequency ques-tionnaire can be useful for surveillance of dietary fatintakes. J. Nutr. 125, 1473–1483.
Cohen J (1988): Statistical Power Analysis for the Beha-vioral Sciences. Hillside, NJ: Lawrence ErlbaumAssociates.
Eck LH, Klesges LM & Klesges RC (1996): Precision andestimated accuracy of two short-term food frequencyquestionnaire compared with recalls and records. J. Clin.Epidemiol. 48, 1195–1200.
Hankin JH & Wilkens LR (1994): Development of valida-tion of dietary assessment methods for culturally diversepopulations. Am. J. Clin. Nutr. 59(suppl), 198S–200S.
Hernandez-Avila M, Romieu I, Parra S, Hernandez-Avila J,Madrigal H & Willett WC (1998): Validity and reproduci-
bility of a food frequency questionnaire to assess dietaryintake of women living in Mexico City. Salud. Publica.Mex. 40, 133–140.
Kim WY & Yang EJ (1998): A study on development andvalidation of food frequency questionnaire for Koreans.Korean J. Nutr. 31, 220– 230.
Korean Ministry of Foreign Affairs (1997): Korean Amer-icans Census. Seoul, Korea: Ministry of Foreign Affairsof the Republic of Korea.
Korean Nutrition Association (1995): Recommended Die-tary Allowances for Koreans. 6th edn. Seoul, Korea:Korean Nutrition Association.
Kushi L (1994): Gaps in epidemiological research methods:design considerations for studies that use food-frequencyquestionnaires. Am. J. Clin. Nutr. 59(suppl), 180S–184S.
Lee HK (1998): Food Habits of Koreans in the UnitedStates, dissertation. New York, NY: New YorkUniversity.
Lee MM, Lee F, Ladenla SW & Miike R (1994): Asemiquantitative dietary history questionnaire for Chi-nese Americans. Ann. Epidemiol. 4, 188–197.
Lee RD & Nieman DC (1996): Nutritional Assessment. 2ndedn. St. Louis, MO: Mosby.
Lee S, Sobal J & Frongillo EA (1999): Acculturation anddietary practices among Korean Americans. J. Am. Diet.Assoc. 99, 1084–1089.
Mannisto S, Virtanen M, Mikkonen T & Pietinen P (1996):Reproducibility and validity of a food frequency ques-tionnaire in a case-control study on breast cancer. J. Clin.Epidemiol. 49, 401– 409.
Martin-Moreno JM, Boyle P, Gorgojo L, Maisonneuve P,Fernandez-Podriguez JC, Salvini S & Willett WC (1993):Development and validation of a food frequency ques-tionnaire in Spain. Int. J. Epidemiol. 22, 512–519.
Pietinen P, Hartman AM, Haapa E, Rasanen L, HaapakoskiJ, Palmgren J, Albanes D, Virtamo J & Hutunen JK(1988): Reproducibility and validity of dietary assess-ment instruments. I. A self-administered food use ques-tionnaire with a portion size picture booklet. Am. J.Epidemiol. 128, 655–666.
Rimm EB, Giovannucci EL, Stampfer MJ, Colditz GA,Litin, LB & Willett WC (1992): Authors’ response to‘Invited commentary: Some limitations of semiquantia-tive food frequency questionnaires. ’ Am. J. Epidemiol.135, 1133–1136.
Rosner B & Willett WC (1988): Internal estimates forcorrelations coefficients corrected for within-person vari-ation: implications for study design and hypothesistesting. Am. J. Epidemiol. 127, 377– 386.
Sempos CT (1992): Invited commentary: some limitationsof semiquantitative food frequency questionnaires. Am. J.Epidemiol. 135, 1127–1132.
Int J
Foo
d Sc
i Nut
r D
ownl
oade
d fr
om in
form
ahea
lthca
re.c
om b
y Q
UT
Que
ensl
and
Uni
vers
ity o
f T
ech
on 1
1/21
/14
For
pers
onal
use
onl
y.

142 J. Kim et al.
Serdula M, Coates R, Byers T, Mokdad A, Jewell S, ChavezN, Mares-Perlman J, Newcomb P, Ritenbaugh C, TreiberF & Block G (1993): Evaluation of brief telephonequestionnaire to estimate fruit and vegetable consumptionin diverse study populations. Epidemiol. 4, 455– 463.
Sinha R, Patterson BH, Mangels AR, Levander OA, GibsonT, Taylor PR & Block G (1993): Determinants of plasmavitamin E in healthy males. Cancer Epidemiology,Biomarkers and Prevention 2, 473–479.
SPSS Inc. (1998): SPSS Professional Statistics 8.0. Chi-cago, IL: SPSS Inc.
Stuff JE, Garza C, Smith EO, Nichols BL & MontandonCM (1983): A comparison of dietary methods innutritional studies. Am. J. Clin. Nutr. 37, 300.
Tabachnick BG & Fidell LS (1996): Using MultivariateStatistics. 3rd edn. New York, NY: Harper CollinsCollege Publishers.
Thompson FE & Byers T (1994): Dietary assessmentresource manual. J. Nutr. 24(suppl), 2245S–2317S.
US Department of Commerce (1991): 1990 Census of the
Population. US Summary. Washington, DC: U.S. Govern-ment Printing Office.
Willett WC, Sampson L, Stampfer MJ, Rosner B, Bain C,Witschi J, Hennekens CH & Speizer FE (1985): Repro-ducibility and validity of a semiquantitiative foodfrequency questionnaire. Am. J. Epidemiol. 122, 51–65.
Willett WC, Reynolds RD, Cottrell-Hoehner SC, SampsonL & Browne ML (1987): Validation of a semi-quantita-tive food frequency questionnaire: comparison with a1-year diet record. J. Am. Diet. Assoc. 87, 43–47.
Willett WC (1998): Nutritional Epidemiology. 2nd edn.New York, NY: Oxford University Press.
Yom MS, Gordon BHJ & Sucher KP (1995): Korean dietaryhabits and health beliefs in the San Francisco Bay area. J.Am. Diet. Assoc. 95(suppl), A98.
Zar JH (1996): Biostatistical Analysis. 3rd edn. EnglewodCliffs, NJ: Prentice-Hall.
Zulkifli SN & Yu SM (1992): The food frequency methodfor dietary assessment. J. Am. Diet. Assoc. 92,681– 685.
Int J
Foo
d Sc
i Nut
r D
ownl
oade
d fr
om in
form
ahea
lthca
re.c
om b
y Q
UT
Que
ensl
and
Uni
vers
ity o
f T
ech
on 1
1/21
/14
For
pers
onal
use
onl
y.