developing washington state’s strategic plan for...
TRANSCRIPT

1
Developing Washington State’sStrategic Plan for Freight Systems
Joint Transportation CommitteeFreight Investment Study Stakeholders Group
October 25, 2007
Paula HammondSecretary
Steve ReinmuthChief of Staff
Barbara IvanovDirector
Freight Systems Division
Scott WittDirector
State Rail and Marine

2
Why Does Washington State Need a Strategic Plan for Freight Systems?
There are investment constraints:
political,
financial, and
economic.
Washington State’s freight systems strategic plan must:
Balance the cost of investments with resulting economic output;
Direct limited resources to their most productive use; and
Set clear priorities linked to the growth of jobs and the state’s economy.

3
Legislative Direction
Washington State Freight Strategic Plan
ESHB 1094 (Trans. Budget)Section 309 7 (a-c) & 7 (d)
WA State Transportation Commission
(WSTC)
WA State Department of Transportation
(WSDOT)
WA State Legislature Joint Transportation
Committee (JTC)
•Industry Supply Chains•Rail Demand Forecasts•Freight & Passenger Rail Systems•General Rail B/C Methodology•National Funding Opportunities
•Quantify Industry Sector Req. of State Freight Systems: Road, Air, Barge and Rail•Identify Performance Gaps•Analyze Freight Data•Future Freight Demand•Economic Output•Solution Proposals•Evaluate and Prioritize Solutions
•Comparison of Freight Funding Sources•Economic Impact •Diversion of Marine Cargo•ROI of Freight Infrastructure•Project Recommendation Body•Stakeholder/Legislator Groups
2009 Legislative Session
Statewide Rail Capacity and System Needs Study
WA Transportation Plan Freight Report
Rail Benefit/Cost Analysis
•Transportation and economic benefits•Economic impacts•External impacts•Yearly maintenance costs•Present value and net present value
JTC Freight Investment Study
2009/2011 Highway System Plan
GovernorChristine Gregoire
Freight Mobility Strategic
Investment Board (FMSIB)
State Freight Strategic Plan
WSDOT Work Program 2007-2009

4
Washington State Freight Strategic Plan
JUNE 2008WSDOT Freight Systems Division identifies current freight system deficits and determines future demand.
WSDOT Regions develop highway solution proposals for consideration.
SEPTEMBER 2008Joint WSDOT and FMSIB report describing analytic method and listing proposed freight highway and rail projects to OFM & Transportation Committees.
AUGUST 2008WSDOT executive team, working with OFM, sends 2009/11 Highway System Plan proposals to the Governor’s Office.
2007 Transportation Budget Section 309 7(d) states that: “The department (WSDOT) and the freight mobility strategic investment board (FMSIB) shall submit a report to the office of financial management and the transportation committees of the legislature by September 1, 2008, listing proposed freight highway and rail projects. The report must describe the analysis used for selecting such projects…”
Highway Strategic Planning Timeline

5
Freight Rail Cost/Benefit Analysis Timeline
OCTOBER 2007WSDOT completed draft Rail System Benefit/Cost methodology.
OCTOBER 2007 –JANUARY 2008WSDOT convenes rail B/C work group.
DECEMBER 2007 WSDOT pilots application of methodology to evaluate new rail project proposals.
FEBRUARY –APRIL 2008WSDOT develops implementation plan. 2008
WSDOT completes implementation plan.
2008
WSDOT drafts policy.
2009WSDOT implements policy.
2007 Transportation Budget Section 7(a)-7(c) states that: “The department (WSDOT) shall develop a standardized format for submitting requests for state funding for rail projects that includes an explanation of the analysis undertaken, and conclusions derived from the analysis.”
Washington State Freight Strategic Plan
2006WSTC Rail Study

6
I. Global GatewaysInternational and National Trade Flows Through Washington
II. Made in WashingtonRegional Economies Rely on the Freight System
III. Delivering Goods To YouWashington’s Retail and Wholesale Distribution System
The Goal of Washington State’s Freight Systems Strategic Plan Is to Support Broad Industry Sectors
Full report available at: www.wsdot.wa.gov/freight/images/WTP_FreightUpdate.pdf

7
Freight Rail Strategic PlanSteps to Developing Freight Rail System Benefit-Impact Evaluation Methodology
Step Responsibility StatusRail System Analysis and Development of General Methodology
Washington State Transportation Commission Rail Capacity and Needs Study
Completed 2006
Benefit-Impact Evaluation and Benefit/Cost Analysis
WSDOT State Rail & Marine Office with Freight Systems Work Group
Draft completed 2007
Rail Stakeholder Work Group
WSDOT State Rail & Marine Office
2008
Washington State Rail Strategic and Policy Plan
WSDOT State Rail & Marine Office
2009

8
Freight Rail Strategic Plan
The Benefit/Impact Evaluation Will Include:
Benefit/cost analysisBenefit measuresRanking processIncorporation of value judgmentsUser group benefit evaluation
How much benefit will each stakeholder receive from the project?
Decision documentation
How is WSDOT using the Washington State Transportation Commission Rail System Study to create tools that are effective and easy to use?
The Benefit/Cost Analysis Will Include:
MeasuresTransportation and economic benefitsEconomic impactsExternal impactsYearly maintenance costsPresent value and net present value

9
Freight Highway Systems Strategic Planning: Seven Steps
Step 1: Quantify freight customer requirements
Step 2: Identify existing performance gaps
Step 3: Get good data
Step 4: Predict future freight demand
Step 5: Estimate additional economic output created by meeting demand
Step 6: Develop solution proposals
Step 7: Prioritize solutions based on their ability to meet the state’s goals

10
Progress to date in determining:• Industry sectors freight needs• Current freight system deficits• Economic growth opportunities
Step 1: Quantify Freight Customer Requirements
TITLE SOURCE STATUSWSDOT Freight Customer Survey: In-State and U.S. high-volume users
WSDOT Freight Systems Division
Completed 2004 and 2007
Interviews with high-volume shippers
WSDOT Freight Systems Division
Over 200 completed 2005-07 - ongoing
Truck Performance Measurement Research Project: Metro delivery survey
WSDOT Freight Systems Division and UW TransNow; funded by WA State Legislature in 2007 Transportation Budget
Due June 2009
11
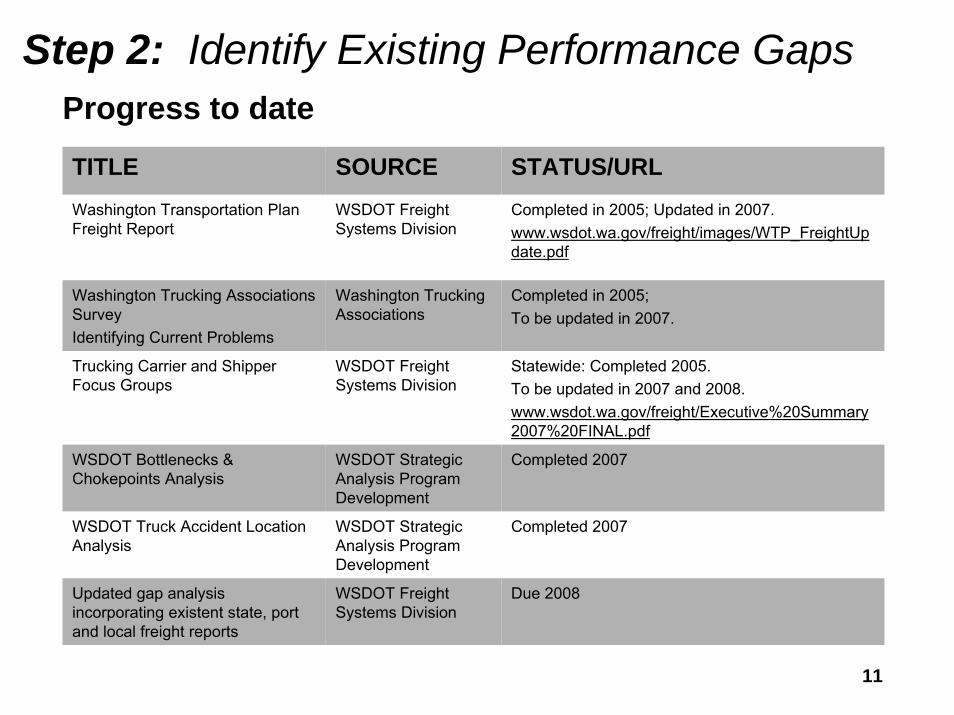
Step 2: Identify Existing Performance Gaps
TITLE SOURCE STATUS/URLWashington Transportation Plan Freight Report
WSDOT Freight Systems Division
Completed in 2005; Updated in 2007.www.wsdot.wa.gov/freight/images/WTP_FreightUpdate.pdf
Washington Trucking Associations SurveyIdentifying Current Problems
Washington Trucking Associations
Completed in 2005; To be updated in 2007.
Trucking Carrier and Shipper Focus Groups
WSDOT Freight Systems Division
Statewide: Completed 2005.To be updated in 2007 and 2008.www.wsdot.wa.gov/freight/Executive%20Summary2007%20FINAL.pdf
WSDOT Bottlenecks & Chokepoints Analysis
WSDOT Strategic Analysis Program Development
Completed 2007
WSDOT Truck Accident Location Analysis
WSDOT Strategic Analysis Program Development
Completed 2007
Updated gap analysis incorporating existent state, port and local freight reports
WSDOT Freight Systems Division
Due 2008
Progress to date

12
Washington Trucking Assns. Survey Shows Highway Features Impeding Truck Movement
12

13
Step 2: Identify Existing Performance Gaps
Bottleneck/Chokepoint Definition:Bottlenecks: places where roadways physically narrow, causing congestion (examples: lane drops; narrowing shoulders)Chokepoints: places where delay occurs because of traffic interference and/or the roadway configuration (examples: freeway interchanges; lack of left turn lanes at intersections; seasonal road closures)

14
There are challenges with gathering and analyzing freight data in the absence of a systematic freight data program
Step 3: Get Good Data
1. Most freight data in Washington State has been collected to manage state and local pavement programs; for example the Freight and Goods Transportation System (FGTS) data.
2. The data the state needs to develop a freight strategic plan has been gathered:
Intermittently and inconsistently, so we’re unable to use it to seetrends.
Project by project, not on a statewide standard, so we can’t compare it or compile it at a state level.
Without understanding industry uses; for example in the Port ofTacoma “Flying J” truck stop case study.
Without concern for freight service outcomes, so we can’t track progress towards industry goals.
3. Almost no data exists to inform decision makers about: ▪ Urban freight movements and local distribution ▪ Freight systems that support Washington's own producers and
manufacturers

15
Step 4: Predict Future Freight Demand
SECTOR SOURCE STATUS
Forestry/wood products UW College of Forestry & CTED Completed 2007
Mining Washington State University Unfunded
Washington State Commodity Flow Report
WSU Strategic Freight Transportation Analysis
Completed in 1997 & 2004 - update unfunded
Truck Performance Measurement Research Project: Central Puget Sound food and/or fuel delivery system
WSDOT Freight Systems Division and UW TransNow; funded by WA State Legislature in 2007 Trans. Budget
Due 2009
Waste/garbage system growth To be determined Unfunded
Columbia River Crossing Freight Report WSDOT SW Region Completed 2007
Highway 167 Freight Report WSDOT Urban Corridors Due 2008
Predict Central Puget Sound truck corridor growth; based on job and population growth in sub-regions
WSDOT Freight Systems Division and Puget Sound Regional Council
Unfunded
Top five agribusiness sectors:Livestock, Wheat, Fruit, Potatoes, Wine
Washington State University: Strategic Freight Transportation Analysis
Due Nov. 2007
Seafood Undetermined Unfunded
Progress to date for Regional Economies
Future truck freight highway demand by industry sector:
Estimating future truck freight highway demand in urban centers:

16
TITLE SOURCE STATUS
West Coast Corridor Coalition Freight Report predicting 20-year demand and capacity constraints between mega-regions: Seattle/Tacoma; Vancouver/Portland; San Francisco/Oakland; LA/Long Beach
West Coast Corridor Coalition Goods Movement Committee
Due Dec. 2007
Truck freight connectivity to Sea-Tac and King County Airport air cargo facilities
WSDOT Freight Systems Division Unfunded
Truck Growth; Port of Vancouver, USA Port of Vancouver Completed 2007
Port of Tacoma Port of Tacoma Due Oct. 2007
Port of Seattle Port of Seattle Due Oct. 2007
Port of Pasco Port of Pasco Underway
Marine Cargo Forecast Washington Public Ports Assn.; WSDOT Freight Systems Division
Completed 2004
Container port impact on warehousing growth Interviews with port and industry experts
Due Feb. 2008
Future locations of western Washington rail transload facilities
BNSF Pacific Northwest Market Report and transload projections
Completed 2007
Map I-5 corridor future development in Washington State by commercial/ industrial zoned parcels, flat grade, proximity to highway interchanges and transload centers
WSDOT Freight Systems Division Unfunded
For Port Growth:
Progress to date for the I-5 Corridor:
Step 4: Predict Future Freight Demand

17
Example: Forestry/wood products sector case study
Source: Dr. John Perez-Garcia – University of Washington Forest Products Report for WSDOT FSD– September 2007
Step 4: Predict Future Freight Demand

18
WSDOT funded an external review by a panel of economists of a test WSDOT conducted using REMI's TranSite Model to assess economic effects of two transportation projects, and determined:
Modeling the cost-benefit and economic impact of transportation project(s) cannot be accomplished in one simple model.There are significant resources and time required to manage the inputs and outputs of any model used. Even the most accepted models currently used have inherent flaws that limit the numeric value assigned to transportation investments.
Can Models Give Us the Entire Answer?Results of an Expert Panel Review of WSDOT REMI Pilot Study
Step 5: Estimate Additional Economic Output Created by Meeting Demand

19
Highway System PlanWhere the WTP freight strategies become planned highway projects that are scheduled for delivery in the regions.
State Highway Design StandardsWhere truck needs are incorporated into the WSDOT project scoping and delivery process.
OperationsWhere truck freight needs are understood and prioritized in WSDOT’soperations practices.
Planning (corridor and route development design guidelines)Where important state truck highway corridors are recognized, and truck needs for those facilities are built into their plans.
Step 6: Develop Solution Proposals
Critical path within WSDOT:

20
How Can We Prioritize Freight System Solutions?Negotiations begin when state decision makers have a thorough information basis.
Investment priorities may be judged against the proposal’s ability to meet the state’s goals:
1. Increased economic growth for the state’s regions and citizens2. Efficient use of public funds
▪ Is the solution the lowest cost opportunity?▪ Does it have ancillary benefits, such as safety and personal
mobility?▪ Are beneficiaries contributing?
3. Protect citizens quality of life▪ How does the solution manage community and
environmental impacts?
Step 7: Prioritize Solutions Based on Their Ability to Meet the State’s Goals

21
Next steps………
For more information:For a full copy of the WTP Freight Report:www.wsdot.wa.gov/freight
Washington State Department of Transportation Freight Systems DivisionPO Box 47407, Olympia, WA 98504-7407Phone: 360-705-7932Fax: 360-705-6835Email: [email protected]: www.wsdot.wa.gov/freight

Tab One
Washington Freight System

Recommedations (Continued)Recommedations (Continued)Recommedations (Continued)Recommedations (Continued)
• Replace the Interstate 5 Columbia River Bridge. • Create fuel pipeline capacity and distribution alternatives to
meet long-term demand by analyzing constraints, and removing obstructions so that the market may respond to increasing demand.
• Replace the Alaskan Way Viaduct.
• Complete the major north-south freight corridor system by
adding links from Highway 167 to Interstate 5, from Highway 509 to Interstate 5, and by completing Highway 18 to Interstate 90.
In SummaryIn SummaryIn SummaryIn Summary
The three components of Washington’s freight system are integrated and support our state’s economy: • International goods enter Washington State gateways and become
part of Washington’s manufactured output, or are distributed in our retail system. Washington’s global gateways also carry national and international goods to and from the larger U.S. market.
• Washington manufacturers and farmers ship products directly to customers and to wholesalers in national and international markets. These industries support hundreds of thousands of jobs and contribute billions of dollars to the gross state product.
• Washington wholesalers and retailers supply consumers with goods from all over the U.S. and the world. They sustain our modern economy.
Freight related issues such as security, safety and the environment are being considered in other parts of the update of the Washington Transportation Plan.
What ideas did we miss? What ideas did we miss? What ideas did we miss? What ideas did we miss?
We want the conversation about freight strategy to involve all parties. We need your help to make good investment choices that will address the needs of freight movement on our state’s transportation systems and facilities. Especially when there isn’t nearly enough money to do everything that clearly needs to be done.
January 2007
Washington TransportatioWashington TransportatioWashington TransportatioWashington Transportation Plan n Plan n Plan n Plan Freight Report: Executive Summary Freight Report: Executive Summary Freight Report: Executive Summary Freight Report: Executive Summary
OverviewOverviewOverviewOverview The three components of Washington State’s freight system: • Global Gateways – International and National Trade Flows Through Washington • Made in Washington – Regional Economies Rely on the Freight System • Delivering Goods to You – The Retail and Wholesale Distribution System underpin our national and state economies, support national defense, directly sustain hundreds of thousands of jobs, and distribute the necessities of life to every resident of the state everyday.
First, Washington is a gateway state, connecting Asian trade flows to the U.S. economy, Alaska to the Lower 48, and Canada to the U.S. West Coast. About 70 percent of international goods entering Washington gateways continue on to the larger U.S. market. Thirty percent become part of Washington’s manufactured output or are distributed in our retail system. Second, our own state’s manufacturers and farmers rely on the freight system to ship Washington-made products to local customers, to the big U.S. markets in California and on the East Coast, and worldwide. Washington’s producers generate wealth and jobs in every region in the state. Finally, Washington’s distribution system is a fundamental local utility, since without it our citizens would have nothing to eat, nothing to wear, nothing to read, no spare parts, no fuel for their cars and no heat for their homes. In other words, the economy of the region would no longer function. The value and volume of goods moving in these freight systems is huge and growing.
The Washington Transportation Plan (WTP) update is a blueprint for transportation programs and facilities. It covers state, county, and city transportation needs and systems. Work at the Washington State Transportation Commission and WSDOT was organized around nine themes: Washington Transportation Plan
System Preservation
Safety
System Efficiencies
Transportation Access
Bottlenecks and Chokepoints
Moving Freight
Health and Environment
Contributing to a Strong Economy and Good Jobs
Building Future Visions
The WTP Update is data-driven with information from all over the state and from users of every transportation mode. Representatives of cities, counties, Regional Transportation Planning Organizations, and transit providers have worked with WSDOT staff in preparing background papers. Many transportation interest groups and individual citizens have also contributed. A ten-year view of program directions, and investment priorities and needs emerged from this process – a vision for the plan that is supported in the statutory instruction provided to the Transportation Commission for this work (RCW 47.06.040).
For more on the WTP Update: www.wsdot.wa.gov/planning/wtp
WTP WTP WTP WTP ---- Moving Freight Moving Freight Moving Freight Moving Freight
Barbara Ivanov [email protected]
Elizabeth Robbins [email protected]
For More Information: For a full copy of the Freight Report: Freight Systems Division http://www.wsdot.wa.gov/freight/images/WTP_FreightUpdate.pdf PO Box 47322, Olympia, WA 98504-73223 Phone: 360-705-7932 Fax: 360-705-6835 Web: http://www.wsdot.wa.gov/freight
$0
$20
$40
$60
$80
$100
$120
$140
$160
U.S. Int'l Imports
Via WA Gateways
U.S. Int'l Exports
Via WA Gateways
Washington
Producers &
M anufacturers
Washington
Wholesale/Trade
Washington
Retail
Washington
Transportation
Services
Made in Washington
Regional economies rely on the
freight system
Global Gateways
International and national trade
flows through Washington
Delivering Goods to You
Washington's retail and wholesale
distribution system
Aircraft
Washington State Value of Freight ShipmentsWashington State Value of Freight ShipmentsWashington State Value of Freight ShipmentsWashington State Value of Freight Shipments
(2005: Billions of Dollars)
* Washington State Department of Revenue and Washington State Department of Community, Trade and Economic Development
Delivering Goods to YouDelivering Goods to YouDelivering Goods to YouDelivering Goods to You
Global GatewaysGlobal GatewaysGlobal GatewaysGlobal Gateways
* Port of Tacoma
Made in WashingtonMade in WashingtonMade in WashingtonMade in Washington
* Washington Wheat Commission
* United Parcel Service of America, Inc. (UPS)

What is the purpose of the WTP freight report?What is the purpose of the WTP freight report?What is the purpose of the WTP freight report?What is the purpose of the WTP freight report?
The report is presented to decision-makers to support Washington State’s strategic investment plan in the freight transportation system. It is organized in three chapters that explain Washington’s role as a gateway state, how freight transport supports Washington’s regional economies, and the role of the local distribution system. The report analyzes original research and existent information about Washington State freight customers, to inform decision-makers: • Who are the customers of the state’s freight system • Why freight customers matter in terms of jobs and contribution to Gross State Revenues • What performance the customers expect from the freight system • Where key performance gaps are located • How decision-makers may make the most productive strategic investments in Washington State’s freight system. The report provides context for the system’s assessment by featuring more than a dozen case studies of Washington State freight carriers, producers and distributors. It defines terms to create a common vocabulary, and summarizes data from state and federal freight studies relevant to Washington.
What are the findings?What are the findings?What are the findings?What are the findings?
Globalization, competitive industry trends, and new technologies are pushing freight volumes up twice as fast as Washington’s overall population and traffic growth. Without strategic investment by the public sector, our natural population growth, intensified by these three trends, will choke international trade flows through the state, undermine regional economies, and spill over into competition for road capacity in congested metro centers. With strategic investment, Washington will continue to compete. While Washington State’s population grew from 4.1 million to 6.1 million from 1980 to 2003 (the 45 percent increase includes substantial in-migration), and is projected to grow to 8.3 million (a 34 percent increase) by 2030, growth in the freight system is increasing at a much higher rate.1 Truck trips increased by 94 percent on the Interstate 5 corridor, and by 72 percent on the Interstate 90 corridor, in the ten years between 1993 and 2003.2 From 1998 to 2020, freight volumes in Washington State are expected to increase by 80 percent.3
Global Gateways Global Gateways Global Gateways Global Gateways –––– Intern Intern Intern International and National Trade Flows Through Washingtonational and National Trade Flows Through Washingtonational and National Trade Flows Through Washingtonational and National Trade Flows Through Washington
As shown in the following map, Washington State’s strategic location positions it as an important and growing gateway for trade access to the Pacific Rim, Canada, and U.S. states. Focusing on markets and supply chains, this section is organized by East - West trade (including containers traveling from Asia to Chicago, agriculture from the Midwest to Asia and military transport) and North - South trade (including Canadian trade, freight along the West Coast and Alaskan trade). Globalization, in particular the emergence of China and Asia as an important part of the factory floor for the United States, will double the volume of imported container freight entering the Ports of Seattle and Tacoma by 2025.4 Midwest and East Coast consumers, at the far end of the Asia-to-United States supply chain, purchased about three-fourths of the international goods entering Washington ports in 2005. Most of these goods are shipped to the Midwest in containers via rail, but there isn’t enough east-west rail capacity to handle a doubling of current volume. Global security needs and our national defense depends on the United States’ ability to rapidly project force when needed. Fort Lewis is the only Power Projection Platform on the West Coast. In the event of a major conflict, essential equipment and supplies will rush to Fort Lewis from all over the United States by rail and road, then ship through the Ports of Tacoma, Olympia and Seattle to support the troops.
1 Washington State Office of Financial Management 2 Washington State University, Strategic Freight Transportation Analysis 3 U.S. Department of Transportation 4 BST Associates. 2004 Marine Cargo Forecast
What alWhat alWhat alWhat alternatives are available?ternatives are available?ternatives are available?ternatives are available?
Manufacturers, agricultural growers and processors, and distributors state that there is no practical alternative to Washington’s major highway system, and use Interstate 5 and Interstate 90 as primary freight routes. In the north-south freight corridor, significant congestion is found on Interstate 5 from Everett to Olympia and over the Columbia River Bridge, and the full length of I-405 and Highway 167. If the Alaskan Way Viaduct fails, up to 110,000 trucks and cars (enough to fill two freeway lanes in each direction) will try to move to Interstate 5, everyday, increasing congestion by nearly 40 percent.5 In addition, the north-south freight corridor system is incomplete between Interstate 5 and Highway 509 and Highway 167. The majority of Washington State air cargo moves through Seattle-Tacoma International and King County Airports, therefore congestion on Interstate 5 in Central Puget Sound, and eastbound on Highway 518 from Sea-Tac to Interstate 5, directly impacts reliability and on-time performance of the state’s air cargo system. Trucking companies may try to schedule around congestion patterns, but must meet customer demands for on-time service in preferred time windows. In the east-west freight corridor, severe weather closures on Interstate 90 at Snoqualmie Pass cut off Eastern Washington producers from their major markets in Central Puget Sound and points south.
What are the recommendations?What are the recommendations?What are the recommendations?What are the recommendations?
The WTP Freight Strategy identifies twelve highly productive investments Washington State can make to generate overall economic prosperity and wealth to citizens in the state. These improvements are necessary to support Washington’s role as a global gateway, our own state’s manufacturers and agricultural growers, and the state’s retail and wholesale distribution systems.
• Address freight constraints in the Interstate 5 corridor from Everett to Olympia. Analyze the benefits of a public-private truck-
toll highway from Central Puget Sound to the Oregon border. This highway could be an extension of Interstate 5, or follow the Interstate 405/Highway 167/Highway 512/ Interstate 5 route, or be a separate facility.
• Improve Interstate 90, east of and over Snoqualmie Pass, to prevent severe weather closures.
• Identify, establish and fund a statewide core all-weather county road system.
• Support growth in east-west mainline rail capacity and port-rail connections, and preserve rail yards in metro areas.
o The Burlington Northern Santa Fe Railway’s (in track miles and volume the state’s largest railroad) top priorities include adding siding along the Columbia River Gorge, enlarging ‘crown-cutting’ Stampede Pass to accommodate double-stacked trains, and completing the Swift siding improvement at the Canadian border and the Vancouver bypass route.
o Review the relationship between freight and passenger rail service on the Interstate 5 rail corridor, and ensure that growth of passenger rail does not encumber freight service.
• Maintain the Columbia-Snake River barge system by implementing a strategic dredging and lock maintenance plan. • Complete the statewide Commercial Vehicle Information System Network (CVISN)/ Weigh-In-Motion system.
• Preserve and enhance freight access to hub airports in metro areas. Add a third eastbound lane on Highway 518 from
Seattle-Tacoma International Airport to Interstate 5, to support the statewide air cargo system.
• Create an ongoing, appropriate level of funding for regional economic development freight projects, port and intermodal access improvements, grade separations, shortline rail improvements, and truck route program to optimize truck movements in metro areas.
5 U.S. Department of Transportation, Washington State Department of Transportation, and City of Seattle
Trade Through Washington by Volume

Global Gateways (Continued)
The military traffic will attempt to surge through two freight systems that have already reached their capacity limits: east-west rail road lines, and on Interstate 5 in Central Puget Sound.6 Washington’s own largest waterborne export is food, mostly grain. Eighty-five percent of eastern Washington wheat is shipped to Asia via Columbia River ports, but farmers struggle to get product through the state’s freight system.7 Growers can’t get produce off the farm up to two months a year due to weight-restrictions on county roads, and the Columbia-Snake River system is at risk due to federal restrictions on dredging and lock maintenance. The Port of Vancouver rail yard is severely congested, slowing wheat exports and creating a bottleneck in the Pacific Northwest’s rail system. By far, Washington’s largest waterborne import is crude oil from Alaska, shipped to the state’s refineries.8 Refined product: gas, diesel and jet fuel, then moves by pipeline or barge to distribution centers and is trucked to gas stations. Although Washington’s citizens and industries consume 17.6 million gallons of petroleum per day, making the state’s consumption 17th in the United States, and consumption is growing, the Olympic Pipe Line, currently operating at close to 100 percent capacity, has no plans to add pipeline capacity in the state.9 Cross-border truck volumes have nearly doubled at western Washington crossings over the past 11 years.10 This growth has strained border crossing facilities and enforcement agencies processes, resulting in queues of trucks north and southbound.
Made in Washington Made in Washington Made in Washington Made in Washington –––– Regional Economies Rely on the Freight Syste Regional Economies Rely on the Freight Syste Regional Economies Rely on the Freight Syste Regional Economies Rely on the Freight Systemmmm
This chapter is organized by the state’s regional economies, as shown in the following map. The seven regions profiled include Southeast Washington, Columbia Basin and North Central Washington, Central Puget Sound, Spokane Region, Vancouver and Southwest Washington, Northwest Washington, and Coastal Counties. Our state’s regions have built strong and distinct economies based on industry and agriculture. Over 519,000 jobs in regional manufacturing, agriculture, construction and forestry depend on Washington’s freight system, and accounted for $145.7 billion, or 36 percent of all state gross business revenues in 2005.11 Transportation is especially important for Washington agriculture because the state produces about three times as much food – and for some commodities up to twenty times as much on a tonnage basis – as it consumes, and it is separated by long distances from the majority of the nation’s consumers.12 More efficient freight systems will help Washington manufacturers compete in the larger West Coast market. Competitive pressure to cut inventories from every step in the manufacturing process is reshaping industrial supply chains, and causing more frequent freight shipments. The Boeing Company, employing 65,000 in Central Puget Sound, is Washington’s largest manufacturer with $22.7 billion in airplane revenues in 2005.13 Boeing’s dependence on the state’s freight system will become even greater as it sets new levels of efficiency in the manufacture of the new 7E7 Dreamliner. Although Boeing has historically made planes from up to a million smaller pieces and shipped them by truck, train and boat, its new strategy to gain efficiency is based on major component assembly. Fewer parts, with more frequent deliveries, will support their just-in-time inventory reduction strategy. Cost-cutting inventory reduction strategies are also underway at thousands of other mid-market manufacturers and producers around the state. For example, the Vancouver Frito-Lay plant receives up to 50 truckloads of fresh potatoes each week from growers in the Columbia Basin. The plant keeps just enough potatoes on hand for one eight-hour shift; if the potatoes do not arrive
6 Surface Deployment and Distribution Command - Transportation Engineering Agency 7 Washington Wheat Commission 8 U.S. Army Corps of Engineers 9 Energy Information Administration 10 Whatcom Council of Governments 11 Washington State Office of Financial Management and Washington State Department of Revenue 12 Washington State University, Strategic Freight Transportation Analysis 13 Boeing Company
Washington State Regional EconomiesWashington State Regional EconomiesWashington State Regional EconomiesWashington State Regional Economies

on time, the plant cannot run. WaferTech’s one-million-square-foot semiconductor foundry in East Clark County can’t function without fast and reliable air cargo; if a tool is delayed overnight in the supply chain from Taiwan, the plant will shut down and idle 1,000 employees. Farmers ship vegetable produce over 200 miles from Prosser to Costco in Central Puget Sound, and are required to deliver within 15 minutes of their scheduled appointment. These competitive trends are repeated in thousands of manufacturing plants, construction sites, agricultural growers and processors, and distributors facilities in Spokane, Bellingham, TriCities and across the state - driving logistics practices toward perfect flow that puts more trucks on the road, more frequently, with ever-shorter delivery windows. Spokane regional manufacturers and health care system practitioners, and Eastern Washington agricultural growers and processors, all cite severe winter weather closures on Interstate 90 at Snoqualmie Pass as Eastern Washington’s top freight priority. They ship to customers in Central Puget Sound, so fixing delays on Interstate 5 from Everett to Olympia comes in a close second. Northwest and Southwest Washington manufacturers and trucking firms are also shipping to the Central Puget Sound region, so they put fixing the Interstate 5 corridor at the top of the list. The Columbia Basin/North Central Washington agricultural center leads the nation in apple and potato production. Apples and potatoes must be shipped in refrigerated truck or rail cars; 90 percent are trucked to market. Continued refrigerated truck shortages are likely due to seasonal peak demand and an ongoing pull from other U.S. regions for refrigerated capacity.
Delivering Goods to You Delivering Goods to You Delivering Goods to You Delivering Goods to You –––– The Retail and Wholesale Distribution System The Retail and Wholesale Distribution System The Retail and Wholesale Distribution System The Retail and Wholesale Distribution System
Distribution is a critical component of the freight system, as it produces up to 80 percent of all truck trips in metropolitan areas, and serves the retail, wholesale and business services sectors.14 Over 732,000 jobs are involved in the distribution system; accounting for $221 billion in 2005 gross business revenues, equal to 71 percent of total state revenues.15 An enormous variety of goods are handled on this system; food and groceries, fuel, pharmaceuticals and medical supplies, retail stock, office supplies and documents, trash and garbage, construction materials and equipment. Distribution companies must provide fast and ubiquitous service that is reliable under all conditions. FedEx and UPS drivers do not go home until every package is delivered. Hospital patients cannot wait for drug deliveries. Washington's modern service economy depends on speed of delivery through the freight system. The most common method of distributing goods is by truck from large Distribution Centers (DCs) to stores and businesses. When those trucks run into congestion, companies compensate for delays by sending more trucks out on the road, causing even more congestion. Land use costs are also causing higher truck volumes. For example, in response to increased consumer demand for a wider variety of food products, grocers are increasing overall store size and shelf space. But back-storage space doesn’t generate sales, so modern grocery stores are reducing expensive, non-productive storage space. This requires more frequent deliveries in smaller quantities; one Seattle specialty grocery store, for example, receives 375 truck deliveries per week.16 New technologies enable companies to track more and more trucks, balance their inventories and capital usage, while managing very tight delivery windows. For example, UPS and FedEx’s high-tech logistics services allow companies to track inventory on the Internet no matter which warehouse, truck, or other location holds their products. By implication, the greatest increase in overall truck volumes will be seen in many more, smaller trucks on the roads.
14 Cambridge Systematics, with TranSystems Corporation, Heffron Transportation, and the University of Washington 15 Washington State Office of Financial Management and Washington State Department of Revenue 16 Heffron Transportation, Inc.
-
50,000
100,000
150,000
200,000
250,000
300,000
Light Trucks (LocalDelivery)
Medium Trucks (ShortHaul)
Heavy Trucks (LongHaul)
Most Commercial Trucks Licensed in Washington Most Commercial Trucks Licensed in Washington Most Commercial Trucks Licensed in Washington Most Commercial Trucks Licensed in Washington
StaStaStaState Are Lightte Are Lightte Are Lightte Are Light
Washington State Department of Licensing, September 2004.

WSDOT Statewide Rail Capacity and System Needs Study
The Washington Rail Capacity and System Needs Study was requested by the Washington State Legislature to:
• Assess rail needs in the State; • Determine the State’s interest in the rail system; • Develop policies to govern the State’s participation in the rail system; and • Develop a plan for managing the rail lines, railcars, and service rights owned by the
State. The Economic Vitality of Washington State Requires a Robust Rail System The economic vitality of Washington State requires a robust rail system capable of providing its businesses, ports, and farms with competitive access to North American and overseas international markets. For example:
• Manufacturers, lumber and wood products producers, and central and eastern Washington agriculture and food products businesses rely on rail transportation to move heavy, bulky products to market cost effectively.
• The State’s ports and international trade industry depend on rail to export grain and other agricultural products and to import intermodal containers of consumer goods.
• A high-quality intercity passenger rail service offers an alternative to automobile and air travel that can help reduce congestion, energy use, and environmental impacts of highways.
The System Is Nearing Capacity The benefits that Washington State can obtain from a robust rail system are threatened because the system is nearing capacity. The pressure on the rail system will increase in the next decades. Between 2005 and 2025, the output of the Washington State economy (measured as gross state product) is expected to grow at an average of 3.5 percent per year. The total freight tonnage moved over the Washington State rail system is expected to increase by about 60 percent over the period. To accommodate this growth, many more rail lines within Washington State will be operating at or above their practical capacity.
How can I get additional information?
The 2006 Washington Rail Capacity and System Needs Study Final Report is available online at: www.wstc.wa.gov/Rail/RailFinalReport.pdf
WSDOT Statewide Rail Capacity and System Needs Study October 2007 Scott Witt, WSDOT, [email protected] or 360-790-4833 Page 1

Tab Two
Freight Rail Strategic Plan

Rail Strategic Plan & Methodology
The WSDOT Rail Strategic Plan involves a benefit/costs (B/C) analysis calculator which has been developed based on the recommendations provided in the Washington State Transportation Commission Study (2006). The B/C calculator is being used in the Rail Bank Grant project evaluations for grant amounts up to $250,000. Moving forward in the development of the Benefit/Impact Evaluation Methodology, the B/C calculator will be updated to include additional measures and calculations based on proposed scope, cost, and location of projects. This information will be a useful tool in long and short range planning processes. A work group is being convened to collaborate on the Benefit/Impact Methodology that will be used to evaluate future rail projects. Members include WSDOT, FIMSIB, Department of Agriculture, Labor, Association of Washington Cities, Port of Tacoma, WPPA and WTC. Membership in the work group will be adjusted based on expertise requirements. The Benefit/Impact Evaluation Methodology will include the following:
• Benefit/Cost Analysis
• Measures
• Ranking
• Incorporation of Value Judgments
• User Group Benefit Evaluation
• Decision Documentation A Benefit/Impact Evaluation Methodology draft is being developed that will be used by the work group as a starting point.
WSDOT Rail Strategic Plan October 2007 Scott Witt, WSDOT, [email protected] or 360-705-6903 Page 1

Tab Three
Freight Highway Strategic Plan
WSDOT Statewide Freight Customer Needs Study
The overall goal of this study was to understand how well the state transportation system is working for companies that rely heavily on shipping and/or receiving goods via truck, rail, sea or air – either singularly or in multi-modal forms. The results of the study will be used to propose improvements that will help reduce delays and improve efficiency in the state transportation system. This year the study included not only firms based in Washington and Portland but also national freight users who route freight shipments from Asia through West Coast ports.
Comparisons with 2004 study
• Outsourcing - At least 70-80% of manufacturing and wholesale businesses reported outsourcing at least part of their shipments, as did 50-70% of wood firms.
• Requirements of Freight User – The top three system requirements included cost per move, on-time delivery and predictable travel time. While these requirements were also the most commonly cited in 2004, there did appear to be a trend in the data (30.3% down to 21.8%) where cost per move has been growing less important relative to the time variables.
• Affect of Problems and Expenses on Business – Average ratings of impact from shipping problems have risen from 5.65 in 2004 to 6.62 on average for 2007, and these changes were seen across the industry clusters. These problems can be attributed to increased traffic congestion, traffic times and its effect on predictability, as well as increased cost competition.
• Other Comparisons - The importance of the State Freight System and the Satisfaction with Current Freight Performance (based on the most important requirement) received minimal differences between the 2004 and 2007 studies.
How can I get additional information?
The 2007 WSDOT Freight Customer Study Final Report is available online at: www.wsdot.wa.gov/freight/Executive%20Summary2007%20FINAL.pdf
WSDOT Statewide Freight Customer Needs Study October 2007 Elizabeth Stratton, WSDOT, [email protected] or 206-716-1178 Page 1

WSDOT Truck Safety and Efficiency Survey Conducted in 2005
In order to begin locating and prioritizing problem locations for trucks on the highway system, WSDOT has utilized surveys conducted by the Washington Trucking Associations (WTA). These surveys help identify locations that have truck safety issues, and efficiency bottlenecks and chokepoints on the statewide freight system. The input assists the agency in learning which of these features (if any) negatively impact trucking companies’ use of the system, and which locations they consider high priorities for improvement. In January 2005, WSDOT asked the Freight Mobility Strategic Investment Board (FMSIB) and WTA for their members’ input. The WTA surveyed members using a WSDOT questionnaire in January 2005. WTA received input from 55 motor carriers and compiled it for WSDOT. FMSIB provided lists of problematic sites developed at a July FMSIB: Transportation Commission forum, and from work done in 2002. The attached map graphically displays the location of problem locations identified through the survey.
WSDOT Truck Safety and Efficiency Survey Conducted in 2005 October 2007 Elizabeth Stratton, WSDOT, [email protected] or 206-716-1178 Page 1

90
5
82
90
5
1012
12
97
395
195
730
97
2
101
2
12
20
28
26
25
410
14
17
27
155
24
23
4
3
112
7
21
9
503
504
6
105
530
124
231
507
174
109
129
260
22
142
172
240
291
508
99
153
261
141
18
243127
16
31
221
161
241
821
104
262
125
500
525
11
194
165
8
106
103
123
539
211
206
283
971
706
510
512
173
397
225
970
546
122
292
542
9
101
28
14
26
2
Route CharacteristicsTruck Collisions(Per 10 Mile Segment)
5 - 12
13 - 19
20 - 26
27 - 33
34 - 40
truck_percent EventsEst. Truck AADT
< 1,000 1,000 - 4,000 4,000 - 10,000 10,000 - 20,000 > 20,000
Freight Mobility Corridor Issues
"Under 23 U.S. Code, Section 409, this data cannot be used in discovery or as evidence at trial in any action for damages against State, Tribal or Local Government that involves the locations mentioned in this data."
Heavy Truck AADT And Fatal/Disabling/Evident Collisions

Existing Highway Deficits Identified by Truck Focus Groups
Southwest Washington Truck Focus Group: April 30, 2007
Current highway deficits identified by focus group: • Roundabouts restrict or complicate oversize load truck movement • Interstate 5 (I-5) corridor constraints and congestion:
• Chehalis/Centralia area due to distribution center growth • Maytown interchange • Highway 500 from I-5 to Anderson Mall exit • Columbia River Crossing
• Weight restricted bridges: • Lewis and Clark Bridge south of Woodland • I-5 Nisqually Bridge northbound exit
• Port of Tacoma Road interchange • Highway 14 westbound interchange at I-205 • Lack of truck parking along I-5 corridor from Everett to Olympia • Ability to access fuel and truck centers from I-5 in the event of major
transportation disruption
South Sound Truck Focus Group: June 28, 2007
Current highway priorities identified by focus group: • Complete Highway 509 to create alternate to I-5 and support air
freight • Build Cross-Base Highway to support industrial/commercial growth • Complete Highway 167 to Highway 509/Port of Tacoma • Widen I-5 to three lanes between Rochester and Toledo
Current highway deficits identified by focus group: • I-5 interchange at exit 79, chokepoint and height restrictions • Lander Street Overpass completion • Highway 519 solution • Spokane Street needs to be widened • Port of Tacoma Road completion • I-5 exit at Fife cannot handle future growth in truck trips • Weight restrictions on I-5 Nisqually Bridge
Existing Highway Deficits Identified by Truck Focus Groups in 2007 October 2007 Elizabeth Stratton, WSDOT, [email protected] or 206-716-1178 Page 1

169
16
525
410
512
5
405
90
2
3
99
18
202
16
167
169
104
522
525
509
162
302
516
19
164
524
305
520
512
527
116
900
303
181
160
96
307
166
526
163
599
9
Route CharacteristicsTruck Collisions(Per 10 Mile Segment)
5 - 12
13 - 19
20 - 26
27 - 33
34 - 40
Est. Truck AADT < 1,000
1,000 - 4,000
4,000 - 10,000
10,000 - 20,000
> 20,000 Puget Sound Region
Freight Mobility Corridor Issues
"Under 23 U.S. Code, Section 409, this data cannot be used in discovery or as evidence at trial in any action for damages against State, Tribal or Local Government that involves the locationsmentioned in this data."
Heavy Truck AADT And Fatal/Disabling/Evident Collisions

WSDOT Bottlenecks and Chokepoints Analysis for Freight Highway System Planning
The bottlenecks and chokepoints analysis used by WSDOT Systems Analysis and Program Development can be a source of information to identify, confirm, and prioritize existing freight highway system deficits. This is used, in conjunction with other data sources, in step 2 of the freight highway system strategic planning process.
Definitions and Criteria for Bottlenecks and Chokepoints in the 2007 to 2026 Highway Systems Plan Update
Bottlenecks are locations where roadways physically narrow, causing congestion (examples: reduced number of lanes; narrowing shoulders).
Chokepoints are locations where recurring delay occurs because of traffic interference and/or the roadway configuration (examples: freeway interchanges; lack of left turn lanes at intersections; seasonal road closures).
Observed congestion must be supported with traffic data and analysis models.
Criteria for identifying chokepoints and bottlenecks:
• The congestion problem impacts the flow of mainline through traffic. • The impact on mainline traffic flow is measured as peak hour speeds equal to
or less than 70 percent of the posted speed. • Traffic flow criteria for ramps will also be considered to determine if the
congestion is caused by on/off ramp traffic.
The Washington Transportation Plan (WTP) identified funding targets for a statewide list of chokepoint and bottleneck locations. This list will be used to create strategies to address congestion in these specific locations.
How can I get additional information?
The 2007 – 2026 Highway System Plan Working Draft is available online at: www.wsdot.wa.gov/NR/rdonlyres/90E46A45-2000-4D34-BF8D FAB6B3541508/0/DraftHSPOpt.pdf
WSDOT Bottlenecks and Chokepoints Analysis for Freight Highway System Planning October 2007 Elizabeth Stratton, WSDOT, [email protected] or 206-716-1178 Page 1


WSDOT Highway Mobility Analysis for Freight Highway System Planning
Congested Corridors
To identify where congestion exists today (2005), computer models were used to identify where vehicles currently travel below 70 percent of the posted speed during the peak hour, as shown in the maps on the next pages. However it is important to note that the analysis performed does not reflect the impact of congestion associated with local roads, ramps, interchanges, weather, special events, construction, collisions or incidents. This is the criteria used to determine both Interstate and non-Interstate congested corridors. For long-range planning purposes, future year conditions must be forecast to determine when and where congestion will occur. Computer analysis was used to forecast 24-hour operating conditions for the year 2030 to identify locations where the peak-hour travel speeds fell below 70 percent of the posted speed. Of those locations, the segments with the most significant delay regionally (or at the county level) were chosen as study corridors for this update. Routes that were identified but not studied will be addressed in future updates. These projected future conditions reflect the completion of the mobility projects included in both the 2003 “Nickel” funding package and the fully funded projects included in the 2005 Transportation Partnership Act (TPA). The goal is to manage the system to achieve maximum throughput/productivity. When travel speeds fall below 70 percent of posted speed, or about 42 mph, the highway no longer operates efficiently. It is this condition that was targeted by WSDOT as the threshold for determining when a highway requires capital improvements to restore efficient operating conditions.
The Washington Transportation Plan (WTP) identified funding targets for a statewide list of chokepoint and bottleneck locations. This list will be used to create strategies to address congestion in these specific locations.
How can I get additional information?
The 2007 – 2026 Highway System Plan Working Draft is available online at: www.wsdot.wa.gov/NR/rdonlyres/90E46A45-2000-4D34-BF8D-FAB6B3541508/0/DraftHSPOpt.pdf
WSDOT Highway Mobility Analysis for Freight Highway System Planning October 2007 Elizabeth Stratton, WSDOT, [email protected] or 206-716-1178 Page 1

90
5
20
410
101
2
12
90
5
12
82
97
153
26101
31
97
14
Operates Less Than Efficiently Operates Efficiently
Peak-Hour Operating Conditions Experienced in 2005 on State Highways
Analysis/Map Developed by:Systems Analysis and Program DevelopmentOctober 2007These conditions do not reflect the impact of congestion associated withlocal roads, additional impacts associated with ramps, interchanges,weather, special events, construction, collisions or incidents.

90
5
20
410
101
2
12
90
5
12
82
97
153
26101
31
97
14
Projected Peak-Hour Operating Conditions for 2030 on State Highways
Operates Less Than Efficiently
Operates Efficiently
Peak-Hour Operating Conditions Experienced in 2005 on State Highways
Analysis/Map Developed by:Systems Analysis and Program DevelopmentOctober 2007These projected future conditions reflect the completion of the mobility projects includedin both the 2003 “Nickel” funding package and the fully funded projects included in the2005 Transportation Partnership Act (TPA). These projections do not reflect the impact ofcongestion associated with local roads, additional impacts associated with ramps,interchanges, weather, special events, construction, collisions or incidents.

Freight Efficiency & Competitiveness The Freight Efficiency and Competitiveness Study provides a comprehensive look at the freight delivery supply chain of major industries in the Central Puget Sound region. The study pinpoints areas of inefficiency in the freight delivery system and provides data to support the creation of a strategic investment plan for Washington State’s freight transportation system. This requires a thorough understanding of who is using the freight system, what things they value most in a delivery system, and where the largest inefficiencies in the system exist. In order to gather this information, this study followed an industry outreach process that focused on three major manufacturing supply chains in the Central Puget Sound region: building and construction, processed foods, and aerospace. The following key findings are discussed in detail in the main body of the report. In general terms, they include the following insights:
• Most of the Puget Sound regions’ industrial activity is located in the area from Seattle south to Pierce County, with concentrations in the Green River Valley (the region which includes the cities of Kent, Auburn, Renton, Tukwila, and parts of Sumner in Pierce County).
• Trucks are the most relied-upon mode for local and regional shipping needs. • Freight-intensive operations (industrial and warehouse) development is
growing further to the south, with most of the growth occurring from Tacoma south to Lewis County.
• Every company in the Puget Sound Region is dependent on the same highway network, with several sections being relied on by almost every industry.
• Businesses have had to adapt to local congestion. • There is little to no redundancy in the primary regional freight corridors. • There is a constant shortage of qualified truck drivers in the Puget Sound
region. • It is difficult to access local ports due to congestion at the port gates. • Growth in the urban areas has resulted in increased parking restrictions and
reduction of truck staging and maneuvering facilities. • Certain policy issues inhibit and negatively affect freight movements.
How can I get additional information?
The 2006 Freight Efficiency and Competitiveness Final Report is available online at: www.wsdot.wa.gov/freight/Freight%20Efficiency%20Study%20-%20Final%20Report.pdf
Freight Efficiency and Competitiveness October 2007 Elizabeth Stratton, WSDOT, [email protected] or 206-716-1178 Page 1

Washington State Truck Parking Needs
The Washington State Department of Transportation (WSDOT) Truck Parking Study evaluated the adequacy of truck parking along Washington State’s primary freight corridors (Interstate 5, Interstate 90 and Interstate 82) and identified several strategies to increase the amount of truck parking in the future. Why was the Truck Parking Study performed? The WSDOT Truck Parking Study was performed primarily for three reasons:
1) The Federal Highway Administration (FHWA) Study of Adequacy of Commercial Truck Parking (June 2002) reported a 14 percent shortage of truck parking within Washington State for public rest areas and commercial truck stops combined. Given the conclusions of the FHWA Study and the fact that Washington has not added to the supply of truck parking at public facilities since 1995, WSDOT staff conducted this study to identify where the truck parking shortages are the highest.
2) WSDOT staff and others have also observed trucks parked in a variety of illegal areas such as freeway on- and off- ramps and shoulders. WSDOT wanted to determine the extent of illegal truck parking and if a shortage in truck parking could be the reason.
3) WSDOT is also concerned about roadway safety. A shortage of truck parking contributes to truck drivers driving while fatigued and/or parking illegally, both of which can cause accidents.
How much will truck parking demand increase in the future? The demand for truck parking is expected to increase substantially in the future. Truck trips have increased by 94 percent along the I-5 corridor and by 72 percent along the I-90 corridor between 1993 and 2003 (Strategic Freight Transportation Analysis 2003). The FHWA Study of Adequacy of Commercial Truck Parking Facilities (June 2002) estimated Washington’s 20-year forecasted annual increase in truck parking demand to be 2.1 percent. After reviewing a variety of data specific to Washington State, the annual increase in truck parking demand in the WSDOT Truck Parking Study was estimated to be 3.5 percent along I-5 and I-82 and 4.0 percent along I-90. Therefore, if no additional truck parking is added, the existing truck parking shortages will continue to worsen. Both truck driver and other driver safety will be increasingly compromised as tired truck drivers will continue to drive while they are fatigued and/or to park illegally.
How can I get additional information?
The 2005 WSDOT Truck Parking Study Final Report is available online at: www.wsdot.wa.gov/freight/Truck%20Study-Final.pdf
WSDOT Truck Parking Study October 2007 Elizabeth Stratton, WSDOT, [email protected] or 206-716-1178 Page 1


Corridor Studies and Route Development Plans
Corridor studies and route development plans can provide information that is used in the freight highway system strategic planning process. These plans provide a long range vision for corridors. They vary in length and level of detail.
Corridor Studies: • Identify land use, population, and employment trends. • Gather information about multimodal travel conditions, safety, and inventory of
environmental issues. • Develop transportation models to understand existing and future travel conditions. • Develop and evaluate improvement options. • Develop planning level cost estimates for recommendations. • Potential near- and long-term phasing of projects that can be incrementally
implemented. • WSDOT uses Corridor Studies to make right-of-way decisions and environmental
inventories to flag major issues that need to be considered in project development (e.g. wetland issues, slopes, and cultural resources).
• Recommended improvements are incorporated into the Puget Sound Regional Council’s Transportation Plan (Destination 2030) and the Washington Transportation Plan.
Example: SR 167 - Valley Freeway Corridor Plan State Route 167 is a primary highway connecting south King and north Pierce counties to the Seattle/Bellevue metropolitan area. The corridor serves a growing number of housing developments and lies along the largest freight distribution center in the region. About one-third of the region's trucking and storage facilities are located along the corridor. SR 167 is also an important alternative route to I-5 for moving both people and goods in the Puget Sound Region. The Washington State Department of Transportation (WSDOT), King and Pierce counties, and cities along SR 167 are in the process of identifying projects to help reduce congestion and improve safety on SR 167 from South 180th Street in Renton to SR 161 in Puyallup.
SR 167 – Valley Freeway Corridor Quick Facts • The SR 167 corridor extends 23
miles from Renton to Puyallup. • Six hours of delays are experienced
each day along SR 167. • The corridor supports 9,000 truck
trips each day.
Corridor Studies and Route Development Plans for Freight Strategic Planning October, 2007 Elizabeth Stratton, WSDOT, [email protected] or 206-716-1178 Page 1

Background Information SR 167 Valley Freeway Corridor Plan – Project Map In 2003, elected officials from south King
County asked WSDOT to assist them with a long range investment plan. The plan identified specific transportation improvement projects in King, Pierce, and Snohomish counties and proposed a way to fund the project through voter approved local taxes and fees. The RTID proposal is currently being modified and is expected to go to voters this November. The Washington State Legislature is providing $9.6 million to complete the SR 167 corridor plan and begin environmental analysis of high-priority projects. The plan will outline the long-range investment strategy for SR 167 from Renton to Puyallup for the next 25 years. The information gained by going through the RTID process in 2003 will be incorporated into the current corridor planning effort.
The End Result
The result of this effort will be a plan that makes recommendations for addressing demand and accommodating growth over the next 25 years along the SR 167 corridor. The SR 167 corridor plan will be developed with the input from members of the Corridor Working Group and the public. The plan will also serve as a continuation of past planning efforts to address transportation demands within the SR 167 corridor.
What is the project timeline?
The SR 167 corridor plan will be completed by fall 2007. The environmental review of high-priority projects began in 2006. The 2005 gas tax will fund the extension of the HOV lanes from Auburn to approximately 8th Avenue South in Pacific, which is one of the high-priority projects identified in the analysis. The extension of the HOV lanes in the southbound direction will reduce the number of vehicles merging into heavy traffic in the high volume SR 167/SR 18 interchange area.
How can I get more information on the SR 167 Corridor Plan?
Contact: Carol Hunter, WSDOT Urban Planning Office (206) 464-1219 or [email protected] Online: http://www.wsdot.wa.gov/Projects/SR167/ValleyFreewayCorridorPlan/
Corridor Studies and Route Development Plans for Freight Strategic Planning October, 2007 Elizabeth Stratton, WSDOT, [email protected] or 206-716-1178 Page 2

Truck Mobility Design Concepts and SR 167 Corridor Study The efficient movement of freight by truck in the Green River Valley supports the vital economic function of warehouse and distribution centers in the valley, and the State of Washington’s international trade network. Trucks moving freight rely on capacity and uncongested conditions to reduced travel time, improve reliability, minimize collisions, and reduce cost. This memorandum presents options to improve truck mobility and discusses their applicability to the SR 167 corridor.
Options for improved truck mobility on SR 167
The benefits of truck-only facilities are limited to locations with very high volumes of trucks and trucks traveling to or from a single location (through truck trips, direct access, etc.). Truck operators recognize that improvements to truck mobility will also benefit all general purpose traffic. In addition, truck-friendly design concepts throughout the corridor will accrue benefit to all major truck movements within and through the SR 167 corridor, whether or not the location warrants a truck-only facility. Examples of major improvements that could provide improved mobility for trucks are:
• Geometric design enhancements to minimize the speed differential of trucks and general-purpose traffic.
• Geometric improvements to increase capacity and reduce the crash rate – grades, ramp curves and super elevation, merge and weave distances, and clear zones to fixed objects.
• Truck by-pass of ramp meters. (Allows trucks to accelerate for the entire length of the ramp rather than starting from a stop at the ramp meter, which is near the merge point.)
• Interchange bypass lanes Intelligent Transportation System (ITS) applications to improve freeway operations and to provide truck-specific information including advance information about major construction changes, real-time information about incidents and emergencies, and changeable message signs in advance of route choice.
• Incident management to quickly clear blockages.
How can I get additional information?
The 2007 WSDOT SR 167 Corridor Study Truck Mobility Design Concepts DRAFT is available online at: www.wsdot.wa.gov/freight/Truck%20Study-Final.pdf
Truck Mobility Design Concepts and SR 167 Corridor Study October 2007 Elizabeth Stratton, WSDOT, [email protected] or 206-716-1178 Page 1

WSDOT Development of a Washington State Freight Data System At the heart of effectiveness and efficiency in the U.S. transportation system, especially for that of freight, is the data that support transportation investment decisions, prioritization, and overall policy development at the national, regional and local level. Very little systematic data exists to inform decision makers about the economic impact, system bottlenecks, and supply chains flowing through freight systems that support Washington State producers and delivery of goods to consumers. This study has identified freight data uses, needs and gaps nationally and in the State of Washington. Specific recommendations of a framework to provide the needed data and data generating processes include the following:
• Phase I: Identification of Data Gaps, Needs and Uses (Time Frame: current and on going)
• Phase II: Librarian/Educator, Resource to Manage Freight Data Warehouse (Time Frame: within six months)
• Phase III: Freight Database Manager, Technical Resource (Time Frame: within one year)
• Phase IV: Dedicated Funds for Operations/Data Development (Time Frame: year one and on going)
The fourth phase of this proposal is to dedicate resources to design, develop and implement freight data collection efforts addressing identified deficiencies. A continuing component of this effort will involve developing relationships with private or quasi public firms in order to learn from them their desired transportation system performance and their needs, and earning the confidence of these decision makers.
How can I get additional information?
The 2007 Development of a Washington State Freight Data System Study Draft Report is available online at: www.wsdot.wa.gov/freight/Final%20Draft%20Freight%20Data%20Report_Aug2007.pdf
WSDOT Development of a Washington State Freight Data System October 2007 Barb Ivanov, WSDOT, [email protected] or 206-716-1166 Page 1

WSDOT Freight and Goods Transportation System (FGTS) The Freight and Goods Transportation System (FGTS) is a ranking of roads in Washington State by average gross annual truck tonnage carried. The system is affected by changes in the economy, international trade, and the transportation industry such as changes in truck travel patterns, cargoes and tonnages. Revisions to the Freight and Goods Transportation System routes and tonnage classifications are developed by the agency having jurisdiction over the roadway segment. The Washington State Department of Transportation (WSDOT), with the assistance of the Association of Washington Cities (AWC) and the County Road Administration Board (CRAB), updates the FGTS on a periodic basis. This is the fourth update of the FGTS since the Transportation Commission adopted the original report in 1995. The FGTS identifies the highways and roadways most heavily used by trucks and provides factual data to support funding for projects that improve conditions for freight transportation. This information also supports planning for pavement upgrades, traffic congestion management and other investment decisions.
How can I get additional information?
The 2005 WSDOT Freight and Goods Transportation System Update is available online at: www.wsdot.wa.gov/freight/FGTS/FGTS%202005%20Final%20Report.pdf
WSDOT Freight and Goods Transportation System October 2007 Elizabeth Stratton, WSDOT, [email protected] or 206-716-1178 Page 1

Washington State Truck Needs Assessment
The Truck Needs Assessment study was designed to analyze and document the characteristics of truck movements within one of the state’s major urban areas, the City of Seattle. The information from this study will help state and local planners better understand truck movements, including operational characteristics related to different economic activities, and test current assumptions used in estimating truck volumes. The purpose of this study was to:
• Document truck volumes, routes, and operational characteristics related to different economic activities in the City of Seattle.
• Show the key corridors used by trucks and the relative volume of trucks using them.
• Test the use of truck classification counts as a means to supplement existing data gaps in describing and understanding truck activity in an urban area.
• Provide additional data on truck volumes and operational characteristics in the City of Seattle.
• Identify truck volume trends associated with different economic activities (land uses) in a metro city—such as peak travel periods—and describe why they are important to local, regional and state economies.
The WSDOT, City of Seattle, Manufacturing Industrial Council, and Heffron Transportation, Inc. worked together to identify and prioritize a list of up to twenty locations for truck classification counts. A variety of locations were selected to provide a comparison of freight characteristics on different types of streets and in different economic activity centers (e.g., commercial versus industrial areas). This study was not intended to provide a comprehensive data base of all arterials in the City of Seattle, and the number of counts performed was limited both by the physical characteristics of the street as well as the project’s budget. This initial count set is intended to be the first sample of data, and additional counts should be added over time.
How can I get additional information?
The 2005 WSDOT Truck Parking Study Final Report is available online at: www.wsdot.wa.gov/freight/Truck%20Study-Final.pdf
WSDOT Truck Needs Assessment October 2007 Elizabeth Stratton, WSDOT, [email protected] or 206-716-1178 Page 1

Forest Products Use of Roadways and Transload Facilities in Washington
The study calculates road and rail use by the forest products sector in Washington. It uses existing survey data on harvest levels and mill production activities, as well as recent analyses on the future of Washington forests. It maps the location of harvest activity, roads, rails, transloaders, and milling capacity. It considers demand end users. The study estimates the number of log truck loads using these data and other information, and expects the number of log loads to increase over time due to a projected increase in the harvest levels in southwestern Washington and the changing diameter and volume measure of log trucks. The concentration of log trucks is in Thurston, Grays Harbor, Lewis and Cowlitz counties. In 2004 a conservation number of nearly 800,000 truck loads moved logs from harvest sites to log users. This number will grow to over 1 million by 2020. Logs traveling by rail are not common in Washington. The study projects an increase in harvest levels and with it an increase in road use by log trucks. The smaller diameter also has implications on how many truck loads are calculated. It indicates an increase in truck loads needed to carry smaller diameter logs for the same board foot volume measured. The combined effect is to increase the number of log truck loads by 643,000 in western Washington. Capacity in lumber production is also projected to increase. The increase implies an additional 7,600 trailer loads and 2,800 rail cars annually. Finally all numbers and estimates presented in this report are a first attempt to document rail, road and transload facility use by the forest sector in Washington. Estimates presented in the study were calculated using the best available yet imprecise methods and data due to time and budget constraints. While we find the numbers to be within expectations, further work is needed to develop more precise estimates of the demand for road and rail services by the forest sector in Washington.
How can I get additional information?
The 2007 Forest Products Use of Roadways and Transload Facilities in Washington Final Report is available online at:
Forest Products Use of Roadways and Transload Facilities in Washington October 2007 Barb Ivanov, WSDOT, [email protected] or 206-716-1166 Page 1

Washington State Freight Needs and Port Growth - Port of Vancouver
An assessment of existing and projected freight needs on the SW Washington State System by the Port of Vancouver is highlighted below. Included are total trip/truck trip projections, and some discussion of what they see as potential future needs on the State system.
• Current Truck Counts - POV current truck trips are approximately 185,000 truck trips per year.
• Projected Development, Trip Generation Rates and Truck
Percentages & Peak Trips The following projections are based on full build-out of Parcels 3, 1A, 8 & Alcoa Evergreen –approximately 690 net acres. This development will occur in phases, with projected total build out within 10 years.
Rail Freight - Development will be a combination of maritime and industrial property. The Port is currently about 70% reliant on rail, with expectations to grow to 80% by full build out. Our last rail counts were in 2004, totaling approximately 45,000 cars/year. Projections are for this number to increase to 120,000 – 160,000 within 10 years. The West Vancouver Freight Access Project will allow the Port to accommodate this growth. Trucks/Surface Transportation - Projections were produced by Anne Sylvester, Parametrix. Includes projections for 2013, 2018 and 2025.
• Future Impacts to State Facilities The Port is in the process of identifying state and local facility mitigation needs for future development/freight increases.
I-5 (Columbia River Crossing Project) Since most of the Port of Vancouver’s truck routes require access to the south and east, the Columbia River Crossing Project (CRC) will be critical in ensuring freight movement in and out of the Port and SW Washington. Our freight interests lie in ensuring capacity and velocity is predictable, reliable and safe for trucks on the bridge, and within the influence area of the project (north to SR 500, south to Columbia Boulevard in Portland.
Port Growth – Port of Vancouver October 2007 Elizabeth Stratton, WSDOT, [email protected] or 206-716-1178 Page 1

West Coast Trade System Analysis The West Coast trade and transportation system is a critical gateway for freight traffic entering/leaving the country while also serving the domestic trade traffic between mega regions on the West Coast and the rest of the U.S. Goods moving through this system serve local, regional, national, and international markets. Recent increases in Pacific Rim trade (particularly from China), NAFTA trade, and domestic trade (associated with the high level of population and economic growth of the West Coast States), coupled with increasing congestion and decreasing reliability of the region’s transportation system is leading to concerns about whether the system can absorb projected growth over the next several decades. System capacity constraints that prohibit further growth may have economic implications that reverberate locally, regionally, nationally, and internationally. This study is designed to understand the trends and issues affecting the West Coast trade and transportation system at a regional level and to provide a foundation and a process to allow the Coalition and its members to work with national transportation policy makers, the private sector freight community, and its local partners to begin addressing specific system-wide issues and chokepoints that cross jurisdictional, interest, and financial boundaries. The study will focus on two primary questions:
• What is the capacity of the existing West Coast trade and transportation system to absorb additional Pacific Rim trade over the next 20 years?
• What is the capacity of the existing West Coast freight transportation system to absorb additional trade between U.S. mega-regions over the next 20 years?
West Coast Trade System Analysis October 2007 Barb Ivanov, WSDOT, [email protected] or 206-716-1166 Page 1

Freight Transportation Resiliency Study-Phase 1
The primary benefit of this collaborative research effort is an improved ability to understand the economic importance and significance of different components of the transportation system to the primary industries throughout the region. This knowledge will allow more efficient system wide management and efficient prioritization of resources in response to catastrophic events, should they happen. Additionally, the development of a statewide freight flow map will yield many future benefits relative to freight planning and infrastructure investment prioritization.
The key deliverables from this research are:
1. An empirical approach and methodology that can be used to estimate the
economic impact and the vulnerability of different economic industry sectors to disruptions in the transportation system both within the state of Washington, or to any region in which it is applied.
2. A Washington statewide freight transportation network flow map. 3. Results from the application of this methodology, which utilizes the statewide
freight transportation flow map, to three to five (initially one or two) examples in Washington State which could help guide state transportation policy.
This work was motivated by the desire of the Washington State Department of Transportation to have a Freight System Resiliency Plan. This plan will allow the State to appropriately consider the requirements of the freight transportation system users and the state economy, when responding to disruptions to the transportation system. While many states have emergency response plans for significant incidents, and incident response plans for small scale disruptions, we are not currently aware of any state that has considered the economic consequences of disruption in their planning.
WSDOT Freight Resiliency Plan October 2007 Barb Ivanov, WSDOT, [email protected] or 206-716-1166 Page 1