developed and developing world responsibilities for...
TRANSCRIPT

Developed and developing world responsibilities forhistorical climate change and CO2 mitigationTing Weia, Shili Yanga, John C. Moorea,b,c, Peijun Shia, Xuefeng Cuia, Qingyun Duana, Bing Xua,d, Yongjiu Daia,Wenping Yuana, Xin Weia, Zhipeng Yanga, Tijian Wena, Fei Tenge, Yun Gaof, Jieming Choua, Xiaodong Yana,Zhigang Weia, Yan Guoa, Yundi Jiangg, Xuejie Gaog, Kaicun Wanga, Xiaogu Zhenga, Fumin Reng, Shihua Lvh,Yongqiang Yui, Bin Liue, Yong Luoj, Weijing Lik, Duoying Jia, Jinming Fenga, Qizhong Wua, Huaqiong Chenga,Jiankun Hee, Congbin Fui, Duzheng Yei, Guanhua Xua, and Wenjie Donga,1
aState Key Laboratory of Earth Surface Processes and Resource Ecology, College of Global Change and Earth System Science, Beijing Normal University,Beijing 100875/Zhuhai 519087, China; bArctic Centre, University of Lapland, PL122, 96100 Rovaniemi, Finland; cDepartment of Earth Sciences, UppsalaUniversity, Villavägen 16, Uppsala SE-75236, Sweden; dDepartment of Environmental Science and Engineering, Tsinghua University, Beijing 100084, China;eEnergy, Environment, and Economy (3E) Research Institute, Tsinghua University, Beijing 100084, China; fClimate Change Division, Department of Scienceand Technology, China Meteorological Administration, Beijing 100081, China; gNational Climate Center, China Meteorological Administration, Beijing100081, China; hCold and Arid Regions Environmental and Engineering Research Institute, Chinese Academy of Sciences, Lanzhou 730000, China;iInstitute of Atmospheric Physics, Chinese Academy of Sciences, Beijing 100029, China; jCenter for Earth System Science, Tsinghua University, Beijing100084, China; and kLaboratory for Climate Studies, China Meteorological Administration, Beijing 100081, China
Edited by Mark H. Thiemens, University of California San Diego, La Jolla, CA, and approved June 18, 2012 (received for review March 4, 2012)
At the United Nations Framework Convention on Climate ChangeConference in Cancun, in November 2010, the Heads of Statereached an agreement on the aim of limiting the global tempera-ture rise to 2 °C relative to preindustrial levels. They recognizedthat long-term future warming is primarily constrained by cumula-tive anthropogenic greenhouse gas emissions, that deep cuts inglobal emissions are required, and that action based on equitymust be taken to meet this objective. However, negotiations onemission reduction among countries are increasingly fraught withdifficulty, partly because of arguments about the responsibility forthe ongoing temperature rise. Simulations with two earth-systemmodels (NCAR/CESM and BNU-ESM) demonstrate that developedcountries had contributed about 60–80%, developing countriesabout 20–40%, to the global temperature rise, upper ocean warm-ing, and sea-ice reduction by 2005. Enacting pledges made atCancun with continuation to 2100 leads to a reduction in globaltemperature rise relative to business as usual with a 1/3–2/3 (CESM33–67%, BNU-ESM 35–65%) contribution from developed anddeveloping countries, respectively. To prevent a temperature riseby 2 °C or more in 2100, it is necessary to fill the gap with moreambitious mitigation efforts.
climate modeling ∣ Coupled Model Intercomparison Project phase 5 ∣Cancun pledge ∣ climate ethics ∣ geoengineering
The impact of human activities on climate change at global andregional scales, including surface temperature (1), sea-level
pressure (2), tropopause height (3), precipitation (4), and oceanheat content (5), has been explored and assessed. Greenhousegas emissions, mostly CO2, are the most important anthropogenicforcing on climate (6). The contribution of greenhouse gas emis-sions varies widely among nations in both the past and the future.As a result, the United Nations Framework Convention on Cli-mate Change (UNFCCC) reached an agreement that each nationshould accept its “common but differentiated responsibilities.”This ethical construct demands attribution studies of the his-torical contribution of emissions to climate change (7). To date,research has tracked the causal chain of climate change from hu-man activities to greenhouse gas emissions, to radiative forcing,and finally to climate change. However, this conventional meth-odological flow does not consider the reverse process or includefeedbacks from climate change to greenhouse-gas concentrationsvia biogeochemistry or decision-making processes (8). More than100 countries have adopted a global warming limit of 2 °C orbelow (relative to preindustrial levels) as a guiding principlefor mitigation efforts to reduce climate-change risks, impacts,and damage (9, 10). The relationship between the climate policy
making and the 2 °C target by an appropriate emission pathwayhas been studied in simple climate models and probabilistic ana-lysis (11, 12). However, climate projection experiments undermany emission scenarios, even the latest representative concen-tration pathways (RCPs) (13), have not considered actual inter-governmental agreements.
In this study we quantify the responsibilities for CO2 emissionsof developed and developing countries and demonstrate the ef-fect of emission cuts following the Cancun pledges on global tem-perature rise. Our study differs from earlier attempts in that weuse two state-of-the-art, coupled earth-system models, NCAR/CESM (14) and BNU-ESM (15) (Materials and Methods), ratherthan a simple model to demonstrate the effect of CO2 emissionfrom different country groups on global historical temperaturerise and future mitigation.
Results and DiscussionWe divided nations by their UNFCCC Annex I status (Fig. S1).Three experiments were designed (Table S1): (i) ALL: globalanthropogenic emissions [equivalent to the Coupled ModelIntercomparison Project phase 5 (CMIP5) (16) 20th-century his-tory experiment]; (ii) AX1: anthropogenic emissions only allowedfrom developed countries (i.e., Annex I countries); and (iii) NX1:anthropogenic emissions only allowed from developing countries(i.e., non-Annex I countries).
Fig. 1 shows the observed and simulated CO2 concentrationfrom the models. CO2 concentration and its rising trend simu-lated by ALL are overestimated by the CESM model during thelast 50 years, while the BNU-ESM model gives an underestimateduring the late 19th and 20th centuries. However, this is notcritical in the assessment of relative contributions. Since our se-paration into the two emission groups was only aimed at theanthropogenic CO2 without consideration of other forcing, theincrease of atmospheric CO2 concentration simulated by ALL
Author contributions: W.D. designed research; T. Wei, S.Y., J.C.M., P.S., X.C., and W.D.performed research; X.W., Z.Y., T. Wen, F.T., Q.W., and J.H. contributed new reagents/analytic tools; T. Wei, S.Y., and Y. Guo analyzed data; and T. Wei, S.Y., J.C.M., P.S., X.C., Q.D.,B.X., Y.D., W.Y., X.W., Z.Y., T. Wen, F.T., Y. Gao, J.C., X.Y., Z.W., Y. Guo, Y.J., X.G., K.W., X.Z.,F.R., S.L., Y.Y., B.L., Y.L., W.L., D.J., J.F., Q.W., H.C., J.H., C.F., D.Y., G.X., and W.D. wrotethe paper.
The authors declare no conflict of interest.
This article is a PNAS Direct Submission.
Freely available online through the PNAS open access option.1To whom correspondence should be addressed. E-mail: [email protected].
This article contains supporting information online at www.pnas.org/lookup/suppl/doi:10.1073/pnas.1203282109/-/DCSupplemental.
www.pnas.org/cgi/doi/10.1073/pnas.1203282109 PNAS Early Edition ∣ 1 of 5
EART
H,A
TMOSP
HER
IC,
AND
PLANETARY
SCIENCE
S

is nonlinearly dependent on the sum of that by AX1 and NX1.Weovercome this by using the “normalized proportional” method toget the relative contributions from developed and developingcountries (Materials and Methods). Results show that the contri-bution to the increased CO2 concentration from 1850 to 2005estimated by CESM is 61% from the developed countries and39% from the developing countries (for BNU-ESM the split is63%–37%). A simple carbon-cycle model (17) simulated the con-tributions as 70% and 30% for developed and developing coun-tries, respectively (Fig. S2).
Robust evidence (1, 6, 18) shows significant changes in theatmosphere, ocean, and cryosphere in response to climate changethat may be attributed to radiative forcing. Radiative forcing isproportional to the logarithm of CO2 concentration and is di-vided 53–47% by CESM (BNU-ESM 62–38%) for the developedand the developing countries from 1850 to 2005 using the normal-ized proportional approach. Additionally, the same approachresults in splits of 60% versus 40% (BNU-ESM 64–36%) for glo-bal mean air temperature rise (Fig. 1), 61% versus 39% (BNU-ESM 87–13%) for northern hemisphere sea ice reduction, and58% versus 42% (BNU-ESM 71–29%) for global upper oceanic(0–700 m) heat-content increase between developed and devel-oping countries, respectively (Fig. S3).
The differences between impacts and radiative forcing attribu-tion reflects the earlier CO2 emissions from the developed coun-tries in comparison to the developing countries and the longresponse times associated with cryospheric and oceanic processes(5). The relatively greater contributions from the developedworld estimated by the BNU-ESM compared with the CESMare due to the relatively smaller increase in radiative forcing after1950 in the BNU-ESM.
Fig. 2 shows the linear-trend patterns of temperature changeduring the 20th century (1906–2005) simulated by CESM and
BNU-ESM. It is clear that the CESM gives somewhat largerwarming than the BNU-ESM as expected given the higher CO2
concentrations and radiative forcing of the CESM (Fig. 1). Thespatial distribution from both models of the rising trends in sce-nario AX1 share great similarity to that in scenario ALL, whilethat in scenario NX1 differs significantly. At high northern lati-tudes, where warming is most significant, temperature increasesin NX1 are 1.5 °C∕100 y less than that modeled by ALL. Duringthe latter part of the 20th century, world ocean heat content(0–3000 m) increased significantly (19, 20). This oceanic warmingtrend also can be seen in the ALL run, especially in the upper700 m. Under the AX1 scenario, this trend diminished slightlyin most waters except for those north of 60 °N. The warming trendmodeled by NX1, however, is smaller in all waters. The increasedoceanic and Arctic air temperatures under the AX1 scenariolead to a decreasing trend in sea-ice fraction in the NorthernHemisphere. In contrast, the NX1 case shows much less Arcticwarming and greater sea-ice distribution over the NorthernHemisphere (Fig. S4).
To analyze the impact of the Cancun pledge (10), we devel-oped CO2 emission pathways for the 21st century dependingon whether Annex I and non-Annex I nations follow a business-as-usual path or adopt a CO2 mitigation policy (21). These emis-sion scenarios are: (i) ABNB: Annex I and non-Annex I countriesignore their pledges and pursue business as usual; (ii) ABNC: An-nex I countries follow business as usual, non-Annex I countriesfollow the Cancun pledges and then make a 50% deviation frombusiness as usual by 2050 and zero emissions by 2100; (iii) ACNB:Annex I countries follow the Cancun pledges and then make 80%reductions by 2050 and zero emissions by 2100, non-Annex Icountries follow business as usual; and (iv) ACNC: both groupsof countries follow the Cancun pledges and further reductionsoutlined above.
CESM BNU-ESM
Global CO2 Concentration
Global CO2 Radiative Forcing
Global Air Temperature (Ref 1850-1869)
5y running avgNX1AX1ALLHadCRUT3v
Global CO2 Concentration
Global CO2 Radiative Forcing
Global Air Temperature (Ref 1850-1869)
Fig. 1. CO2 concentration and air temperature in three historical experiments simulated by two earth-system models (Left: CESM; Right: BNU-ESM). Top:Observed (black, supplied by CMIP5) and modeled time series of annual CO2 concentration from ALL (red, historical emission), AX1 (blue, developed worldemissions only), and NX1 (green, developing world emissions only). Middle: Annual radiative forcing for the three experiments. Bottom: Five-year runningaveraged global mean air temperature anomaly relative to 1850–1869 with shading showing the range of values from 10 models’ CMIP5 14 esm-historicalexperiments. The models are BCC-ESM, BNU-ESM, CanESM2, CESM1_0_2, inmcm4, GFDL-ESM-2M, GFDL-ESM-2G, HadGEM2-ES, MIROC-ESM, and MPI-ESM-LR.The black line is the observed air temperature from HadCRUT3v (31).
2 of 5 ∣ www.pnas.org/cgi/doi/10.1073/pnas.1203282109 Wei et al.
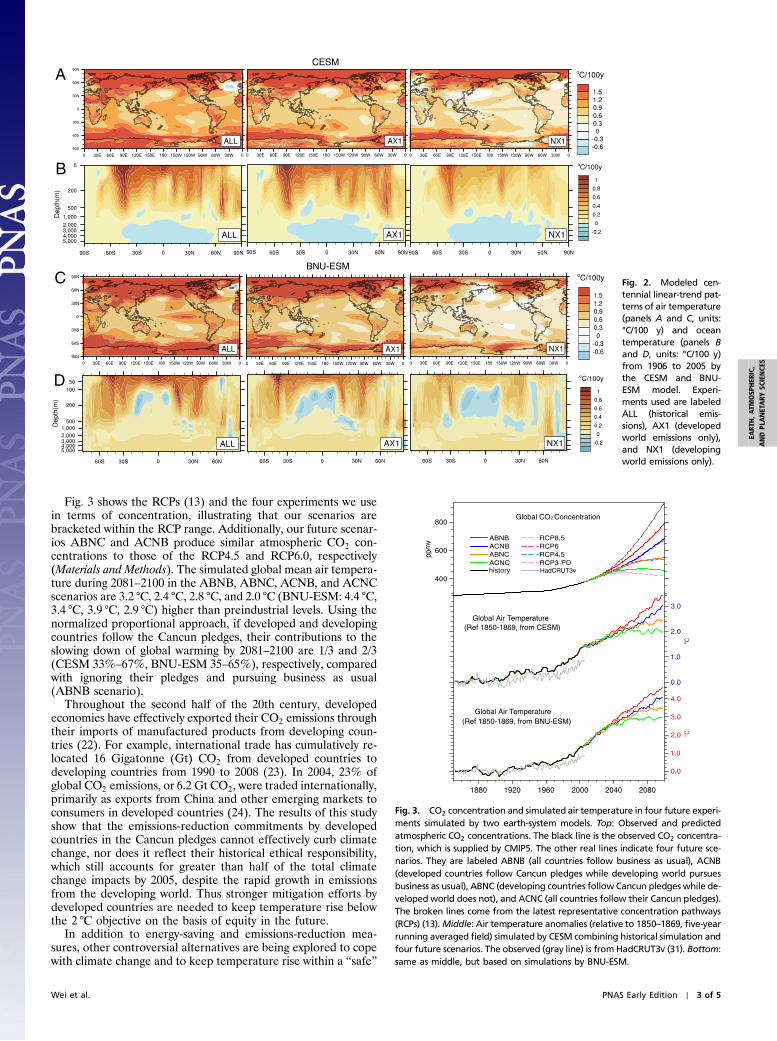
Fig. 3 shows the RCPs (13) and the four experiments we usein terms of concentration, illustrating that our scenarios arebracketed within the RCP range. Additionally, our future scenar-ios ABNC and ACNB produce similar atmospheric CO2 con-centrations to those of the RCP4.5 and RCP6.0, respectively(Materials and Methods). The simulated global mean air tempera-ture during 2081–2100 in the ABNB, ABNC, ACNB, and ACNCscenarios are 3.2 °C, 2.4 °C, 2.8 °C, and 2.0 °C (BNU-ESM: 4.4 °C,3.4 °C, 3.9 °C, 2.9 °C) higher than preindustrial levels. Using thenormalized proportional approach, if developed and developingcountries follow the Cancun pledges, their contributions to theslowing down of global warming by 2081–2100 are 1/3 and 2/3(CESM 33%–67%, BNU-ESM 35–65%), respectively, comparedwith ignoring their pledges and pursuing business as usual(ABNB scenario).
Throughout the second half of the 20th century, developedeconomies have effectively exported their CO2 emissions throughtheir imports of manufactured products from developing coun-tries (22). For example, international trade has cumulatively re-located 16 Gigatonne (Gt) CO2 from developed countries todeveloping countries from 1990 to 2008 (23). In 2004, 23% ofglobal CO2 emissions, or 6.2 Gt CO2, were traded internationally,primarily as exports from China and other emerging markets toconsumers in developed countries (24). The results of this studyshow that the emissions-reduction commitments by developedcountries in the Cancun pledges cannot effectively curb climatechange, nor does it reflect their historical ethical responsibility,which still accounts for greater than half of the total climatechange impacts by 2005, despite the rapid growth in emissionsfrom the developing world. Thus stronger mitigation efforts bydeveloped countries are needed to keep temperature rise belowthe 2 °C objective on the basis of equity in the future.
In addition to energy-saving and emissions-reduction mea-sures, other controversial alternatives are being explored to copewith climate change and to keep temperature rise within a “safe”
HadCRUT3v
Global CO2 Concentration
Global Air Temperature(Ref 1850-1869, from CESM)
Global Air Temperature(Ref 1850-1869, from BNU-ESM)
Fig. 3. CO2 concentration and simulated air temperature in four future experi-ments simulated by two earth-system models. Top: Observed and predictedatmospheric CO2 concentrations. The black line is the observed CO2 concentra-tion, which is supplied by CMIP5. The other real lines indicate four future sce-narios. They are labeled ABNB (all countries follow business as usual), ACNB(developed countries follow Cancun pledges while developing world pursuesbusiness as usual), ABNC (developing countries follow Cancun pledgeswhile de-veloped world does not), and ACNC (all countries follow their Cancun pledges).The broken lines come from the latest representative concentration pathways(RCPs) (13).Middle: Air temperature anomalies (relative to 1850–1869, five-yearrunning averaged field) simulated by CESM combining historical simulation andfour future scenarios. The observed (gray line) is fromHadCRUT3v (31). Bottom:same as middle, but based on simulations by BNU-ESM.
CESM
BNU-ESM
B
A
C
D
Fig. 2. Modeled cen-tennial linear-trend pat-terns of air temperature(panels A and C, units:°C/100 y) and oceantemperature (panels Band D, units: °C/100 y)from 1906 to 2005 bythe CESM and BNU-ESM model. Experi-ments used are labeledALL (historical emis-sions), AX1 (developedworld emissions only),and NX1 (developingworld emissions only).
Wei et al. PNAS Early Edition ∣ 3 of 5
EART
H,A
TMOSP
HER
IC,
AND
PLANETARY
SCIENCE
S

(2 °C) limit (25). Should mitigation and adaptation measuresprove to be difficult, states may be tempted to turn to geoengi-neering without sufficient research into consequences includingits political implementation (26). The governance issues raised,however, as with other challenging social questions, cannot beaddressed by simple measurement or models but must be rea-soned out and are beyond the scope of this paper, except foremphasizing the urgency of addressing these issues.
Materials and MethodsModel Description. The two models we use here have participated in theCMIP5 and will be used as assessment tools in the 5th Assessment Reportof the Intergovernmental Panel on Climate Change (IPCC) (16). The Commu-nity Earth System Model (CESM1_0_2) (14) is a fully coupled earth-systemmodel. It is composed of four separate models simultaneously simulatingthe earth’s atmosphere (CAM4), ocean (POP2), land surface (CLM4), andsea-ice (CICE4), and it includes one central coupler component (CPL7). Ithas an interactive carbon cycle model in the land component and an ecosys-tem-biogeochemical module in the ocean component. The first version ofBeijing Normal University—Earth System Model (BNU-ESM) (15) is a fullycoupled earth-system model. In addition to one central coupler component(improved NCAR-CPL6), it contains four separate models simultaneously si-mulating the earth’s atmosphere (NCAR-CAM3.5), ocean (GFDL-MOM4p1),land surface (BNU-CoLM3), and sea ice (LANL-CICE4.1). It has an interactivecarbon cycle model in the land component (BNU-DGVM based on LPJ) and anecosystem-biogeochemical module in the ocean component (IBGC). In thetwo models, simulated atmospheric CO2 concentrations are fully coupledto land and ocean CO2 fluxes and are thus used directly to compute radiativeforcing. Methane release due to permafrost melting is a potentially huge im-pact on warming. But CESM and BNU-ESM have only very simple carbon per-mafrost models presently and no marine methane release is included.
Historical Simulations. Time series of industrial CO2 emissions (i.e., fossil-fuelburning, cement manufacturing, and gas flaring in oil fields) are available at1° × 1° spatial resolution from 1751 to 1949 at annual resolution and from1950 to 2007 at monthly resolution (27). Deforestation is an important factorcontributing to total carbon emissions (28). A significant number of forests indeveloping countries were cut during the 1960s to 1980s, mostly to supplythe demands from the developed countries that had already depleted theirown forest resources (29). Therefore, we do not consider deforestation as anattributing factor by nation (Fig. S2). We used the CESM version 1_0_2 at0.9° × 1.25° resolution and the BNU-ESM version 1.0 at T42 resolution(approximately 2.8 ° × 2.8 °). The model was integrated over the historicalperiod (1850–2005) by prescribing the three kinds of CO2 emissions (i.e.,ALL, AX1, NX1). Other forcings varying over the historical period includenon-CO2 greenhouse gases (CH4, N2O, halocarbons), aerosols, solar irradi-ance, and volcanoes (Table S1).
Future Simulations. For future simulations we conducted four experiments(i.e., ABNB, ABNC, ACNB, and ACNC) covering the period from 2006 to2100. We calculated global carbon emission projections to CO2 concentrationin the atmosphere using the MAGICC5.3 model (30). We then applied theCESM at 1.9° × 2.5° resolution and the BNU-ESM at T42 resolution, employingthe global CO2 concentrations as the forcing data instead of the interactivecarbon cycle used in the historical scenarios. Other forcing was based on thehistorical and RCP4.5 (Table S2).
Normalized Proportional Approach. If we define VAX1 as the outcome of theCO2 emissions from developed countries between some start and endingdates, those from developing countries as VNX1, and VALL as the wholeworld’s emissions, then we note that VAX1∕VALL þ VNX1∕VALL ≠ 1 due to non-linearity. Therefore we need to normalize the contributions as VAX1∕ðVAx1 þVNX1Þ for the developed countries and VNX1∕ðVAx1 þ VNX1Þ for the develop-ing countries. We can use the same approach for changes in any field ofinterest such as CO2 concentration, surface temperature, or sea ice. In parti-tioning the developed and developing countries’ services to slow down glo-bal warming relative to business as usual, V0 ¼ VACNC − VABNB is consideredto be the total effect by all countries following the Cancun pledges andfurther reductions. V1 ¼ VACNB − VABNB denotes the effect caused by emis-sion reductions from developed countries and V2 ¼ VABNC − VABNB denotesthe effect caused by emission reductions from developing countries. Whenusing the normalized proportion approach, the value of V is the differencebetween 1850 and 2005 for CO2 concentration and its radiative forcing sincethey are smoothly varying variables, while the value of V is the differencebetween 20-year averages 1986–2005 (2081–2100) and 1850–1869 forthe other fields (temperature, sea ice, and oceanic heat content) to smooththeir annual fluctuations.
The Representative Concentration Pathways (RCPs). RCPs are descriptions ofpotential future discharges to the atmosphere of substances that affectthe Earth’s radiation balance, such as greenhouse gases and aerosols. Theyare meant to serve as input for climate and atmospheric chemistry modeling.RCP4.5 is the emission pathway for stabilization at 4.5 W∕m2 radiative for-cing in 2100; it results in an atmosphere concentration of 650 ppm equivalentCO2 in 2100. Similarly, RCP6.0 is the emission pathway to stabilization atradiative forcing of 6.0 W∕m2 in 2100, which results in an atmospheric con-centration of 850 ppm equivalent CO2 (13). The ABNC and ACNB emissionpaths produce similar atmospheric CO2 concentrations to those producedby RCP4.5 and RCP6.0, respectively.
ACKNOWLEDGMENTS. We thank Marion Ferrat for comments on the manu-script. The work is funded by the National Key Program for Global ChangeResearch of China Grant 2010CB950500.
1. Barnett T, et al. (2005) Detecting and attributing external influences on the climatesystem: A review of recent advances. J Clim 18:1291–1314.
2. Gillett NP, Zwiers FW, Weaver AJ, Stott PA (2002) Detection of human influence onsea-level pressure. Nature 88:292–294.
3. Santer BD (2003) Contributions of anthropogenic and natural forcing to recenttropopause height changes. Science 301:479–483.
4. Zhang X, et al. (2007) Detection of human influence on twentieth-century precipita-tion trends. Nature 448:461–465.
5. Barnett TP, et al. (2005) Penetration of human-induced warming into the world’soceans. Science 309:284–287.
6. Hegerl GC, et al. (2007) IPCC Climate Change 2007: The Physical Science Basis, eds SSolomon et al. (Cambridge Univ Press, Cambridge, UK), pp 663–746.
7. Den Elzen MGJ, Schaeffer M (2002) Responsibility for past and future globalwarming: Uncertainties in attributing anthropogenic climate change. Clim Change54:29–73.
8. Frank DC, et al. (2010) Ensemble reconstruction constraints on the global carbon cyclesensitivity to climate. Nature 463:527–530.
9. Meinshausen M, et al. (2009) Greenhouse-gas emission targets for limiting globalwarming to 2 °C. Nature 458:1158–1162.
10. United Nations Framework Convention on Climate ChangeReport of the confer-ence of the parties on its sixteenth session, held in Cancun from 29 November to10 December 2010 (2011), Available at http://unfccc.int/resource/docs/2011/sb/eng/inf01r01.pdf.
11. Den Elzen MGJ, Hof AF, Roelfsema M (2011) The emissions gap between the Copen-hagen pledges and the 2 °C climate goal: Options for closing and risks that couldwiden the gap. Global Environ Change 21:733–743.
12. Rogelj J, et al. (2011) Emission pathways consistent with a 2 °C global temperaturelimit. Nat Clim Change 1:413–418.
13. Moss RH, et al. (2010) The next generation of scenarios for climate change researchand assessment. Nature 463:747–756.
14. Gent PR, et al. (2011) The community climate systemmodel version 4. Bull AmMeteor-ol Soc 24:4973–4991.
15. College of Global Change and Earth System Science (2012) Beijing Normal University-Earth System Model, Available at http://esg.bnu.edu.cn/BNU_ESM_webs/htmls/index.html.
16. Taylor KE, Stouffer RJ, Meehl GA (2012) An overview of CMIP5 and the experimentdesign. Bull Am Meteorol Soc 93:485–498.
17. Den ElzenMGJ, et al. (1999) The Brazilian proposal and other options for internationalburden sharing: An evaluation of methodological and policy aspects using the FAIRmodel. RIVM Report No.728001011, Available at http://unfccc.int/resource/brazil/documents/rap728001011.pdf.
18. Vinnikov KY, et al. (1999) Global warming and Northern Hemisphere sea ice extent.Science 286:1934–1937.
19. AchutaRao KM, et al. (2007) Simulated and observed variability in ocean temperatureand heat content. Proc Natl Acad Sci USA 104:10768–10773.
20. Levitus S, Antonov JI, Boyer TP (2005) Warming of the world ocean, 1955–2003.Geophys Res Lett 10.1029/2004GL.
21. He JK, Chen WY, Teng F, Liu B (2009) Long-term climate change mitigation target andcarbon permit allocation. Adv Clim Change Res 5:78 85, Available athttp://www.climatechange.cn/CN/abstract/abstract8471.shtml.
22. Peters GP, Hertwich EG (2008) CO2 embodied in international trade with implicationsfor global climate policy. Environ Sci Technol 42:1401–1407.
23. Peters GP, et al. (2011) Growth in emission transfers via international trade from 1990to 2008. Proc Natl Acad Sci USA 108:8903–8908.
24. Davis SJ, Caldeira K (2010) Consumption-based accounting of CO2 emissions. Proc NatlAcad Sci USA 107:5687–5692.
25. Royal Society (2009) Geoengineering the climate: Science, governance and uncer-tainty. RS Policy Documents, Available at http://royalsociety.org/policy/publications/2009/geoengineering-climate/.
4 of 5 ∣ www.pnas.org/cgi/doi/10.1073/pnas.1203282109 Wei et al.

26. Royal Society (2011) Solar radiation management: The governance of research. RS Pol-icy Documents, Available at http://royalsociety.org/policy/projects/solar-radiation-governance/report/.
27. Andres R, Gregg JS, Losey L, Marland G, Boden T (2011) Monthly, global emissions ofcarbon dioxide from fossil fuel consumption. Tellus Ser B 63:309–327.
28. Bonan G (2008) Forest and climate change: Forcing, feedbacks, and climate benefitsof forests. Science 320:1444–1449.
29. Kaplan J, Krumhardt K, Zimmermann N (2009) The prehistoric and preindustrial
deforestation of Europe. Quat Sci Rev 28:3016–3034.
30. Wigley T (2008) MAGICC/SCENGEN 5.3: User manual (version 2)., Available at http://
www.cgd.ucar.edu/cas/wigley/magicc/UserMan5.3.v2.pdf.
31. Brohan P, et al. (2006) Uncertainty estimates in regional and global observed tempera-
ture changes: A new dataset from 1850. J Geophys Res 10.1029/2005JD.
Wei et al. PNAS Early Edition ∣ 5 of 5
EART
H,A
TMOSP
HER
IC,
AND
PLANETARY
SCIENCE
S

Supporting InformationWei et al. 10.1073/pnas.1203282109
Kg/m2/year
Fig. S1. Cumulative CO2 emission flux from 1850 to 2005 for experiments ALL (historical emission), AX1 (developed world emissions only), and NX1(developing world emissions only). The spatial resolution of 0.9° × 1.25° is used to match that of CESM model and T42 to BNU-ESM model.
Wei et al. www.pnas.org/cgi/doi/10.1073/pnas.1203282109 1 of 3

CO2_FF + CO2_LU Concentration
CO2_FF Concentration
CO2_LU Concentration
Fig. S2. Change of CO2 concentration caused by fossil-fuel burning, cement manufacturing, and gas flaring in oil fields (FF), land use (LU), and FFþ LU. Theobserved annual mean CO2 concentration comes from CMIP5 (black) (1); original CO2 emission data is from CDIAC (http://cdiac.ornl.gov/) (2) and is divided todeveloped/developing countries’ emissions by their United Nations Framework Convention on Climate Change (UNFCCC) Annex I status; and simulated CO2
concentration by a simple carbon cycle model is provided by UNFCCC (3) for ALL (red, historical emission), AX1 (blue, developed world emissions only), and NX1(green, developing world emissions only) experiment.1 Taylor KE, Stouffer RJ, Meehl GA (2012) An overview of CMIP5 and the experiment design. Bull Am Meteorol Soc 93:485–498.2 Andres R, Gregg JS, Losey L, Marland G, Boden T (2011) Monthly, global emissions of carbon dioxide from fossil fuel consumption. Tellus Ser B 63:309–327.3 Den ElzenMGJ, et al. (1999) The Brazilian proposal and other options for international burden sharing: An evaluation of methodological and policy aspects using the FAIRmodel. RIVM
Report No.728001011. Available at http://unfccc.int/resource/brazil/documents/rap728001011.pdf.
CESM BNU-ESM
6 6
5y running avgNX1AX1ALL
Annual mean
Fig. S3. The upper ocean heat content (0–700 m) and Northern Hemisphere sea ice fraction simulated by two earth system models (Left: CESM; Right: BNU-ESM) for three historical experiments: ALL (red, historical emission), AX1 (blue, developed world emissions only), and NX1 (green, developing world emissionsonly). The variables are shown as a global mean anomaly relative to 1850–1869. The solid lines are the five-year running averaged fields. The dashed lines arethe annual mean.
Wei et al. www.pnas.org/cgi/doi/10.1073/pnas.1203282109 2 of 3

BNU-ESM
CESM
Fig. S4. Modeled centennial trend patterns of sea-ice fraction (% per century) from 1906–2005 (Top: CESM; Bottom: BNU-ESM). Experiments used are labeledALL (historical emissions), AX1 (developed world emissions only), and NX1 (developing world emissions only).
Table S1. Forcing data for historical simulations
Experiment CO2 forcing Other forcing conditions
ALL CO2 flux in ALL (1850–2005) Solar radiation: 1850–2005 Judith Lean Total Solar Irradiance (TSI) valueVolcano: 1850–2005 mass mixing ratio of volcanic aerosol
AX1 CO2 flux in AN1 (1850–2005) Other greenhouse gases: 1850–2005 global concentration of CH4, N2O, CFCsOzone: 1850–2005 Atmospheric Chemistry and Climate/Stratospheric Processes And their
Role in Climate (AC&C/SPARC) ozoneNX1 CO2 flux in NA1 (1850–2005) Aerosol concentration: 1850–2005 black carbon, organic carbon, dust, sulfate
Aerosol emission flux: 1850–2005 black carbon, organic carbon, dust, sulfate
Table S2. Forcing data for future simulations
Experiment CO2 forcing Other forcing conditions
ABNB ABNB scenario (2006–2100) Solar radiation: 2006–2100 Judith Lean TSI valueACNB ACNB scenario (2006–2100) Other greenhouse gases concentration: 2006–2100 RCP4.5 of CH4, NO2, CFFs, et al.ABNC ABNC scenario (2006–2100) Ozone concentration: 2006–2100 AC&C/SPARCACNC ACNC scenario (2006–2100) Aerosol concentration: 2006–2100 RCP4.5 of black carbon, organic carbon, dust, sulfate
Aerosol flux: 2006–2100 RCP4.5 of black carbon, organic carbon, dust, sulfate
Wei et al. www.pnas.org/cgi/doi/10.1073/pnas.1203282109 3 of 3