deutsche telekom q3/13 results
TRANSCRIPT

DEUTSCHE TELEKOM DEUTSCHE TELEKOM Q3/13 RESULTSQ3/13 RESULTS

DISCLAIMER
This presentation contains forward-looking statements that reflect the current views of Deutsche Telekom management with respect to future events. These forward-p g g plooking statements include statements with regard to the expected development of revenue, earnings, profits from operations, depreciation and amortization, cash flows and personnel-related measures. You should consider them with caution. Such statements are subject to risks and uncertainties, most of which are difficult to predict and are generally beyond Deutsche Telekom’s control. Among the factors that might influence our ability to achieve our objectives are the progress of our workforce reduction initiative and other cost-saving measures, and the impact of other significant strategic, labor or business initiatives, including acquisitions, dispositions and business combinations, and our network upgrade and expansion initiatives. In addition, stronger than expected competition, technological change, legal proceedings and combinations, and our network upgrade and expansion initiatives. In addition, stronger than expected competition, technological change, legal proceedings and regulatory developments, among other factors, may have a material adverse effect on our costs and revenue development. Further, the economic downturn in our markets, and changes in interest and currency exchange rates, may also have an impact on our business development and the availability of financing on favorable conditions. Changes to our expectations concerning future cash flows may lead to impairment write downs of assets carried at historical cost, which may materially affect our results at the group and operating segment levels. If these or other risks and uncertainties materialize, or if the assumptions underlying any of these statements prove incorrect, our actual performance may materially differ from the performance expressed or implied by forward-looking statements We can offer no assurance that our estimates or our actual performance may materially differ from the performance expressed or implied by forward-looking statements. We can offer no assurance that our estimates or expectations will be achieved. Without prejudice to existing obligations under capital market law, we do not assume any obligation to update forward-looking statements to take new information or future events into account or otherwise.In addition to figures prepared in accordance with IFRS, Deutsche Telekom also presents non-GAAP financial performance measures, including, among others, EBITDA, EBITDA margin, adjusted EBITDA, adjusted EBITDA margin, adjusted EBIT, adjusted net income, free cash flow, gross debt and net debt. These non-GAAP measures should be considered in addition to, but not as a substitute for, the information prepared in accordance with IFRS. Non-GAAP financial performance measures are not subject to IFRS or any other generally accepted accounting principles. Other companies may define these terms in different ways.
2

REVIEW Q3 2013REVIEW Q3 2013

Q3/13 KEY ACHIEVEMENTS: ORGANIC GROUP REVENUE GROWTH –FY GUIDANCE CONFIRMEDFY GUIDANCE CONFIRMED
Growth in key areas: 1,296k mobile contract net adds, 153k TV net adds, 21k broadband net adds.Re en e gro s 6 0% to 15 5 billion € dri en b the US Organic re en e gro th1 of 2 4% Revenue grows 6.0% to 15.5 billion € driven by the US. Organic revenue growth1 of 2.4%.
Adj. EBITDA of €4.7 billion (-2.6%). Free Cash Flow of 1.4 billion in line with guidance. ROCE improved to 5.1%, EPS improved to €0.39 in first nine months.
Growth in key areas: 470k mobile contract net adds, 43k TV net adds and 119k fiber net adds (incl. wholesale). Solid revenue trend (-1.2%) in Q3/13; strong adj. EBITDA-margin at 41.9%.
GROUP
GERMANY Underlying mobile service revenue trend (-1.0%) better than market. Fixed network (-2.7%) with improved trends compared to Q2.
Growth in key areas: +1,023k mobile customers, branded postpaid customers +648k. Full year branded postpaid net adds guidance increased: now expecting 1.6 to 1.8 million up from 1.0 to 1.2 million previously. Revenue in US-$ grows 38.1% to 6.8 billion US$ driven by MetroPCS consolidation. Organic revenue growth1 of 12.4%.
Despite strong customer intake adj EBITDA grows to 1 4 billion US$ (+15 1%) Margin of 21 2%
US Despite strong customer intake adj. EBITDA grows to 1.4 billion US$ (+15.1%). Margin of 21.2% .
Growth in key areas: 178k mobile contract net adds, 110k TV net adds, 68k broadband customer net adds. Organic revenue1 with improved trend in Q3 (-3.4%) compared to Q2 (-4.3%). Organic adj. EBITDA1 with -10.6% in Q3. Margin at 33.8%.
EUROPE
Order entry with 1.8 billion €, +11.6% versus Q3/12 Organic revenue growth1 (+2.7%) at Market Unit. Tel-IT with expected catch up effect in Q3 (+17.4%) Improvement in adj. EBITDA +9.1% to €203 million – margin improved to 8.9%.
SYSTEMS SOLUTIONS
1) Adjusted for changes in the scope of consolidation and currency fluctuations
4

Q3/13: KEY FIGURES
Q1-Q3
€ million 2012 2013 Change 2012 2013 Change
Q3
€ million 2012 2013 Change 2012 2013 Change
Revenue 14,651 15,525 6.0% 43,462 44,467 2.3%
Adj. EBITDA 4,782 4,659 --2.6% 13,965 13,364 -4.3%
Adj net profit 929 823 11 4% 2 337 2 400 2 7%Adj. net profit 929 823 -11.4% 2,337 2,400 2.7%
Net profit -7,021 588 n.a. -5,994 1,682 n.a.
Adj. EPS (in €) 0.21 0.18 -14.3% 0.54 0.55 1.9%
EPS (in €) -1.63 0.14 n.a. -1.39 0.39 n.a.
Free cash flow1 2,344 1,427 -39.1% 5,134 3,574 -30.4%
Cash capex2 1,910 2,260 18.3% 5,664 6,415 13.3%
Net debt (in € billion) 39.0 39.7 +1.9% 39.0 39.7 +1.9%
1) Free cash flow before dividend payments, spectrum investment, effects of AT&T transaction and compensation payments for MetroPCS employees2) Before spectrum payments. Q3/13 € 118 million . € 288 million in Q3/12. 9M/13 € 1,185 million, 9M/12 €329 million.
5

GERMANY: SOLID REVENUE TRENDS – ADJ. EBITDA MARGIN AT 41 9%
€ mn
Revenues€ mn
Adj. EBITDA and adj. EBITDA-margin (in %)
AT 41.9%
41 940 640 541 9€ mn € mn
-1.2%
5 6705 5655 736 5 5665 731
Mobile OthersWholesale servicesCore fixed
2,3752,255 2,2792,0742,401
-1.1%
41,940,640,536,141,9
Adj. OPEX
5,670
2,006
5,565
1,987
5,736
1,958 1,925
5,566
1,842
5,731
Q3/13Q2/13Q1/13Q4/12Q3/12+2.5%
€ mn
909 869 865 825 863
2,5422,6022,612 2,5462,560 -2.7%
-5.1%
3,401 3,3893,798 3,3733,453
-1.9%
Q3/13
259
Q2/13
269
Q3/12
257
Q1/13
299
Q4/12
273
Q3/12 Q4/12 Q3/13Q1/13 Q2/13
+0.8%
6

GERMANY: FIXED – LINE LOSSES REDUCED SIGNIFICANTLY
in €
Average revenue per access growing€ mn
German broadband market1
28.528.328.227.927.7 TP26.125.9 26.2 26.225.8Cable in €€ mn
12.4
11.2
4.9
12.4
11.2
4.7
12.4
11.2
4.6
12.4
11.1
4.3
12.4
11.1
4.13839393838 3232323232
1717171717SP
DP
TP
ARPADT
DSL Competitors
Cable
Fiber customers: Retail und Wholesale Line Losses: Improving trend despite LTE substitution
Q3/13Q2/13Q1/13Q4/12Q3/12 Q3/13Q2/13Q1/13Q4/12Q3/12
in 000in 000
270 241 233199208
Q3/13
25421
Q2/13
23334
Q1/13
27130
Q4/12
23628
Q3/12
28414
+65%
1,387
1,165
2221,268
1 096
1721,142
1 014127
986
90581
842
80735
Retail
Wholesale
-11%
254233271236284
Telekom LTE Broadband Q3/13
1,165
Q2/13
1,096
Q1/13
1,014
Q4/12
905
Q3/12
807
1) Based on management estimates
7
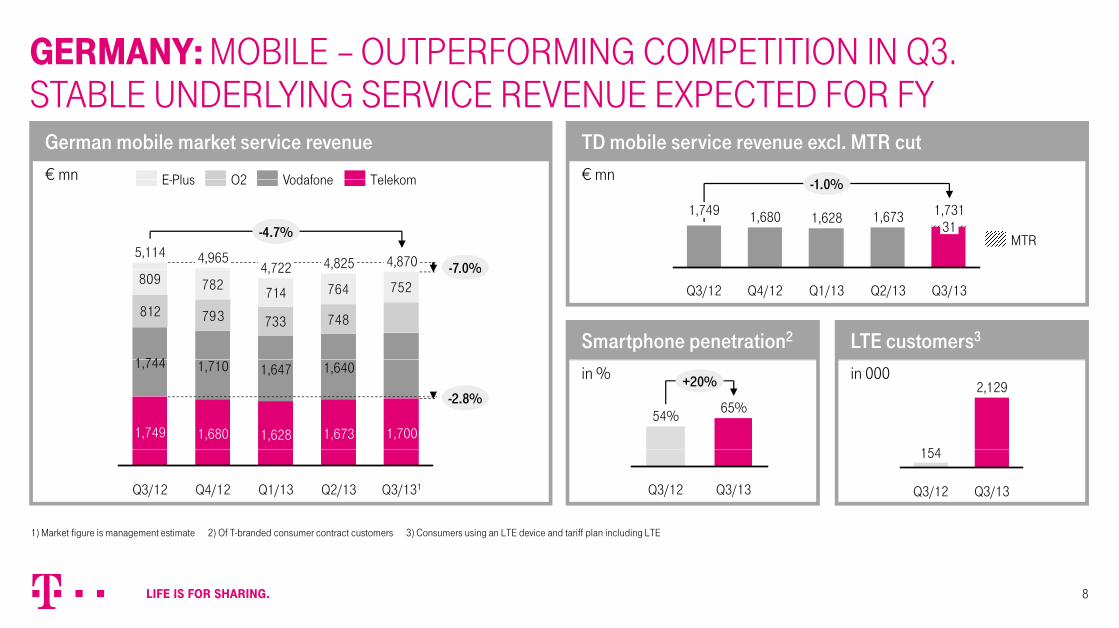
GERMANY: MOBILE – OUTPERFORMING COMPETITION IN Q3. STABLE UNDERLYING SERVICE REVENUE EXPECTED FOR FY
€ mn € mn
TD mobile service revenue excl. MTR cutGerman mobile market service revenue
STABLE UNDERLYING SERVICE REVENUE EXPECTED FOR FY
1 0%TelekomVodafoneO2E Plus€ mn € mn
1,6801,749
-1.0%
1,73131
1,6731,628
4,9655,1144,870 -7 0%
-4.7%
4,8254 722
TelekomVodafoneO2E-Plus
MTR
LTE customers3Smartphone penetration2
Q4/12Q3/12 Q3/13Q2/13Q1/13812 793 733 748
809 782 714 764 752
1 744
-7.0%,4,722
in 000in %1,647
1,680
1,710
1,749
1,744
-2.8%
1,7001,673
1,640
1,628
+20%
65%54%
2,129
154
Q4/12Q3/12 Q3/131Q2/13Q1/13 Q3/13Q3/12 Q3/13Q3/12
154
1) Market figure is management estimate 2) Of T-branded consumer contract customers 3) Consumers using an LTE device and tariff plan including LTE
8

TMUS: SIGNIFICANT IMPROVEMENT IN CUSTOMER METRICS AND POSTPAID CHURN
in 000
Net additionsUS-$ mn
Revenue and service revenue1,0231,130
POSTPAID CHURN
Total revenue+20.9% in 000
Total net adds
US $ mn579
,61160
Branded: Q3/12 Q4/12 Q1/13 Q2/13 Q3/13 Postpaid -492 -515 -199 688 648
P 365 166 202 10 24
Service revenue
Total revenue
+38.1%
5,0136,764
4,6246,305
3,9084,678
4,0054,916
4,1464,897
Branded customers: Postpaid and Prepay ARPUAdj. EBITDA
Prepay 365 166 202 -10 24Wholesale1 287 410 576 452 351Q3/13Q2/13Q1/13Q4/12Q3/12
US-$ (US GAAP)US-$ mn+15.1%
1,4321,2161,1731,0441,244 27.7
55.5
27.4
56.635.7
52.234.8
53.6
28.3
54.1Prepay
Postpaid
Q3/13Q2/13Q1/13Q4/12Q3/12 Q3/12 Q3/13Q2/13Q1/13Q4/12
1) Wholesale includes MVNO and machine-to-machine (M2M). Amounts may not add up due to rounding.
9

TMUS: LTE NETWORK ROLL OUT AND METRO INTEGRATION AHEAD OF PLAN
mn
OF PLANLTE covered POPs 4G LTE rollout and modernization
203 million 4G LTE POPs in 254 metro areasmn
225
203
Achieved 200 million POPs goal one quarter early 94 of Top 100 markets covered with LTE
Metro Integration MetroPCS spectrum repurposed: 15% by the end of Q4
157
MetroPCS spectrum repurposed: 15% by the end of Q4 MetroPCS customers with HSPA+ handsets: >1.5 million 15 new markets launched with 1,300 distribution points Synergies, YE 2013 targetSy e g es, 0 3 ta get
Capex: On track to exceed plan by US$200-250 million Opex: On track to exceed plan by US$50-100 million
Integration expenses
2014Q3 2013Q2 2013
on track to beat plan by US$100-125 million
10

EUROPE: REVENUE TREND IMPROVING IN CONTINUING TOUGHENVIRONMENT
€ mn
Revenue
ENVIRONMENT
6 0%
Total revenue – Organic revenue decline of 3.4% better than in previous quarters
Negative mobile regulation effects: approx 75% driven by PL GR € mn
81 3,43619-106
-1163,558
-40-563,654 -3.4%
-6.0% Negative mobile regulation effects: approx. 75% driven by PL, GR and NL
Decline in traditional TelCo mainly driven by mobile voice and SMS partly compensated by higher device revenues
Adj. EBITDA
Q3/13Old Telco Tax HU
Growth areas1
Mobile Regulation
Trad. Telco & Other
FXCons./Decons.Q3/12 Uptake of growth areas especially driven by mobile data, energy, TV and B2B/ICT
€ mn
1,1621436
-1901,302-15-28
1,345
-13.6%-10.6%
Adj. EBITDA – Decline in organic adj. EBITDA driven by Increased market invest in the Netherlands (adj. EBITDA -27 mn €) Highly competitive market environment in the Czech Republic
(-34 mn €) and Croatia (-27 mn €) where decline in revenue could Q3/13Taxes HUIndirect Cost
savings & Other
Contribution margin2
FXCons./Decons.Q3/12
1) Mobile Data, Pay TV & fixed broadband, B2B/ICT, adjacent industries (online consumer services, energy and other)2) Total Revenues - Direct Cost
( 34 mn €) and Croatia ( 27 mn €) where decline in revenue could not be compensated
11

EUROPE: STRONG PERFORMANCE IN GROWTH AREAS
in 000
Net adds – broadband and TV1
mn
Pockets of growth – broadband and TV1
TV customersbroadband accesses TV net addsbroadband net addsin 000mn
3.455.19
3.09
5.13
3.01
5.07
2.94
5.01
2.83
4.92
TV customersbroadband accesses
68585983
53
1107972
10568
TV net addsbroadband net adds
Net adds – mobile contract1Pockets of growth – mob. contract and smartphones1
Q3/13Q2/13Q1/13Q4/12Q3/12 Q3/13Q2/13Q1/13Q4/12Q3/12
in 000mn
26
25
25.925.725.525.525.3
Contract customer base
68%61%56%69%70%
Smartphone share of disp.
178196
28
192214
24
Q3/13Q2/13Q1/13Q4/12Q3/12
28
Q3/13Q2/13Q1/13Q4/12Q3/12
1) incl. business customers shifted to T-Systems in Hungary as of 1.1.2011. Smartphone share w/o SK, RO, MK, AL, CG and Bulgaria. TV figures include DiGi Slovakia as of 1. September 2013 (not counted as net adds). The customers of our companies in Bulgaria are no longer included in the Europe operating segment since August 1, 2013 following the sale of the shares held in the companies. They have been eliminated from all historical customer figures to improve comparability.
12

EUROPE: COMMERCIAL AND TECHNOLOGY INITIATIVES DRIVING REVENUE AND COST TRANSFORMATION
Revenue transformation Technology and Cost transformation
REVENUE AND COST TRANSFORMATION
Growth Areas1
share of total revenues
+3pp 22%19%
+0.6pp 21.120.5%
Connected Home shareof fixed revenues
All-IP share of EU fixed network access lines
26%16%
+10pp
FTEs (end of period)
-6.7% 55.059.0
Q3/13Q3/12 Q3/13Q3/12
Mobile Data share B2B/ICT share of total revenues
Q3/13Q3/12 Q3/13Q3/12
LTE sites in service FTTH homes connectedof mobile revenues
/
+0.4pp2.9%2.5%
17%14%
+3pp +205%2.8k
0.9k
+33%0.16mn
0.12mn
Q3/13Q3/12Q3/13Q3/12 Q3/13Q3/12 Q3/13Q3/12
1) Mobile Data, Pay TV & fixed broadband, B2B ICT, adjacent industries (online consumer services, energy and other)
13

SYSTEMS SOLUTIONS: SOLID DEVELOPMENT AT MARKET UNIT
€ mn
Revenue Solid development in order entry with €1.8 billion (+11.6%) Reported revenues at Market Unit slightly decreasing
due to€ mn+1.8%
Telekom IT
Market Unit 2,286
4121,873
2,273
3901,884
2,319
4261,893
2,829
702
2,1272,245
3511,894 -1.1%
due to Currency: -45 million € Sale of systems integration business in France and
T-Systems Italy: -26 million €
Adj. EBIT and marginAdj. EBITDA and margin
Q3/13Q2/13Q1/13Q4/12Q3/12 Organic revenue growth Market Unit +2.7% Total revenue driven by expected catch up effect at
Telekom IT (+17.4%)
€ mn/in %€ mn/in %
161
+9.1%
Telekom IT
Market Unit 203
179
186
27
+85.7%
Telekom IT
Market Unit 52
7128
1.2% 2.3%8.3% 8.9% Adj. EBITDA improved 9.1% to 203 million € Market Unit with adj. EBITDA growth of 11.2%, EBIT-
Margin improved to 3.8%T l IT d li d i IT t IT d d ti f 161Telekom IT
Q3/13
24
Q3/12
2527
Q3/13
-19
Q3/12
1 Tel IT delivers on reducing IT costs: IT spend reduction of 0.25 billion € in first nine months.
14

FINANCIALS: Q3/13 FCF AND NET INCOME
Free cash flow Q3/13 Adj net income Q3/13€ mn
Free cash flow Q3/13€ mn
Adj. net income Q3/13
-39.1%
1 427-5502,344
823239
929-123
-11.4%
25-101146
Q3/13
1,427
Other
-17
Capex (excl.
-350
Cash gen. Q3/12
239
adj. EBITDAQ3/12 Q3/13Minorities
25
TaxesD&AFinancial
-146
spectrum)from operations
result
Cash generated from operations decreases stronger than EBITDA due to working capital impact (-0.5 billion €) from value plans in the US
Financial result impacted by deterioration in result from currency translation and valuation of financial instruments. Interest result g p p ( ) p
Cash capex increase (excl. spectrum) in Q3 predominantly driven by network roll-out in the US
impacted by high yield debt of MetroPCS. Tax increase results from low tax rate in Q3/12 following the unwinding
of TM US as a held for sale asset
15

FINANCIALS: 9M/13 IMPROVEMENT IN ROCE AND ADJ. EPS
ROCE development Q1 Q3/13 Adj EPS development Q1 Q3/13€ per share
+1.9%
0.550 020 04
0.54
in %
ROCE development Q1-Q3/13 Adj. EPS development Q1-Q3/13
+9.8pp
5.1
9M/13Minorities
0.02
Taxes
-0.04
D&A
0.20
Financial
-0.04
adj. EBITDA
-0.14
9M/12-4.7
result9M/13NOANOPAT9M/12
Drivers of ROCE development Q3 last year impacted by impairment of TM US Q3 last year impacted by impairment of TM US Net operating profit after taxes improved by 7,679 million € to 3,885 million € Net operating assets (average) decreased by 6.2 billion € to 100.9 billion €
16

FINANCIALS: NET DEBT REDUCED DUE TO FCF AND SALE OF GLOBUL
Net debt development Q2/13
GLOBUL
As expected FCF and contribution from Globul sale have reduced net
€ mn
Net debt development Q2/13
-4.0%
39,726496-717-1,427
41,374
s e pected C a d co t but o o G obu sa e a e educed etdebt in the 3rd quarter
Other includes 200 million € dividend payment to minority shareholders and 107 million spectrum payment in Poland.
Q3/13OtherSale of Free cash Q2/13Globulflow1
1) Free cash flow before dividend payments, spectrum investment, effects of AT&T transaction and compensation payments for MetroPCS employees
17

FINANCIALS: BALANCE SHEET – IMPROVED RATIOS
€ bn 30/09/2012 31/12/2012 31/03/2013 30/06/2013 30/09/2013€ bn 30/09/2012 31/12/2012 31/03/2013 30/06/2013 30/09/2013
Balance sheet total 108.2 107.9 108.8 116.1 115.3
Shareholders’ equity 30.4 30.5 31.0 31.3 32.0
Net debt 39 0 36 9 37 1 41 4 39 7Net debt 39.0 36.9 37.1 41.4 39.7
Net debt/Adj. EBITDA1 2.1 2.1 2.1 2.4 2.3
Equity ratio 28.1% 28.3% 28.5% 26.9% 27.8%
Comfort zone ratios
Rating: A-/BBB
2 – 2.5x net debt/Adj. EBITDA
Current rating
Fitch: BBB+ stable outlook
Moody’s: Baa1 stable outlook
25 – 35% equity ratio
Liquidity reserve covers redemption of the next 24 months
S&P: BBB+ stable outlook
1) Ratios for the interim quarters calculated on the basis of previous 4 quarters. Ratio in 9M/13 negatively influenced by full consolidation of MetroPCS debt, without accounting for Metro’s EBITDA in the previous quarters.
18

DEUTSCHE TELEKOM Q3 2013 RESULTS CONFERENCE CALLQ3 2013 RESULTS CONFERENCE CALL
Q&AQuestions can be asked via the telephone conference call:
0800 182 6766 0800 028 0471 +1 866 306 34550800 182 6766 0800 028 0471 +1 866 306 3455
+49 69 403 59 619
If you want to ask a question, please press “*1”.If you want to ask a question, please press 1 .
If you want to cancel your question, please press “#”.
19

FURTHER QUESTIONS PLEASE CONTACT THE IR DEPARTMENTPLEASE CONTACT THE IR DEPARTMENT
Investor RelationsInvestor RelationsPhone +49 228 181 - 8 88 80E-Mail [email protected]
For further information please visit
www.telekom.com/investorsIR webpage: IR youtube playlist:IR twitter account:
te e o co / esto s
20

THANK YOU!THANK YOU!