deutsche telekom q2/13 results
TRANSCRIPT
DEUTSCHE TELEKOM Q2/13 RESULTS
DISCLAIMER
This presentation contains forward-looking statements that reflect the current views of Deutsche Telekom management with respect to future events. These forward-looking statements include statements with regard to the expected development of revenue, earnings, profits from operations, depreciation and amortization, cash flows and personnel-related measures. You should consider them with caution. Such statements are subject to risks and uncertainties, most of which are difficult to predict and are generally beyond Deutsche Telekom’s control. Among the factors that might influence our ability to achieve our objectives are the progress of our workforce reduction initiative and other cost-saving measures, and the impact of other significant strategic, labor or business initiatives, including acquisitions, dispositions and business combinations, and our network upgrade and expansion initiatives. In addition, stronger than expected competition, technological change, legal proceedings and regulatory developments, among other factors, may have a material adverse effect on our costs and revenue development. Further, the economic downturn in our markets, and changes in interest and currency exchange rates, may also have an impact on our business development and the availability of financing on favorable conditions. Changes to our expectations concerning future cash flows may lead to impairment write downs of assets carried at historical cost, which may materially affect our results at the group and operating segment levels. If these or other risks and uncertainties materialize, or if the assumptions underlying any of these statements prove incorrect, our actual performance may materially differ from the performance expressed or implied by forward-looking statements. We can offer no assurance that our estimates or expectations will be achieved. Without prejudice to existing obligations under capital market law, we do not assume any obligation to update forward-looking statements to take new information or future events into account or otherwise. In addition to figures prepared in accordance with IFRS, Deutsche Telekom also presents non-GAAP financial performance measures, including, among others, EBITDA, EBITDA margin, adjusted EBITDA, adjusted EBITDA margin, adjusted EBIT, adjusted net income, free cash flow, gross debt and net debt. These non-GAAP measures should be considered in addition to, but not as a substitute for, the information prepared in accordance with IFRS. Non-GAAP financial performance measures are not subject to IFRS or any other generally accepted accounting principles. Other companies may define these terms in different ways.
2

REVIEW Q2 2013
Q2 2013 KEY ACHIEVEMENTS: TM US RETURNS TO GROWTH – GERMANY WITH ROCK SOLID RESULTS
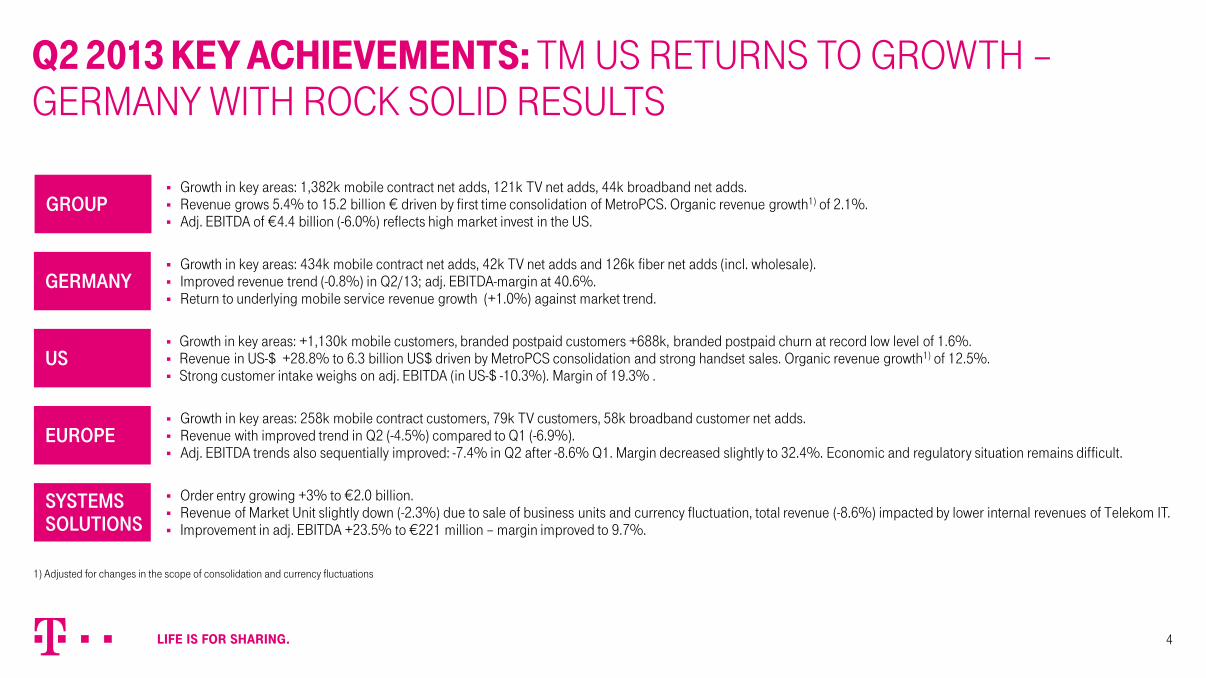
Growth in key areas: 1,382k mobile contract net adds, 121k TV net adds, 44k broadband net adds. Revenue grows 5.4% to 15.2 billion € driven by first time consolidation of MetroPCS. Organic revenue growth1) of 2.1%. Adj. EBITDA of €4.4 billion (-6.0%) reflects high market invest in the US.
Growth in key areas: 434k mobile contract net adds, 42k TV net adds and 126k fiber net adds (incl. wholesale). Improved revenue trend (-0.8%) in Q2/13; adj. EBITDA-margin at 40.6%. Return to underlying mobile service revenue growth (+1.0%) against market trend.
Growth in key areas: +1,130k mobile customers, branded postpaid customers +688k, branded postpaid churn at record low level of 1.6%. Revenue in US-$ +28.8% to 6.3 billion US$ driven by MetroPCS consolidation and strong handset sales. Organic revenue growth1) of 12.5%. Strong customer intake weighs on adj. EBITDA (in US-$ -10.3%). Margin of 19.3% .
Order entry growing +3% to €2.0 billion. Revenue of Market Unit slightly down (-2.3%) due to sale of business units and currency fluctuation, total revenue (-8.6%) impacted by lower internal revenues of Telekom IT. Improvement in adj. EBITDA +23.5% to €221 million – margin improved to 9.7%.
Growth in key areas: 258k mobile contract customers, 79k TV customers, 58k broadband customer net adds. Revenue with improved trend in Q2 (-4.5%) compared to Q1 (-6.9%). Adj. EBITDA trends also sequentially improved: -7.4% in Q2 after -8.6% Q1. Margin decreased slightly to 32.4%. Economic and regulatory situation remains difficult.
GROUP
GERMANY
US
EUROPE
SYSTEMS SOLUTIONS
4
1) Adjusted for changes in the scope of consolidation and currency fluctuations
H1
Q2 2013: KEY FIGURES
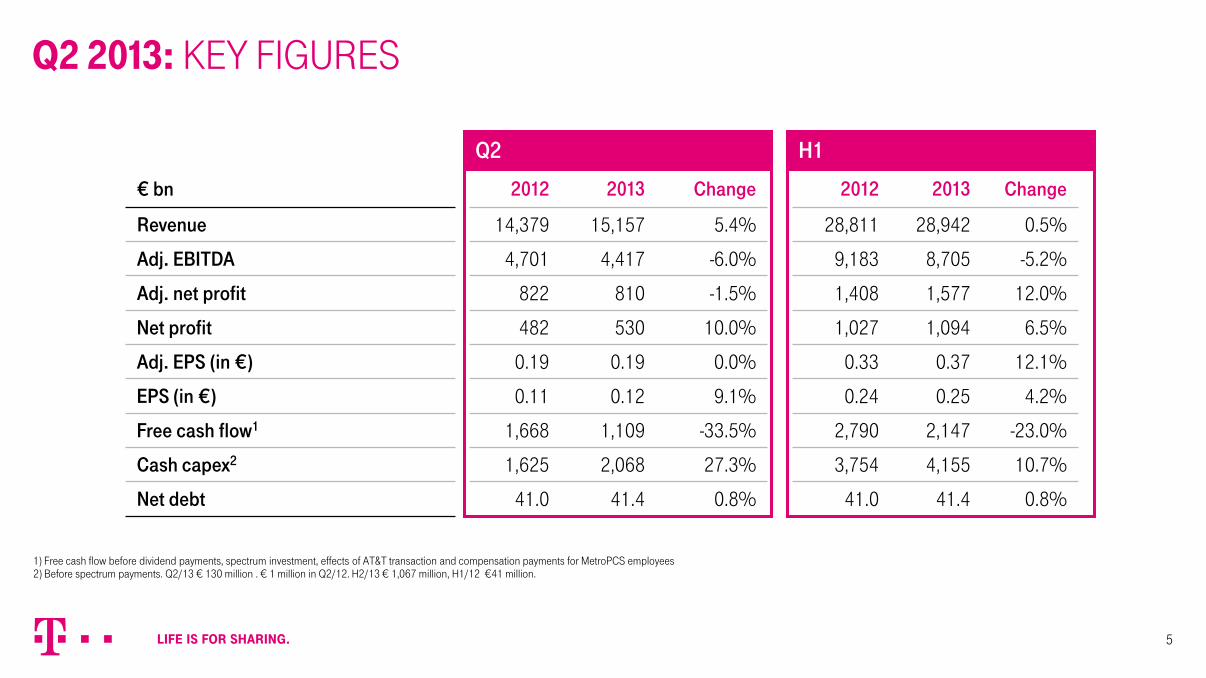
€ bn 2012 2013 Change 2012 2013 Change
Revenue 14,379 15,157 5.4% 28,811 28,942 0.5%
Adj. EBITDA 4,701 4,417 -6.0% 9,183 8,705 -5.2%
Adj. net profit 822 810 -1.5% 1,408 1,577 12.0%
Net profit 482 530 10.0% 1,027 1,094 6.5%
Adj. EPS (in €) 0.19 0.19 0.0% 0.33 0.37 12.1%
EPS (in €) 0.11 0.12 9.1% 0.24 0.25 4.2%
Free cash flow1 1,668 1,109 -33.5% 2,790 2,147 -23.0%
Cash capex2 1,625 2,068 27.3% 3,754 4,155 10.7%
Net debt 41.0 41.4 0.8% 41.0 41.4 0.8%
Q2
5
1) Free cash flow before dividend payments, spectrum investment, effects of AT&T transaction and compensation payments for MetroPCS employees 2) Before spectrum payments. Q2/13 € 130 million . € 1 million in Q2/12. H2/13 € 1,067 million, H1/12 €41 million.
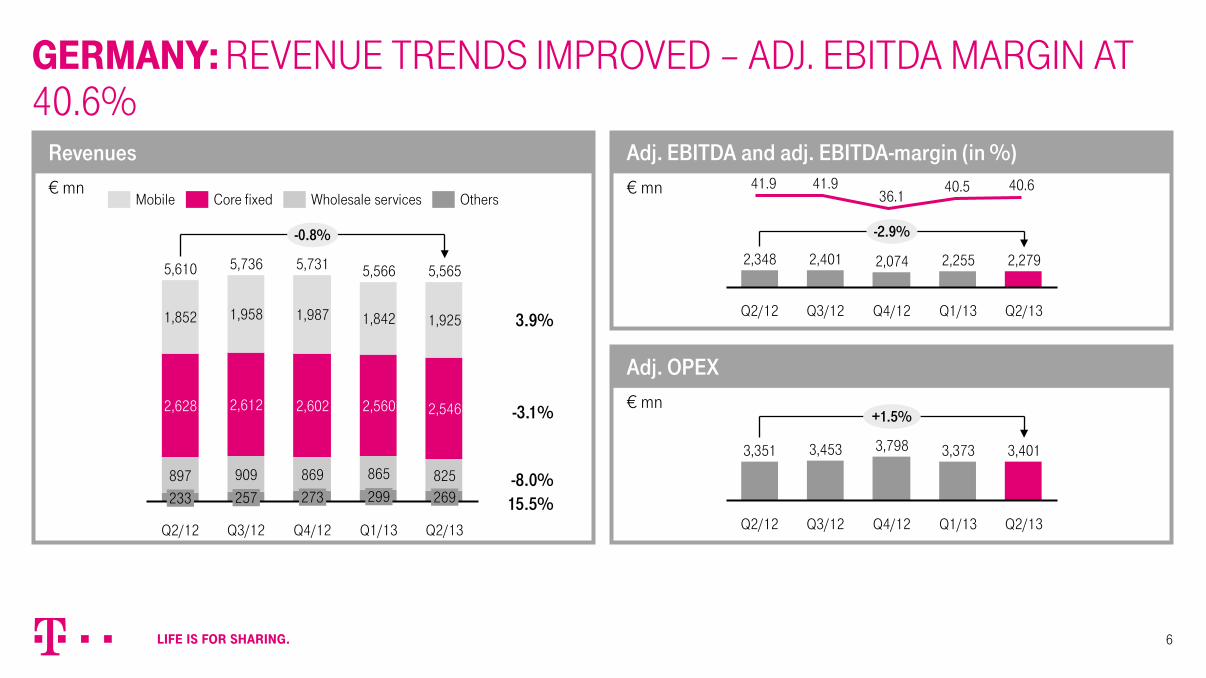
€ mn
Revenues € mn
Adj. EBITDA and adj. EBITDA-margin (in %)
€ mn
Adj. OPEX
GERMANY: REVENUE TRENDS IMPROVED – ADJ. EBITDA MARGIN AT 40.6%
6
257
909
2,612
1,958
Q2/12
5,610
233 897
2,628
1,852
-0.8%
5,565
269 825
2,546
Q2/13 Q1/13
5,566
299
865
1,925 1,842
Q4/12
5,731
273
2,560 2,602
1,987
Q3/12
5,736
869
3.9%
-3.1%
-8.0% 15.5%
Wholesale services Core fixed Mobile Others
2,074
Q3/12
2,401
Q2/12
2,348
-2.9%
Q2/13
2,279
Q1/13
2,255
Q4/12
41.9 41.9 36.1
40.5 40.6
3,798
Q3/12
3,453
Q2/12
3,351
+1.5%
Q2/13
3,401
Q1/13
3,373
Q4/12
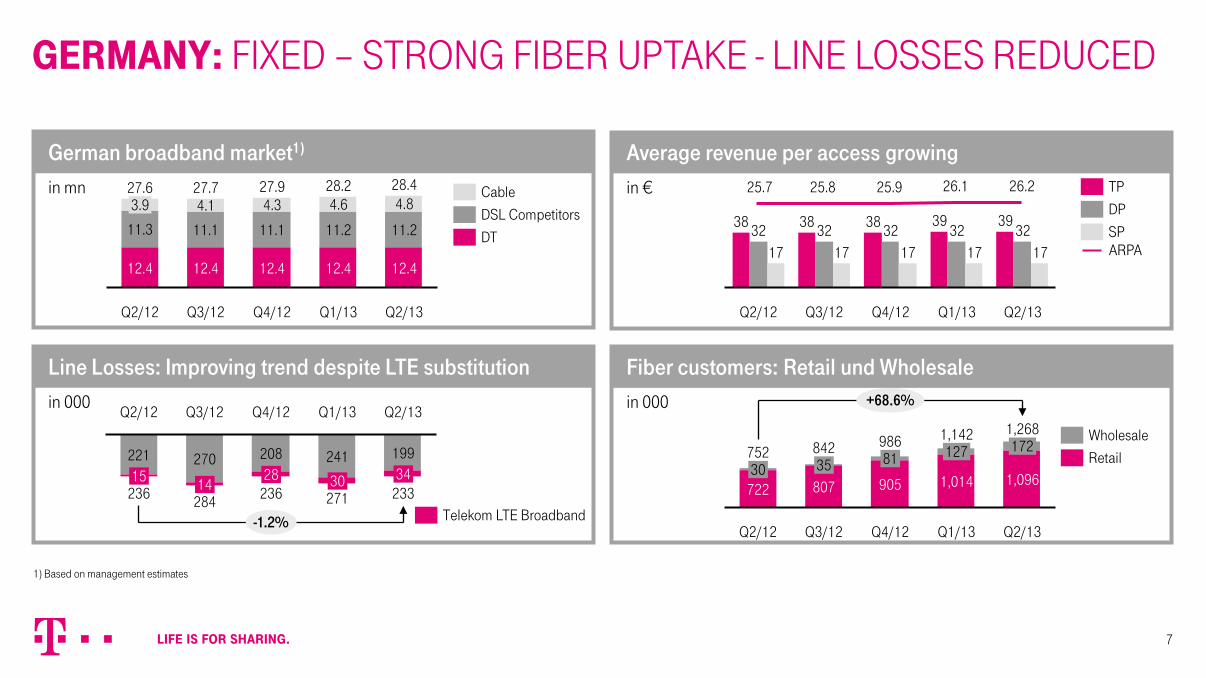
in €
Average revenue per access growing
in 000
Fiber customers: Retail und Wholesale
in mn
German broadband market1)
in 000
Line Losses: Improving trend despite LTE substitution
GERMANY: FIXED – STRONG FIBER UPTAKE - LINE LOSSES REDUCED
7
Q2/13
28.4
12.4
11.2
4.8
Q1/13
28.2
12.4
11.2
4.6
Q4/12
27.9
12.4
11.1
4.3
Q3/12
27.7
12.4
11.1
4.1
Q2/12
27.6
12.4
11.3
3.9
Q2/13
17 32
39
Q1/13
17 32
39
Q4/12
17 32 38
Q3/12
17 32 38
Q2/12
17 32 38
SP
DP
TP 25.9 25.8 26.1 26.2 25.7
ARPA DT
DSL Competitors
Cable
-1.2%
Q2/13
233 34
199
Q1/13
271 30
241
Q4/12
236 28
208
Q3/12
284 14
270
Q2/12
236 15
221
Telekom LTE Broadband Q4/12
+68.6%
Q2/13
1,268
1,096
172
Q1/13
1,142
1,014
127 986
905
81
Q3/12
842
807 35
Q2/12
752
722 30
Wholesale
Retail
1) Based on management estimates
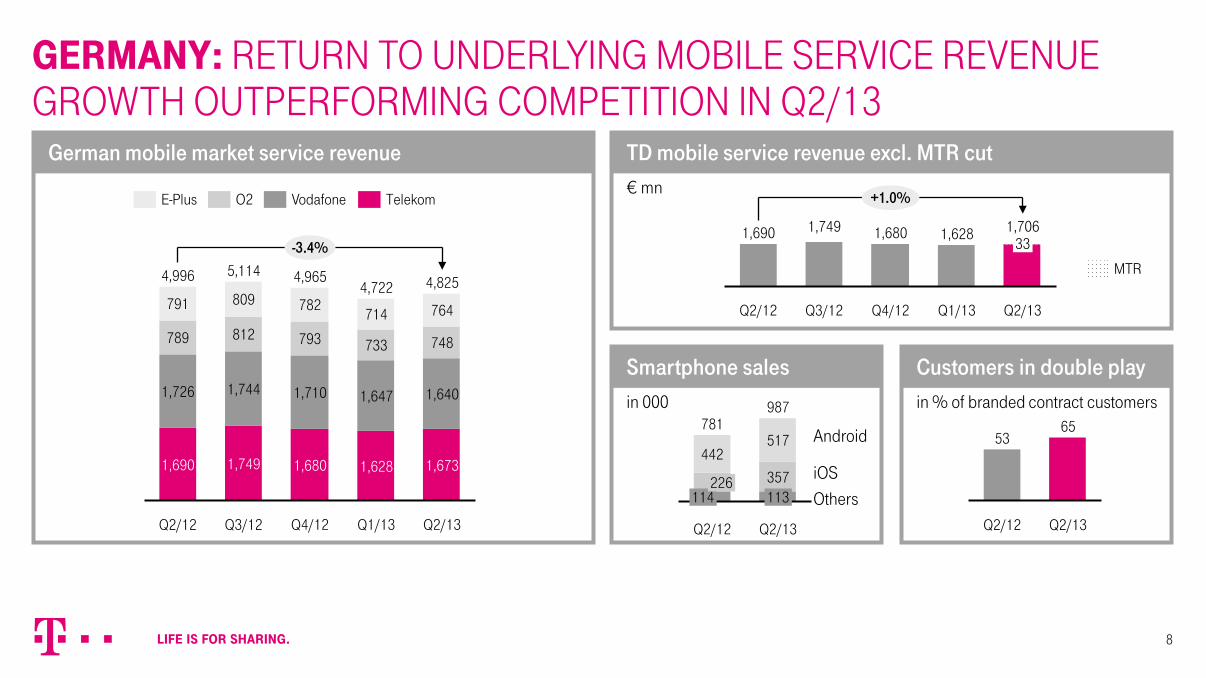
in % of branded contract customers
Customers in double play
€ mn
TD mobile service revenue excl. MTR cut
in 000
Smartphone sales
German mobile market service revenue
GERMANY: RETURN TO UNDERLYING MOBILE SERVICE REVENUE GROWTH OUTPERFORMING COMPETITION IN Q2/13
8
1,690 1,749
Q2/12
+1.0%
Q2/13
1,706 33
Q1/13
1,628
Q4/12
1,680
Q3/12
4,965
1,680
1,710
793
782
Q3/12
5,114
1,749
1,744
812
809
Q2/12
4,996
1,690
1,726
789
791 714
Q4/12
733
1,640 1,647
748
1,628
-3.4%
Q2/13
4,825
1,673
764
Q1/13
4,722
O2 Telekom Vodafone E-Plus
Q2/13
987
113 357
517
Q2/12
781
442
114 226
Android
iOS Others
Q2/13
65
Q2/12
53
MTR
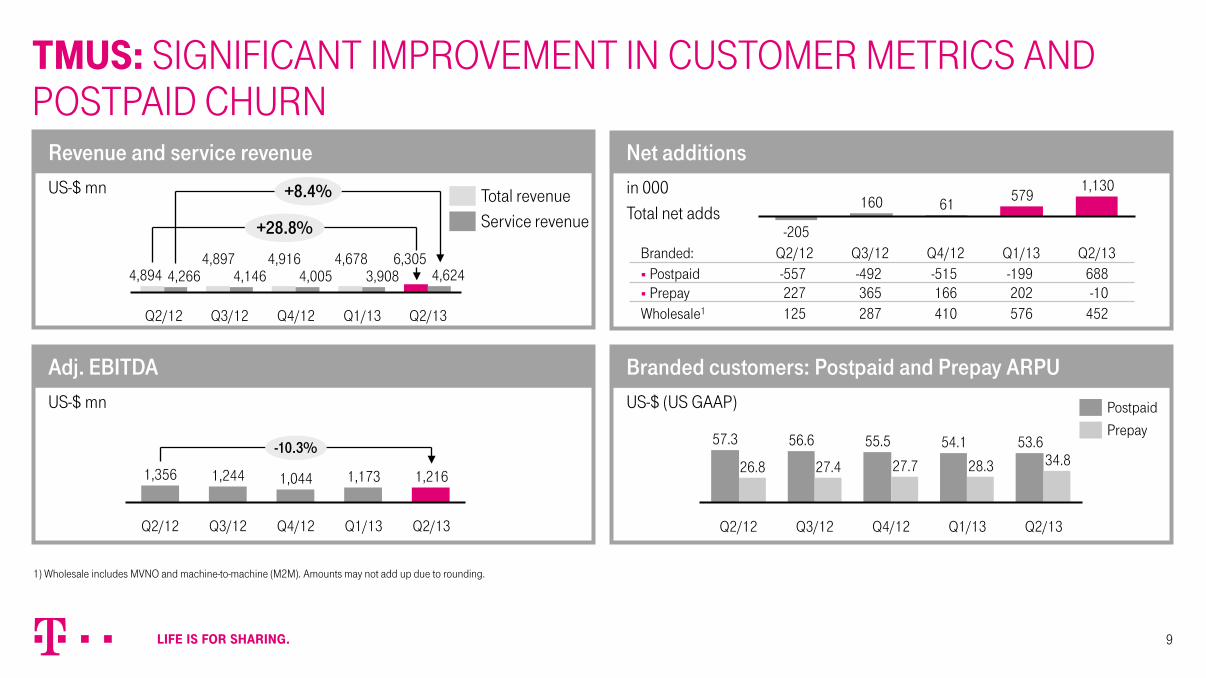
in 000 Total net adds
Net additions
US-$ (US GAAP)
Branded customers: Postpaid and Prepay ARPU
US-$ mn
Revenue and service revenue
US-$ mn
Adj. EBITDA
1,130 579 61 160
-205 Branded: Q2/12 Q3/12 Q4/12 Q1/13 Q2/13 Postpaid -557 -492 -515 -199 688 Prepay 227 365 166 202 -10
Wholesale1 125 287 410 576 452
TMUS: SIGNIFICANT IMPROVEMENT IN CUSTOMER METRICS AND POSTPAID CHURN
-10.3%
Q2/13
1,216
Q1/13
1,173
Q4/12
1,044
Q3/12
1,244
Q2/12
1,356
Q2/13
34.8 53.6
Q1/13
28.3
54.1
Q4/12
27.7
55.5
Q3/12
27.4
56.6
Q2/12
26.8
57.3 Prepay
Postpaid
Service revenue Total revenue +8.4%
+28.8%
Q2/13
4,624 6,305
Q1/13
3,908 4,678
Q4/12
4,005 4,916
Q3/12
4,146 4,897
Q2/12
4,266 4,894
9
1) Wholesale includes MVNO and machine-to-machine (M2M). Amounts may not add up due to rounding.
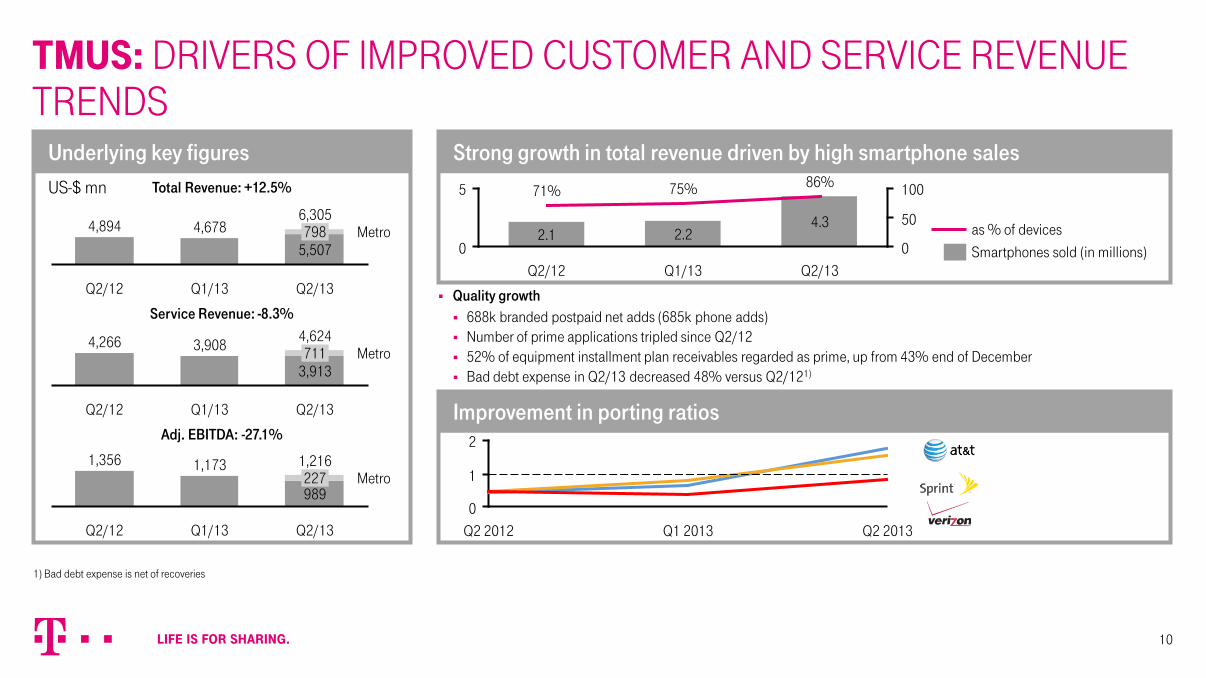
Improvement in porting ratios
Strong growth in total revenue driven by high smartphone sales
TMUS: DRIVERS OF IMPROVED CUSTOMER AND SERVICE REVENUE TRENDS
US-$ mn
Underlying key figures
10
Metro
Q2/13
6,305
5,507 798
Q1/13
4,678
Q2/12
4,894
Metro
Q2/13
4,624
3,913 711
Q1/13
3,908
Q2/12
4,266
Total Revenue: +12.5%
Service Revenue: -8.3%
Metro
Q2/13
1,216
989 227
Q1/13
1,173
Q2/12
1,356
Adj. EBITDA: -27.1%
2.2
Q1/13
75%
Q2/12
2.1
71% 5
0 Q2/13
100
50
0
4.3
86%
as % of devices
Smartphones sold (in millions)
Quality growth 688k branded postpaid net adds (685k phone adds) Number of prime applications tripled since Q2/12 52% of equipment installment plan receivables regarded as prime, up from 43% end of December Bad debt expense in Q2/13 decreased 48% versus Q2/121)
2
1
0 Q2 2013 Q1 2013 Q2 2012
1) Bad debt expense is net of recoveries
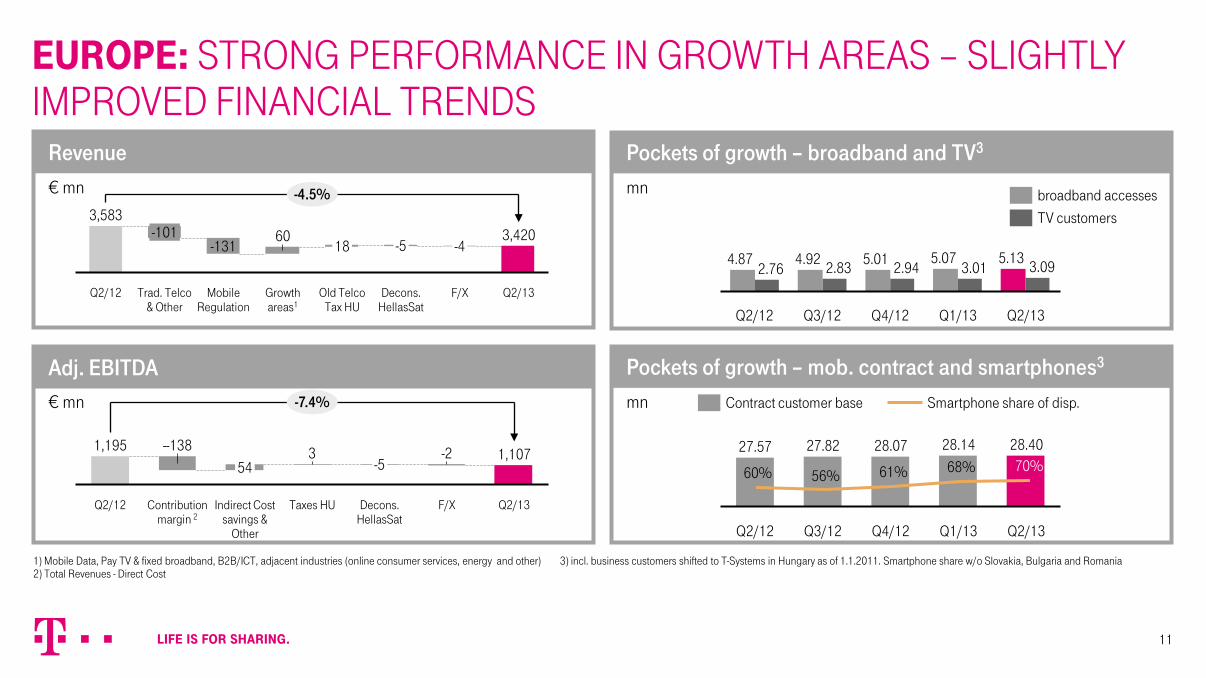
mn
Pockets of growth – mob. contract and smartphones3
€ mn
Adj. EBITDA
mn
Pockets of growth – broadband and TV3
€ mn
Revenue
EUROPE: STRONG PERFORMANCE IN GROWTH AREAS – SLIGHTLY IMPROVED FINANCIAL TRENDS
-4.5%
Q2/13
3,420
F/X
-4
Decons. HellasSat
-5
Old Telco Tax HU
18
Growth areas1
60
Mobile Regulation
-131
Trad. Telco & Other
-101
Q2/12
3,583
Q2/13
3.09 5.13
Q1/13
3.01 5.07
Q4/12
2.94 5.01
Q3/12
2.83 4.92
Q2/12
2.76 4.87
TV customers
broadband accesses
-7.4%
Q2/13
1,107
F/X
-2
Decons. HellasSat
-5
Taxes HU
3
Indirect Cost savings &
Other
54
Contribution margin 2
--138
Q2/12
1,195
11
27.82
Q2/12
27.57
Q2/13
28.40
Q1/13
28.14
Q4/12
28.07
Q3/12
Contract customer base
70% 68% 61% 56% 60%
Smartphone share of disp.
1) Mobile Data, Pay TV & fixed broadband, B2B/ICT, adjacent industries (online consumer services, energy and other) 3) incl. business customers shifted to T-Systems in Hungary as of 1.1.2011. Smartphone share w/o Slovakia, Bulgaria and Romania 2) Total Revenues - Direct Cost
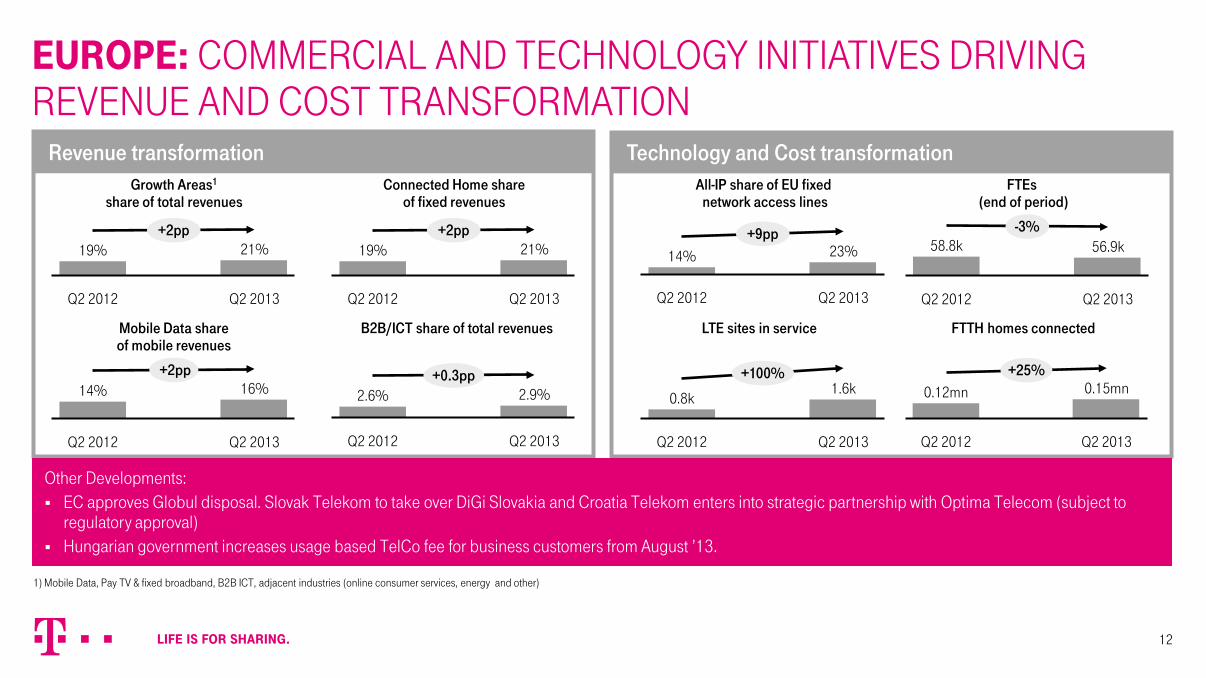
Technology and Cost transformation Revenue transformation
EUROPE: COMMERCIAL AND TECHNOLOGY INITIATIVES DRIVING REVENUE AND COST TRANSFORMATION
Growth Areas1
share of total revenues
+2pp
Q2 2013
21%
Q2 2012
19% +2pp
Q2 2013
21%
Q2 2012
19%
Mobile Data share of mobile revenues
B2B/ICT share of total revenues
+0.3pp
Q2 2013
2.9%
Q2 2012
2.6%
+2pp
Q2 2013
16%
Q2 2012
14%
Connected Home share of fixed revenues
All-IP share of EU fixed network access lines
+9pp
Q2 2013
23%
Q2 2012
14%
FTEs (end of period)
-3%
Q2 2013
56.9k
Q2 2012
58.8k
LTE sites in service FTTH homes connected
Other Developments: EC approves Globul disposal. Slovak Telekom to take over DiGi Slovakia and Croatia Telekom enters into strategic partnership with Optima Telecom (subject to
regulatory approval) Hungarian government increases usage based TelCo fee for business customers from August ’13.
12
Q2 2013
+100% 1.6k
Q2 2012
0.8k
+25%
Q2 2013
0.15mn
Q2 2012
0.12mn
1) Mobile Data, Pay TV & fixed broadband, B2B ICT, adjacent industries (online consumer services, energy and other)
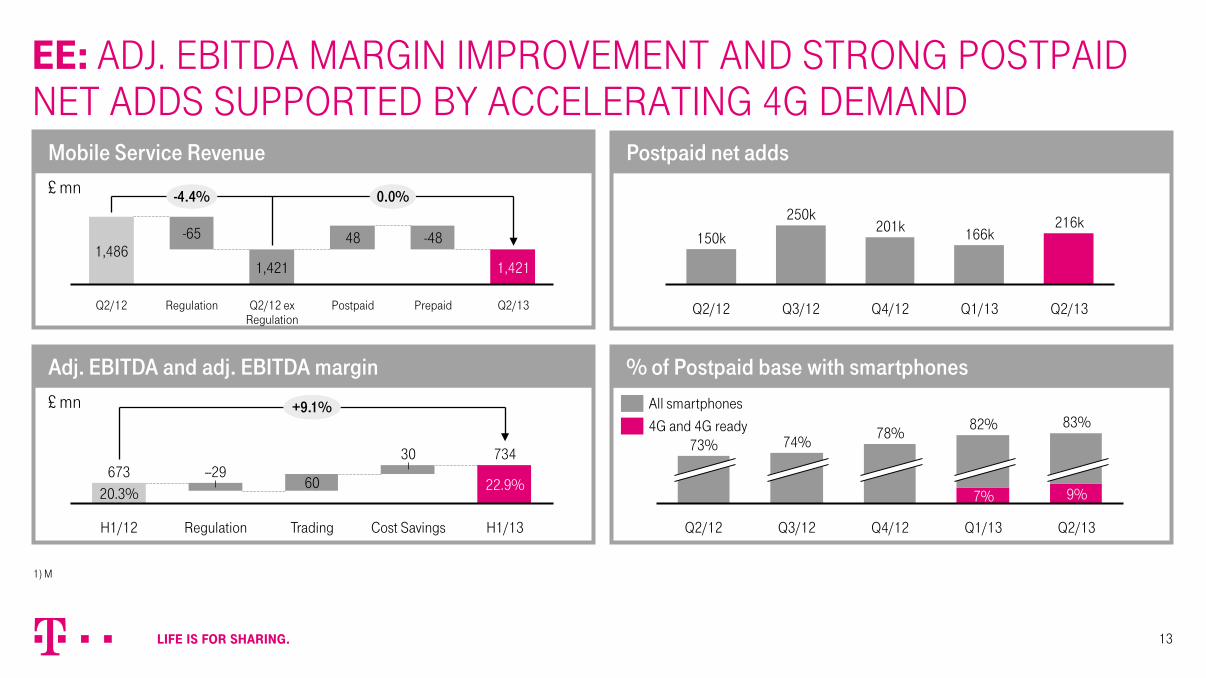
EE: ADJ. EBITDA MARGIN IMPROVEMENT AND STRONG POSTPAID NET ADDS SUPPORTED BY ACCELERATING 4G DEMAND
13
Postpaid net adds
% of Postpaid base with smartphones
£ mn
Mobile Service Revenue
£ mn
Adj. EBITDA and adj. EBITDA margin
1) M
-4.4% 0.0%
Q2/13
1,421
Prepaid
-48
Postpaid
48
Q2/12 ex Regulation
1,421
Regulation
-65
Q2/12
1,486
H1/13
+9.1%
734
22.9%
Cost Savings
30
Trading
60
Regulation
--29
H1/12
673 20.3%
Q2/13
216k
Q1/13
166k
Q4/12
201k
Q3/12
250k
Q2/12
150k
Q2/12
73% 78%
83%
Q1/13 Q2/13
82%
9% 7%
Q4/12 Q3/12
74% 4G and 4G ready
All smartphones
SYSTEMS SOLUTIONS: ONGOING ADJ. EBIT MARGIN IMPROVEMENT
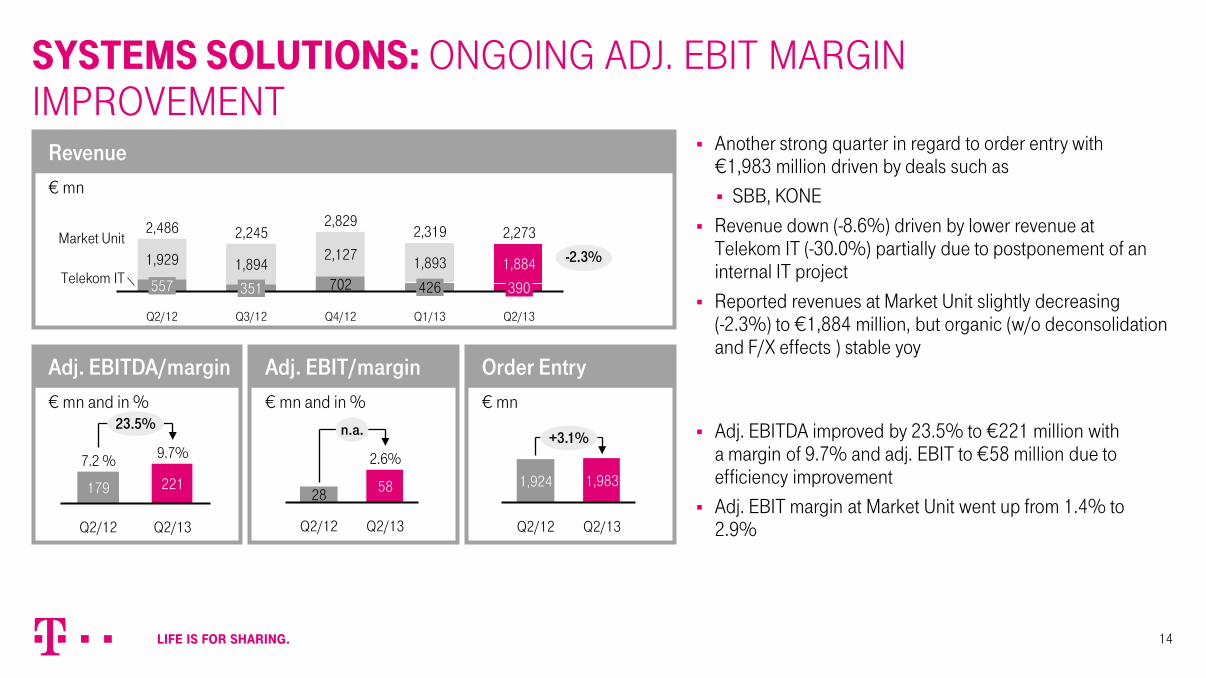
Another strong quarter in regard to order entry with €1,983 million driven by deals such as SBB, KONE
Revenue down (-8.6%) driven by lower revenue at Telekom IT (-30.0%) partially due to postponement of an internal IT project
Reported revenues at Market Unit slightly decreasing (-2.3%) to €1,884 million, but organic (w/o deconsolidation and F/X effects ) stable yoy
Adj. EBITDA improved by 23.5% to €221 million with a margin of 9.7% and adj. EBIT to €58 million due to efficiency improvement
Adj. EBIT margin at Market Unit went up from 1.4% to 2.9%
14
€ mn
Revenue
€ mn and in %
Adj. EBITDA/margin € mn and in %
Adj. EBIT/margin € mn
Order Entry
1,894
Q2/12
2,486
557
2,829
Q4/12
2,245
Q3/12
2,127
702 351
1,929
Q2/13
Telekom IT
Market Unit 1,893
2,273
390
1,884
Q1/13
2,319
426
-2.3%
23.5%
Q2/13
9.7%
221
Q2/12
7.2 %
179
n.a.
Q2/13
2.6%
58
Q2/12
28
+3.1%
Q2/13
1,983
Q2/12
1,924
FINANCIALS: Q2 FCF AND NET INCOME
15
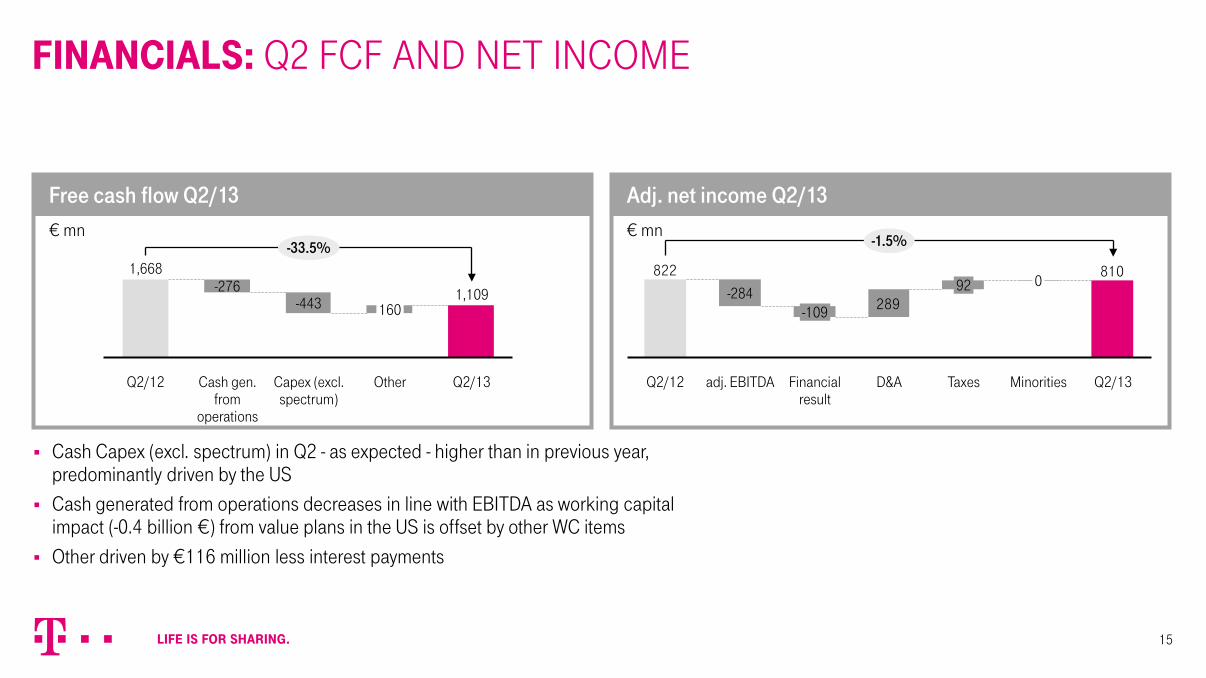
Cash Capex (excl. spectrum) in Q2 - as expected - higher than in previous year, predominantly driven by the US
Cash generated from operations decreases in line with EBITDA as working capital impact (-0.4 billion €) from value plans in the US is offset by other WC items
Other driven by €116 million less interest payments
€ mn
Free cash flow Q2/13 € mn
Adj. net income Q2/13
Capex (excl. spectrum)
-443
Cash gen. from
operations
-276
Q2/12
1,668 -33.5%
Q2/13
1,109
Other
160
810
289
822
-1.5%
Q2/13 Minorities
0
Taxes
92
D&A Financial result
-109
adj. EBITDA
-284
Q2/12
FINANCIALS: H1/13 ROCE AND ADJ. EPS IMPROVED
16
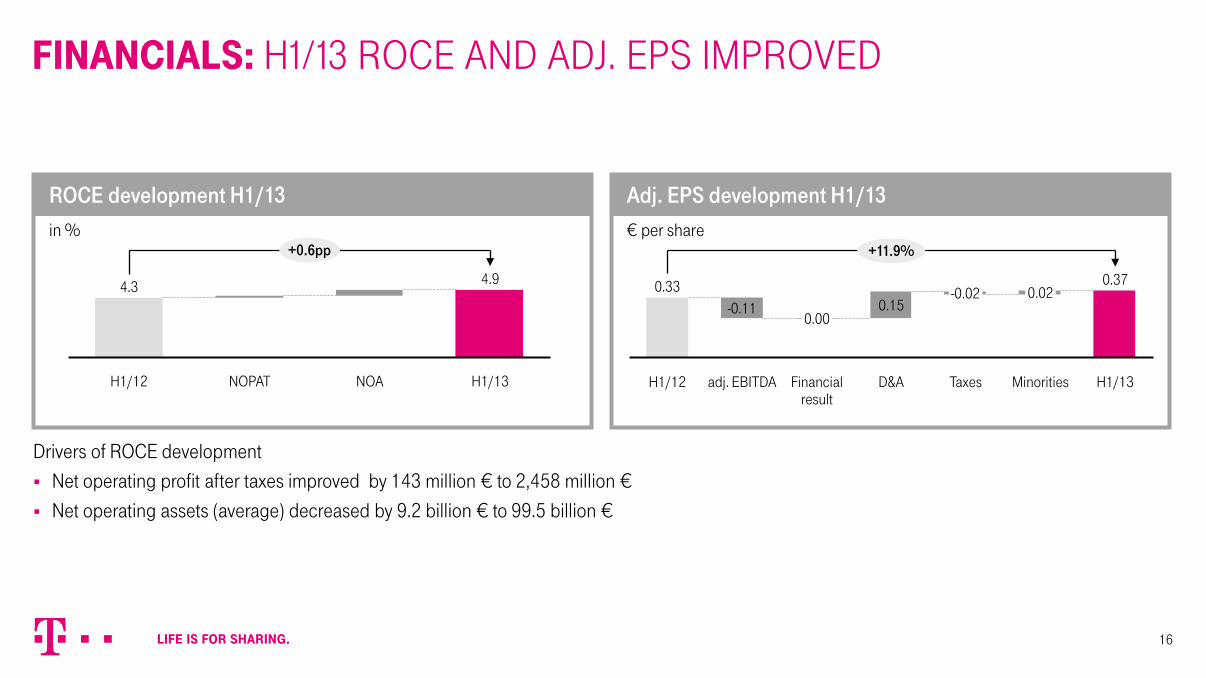
Drivers of ROCE development Net operating profit after taxes improved by 143 million € to 2,458 million € Net operating assets (average) decreased by 9.2 billion € to 99.5 billion €
in %
ROCE development H1/13 € per share
Adj. EPS development H1/13
+0.6pp
H1/13
4.9
NOA NOPAT H1/12
4.3
+11.9%
H1/13
0.37
Minorities
0.02
Taxes
-0.02
D&A
0.15
Financial result
0.00
adj. EBITDA
-0.11
H1/12
0.33
€ mn
Net debt development Q2/13
FINANCIALS: NET DEBT INCREASE DUE TO METRO
+11.5%
Q2/13
41,374
Other
-24
MetroPCS
3,373
Dividend (incl. minorities)
2,015
Free cash flow
-1,109
Q1/13
37,119
17
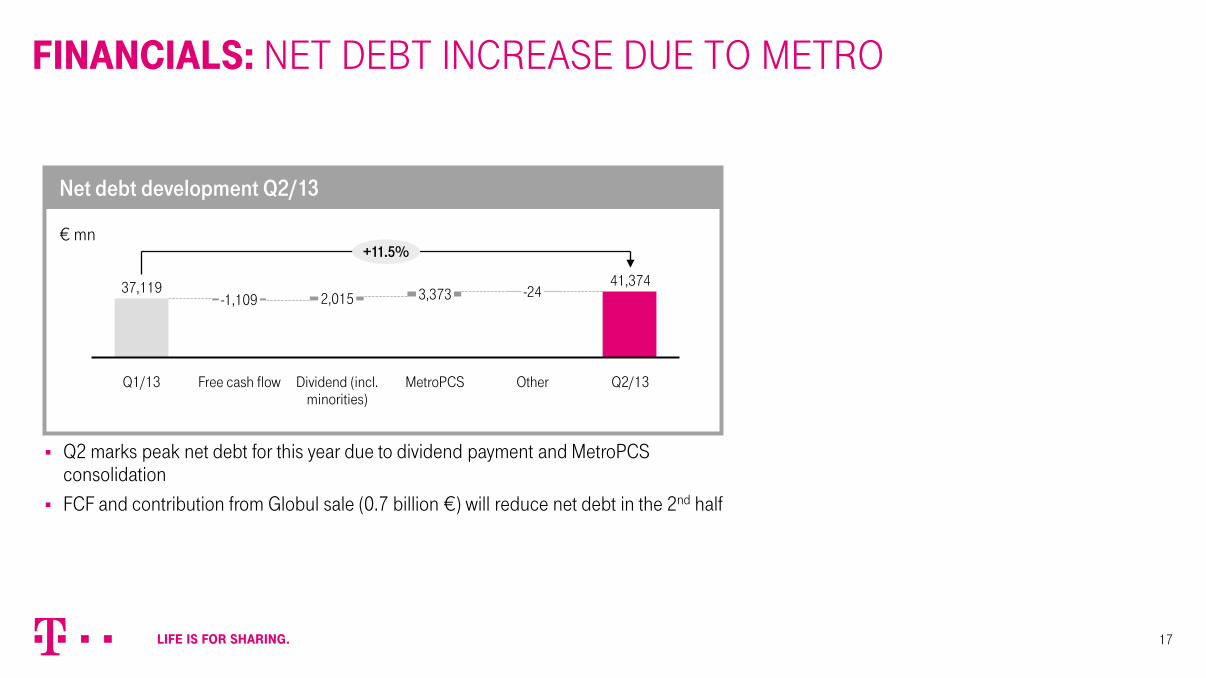
Q2 marks peak net debt for this year due to dividend payment and MetroPCS consolidation
FCF and contribution from Globul sale (0.7 billion €) will reduce net debt in the 2nd half
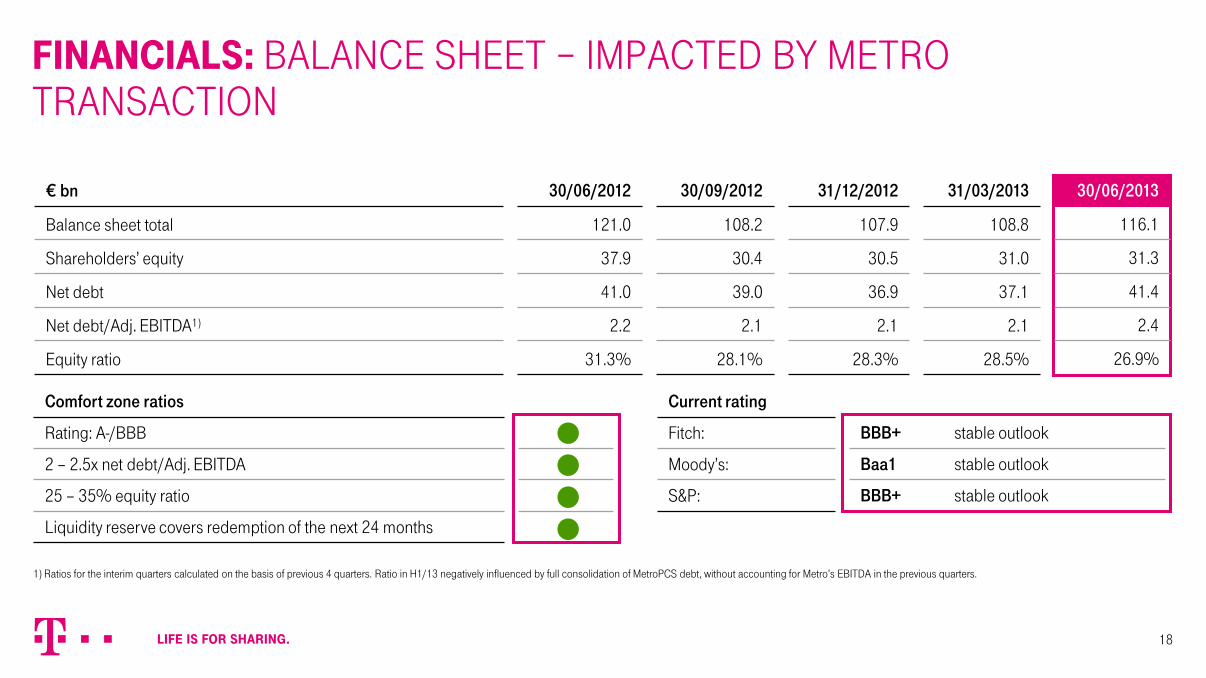
Comfort zone ratios
Rating: A-/BBB
2 – 2.5x net debt/Adj. EBITDA
25 – 35% equity ratio
Liquidity reserve covers redemption of the next 24 months
€ bn 30/06/2012 30/09/2012 31/12/2012 31/03/2013 30/06/2013
Balance sheet total 121.0 108.2 107.9 108.8 116.1
Shareholders’ equity 37.9 30.4 30.5 31.0 31.3
Net debt 41.0 39.0 36.9 37.1 41.4
Net debt/Adj. EBITDA1) 2.2 2.1 2.1 2.1 2.4
Equity ratio 31.3% 28.1% 28.3% 28.5% 26.9%
Current rating
Fitch: BBB+ stable outlook
Moody’s: Baa1 stable outlook
S&P: BBB+ stable outlook
FINANCIALS: BALANCE SHEET – IMPACTED BY METRO TRANSACTION
18
1) Ratios for the interim quarters calculated on the basis of previous 4 quarters. Ratio in H1/13 negatively influenced by full consolidation of MetroPCS debt, without accounting for Metro’s EBITDA in the previous quarters.
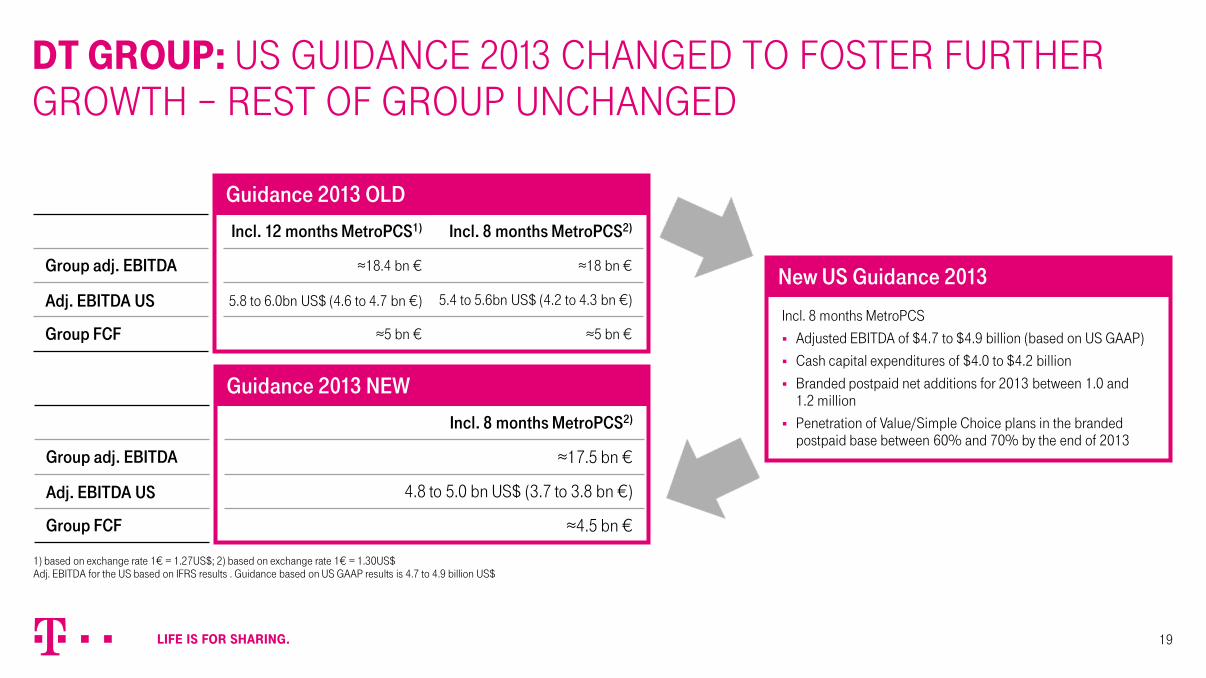
DT GROUP: US GUIDANCE 2013 CHANGED TO FOSTER FURTHER GROWTH – REST OF GROUP UNCHANGED
19
Incl. 8 months MetroPCS Adjusted EBITDA of $4.7 to $4.9 billion (based on US GAAP) Cash capital expenditures of $4.0 to $4.2 billion
Branded postpaid net additions for 2013 between 1.0 and 1.2 million
Penetration of Value/Simple Choice plans in the branded postpaid base between 60% and 70% by the end of 2013
New US Guidance 2013
1) based on exchange rate 1€ = 1.27US$; 2) based on exchange rate 1€ = 1.30US$ Adj. EBITDA for the US based on IFRS results . Guidance based on US GAAP results is 4.7 to 4.9 billion US$
Incl. 12 months MetroPCS1) Incl. 8 months MetroPCS2)
Group adj. EBITDA ≈18.4 bn € ≈18 bn €
Adj. EBITDA US 5.8 to 6.0bn US$ (4.6 to 4.7 bn €) 5.4 to 5.6bn US$ (4.2 to 4.3 bn €)
Group FCF ≈5 bn € ≈5 bn €
Guidance 2013 OLD
Incl. 8 months MetroPCS2)
Group adj. EBITDA ≈17.5 bn €
Adj. EBITDA US 4.8 to 5.0 bn US$ (3.7 to 3.8 bn €)
Group FCF ≈4.5 bn €
Guidance 2013 NEW
DEUTSCHE TELEKOM Q2 2013 RESULTS CONFERENCE CALL
Q&A Questions can be asked via the telephone conference call:
0800 182 6766 0800 028 0471 +1 866 306 3455
+49 69 403 59 619
If you want to ask a question, please press “*1”.
If you want to cancel your question, please press “#”.
FURTHER QUESTIONS PLEASE CONTACT THE IR DEPARTMENT
Investor Relations Phone +49 228 181 - 8 88 80 E-Mail [email protected] For further information please visit IR webpage: IR youtube playlist: IR twitter account:
www.telekom.com/investors

THANK YOU!