determining soil carbon stock changes: simple bulk density corrections fail
TRANSCRIPT
Agriculture, Ecosystems and Environment 134 (2009) 251–256
Determining soil carbon stock changes: Simple bulk density corrections fail
Juhwan Lee a,*, Jan W. Hopmans b, Dennis E. Rolston b, Sara G. Baer c, Johan Six a
a Department of Plant Sciences, University of California, One Shields Ave., Davis, CA 95616, USAb Department of Land, Air, and Water Resources, University of California, Davis, CA 95616, USAc Department of Plant Biology, Center for Ecology, Southern Illinois University, Carbondale, IL 62901, USA
A R T I C L E I N F O
Article history:
Received 7 April 2009
Received in revised form 21 July 2009
Accepted 29 July 2009
Available online 25 August 2009
Keywords:
Soil carbon stocks
Soil organic matter
Bulk density
Equivalent soil mass
Tillage
Land use change
A B S T R A C T
Several methods are used to correct total soil carbon data in response to land use or management
changes inherently coupled with concomitant alteration to bulk density (BD). However, a rigorous
evaluation of correction methods has not been conducted. We compared original, maximum, and
minimum equivalent soil mass (ESM) corrections to the fixed depth (FD) method and direct C
concentrations. In a simulation exercise of a tillage event that decreased BD without change in total C
concentration to a depth of 0.3 m, the original and maximum ESM methods estimated changes in total C
storage of �0.34 to 0.54 Mg C ha�1, well within the range of field soil C variability. In contrast, the
minimum ESM method estimated changes ranging from �1.19 to 1.01 Mg C ha�1. In a field experiment
on reduced and intensive tillage, soil C changes (0–0.18 m) were measured from May to August 2006. The
maximum ESM method generally overestimated soil C changes by �0.16 to 0.60 Mg C ha�1 and the
minimum ESM method underestimated them by �2.67 to 0.23 Mg C ha�1 compared to the original ESM
method. Field-scale soil C changes (0–0.15 m) were also measured from August 2003 to June 2005 and
decreased by an unrealistic 6.64 Mg C ha�1 over the first 6 months after tillage when the FD method was
used. In contrast, the effect of tillage on soil C could be reasonably estimated by directly comparing
changes in C concentration. In a compacted agricultural soil, we found more errors in simulated C
differences when using the maximum than the minimum ESM method. Regardless of the direction of BD
changes, the minimum ESM method was a better choice than the maximum ESM method in native and
restored grassland systems where soil C concentrations decreased through the soil profile. We conclude
that (1) the FD method is often not suitable and might be less accurate than direct C concentration
measurements, and (2) the maximum/minimum ESM method can be accurate depending on the
conditions (e.g., increasing or decreasing BD, systems conversion type), but (3) that the original ESM
method is optimal for detecting soil C changes due to land use changes or management effects.
� 2009 Elsevier B.V. All rights reserved.
Contents lists available at ScienceDirect
Agriculture, Ecosystems and Environment
journal homepage: www.e lsev ier .com/ locate /agee
1. Introduction
To quantify soil carbon changes in response to land use ormanagement, soil samples are typically collected over time andanalyzed for soil C concentration. Soil C concentration is most oftenconverted to C mass per unit area by multiplying it with bulkdensity (BD) to a fixed soil depth. However, soil BD can varyspatially and temporally (Amador et al., 2000; Kulmatiski andBeard, 2004). Thus, quantification of soil C stocks can be biased ifderived from dried samples obtained from a fixed depth (Ellert andBettany, 1995). Onstad et al. (1984) showed that soil BD followingconventional tillage may decrease by 10% or more for a variety ofsoil types. Fluctuations in BD unrelated to land use change, but as aresult of wetting and drying can be substantial for soils with verticproperties. Thus, disregarding BD can over- or underestimate
* Corresponding author.
E-mail address: [email protected] (J. Lee).
0167-8809/$ – see front matter � 2009 Elsevier B.V. All rights reserved.
doi:10.1016/j.agee.2009.07.006
changes in soil C in response to land use or management andprovide erroneous information for soil C sink and sourceassessments (Post et al., 2001; Conant et al., 2003; Vandenbygaartand Angers, 2006; Wuest, 2009). Although these effects areintuitively clear and can be observed in the field, few studies havedemonstrated and quantified their influence on soil C storageestimates.
Ellert and Bettany (1995) demonstrated that the equivalent soilmass (ESM) correction should be used when comparing soil Cstocks in genetic horizons among land use or managementpractices. Equivalent soil mass is defined as the reference soilmass per unit area chosen in a layer and equivalent C mass is Cmass stored in an ESM (Ellert et al., 2001). Numerous studiesrecognize the importance of comparing soil C stocks on the samesoil mass per unit area (Ellert et al., 2001; Gifford and Roderick,2003; Vandenbygaart, 2006; Vandenbygaart and Angers, 2006).The equivalent C mass calculation is expected to reduce samplingerrors in estimates of soil C due to differences in the amount andplacement of plant material input throughout soil profiles under
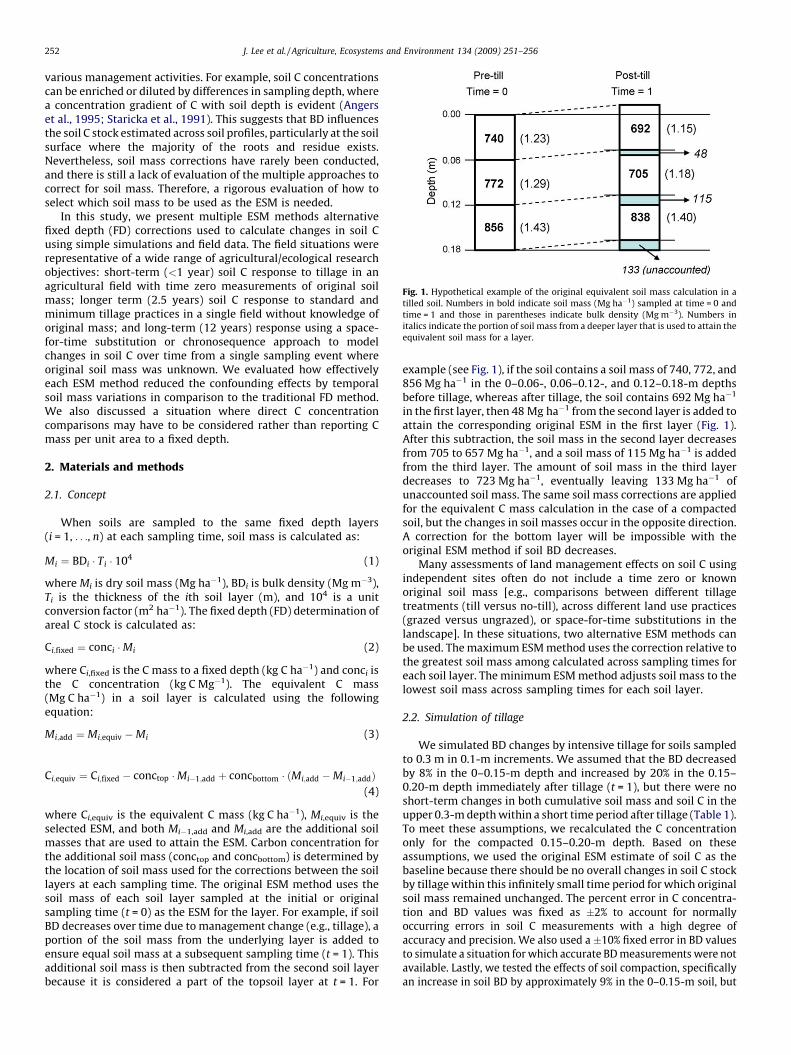
Fig. 1. Hypothetical example of the original equivalent soil mass calculation in a
tilled soil. Numbers in bold indicate soil mass (Mg ha�1) sampled at time = 0 and
time = 1 and those in parentheses indicate bulk density (Mg m�3). Numbers in
italics indicate the portion of soil mass from a deeper layer that is used to attain the
equivalent soil mass for a layer.
J. Lee et al. / Agriculture, Ecosystems and Environment 134 (2009) 251–256252
various management activities. For example, soil C concentrationscan be enriched or diluted by differences in sampling depth, wherea concentration gradient of C with soil depth is evident (Angerset al., 1995; Staricka et al., 1991). This suggests that BD influencesthe soil C stock estimated across soil profiles, particularly at the soilsurface where the majority of the roots and residue exists.Nevertheless, soil mass corrections have rarely been conducted,and there is still a lack of evaluation of the multiple approaches tocorrect for soil mass. Therefore, a rigorous evaluation of how toselect which soil mass to be used as the ESM is needed.
In this study, we present multiple ESM methods alternativefixed depth (FD) corrections used to calculate changes in soil Cusing simple simulations and field data. The field situations wererepresentative of a wide range of agricultural/ecological researchobjectives: short-term (<1 year) soil C response to tillage in anagricultural field with time zero measurements of original soilmass; longer term (2.5 years) soil C response to standard andminimum tillage practices in a single field without knowledge oforiginal mass; and long-term (12 years) response using a space-for-time substitution or chronosequence approach to modelchanges in soil C over time from a single sampling event whereoriginal soil mass was unknown. We evaluated how effectivelyeach ESM method reduced the confounding effects by temporalsoil mass variations in comparison to the traditional FD method.We also discussed a situation where direct C concentrationcomparisons may have to be considered rather than reporting Cmass per unit area to a fixed depth.
2. Materials and methods
2.1. Concept
When soils are sampled to the same fixed depth layers(i = 1, . . ., n) at each sampling time, soil mass is calculated as:
Mi ¼ BDi � Ti � 104 (1)
where Mi is dry soil mass (Mg ha�1), BDi is bulk density (Mg m�3),Ti is the thickness of the ith soil layer (m), and 104 is a unitconversion factor (m2 ha�1). The fixed depth (FD) determination ofareal C stock is calculated as:
Ci;fixed ¼ conci �Mi (2)
where Ci,fixed is the C mass to a fixed depth (kg C ha�1) and conci isthe C concentration (kg C Mg�1). The equivalent C mass(Mg C ha�1) in a soil layer is calculated using the followingequation:
Mi;add ¼ Mi;equiv �Mi (3)
Ci;equiv ¼ Ci;fixed � conctop �Mi�1;add þ concbottom � ðMi;add �Mi�1;addÞ(4)
where Ci,equiv is the equivalent C mass (kg C ha�1), Mi,equiv is theselected ESM, and both Mi�1,add and Mi,add are the additional soilmasses that are used to attain the ESM. Carbon concentration forthe additional soil mass (conctop and concbottom) is determined bythe location of soil mass used for the corrections between the soillayers at each sampling time. The original ESM method uses thesoil mass of each soil layer sampled at the initial or originalsampling time (t = 0) as the ESM for the layer. For example, if soilBD decreases over time due to management change (e.g., tillage), aportion of the soil mass from the underlying layer is added toensure equal soil mass at a subsequent sampling time (t = 1). Thisadditional soil mass is then subtracted from the second soil layerbecause it is considered a part of the topsoil layer at t = 1. For
example (see Fig. 1), if the soil contains a soil mass of 740, 772, and856 Mg ha�1 in the 0–0.06-, 0.06–0.12-, and 0.12–0.18-m depthsbefore tillage, whereas after tillage, the soil contains 692 Mg ha�1
in the first layer, then 48 Mg ha�1 from the second layer is added toattain the corresponding original ESM in the first layer (Fig. 1).After this subtraction, the soil mass in the second layer decreasesfrom 705 to 657 Mg ha�1, and a soil mass of 115 Mg ha�1 is addedfrom the third layer. The amount of soil mass in the third layerdecreases to 723 Mg ha�1, eventually leaving 133 Mg ha�1 ofunaccounted soil mass. The same soil mass corrections are appliedfor the equivalent C mass calculation in the case of a compactedsoil, but the changes in soil masses occur in the opposite direction.A correction for the bottom layer will be impossible with theoriginal ESM method if soil BD decreases.
Many assessments of land management effects on soil C usingindependent sites often do not include a time zero or knownoriginal soil mass [e.g., comparisons between different tillagetreatments (till versus no-till), across different land use practices(grazed versus ungrazed), or space-for-time substitutions in thelandscape]. In these situations, two alternative ESM methods canbe used. The maximum ESM method uses the correction relative tothe greatest soil mass among calculated across sampling times foreach soil layer. The minimum ESM method adjusts soil mass to thelowest soil mass across sampling times for each soil layer.
2.2. Simulation of tillage
We simulated BD changes by intensive tillage for soils sampledto 0.3 m in 0.1-m increments. We assumed that the BD decreasedby 8% in the 0–0.15-m depth and increased by 20% in the 0.15–0.20-m depth immediately after tillage (t = 1), but there were noshort-term changes in both cumulative soil mass and soil C in theupper 0.3-m depth within a short time period after tillage (Table 1).To meet these assumptions, we recalculated the C concentrationonly for the compacted 0.15–0.20-m depth. Based on theseassumptions, we used the original ESM estimate of soil C as thebaseline because there should be no overall changes in soil C stockby tillage within this infinitely small time period for which originalsoil mass remained unchanged. The percent error in C concentra-tion and BD values was fixed as �2% to account for normallyoccurring errors in soil C measurements with a high degree ofaccuracy and precision. We also used a �10% fixed error in BD valuesto simulate a situation for which accurate BD measurements were notavailable. Lastly, we tested the effects of soil compaction, specificallyan increase in soil BD by approximately 9% in the 0–0.15-m soil, but

Table 1Data set used in the tillage simulation.
Depth (m) Time = 0 Time = 1
C concentration (kg C Mg�1) Bulk density (Mg m�3) C concentration (kg C Mg�1) Bulk density (Mg m�3)
0–0.05 13.0 1.17 13.0 1.07
0.05–0.10 9.8 1.43 9.8 1.32
0.10–0.15 8.4 1.55 8.4 1.43
0.15–0.20 7.4 1.63 7.9a 1.96
0.20–0.25 6.7 1.69 6.7 1.69
0.25–0.30 6.2 1.74 6.2 1.74
0.30–0.35 5.7 1.78 5.7 1.78
0.35–0.40 5.3 1.81 5.3 1.81
a Soil carbon concentration was recalculated for the compacted layer (0.15–0.20 m) to have the same cumulative C stocks within this infinitely small period.
J. Lee et al. / Agriculture, Ecosystems and Environment 134 (2009) 251–256 253
decrease by 17% in the 0.15–0.20-m soil layer. These simulationconditions were achieved by considering the data set at t = 1 used inthe tillage simulation as the initial sampling time before soilcompaction and t = 0 as the next sampling time after soil compaction(Table 1).
2.3. Field observations
We compared simulation results to field experiments. Theresearch site was a 30-ha irrigated commercial farm located nearDavis, CA (388360N, 1218500W). The soil was predominantly Myersclay (fine, montmorillonitic, thermic Entic Chromoxererts; Chro-mic Vertisol) (FAO/ISRIC/ISSS, 1998). The site was managed understandard tillage through the fall of 2000 and converted to no-till inthe fall of 2001. The site was split into two fields in October 2003,with the north half of the site under standard tillage operations andthe south half remaining under no-till. In May 2005, both fieldswere converted to minimum tillage. The tillage treatments arefully described by Lee et al. (2009). The entire site was planted towheat (Triticum aestivum), maize (Zea mays), sunflower (Helianthus
annuus), and ‘Sierra’ chickpea (Cicer arietinum cv. Sanford) from2003 to 2006, respectively.
Soil cores (4.4-cm diameter) were taken from the fields at 72GPS-referenced plots on a 64-m spaced regular grid to a depth of15 cm in August 2003, April and October 2004, and June 2005. In2006, we selected 12 sampling locations from the 72 plots based onsand content gradients: high sand (�48.8%), medium sand(�29.8%), and low sand (�18.6%). A 0.06-m ring of 0.086-mdiameter was gently pushed into the soil and carefully removed,ensuring minimum compaction and soil loss. This way of samplingwas conducted for the 0–0.6-, 0.6–0.12- and 0.12–0.18-m soildepth intervals. Soil samples were collected on May 4 and 26, andAugust 25, 2006. Between sampling events, the field was cultivatedfor weeds on May 16–17, 2006, and then tilled by disking to 0.15 mand listing beds on July 20–21, followed by cultivation on August15–16. Soil-water contents generally varied between 0.05 and0.3 cm3 cm�3 across the depths at the time of sampling. All soilsamples were analyzed for BD and total C concentration. Total Cconcentration was measured with a PDZ Europa ANCA CN analyzer(SerCon, Cheshire, UK).
We performed two separate comparisons of ESM corrections toFD methods using data from this field site. First, we used the FD andthree ESM methods to calculate soil C stock for soil collected in2006. We used the soil mass sampled on May 4, 2006 as the knownoriginal soil mass for each layer and compared all correctionmethods. Second, we compared the minimum ESM method anddirect C concentrations to FD calculations in response to tillagepractice using soil data collected from 2003 to 2005, because theoriginal ESM was not available to accurately estimate long-term Cstock changes and the sampling was only done for the top 0.15-mdepth.
2.4. Published data
We used published data on soil C change in response tograssland restoration on long-term cultivated soil (Baer et al.,2002) to better understand how land use changes affect estimatesof soil C stocks using the maximum and minimum ESM and the FDmethods. Soil was collected from 3 cultivated fields and 15 fieldsrestored to native grasses for 2–12 years, and three native prairiesthat were never cultivated in Gage and Saline counties, Nebraska(Baer et al., 2002). Soil cores (�20, 0.02-m diameter) were taken toa depth of 0.20 m from the three cultivated sites in 1998 and fromall restored and native prairie sites in 1999. Bulk density wassampled from each sited using a 0.05-m diameter soil core. Soilcores were composited by 0–0.1- and 0.1–0.2-m depths at eachsite. Baer et al. (2002) provide a detailed site description andmethods used to quantify percent C in soil samples. Changes in soilC over time were analyzed using the linear regression procedure inSAS (SAS Institute, 2004).
3. Results and discussion
Differences in the simulated soil C stocks between samplingtimes were affected by use of the original, maximum, or minimumESM method (Table 2). Compared to the FD method, the ESMmethods were able to correct a portion of changes in soil Cinfluenced by both short-term and fine-scale fluctuations in BD.When soil surface BD with a fixed error of �2% was assumed todecrease by tillage, soil C stocks estimated with the original ESMmethod differed by �0.34 Mg C ha�1 in the top (0–0.1-m) soil layer,by 0.33 Mg C ha�1 in the intermediate (0.1–0.2-m) soil layer, and by0.01 Mg C ha�1 in the bottom (0.2–0.3-m) soil layer betweenimmediately before (T0) and after (T1) tillage (Table 2). When themaximum ESM method was used, differences were �0.34, 0.54, and0.06 Mg C ha�1, respectively. These differences were within the rangeof errors associated with the soil C stocks throughout the profiles(Table 2). However, when the minimum ESM method was used, thedifferences for the top two layers went beyond the range of soil Cvariability (�1.19 and 1.01 Mg C ha�1, respectively). Furthermore,these differences were similar to the differences calculated based on afixed depth (�1.19 and 1.22 Mg C ha�1, respectively) (Table 2). For acompacted soil, on the other hand, the short-term differences in bothoriginal and minimum equivalent C mass in the top two layers werewithin the error, whereas the differences in the maximum equivalentC mass had a similar error as the FD method (Table 3).
The simulation results suggest that correcting soil C stocks forBD using the maximum or minimum ESM is not sufficient tonullify confounding effects by natural or land use/management-induced changes in BD. The direction of the BD changes must beconsidered for selection of the maximum versus minimum ESM toeffectively reduce errors in the estimation of soil C stocks.Nevertheless, the most important factor is the uncertainty around
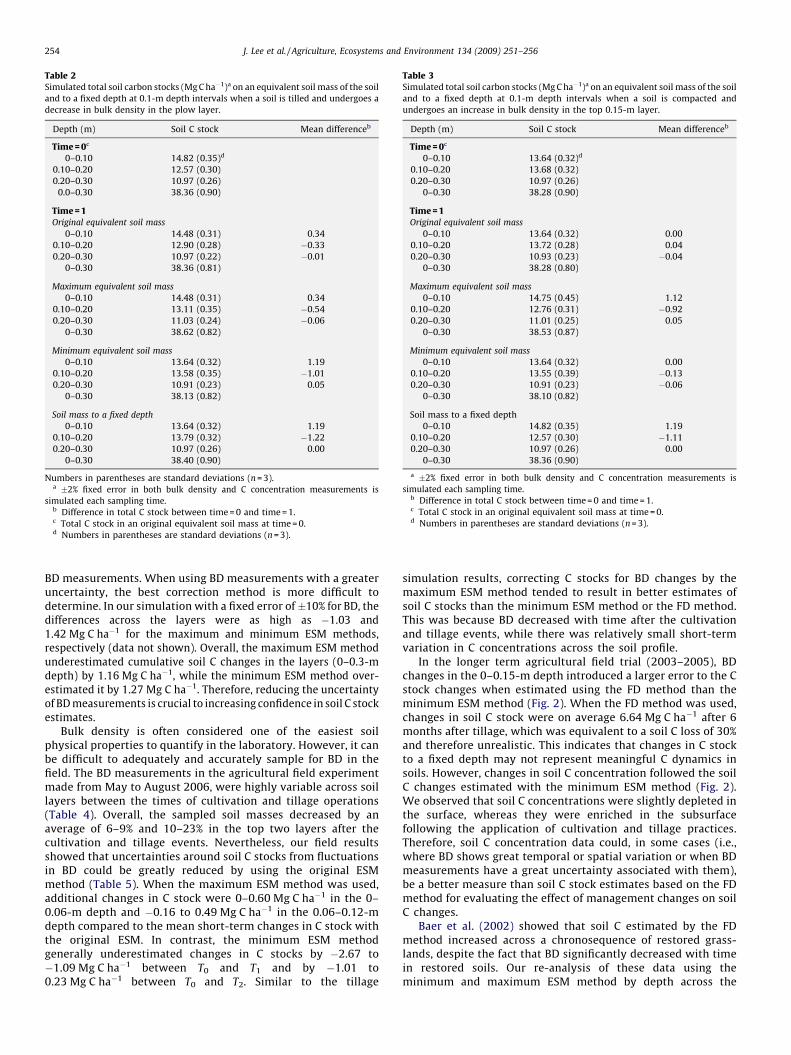
Table 2Simulated total soil carbon stocks (Mg C ha�1)a on an equivalent soil mass of the soil
and to a fixed depth at 0.1-m depth intervals when a soil is tilled and undergoes a
decrease in bulk density in the plow layer.
Depth (m) Soil C stock Mean differenceb
Time = 0c
0–0.10 14.82 (0.35)d
0.10–0.20 12.57 (0.30)
0.20–0.30 10.97 (0.26)
0.0–0.30 38.36 (0.90)
Time = 1Original equivalent soil mass
0–0.10 14.48 (0.31) 0.34
0.10–0.20 12.90 (0.28) �0.33
0.20–0.30 10.97 (0.22) �0.01
0–0.30 38.36 (0.81)
Maximum equivalent soil mass
0–0.10 14.48 (0.31) 0.34
0.10–0.20 13.11 (0.35) �0.54
0.20–0.30 11.03 (0.24) �0.06
0–0.30 38.62 (0.82)
Minimum equivalent soil mass
0–0.10 13.64 (0.32) 1.19
0.10–0.20 13.58 (0.35) �1.01
0.20–0.30 10.91 (0.23) 0.05
0–0.30 38.13 (0.82)
Soil mass to a fixed depth
0–0.10 13.64 (0.32) 1.19
0.10–0.20 13.79 (0.32) �1.22
0.20–0.30 10.97 (0.26) 0.00
0–0.30 38.40 (0.90)
Numbers in parentheses are standard deviations (n = 3).a �2% fixed error in both bulk density and C concentration measurements is
simulated each sampling time.b Difference in total C stock between time = 0 and time = 1.c Total C stock in an original equivalent soil mass at time = 0.d Numbers in parentheses are standard deviations (n = 3).
Table 3Simulated total soil carbon stocks (Mg C ha�1)a on an equivalent soil mass of the soil
and to a fixed depth at 0.1-m depth intervals when a soil is compacted and
undergoes an increase in bulk density in the top 0.15-m layer.
Depth (m) Soil C stock Mean differenceb
Time = 0c
0–0.10 13.64 (0.32)d
0.10–0.20 13.68 (0.32)
0.20–0.30 10.97 (0.26)
0–0.30 38.28 (0.90)
Time = 1Original equivalent soil mass
0–0.10 13.64 (0.32) 0.00
0.10–0.20 13.72 (0.28) 0.04
0.20–0.30 10.93 (0.23) �0.04
0–0.30 38.28 (0.80)
Maximum equivalent soil mass
0–0.10 14.75 (0.45) 1.12
0.10–0.20 12.76 (0.31) �0.92
0.20–0.30 11.01 (0.25) 0.05
0–0.30 38.53 (0.87)
Minimum equivalent soil mass
0–0.10 13.64 (0.32) 0.00
0.10–0.20 13.55 (0.39) �0.13
0.20–0.30 10.91 (0.23) �0.06
0–0.30 38.10 (0.82)
Soil mass to a fixed depth
0–0.10 14.82 (0.35) 1.19
0.10–0.20 12.57 (0.30) �1.11
0.20–0.30 10.97 (0.26) 0.00
0–0.30 38.36 (0.90)
a �2% fixed error in both bulk density and C concentration measurements is
simulated each sampling time.b Difference in total C stock between time = 0 and time = 1.c Total C stock in an original equivalent soil mass at time = 0.d Numbers in parentheses are standard deviations (n = 3).
J. Lee et al. / Agriculture, Ecosystems and Environment 134 (2009) 251–256254
BD measurements. When using BD measurements with a greateruncertainty, the best correction method is more difficult todetermine. In our simulation with a fixed error of �10% for BD, thedifferences across the layers were as high as �1.03 and1.42 Mg C ha�1 for the maximum and minimum ESM methods,respectively (data not shown). Overall, the maximum ESM methodunderestimated cumulative soil C changes in the layers (0–0.3-mdepth) by 1.16 Mg C ha�1, while the minimum ESM method over-estimated it by 1.27 Mg C ha�1. Therefore, reducing the uncertaintyof BD measurements is crucial to increasing confidence in soil C stockestimates.
Bulk density is often considered one of the easiest soilphysical properties to quantify in the laboratory. However, it canbe difficult to adequately and accurately sample for BD in thefield. The BD measurements in the agricultural field experimentmade from May to August 2006, were highly variable across soillayers between the times of cultivation and tillage operations(Table 4). Overall, the sampled soil masses decreased by anaverage of 6–9% and 10–23% in the top two layers after thecultivation and tillage events. Nevertheless, our field resultsshowed that uncertainties around soil C stocks from fluctuationsin BD could be greatly reduced by using the original ESMmethod (Table 5). When the maximum ESM method was used,additional changes in C stock were 0–0.60 Mg C ha�1 in the 0–0.06-m depth and �0.16 to 0.49 Mg C ha�1 in the 0.06–0.12-mdepth compared to the mean short-term changes in C stock withthe original ESM. In contrast, the minimum ESM methodgenerally underestimated changes in C stocks by �2.67 to�1.09 Mg C ha�1 between T0 and T1 and by �1.01 to0.23 Mg C ha�1 between T0 and T2. Similar to the tillage
simulation results, correcting C stocks for BD changes by themaximum ESM method tended to result in better estimates ofsoil C stocks than the minimum ESM method or the FD method.This was because BD decreased with time after the cultivationand tillage events, while there was relatively small short-termvariation in C concentrations across the soil profile.
In the longer term agricultural field trial (2003–2005), BDchanges in the 0–0.15-m depth introduced a larger error to the Cstock changes when estimated using the FD method than theminimum ESM method (Fig. 2). When the FD method was used,changes in soil C stock were on average 6.64 Mg C ha�1 after 6months after tillage, which was equivalent to a soil C loss of 30%and therefore unrealistic. This indicates that changes in C stockto a fixed depth may not represent meaningful C dynamics insoils. However, changes in soil C concentration followed the soilC changes estimated with the minimum ESM method (Fig. 2).We observed that soil C concentrations were slightly depleted inthe surface, whereas they were enriched in the subsurfacefollowing the application of cultivation and tillage practices.Therefore, soil C concentration data could, in some cases (i.e.,where BD shows great temporal or spatial variation or when BDmeasurements have a great uncertainty associated with them),be a better measure than soil C stock estimates based on the FDmethod for evaluating the effect of management changes on soilC changes.
Baer et al. (2002) showed that soil C estimated by the FDmethod increased across a chronosequence of restored grass-lands, despite the fact that BD significantly decreased with timein restored soils. Our re-analysis of these data using theminimum and maximum ESM method by depth across the
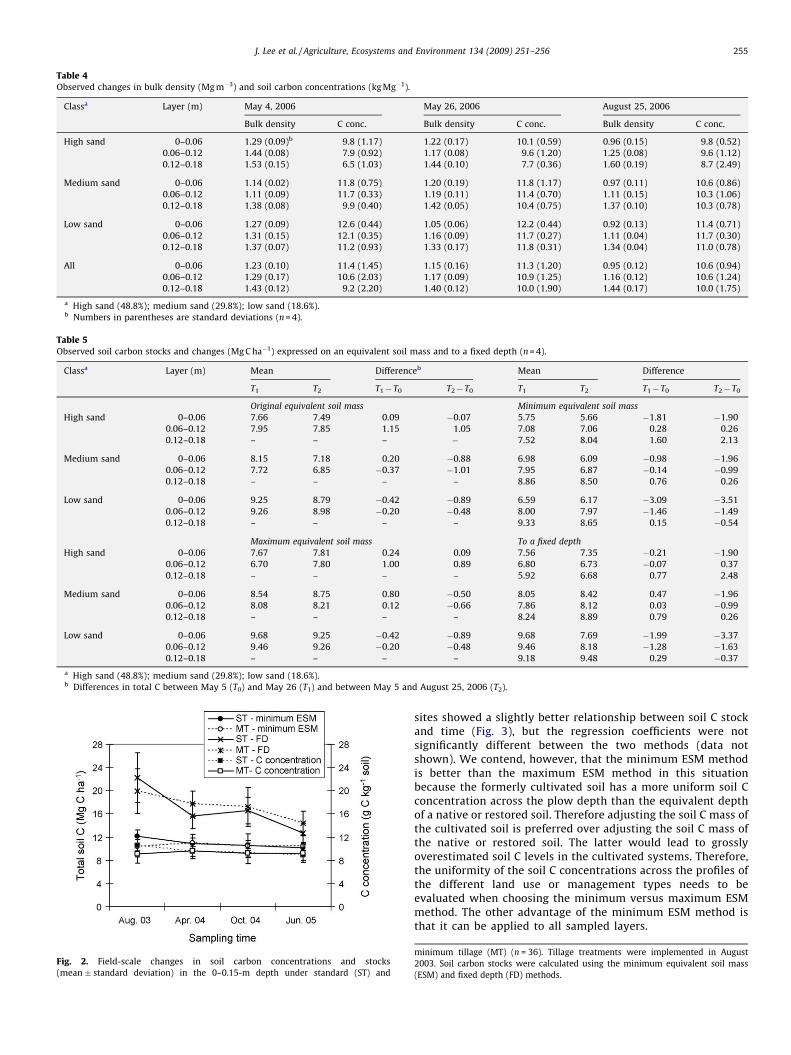
Table 4Observed changes in bulk density (Mg m�3) and soil carbon concentrations (kg Mg�1).
Classa Layer (m) May 4, 2006 May 26, 2006 August 25, 2006
Bulk density C conc. Bulk density C conc. Bulk density C conc.
High sand 0–0.06 1.29 (0.09)b 9.8 (1.17) 1.22 (0.17) 10.1 (0.59) 0.96 (0.15) 9.8 (0.52)
0.06–0.12 1.44 (0.08) 7.9 (0.92) 1.17 (0.08) 9.6 (1.20) 1.25 (0.08) 9.6 (1.12)
0.12–0.18 1.53 (0.15) 6.5 (1.03) 1.44 (0.10) 7.7 (0.36) 1.60 (0.19) 8.7 (2.49)
Medium sand 0–0.06 1.14 (0.02) 11.8 (0.75) 1.20 (0.19) 11.8 (1.17) 0.97 (0.11) 10.6 (0.86)
0.06–0.12 1.11 (0.09) 11.7 (0.33) 1.19 (0.11) 11.4 (0.70) 1.11 (0.15) 10.3 (1.06)
0.12–0.18 1.38 (0.08) 9.9 (0.40) 1.42 (0.05) 10.4 (0.75) 1.37 (0.10) 10.3 (0.78)
Low sand 0–0.06 1.27 (0.09) 12.6 (0.44) 1.05 (0.06) 12.2 (0.44) 0.92 (0.13) 11.4 (0.71)
0.06–0.12 1.31 (0.15) 12.1 (0.35) 1.16 (0.09) 11.7 (0.27) 1.11 (0.04) 11.7 (0.30)
0.12–0.18 1.37 (0.07) 11.2 (0.93) 1.33 (0.17) 11.8 (0.31) 1.34 (0.04) 11.0 (0.78)
All 0–0.06 1.23 (0.10) 11.4 (1.45) 1.15 (0.16) 11.3 (1.20) 0.95 (0.12) 10.6 (0.94)
0.06–0.12 1.29 (0.17) 10.6 (2.03) 1.17 (0.09) 10.9 (1.25) 1.16 (0.12) 10.6 (1.24)
0.12–0.18 1.43 (0.12) 9.2 (2.20) 1.40 (0.12) 10.0 (1.90) 1.44 (0.17) 10.0 (1.75)
a High sand (48.8%); medium sand (29.8%); low sand (18.6%).b Numbers in parentheses are standard deviations (n = 4).
Table 5Observed soil carbon stocks and changes (Mg C ha�1) expressed on an equivalent soil mass and to a fixed depth (n = 4).
Classa Layer (m) Mean Differenceb Mean Difference
T1 T2 T1�T0 T2�T0 T1 T2 T1�T0 T2�T0
Original equivalent soil mass Minimum equivalent soil mass
High sand 0–0.06 7.66 7.49 0.09 �0.07 5.75 5.66 �1.81 �1.90
0.06–0.12 7.95 7.85 1.15 1.05 7.08 7.06 0.28 0.26
0.12–0.18 – – – � 7.52 8.04 1.60 2.13
Medium sand 0–0.06 8.15 7.18 0.20 �0.88 6.98 6.09 �0.98 �1.96
0.06–0.12 7.72 6.85 �0.37 �1.01 7.95 6.87 �0.14 �0.99
0.12–0.18 – – – – 8.86 8.50 0.76 0.26
Low sand 0–0.06 9.25 8.79 �0.42 �0.89 6.59 6.17 �3.09 �3.51
0.06–0.12 9.26 8.98 �0.20 �0.48 8.00 7.97 �1.46 �1.49
0.12–0.18 – – – – 9.33 8.65 0.15 �0.54
Maximum equivalent soil mass To a fixed depth
High sand 0–0.06 7.67 7.81 0.24 0.09 7.56 7.35 �0.21 �1.90
0.06–0.12 6.70 7.80 1.00 0.89 6.80 6.73 �0.07 0.37
0.12–0.18 – – – – 5.92 6.68 0.77 2.48
Medium sand 0–0.06 8.54 8.75 0.80 �0.50 8.05 8.42 0.47 �1.96
0.06–0.12 8.08 8.21 0.12 �0.66 7.86 8.12 0.03 �0.99
0.12–0.18 – – – – 8.24 8.89 0.79 0.26
Low sand 0–0.06 9.68 9.25 �0.42 �0.89 9.68 7.69 �1.99 �3.37
0.06–0.12 9.46 9.26 �0.20 �0.48 9.46 8.18 �1.28 �1.63
0.12–0.18 – – – – 9.18 9.48 0.29 �0.37
a High sand (48.8%); medium sand (29.8%); low sand (18.6%).b Differences in total C between May 5 (T0) and May 26 (T1) and between May 5 and August 25, 2006 (T2).
Fig. 2. Field-scale changes in soil carbon concentrations and stocks
(mean � standard deviation) in the 0–0.15-m depth under standard (ST) and
J. Lee et al. / Agriculture, Ecosystems and Environment 134 (2009) 251–256 255
sites showed a slightly better relationship between soil C stockand time (Fig. 3), but the regression coefficients were notsignificantly different between the two methods (data notshown). We contend, however, that the minimum ESM methodis better than the maximum ESM method in this situationbecause the formerly cultivated soil has a more uniform soil Cconcentration across the plow depth than the equivalent depthof a native or restored soil. Therefore adjusting the soil C mass ofthe cultivated soil is preferred over adjusting the soil C mass ofthe native or restored soil. The latter would lead to grosslyoverestimated soil C levels in the cultivated systems. Therefore,the uniformity of the soil C concentrations across the profiles ofthe different land use or management types needs to beevaluated when choosing the minimum versus maximum ESMmethod. The other advantage of the minimum ESM method isthat it can be applied to all sampled layers.
minimum tillage (MT) (n = 36). Tillage treatments were implemented in August
2003. Soil carbon stocks were calculated using the minimum equivalent soil mass
(ESM) and fixed depth (FD) methods.
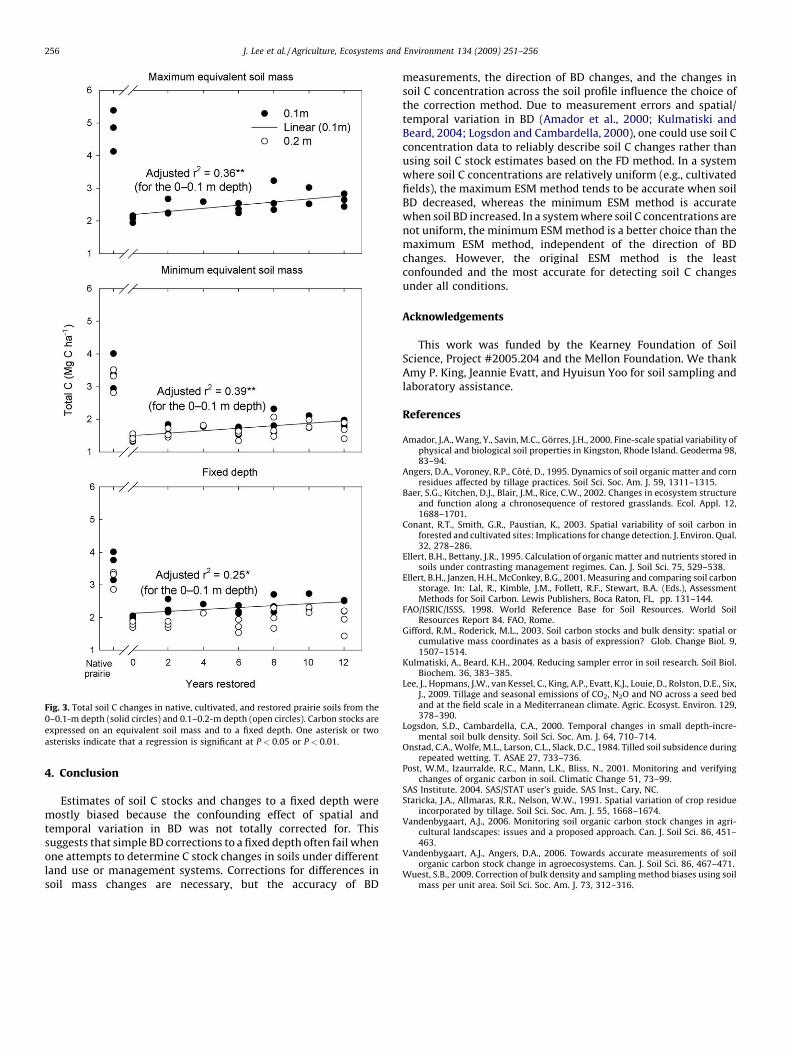
Fig. 3. Total soil C changes in native, cultivated, and restored prairie soils from the
0–0.1-m depth (solid circles) and 0.1–0.2-m depth (open circles). Carbon stocks are
expressed on an equivalent soil mass and to a fixed depth. One asterisk or two
asterisks indicate that a regression is significant at P < 0.05 or P < 0.01.
J. Lee et al. / Agriculture, Ecosystems and Environment 134 (2009) 251–256256
4. Conclusion
Estimates of soil C stocks and changes to a fixed depth weremostly biased because the confounding effect of spatial andtemporal variation in BD was not totally corrected for. Thissuggests that simple BD corrections to a fixed depth often fail whenone attempts to determine C stock changes in soils under differentland use or management systems. Corrections for differences insoil mass changes are necessary, but the accuracy of BD
measurements, the direction of BD changes, and the changes insoil C concentration across the soil profile influence the choice ofthe correction method. Due to measurement errors and spatial/temporal variation in BD (Amador et al., 2000; Kulmatiski andBeard, 2004; Logsdon and Cambardella, 2000), one could use soil Cconcentration data to reliably describe soil C changes rather thanusing soil C stock estimates based on the FD method. In a systemwhere soil C concentrations are relatively uniform (e.g., cultivatedfields), the maximum ESM method tends to be accurate when soilBD decreased, whereas the minimum ESM method is accuratewhen soil BD increased. In a system where soil C concentrations arenot uniform, the minimum ESM method is a better choice than themaximum ESM method, independent of the direction of BDchanges. However, the original ESM method is the leastconfounded and the most accurate for detecting soil C changesunder all conditions.
Acknowledgements
This work was funded by the Kearney Foundation of SoilScience, Project #2005.204 and the Mellon Foundation. We thankAmy P. King, Jeannie Evatt, and Hyuisun Yoo for soil sampling andlaboratory assistance.
References
Amador, J.A., Wang, Y., Savin, M.C., Gorres, J.H., 2000. Fine-scale spatial variability ofphysical and biological soil properties in Kingston, Rhode Island. Geoderma 98,83–94.
Angers, D.A., Voroney, R.P., Cote, D., 1995. Dynamics of soil organic matter and cornresidues affected by tillage practices. Soil Sci. Soc. Am. J. 59, 1311–1315.
Baer, S.G., Kitchen, D.J., Blair, J.M., Rice, C.W., 2002. Changes in ecosystem structureand function along a chronosequence of restored grasslands. Ecol. Appl. 12,1688–1701.
Conant, R.T., Smith, G.R., Paustian, K., 2003. Spatial variability of soil carbon inforested and cultivated sites: Implications for change detection. J. Environ. Qual.32, 278–286.
Ellert, B.H., Bettany, J.R., 1995. Calculation of organic matter and nutrients stored insoils under contrasting management regimes. Can. J. Soil Sci. 75, 529–538.
Ellert, B.H., Janzen, H.H., McConkey, B.G., 2001. Measuring and comparing soil carbonstorage. In: Lal, R., Kimble, J.M., Follett, R.F., Stewart, B.A. (Eds.), AssessmentMethods for Soil Carbon. Lewis Publishers, Boca Raton, FL, pp. 131–144.
FAO/ISRIC/ISSS, 1998. World Reference Base for Soil Resources. World SoilResources Report 84. FAO, Rome.
Gifford, R.M., Roderick, M.L., 2003. Soil carbon stocks and bulk density: spatial orcumulative mass coordinates as a basis of expression? Glob. Change Biol. 9,1507–1514.
Kulmatiski, A., Beard, K.H., 2004. Reducing sampler error in soil research. Soil Biol.Biochem. 36, 383–385.
Lee, J., Hopmans, J.W., van Kessel, C., King, A.P., Evatt, K.J., Louie, D., Rolston, D.E., Six,J., 2009. Tillage and seasonal emissions of CO2, N2O and NO across a seed bedand at the field scale in a Mediterranean climate. Agric. Ecosyst. Environ. 129,378–390.
Logsdon, S.D., Cambardella, C.A., 2000. Temporal changes in small depth-incre-mental soil bulk density. Soil Sci. Soc. Am. J. 64, 710–714.
Onstad, C.A., Wolfe, M.L., Larson, C.L., Slack, D.C., 1984. Tilled soil subsidence duringrepeated wetting. T. ASAE 27, 733–736.
Post, W.M., Izaurralde, R.C., Mann, L.K., Bliss, N., 2001. Monitoring and verifyingchanges of organic carbon in soil. Climatic Change 51, 73–99.
SAS Institute. 2004. SAS/STAT user’s guide. SAS Inst., Cary, NC.Staricka, J.A., Allmaras, R.R., Nelson, W.W., 1991. Spatial variation of crop residue
incorporated by tillage. Soil Sci. Soc. Am. J. 55, 1668–1674.Vandenbygaart, A.J., 2006. Monitoring soil organic carbon stock changes in agri-
cultural landscapes: issues and a proposed approach. Can. J. Soil Sci. 86, 451–463.
Vandenbygaart, A.J., Angers, D.A., 2006. Towards accurate measurements of soilorganic carbon stock change in agroecosystems. Can. J. Soil Sci. 86, 467–471.
Wuest, S.B., 2009. Correction of bulk density and sampling method biases using soilmass per unit area. Soil Sci. Soc. Am. J. 73, 312–316.