determination of the scattering lengths of gallium isotopes by neutron interferometry with...
TRANSCRIPT
*Corresponding author. Tel.: #81 29 2826830; fax: #81 292826716; e-mail: [email protected].
Nuclear Instruments and Methods in Physics Research A 420 (1999) 453—466
Determination of the scattering lengths of gallium isotopes byneutron interferometry with PNO-apparatus in JRR-3M
H. Tomimitsu!,*, Y. Hasegawa", K. Aizawa!, S. Kikuta"
! Advanced Science Research Center, JAERI, Tokai-mura, Naka-gun, Ibaraki-ken, 319-11, Japan" Department of Applied Physics, University of Tokyo, Hongo, Bunkyo-ku, Tokyo113, Japan
Received 22 January 1998; received in revised form 10 July 1998
Abstract
For carrying out experiments in the field of the so-called precise neutron optics (PNO), we have implemented specialmulti-purpose apparatus called the “PNO-apparatus” at JRR-3M. Making use of an Si triple-Laue (LLL) neutroninterferometer with the PNO-apparatus, we successfully determined the coherent neutron scattering lengths of galliumisotopes, 69Ga and 71Ga. The results are 8.053$0.013 fm for 69Ga and 6.170$0.011 fm for 71Ga, respectively. ( 1999Elsevier Science B.V. All rights reserved.
PACS: 03.75.D; 32.10.B
Keywords: Neutron interferometry; Coherent neutron scattering lengths ; Gallium isotopes
1. Introduction
Neutron scattering has been established as a veryimportant and powerful strategy for investigationsof both condensed matter and nuclear physics[1,2]. Consequently, neutron scattering length ofevery element and/or isotope is very important asa fundamental quantity which describes the charac-teristics of the interaction between neutrons andindividual nuclei. Their values have been tabulatedin the Koestner—Rauch—Seymann report [3], whichwere determined by various methods. More than 10
kinds of methods are briefly described in their re-port including the Bragg diffraction method [4],the Christiansen-filter method [5] and the trans-mission method [6]. Data on several elements arestill lacking and some of them can be determined ina much more accurate way. As indicated in thereport [3], no experimental values existed for 86isotopes, and around 70% of all the listed values,998 in all, were determined by methods havingpoor accuracies. Actually, more than half of 314coherent scattering lengths with error evaluationshad errors larger than 0.05 fm.
To obtain a higher accuracy, one of the mostpowerful methods is neutron interferometry, whichmakes use of a silicon perfect crystal interferometerwith a monolithic structure. The first perfect crystal
0168-9002/99/$ — see front matter ( 1999 Elsevier Science B.V. All rights reserved.PII: S 0 1 6 8 - 9 0 0 2 ( 9 8 ) 0 1 1 7 2 - 3
neutron interferometer experiment was reported in1974 by Rauch et al. [7] analogous to X-ray inter-ferometry realized by Bonse and Hart in 1965 [8].This perfect crystal interferometer was applied tovarious measurements [9—12], including the anom-alous dispersion in the X-ray region [13—15]. Thefirst application of the perfect crystal interferometerto the accurate determination of the coherent neu-tron scattering length of natural titanium withfour-figure accuracy was published in 1978 byBauspiess et al. [16], followed by measurements ofvarious gaseous elements [17]. Recently, Terburget al. successfully applied the perfect crystal inter-ferometer to the determination of the neutron scat-tering lengths of gaseous samples of krypton;natural Kr and 86Kr [18]. Ioffe et al. successfullyimproved the accuracy of the coherent scatteringlength of lead isotope 208Pb by one figure, makinguse of a very high quality perfect crystal inter-ferometer in combination with a specially designedanti-vibration system [19], that we become awareof during the preparation of the present experi-ment.
Recently, we have implemented special appar-atus given the name “PNO” at JRR-3M in JAERI,for multi-purpose in the experimental field of pre-cise neutron optics, which includes multi-crystalprecise neutron diffractometry, very small-angleneutron scattering (VSANS), neutron inter-ferometry, and neutron diffraction topography.Standing on the accomplishments at JRR-2 in thesefields [20—33], we designed the PNO-apparatusespecially keeping in mind that the PNO-apparatusshould work (i) for multi-purposes (ii) with thehighest precision, and (iii) in a stable environment.
In this paper, we describe the characteristics ofthe PNO-apparatus, which was installed at JRR-3M in JAERI. A neutron interferometer experimentwas performed with this apparatus, which success-fully showed the performance of our neutroninterferometry system. We have applied it to theaccurate determination of the coherent neutronscattering lengths of aluminum, niobium as stan-dard samples, natural gallium as a referencesample, as well as the gallium isotopes, 69Ga and71Ga. Both these isotopes, respectively, have onlyone datum in the literature [3,34] and seem to belacking in accuracy. A refinement of the measured
values for the gallium isotopes is discussed. Wedetermined that the values of the coherent neutronscattering lengths are 8.053$0.013 fm for 69Gaand 6.170$0.011 fm for 71Ga, respectively.
2. Neutron experiment with the PNO-apparatus atJRR-3M in JAERI
2.1. Characteristics of the PNO-apparatus
A special precise neutron optics (PNO) appar-atus was installed under the following design prin-ciples:
(i) The PNO-apparatus is desirable due to itsmulti-purposes, allowing many kinds of experi-ments in the field of the precise neutron optics to becarried out.
(ii) The PNO-apparatus should have highest pre-cision, so as to carry out those experiments withperfect crystals, for instance, with an angular pre-cision of 0.01 s of the arc.
(iii) The PNO-apparatus should be set in a high-stability environment, with a low background, con-stant temperature and anti-vibration, to be used forprecise experiments extending successfully for peri-ods longer than 24 h.
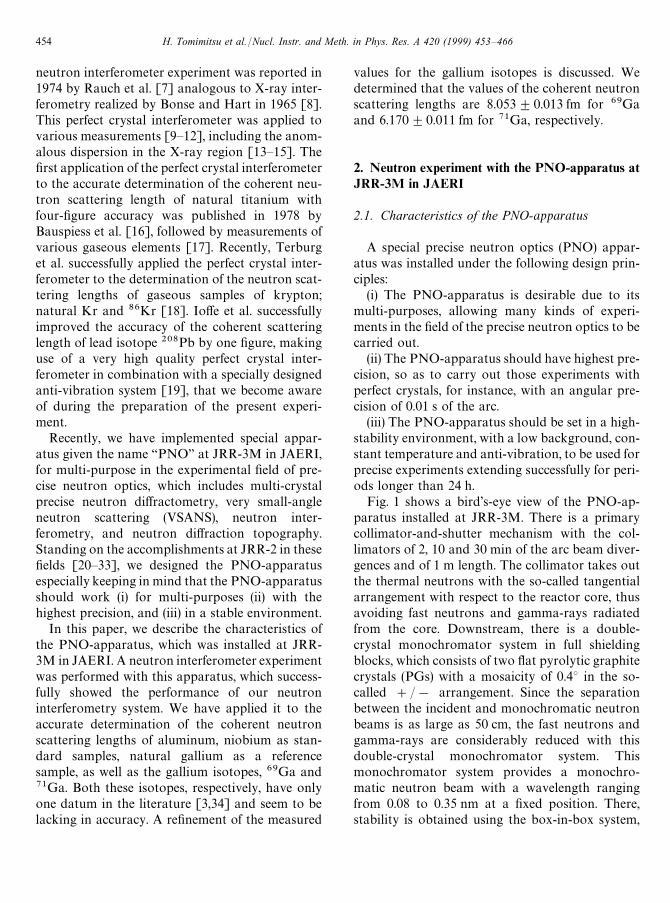
Fig. 1 shows a bird’s-eye view of the PNO-ap-paratus installed at JRR-3M. There is a primarycollimator-and-shutter mechanism with the col-limators of 2, 10 and 30 min of the arc beam diver-gences and of 1 m length. The collimator takes outthe thermal neutrons with the so-called tangentialarrangement with respect to the reactor core, thusavoiding fast neutrons and gamma-rays radiatedfrom the core. Downstream, there is a double-crystal monochromator system in full shieldingblocks, which consists of two flat pyrolytic graphitecrystals (PGs) with a mosaicity of 0.4° in the so-called #/! arrangement. Since the separationbetween the incident and monochromatic neutronbeams is as large as 50 cm, the fast neutrons andgamma-rays are considerably reduced with thisdouble-crystal monochromator system. Thismonochromator system provides a monochro-matic neutron beam with a wavelength rangingfrom 0.08 to 0.35 nm at a fixed position. There,stability is obtained using the box-in-box system,
454 H. Tomimitsu et al./Nucl. Instr. and Meth. in Phys. Res. A 420 (1999) 453—466
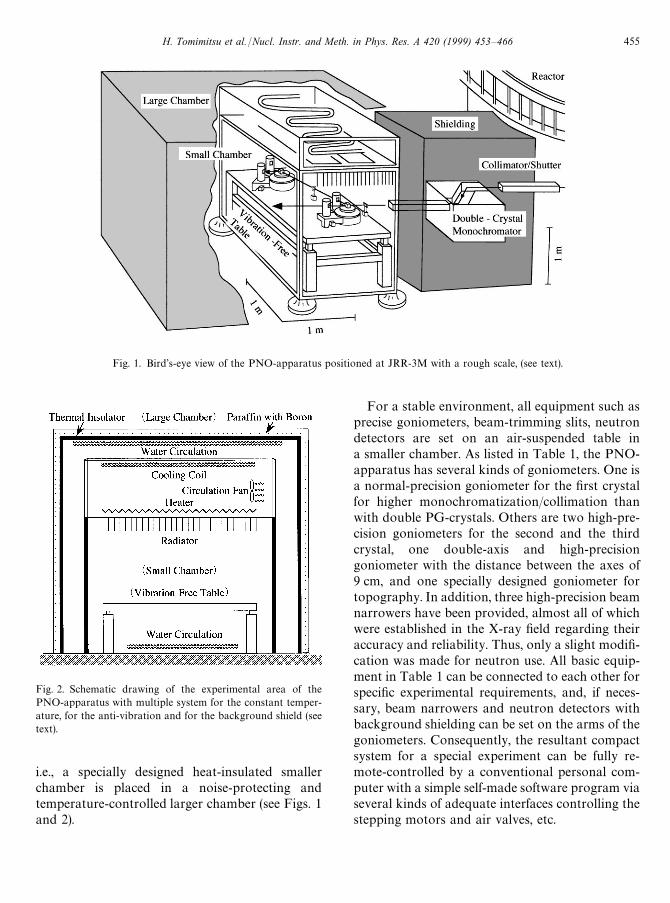
Fig. 1. Bird’s-eye view of the PNO-apparatus positioned at JRR-3M with a rough scale, (see text).
Fig. 2. Schematic drawing of the experimental area of thePNO-apparatus with multiple system for the constant temper-ature, for the anti-vibration and for the background shield (seetext).
i.e., a specially designed heat-insulated smallerchamber is placed in a noise-protecting andtemperature-controlled larger chamber (see Figs. 1and 2).
For a stable environment, all equipment such asprecise goniometers, beam-trimming slits, neutrondetectors are set on an air-suspended table ina smaller chamber. As listed in Table 1, the PNO-apparatus has several kinds of goniometers. One isa normal-precision goniometer for the first crystalfor higher monochromatization/collimation thanwith double PG-crystals. Others are two high-pre-cision goniometers for the second and the thirdcrystal, one double-axis and high-precisiongoniometer with the distance between the axes of9 cm, and one specially designed goniometer fortopography. In addition, three high-precision beamnarrowers have been provided, almost all of whichwere established in the X-ray field regarding theiraccuracy and reliability. Thus, only a slight modifi-cation was made for neutron use. All basic equip-ment in Table 1 can be connected to each other forspecific experimental requirements, and, if neces-sary, beam narrowers and neutron detectors withbackground shielding can be set on the arms of thegoniometers. Consequently, the resultant compactsystem for a special experiment can be fully re-mote-controlled by a conventional personal com-puter with a simple self-made software program viaseveral kinds of adequate interfaces controlling thestepping motors and air valves, etc.
H. Tomimitsu et al./Nucl. Instr. and Meth. in Phys. Res. A 420 (1999) 453—466 455
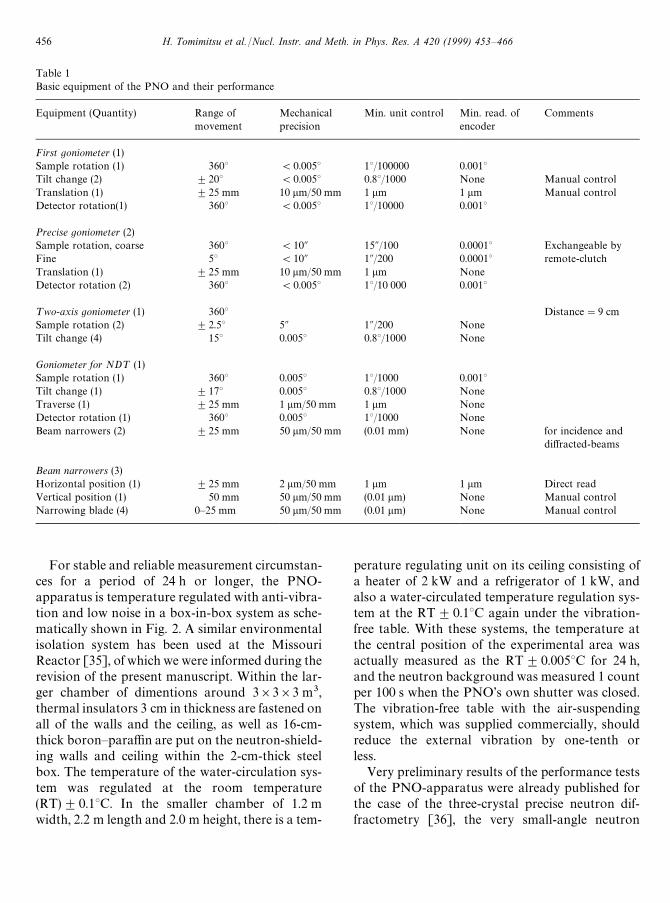
Table 1Basic equipment of the PNO and their performance
Equipment (Quantity) Range ofmovement
Mechanicalprecision
Min. unit control Min. read. ofencoder
Comments
First goniometer (1)Sample rotation (1) 360° (0.005° 1°/100000 0.001°Tilt change (2) $20° (0.005° 0.8°/1000 None Manual controlTranslation (1) $25 mm 10 lm/50 mm 1 lm 1 lm Manual controlDetector rotation(1) 360° (0.005° 1°/10000 0.001°
Precise goniometer (2)Sample rotation, coarse 360° (10A 15A/100 0.0001° Exchangeable byFine 5° (10A 1A/200 0.0001° remote-clutchTranslation (1) $25 mm 10 lm/50 mm 1 lm NoneDetector rotation (2) 360° (0.005° 1°/10 000 0.001°
¹wo-axis goniometer (1) 360° Distance"9 cmSample rotation (2) $2.5° 5A 1A/200 NoneTilt change (4) 15° 0.005° 0.8°/1000 None
Goniometer for ND¹ (1)Sample rotation (1) 360° 0.005° 1°/1000 0.001°Tilt change (1) $17° 0.005° 0.8°/1000 NoneTraverse (1) $25 mm 1 lm/50 mm 1 lm NoneDetector rotation (1) 360° 0.005° 1°/1000 NoneBeam narrowers (2) $25 mm 50 lm/50 mm (0.01 mm) None for incidence and
diffracted-beams
Beam narrowers (3)Horizontal position (1) $25 mm 2 lm/50 mm 1 lm 1 lm Direct readVertical position (1) 50 mm 50 lm/50 mm (0.01 lm) None Manual controlNarrowing blade (4) 0—25 mm 50 lm/50 mm (0.01 lm) None Manual control
For stable and reliable measurement circumstan-ces for a period of 24 h or longer, the PNO-apparatus is temperature regulated with anti-vibra-tion and low noise in a box-in-box system as sche-matically shown in Fig. 2. A similar environmentalisolation system has been used at the MissouriReactor [35], of which we were informed during therevision of the present manuscript. Within the lar-ger chamber of dimentions around 3]3]3 m3,thermal insulators 3 cm in thickness are fastened onall of the walls and the ceiling, as well as 16-cm-thick boron—paraffin are put on the neutron-shield-ing walls and ceiling within the 2-cm-thick steelbox. The temperature of the water-circulation sys-tem was regulated at the room temperature(RT)$0.1°C. In the smaller chamber of 1.2 mwidth, 2.2 m length and 2.0 m height, there is a tem-
perature regulating unit on its ceiling consisting ofa heater of 2 kW and a refrigerator of 1 kW, andalso a water-circulated temperature regulation sys-tem at the RT$0.1°C again under the vibration-free table. With these systems, the temperature atthe central position of the experimental area wasactually measured as the RT$0.005°C for 24 h,and the neutron background was measured 1 countper 100 s when the PNO’s own shutter was closed.The vibration-free table with the air-suspendingsystem, which was supplied commercially, shouldreduce the external vibration by one-tenth orless.
Very preliminary results of the performance testsof the PNO-apparatus were already published forthe case of the three-crystal precise neutron dif-fractometry [36], the very small-angle neutron
456 H. Tomimitsu et al./Nucl. Instr. and Meth. in Phys. Res. A 420 (1999) 453—466
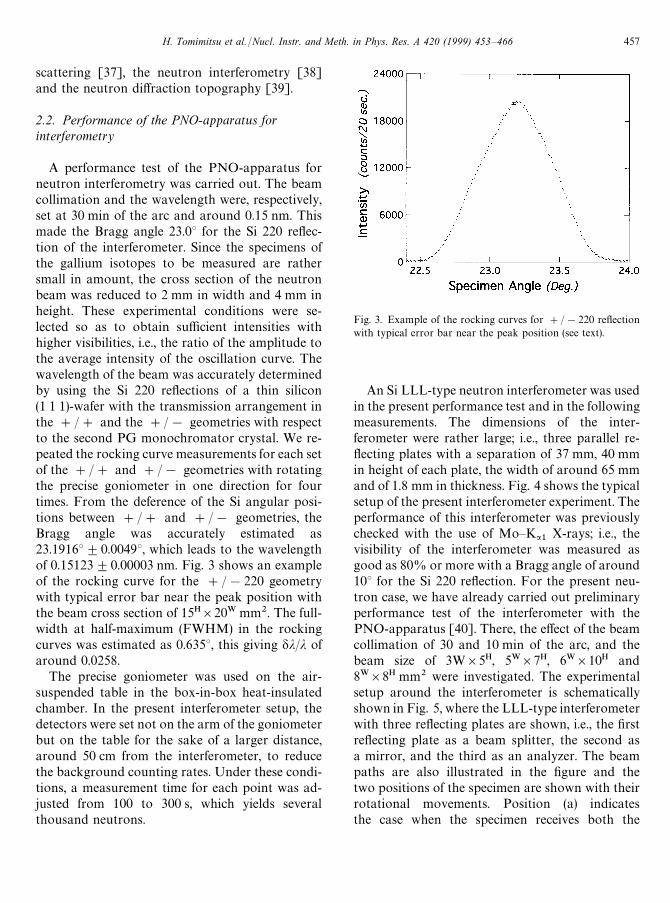
Fig. 3. Example of the rocking curves for #/!220 reflectionwith typical error bar near the peak position (see text).
scattering [37], the neutron interferometry [38]and the neutron diffraction topography [39].
2.2. Performance of the PNO-apparatus forinterferometry
A performance test of the PNO-apparatus forneutron interferometry was carried out. The beamcollimation and the wavelength were, respectively,set at 30 min of the arc and around 0.15 nm. Thismade the Bragg angle 23.0° for the Si 220 reflec-tion of the interferometer. Since the specimens ofthe gallium isotopes to be measured are rathersmall in amount, the cross section of the neutronbeam was reduced to 2 mm in width and 4 mm inheight. These experimental conditions were se-lected so as to obtain sufficient intensities withhigher visibilities, i.e., the ratio of the amplitude tothe average intensity of the oscillation curve. Thewavelength of the beam was accurately determinedby using the Si 220 reflections of a thin silicon(1 1 1)-wafer with the transmission arrangement inthe #/# and the #/! geometries with respectto the second PG monochromator crystal. We re-peated the rocking curve measurements for each setof the #/# and #/! geometries with rotatingthe precise goniometer in one direction for fourtimes. From the deference of the Si angular posi-tions between #/# and #/! geometries, theBragg angle was accurately estimated as23.1916°$0.0049°, which leads to the wavelengthof 0.15123$0.00003 nm. Fig. 3 shows an exampleof the rocking curve for the #/!220 geometrywith typical error bar near the peak position withthe beam cross section of 15H]20W mm2. The full-width at half-maximum (FWHM) in the rockingcurves was estimated as 0.635°, this giving dj/j ofaround 0.0258.
The precise goniometer was used on the air-suspended table in the box-in-box heat-insulatedchamber. In the present interferometer setup, thedetectors were set not on the arm of the goniometerbut on the table for the sake of a larger distance,around 50 cm from the interferometer, to reducethe background counting rates. Under these condi-tions, a measurement time for each point was ad-justed from 100 to 300 s, which yields severalthousand neutrons.
An Si LLL-type neutron interferometer was usedin the present performance test and in the followingmeasurements. The dimensions of the inter-ferometer were rather large; i.e., three parallel re-flecting plates with a separation of 37 mm, 40 mmin height of each plate, the width of around 65 mmand of 1.8 mm in thickness. Fig. 4 shows the typicalsetup of the present interferometer experiment. Theperformance of this interferometer was previouslychecked with the use of Mo—K
a1X-rays; i.e., the
visibility of the interferometer was measured asgood as 80% or more with a Bragg angle of around10° for the Si 220 reflection. For the present neu-tron case, we have already carried out preliminaryperformance test of the interferometer with thePNO-apparatus [40]. There, the effect of the beamcollimation of 30 and 10 min of the arc, and thebeam size of 3W]5H, 5W]7H, 6W]10H and8W]8H mm2 were investigated. The experimentalsetup around the interferometer is schematicallyshown in Fig. 5, where the LLL-type interferometerwith three reflecting plates are shown, i.e., the firstreflecting plate as a beam splitter, the second asa mirror, and the third as an analyzer. The beampaths are also illustrated in the figure and thetwo positions of the specimen are shown with theirrotational movements. Position (a) indicatesthe case when the specimen receives both the
H. Tomimitsu et al./Nucl. Instr. and Meth. in Phys. Res. A 420 (1999) 453—466 457

Fig. 4. Typical setup of the present interferometer experiment.In the figure, the LLL-type interferometer (IF) mounted ona precise goniometer (G), the incidence slit (IS), the referenceAl-plate sample (S) supported by a special smaller goniometer(SG) suspended above the interferometer and also a detector (D)on the goniometer arm can be seen. In the actual measurements,however, the detectors were set on the table apart around 50 cmfrom the interferometer to reduce the neutron background.
Fig. 5. Schematic drawing of the interferometer experimentwith the beam paths. (a) and (b) show the positions of samples tobe measured (see text).
transmitted and the reflected beams behind the firstreflecting plate, which is available for larger speci-mens. In contrast, position (b) corresponds to thecase of receiving only the transmitted beam, avail-able for smaller specimens.
To obtain the best results in the neutron inter-ferometry, higher visibility of the interference pat-tern is desired, especially for the present purpose ofdetermining the coherent scattering lengths withvery high accuracy. Thus, the interference patternsfor the O-beam, (cf. Fig. 5) with higher visibilitieshave more importance in most cases. We examinedthe visibility of the interference patterns whilechanging the beam position on the interferometer.In practice, the horizontal position of the beam was
scanned by traversing the interferometer itself andthe vertical one was by changing the level of thebeam narrower for the incidence neutron beam,both with the step of several mm. A parallel-sidedaluminum plate of 3 mm thickness was used asa phase shifter in the present characterization of theinterferometer. The Al-plate was set so as to receiveboth the transmitted and the reflected beams, asshown in the case of position (a) in Fig. 5. Typicalsinusoidal interference oscillations are shownin Fig. 6, where the upper circles were measuredon the H-beam behind the analyzer and lower dotson the O-beam, respectively; both being measuredat the same time with respective detectors, (cf.Fig. 5). They are mutually out of phase and
458 H. Tomimitsu et al./Nucl. Instr. and Meth. in Phys. Res. A 420 (1999) 453—466
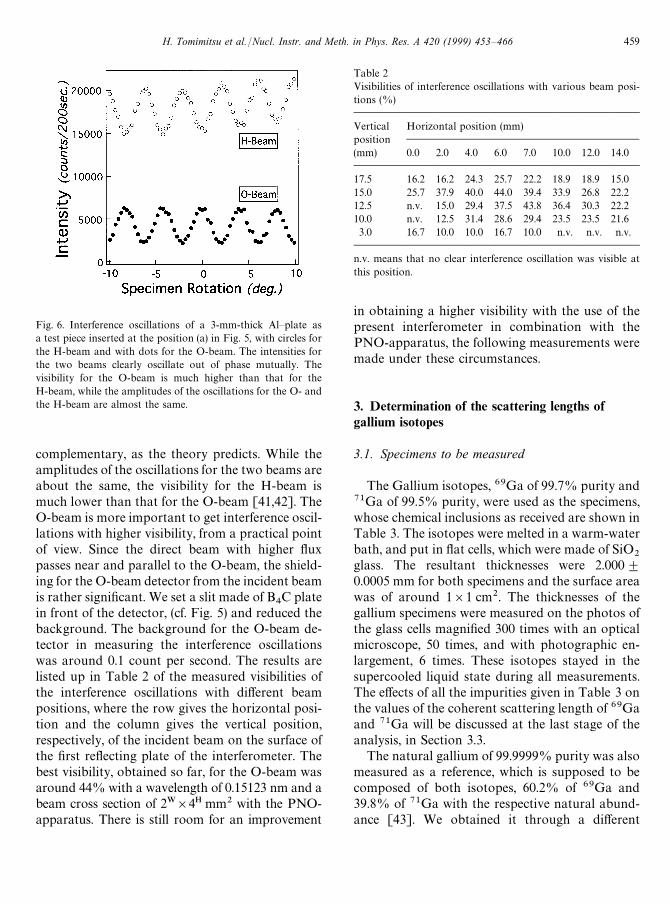
Fig. 6. Interference oscillations of a 3-mm-thick Al—plate asa test piece inserted at the position (a) in Fig. 5, with circles forthe H-beam and with dots for the O-beam. The intensities forthe two beams clearly oscillate out of phase mutually. Thevisibility for the O-beam is much higher than that for theH-beam, while the amplitudes of the oscillations for the O- andthe H-beam are almost the same.
Table 2Visibilities of interference oscillations with various beam posi-tions (%)
Vertical Horizontal position (mm)position(mm) 0.0 2.0 4.0 6.0 7.0 10.0 12.0 14.0
17.5 16.2 16.2 24.3 25.7 22.2 18.9 18.9 15.015.0 25.7 37.9 40.0 44.0 39.4 33.9 26.8 22.212.5 n.v. 15.0 29.4 37.5 43.8 36.4 30.3 22.210.0 n.v. 12.5 31.4 28.6 29.4 23.5 23.5 21.63.0 16.7 10.0 10.0 16.7 10.0 n.v. n.v. n.v.
n.v. means that no clear interference oscillation was visible atthis position.
complementary, as the theory predicts. While theamplitudes of the oscillations for the two beams areabout the same, the visibility for the H-beam ismuch lower than that for the O-beam [41,42]. TheO-beam is more important to get interference oscil-lations with higher visibility, from a practical pointof view. Since the direct beam with higher fluxpasses near and parallel to the O-beam, the shield-ing for the O-beam detector from the incident beamis rather significant. We set a slit made of B
4C plate
in front of the detector, (cf. Fig. 5) and reduced thebackground. The background for the O-beam de-tector in measuring the interference oscillationswas around 0.1 count per second. The results arelisted up in Table 2 of the measured visibilities ofthe interference oscillations with different beampositions, where the row gives the horizontal posi-tion and the column gives the vertical position,respectively, of the incident beam on the surface ofthe first reflecting plate of the interferometer. Thebest visibility, obtained so far, for the O-beam wasaround 44% with a wavelength of 0.15123 nm and abeam cross section of 2W]4H mm2 with the PNO-apparatus. There is still room for an improvement
in obtaining a higher visibility with the use of thepresent interferometer in combination with thePNO-apparatus, the following measurements weremade under these circumstances.
3. Determination of the scattering lengths ofgallium isotopes
3.1. Specimens to be measured
The Gallium isotopes, 69Ga of 99.7% purity and71Ga of 99.5% purity, were used as the specimens,whose chemical inclusions as received are shown inTable 3. The isotopes were melted in a warm-waterbath, and put in flat cells, which were made of SiO
2glass. The resultant thicknesses were 2.000$0.0005 mm for both specimens and the surface areawas of around 1]1 cm2. The thicknesses of thegallium specimens were measured on the photos ofthe glass cells magnified 300 times with an opticalmicroscope, 50 times, and with photographic en-largement, 6 times. These isotopes stayed in thesupercooled liquid state during all measurements.The effects of all the impurities given in Table 3 onthe values of the coherent scattering length of 69Gaand 71Ga will be discussed at the last stage of theanalysis, in Section 3.3.
The natural gallium of 99.9999% purity was alsomeasured as a reference, which is supposed to becomposed of both isotopes, 60.2% of 69Ga and39.8% of 71Ga with the respective natural abund-ance [43]. We obtained it through a different
H. Tomimitsu et al./Nucl. Instr. and Meth. in Phys. Res. A 420 (1999) 453—466 459
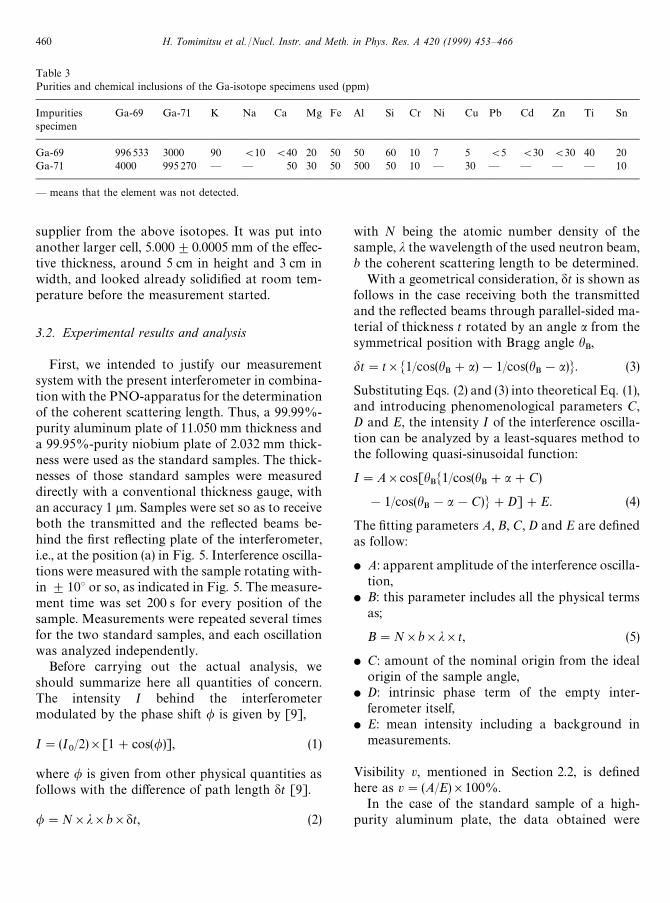
Table 3Purities and chemical inclusions of the Ga-isotope specimens used (ppm)
Impuritiesspecimen
Ga-69 Ga-71 K Na Ca Mg Fe Al Si Cr Ni Cu Pb Cd Zn Ti Sn
Ga-69 996533 3000 90 (10 (40 20 50 50 60 10 7 5 (5 (30 (30 40 20Ga-71 4000 995270 — — 50 30 50 500 50 10 — 30 — — — — 10
— means that the element was not detected.
supplier from the above isotopes. It was put intoanother larger cell, 5.000$0.0005 mm of the effec-tive thickness, around 5 cm in height and 3 cm inwidth, and looked already solidified at room tem-perature before the measurement started.
3.2. Experimental results and analysis
First, we intended to justify our measurementsystem with the present interferometer in combina-tion with the PNO-apparatus for the determinationof the coherent scattering length. Thus, a 99.99%-purity aluminum plate of 11.050 mm thickness anda 99.95%-purity niobium plate of 2.032 mm thick-ness were used as the standard samples. The thick-nesses of those standard samples were measureddirectly with a conventional thickness gauge, withan accuracy 1 lm. Samples were set so as to receiveboth the transmitted and the reflected beams be-hind the first reflecting plate of the interferometer,i.e., at the position (a) in Fig. 5. Interference oscilla-tions were measured with the sample rotating with-in $10° or so, as indicated in Fig. 5. The measure-ment time was set 200 s for every position of thesample. Measurements were repeated several timesfor the two standard samples, and each oscillationwas analyzed independently.
Before carrying out the actual analysis, weshould summarize here all quantities of concern.The intensity I behind the interferometermodulated by the phase shift / is given by [9],
I"(I0/2)][1#cos(/)], (1)
where / is given from other physical quantities asfollows with the difference of path length dt [9].
/"N]j]b]dt, (2)
with N being the atomic number density of thesample, j the wavelength of the used neutron beam,b the coherent scattering length to be determined.
With a geometrical consideration, dt is shown asfollows in the case receiving both the transmittedand the reflected beams through parallel-sided ma-terial of thickness t rotated by an angle a from thesymmetrical position with Bragg angle h
B,
dt"t]M1/cos(hB#a)!1/cos(h
B!a)N. (3)
Substituting Eqs. (2) and (3) into theoretical Eq. (1),and introducing phenomenological parameters C,D and E, the intensity I of the interference oscilla-tion can be analyzed by a least-squares method tothe following quasi-sinusoidal function:
I"A]cos[hBM1/cos(h
B#a#C)
!1/cos(hB!a!C)N#D]#E. (4)
The fitting parameters A, B, C, D and E are definedas follow:
f A: apparent amplitude of the interference oscilla-tion,
f B: this parameter includes all the physical termsas;
B"N]b]j]t, (5)
f C: amount of the nominal origin from the idealorigin of the sample angle,
f D: intrinsic phase term of the empty inter-ferometer itself,
f E: mean intensity including a background inmeasurements.
Visibility v, mentioned in Section 2.2, is definedhere as v"(A/E)]100%.
In the case of the standard sample of a high-purity aluminum plate, the data obtained were
460 H. Tomimitsu et al./Nucl. Instr. and Meth. in Phys. Res. A 420 (1999) 453—466
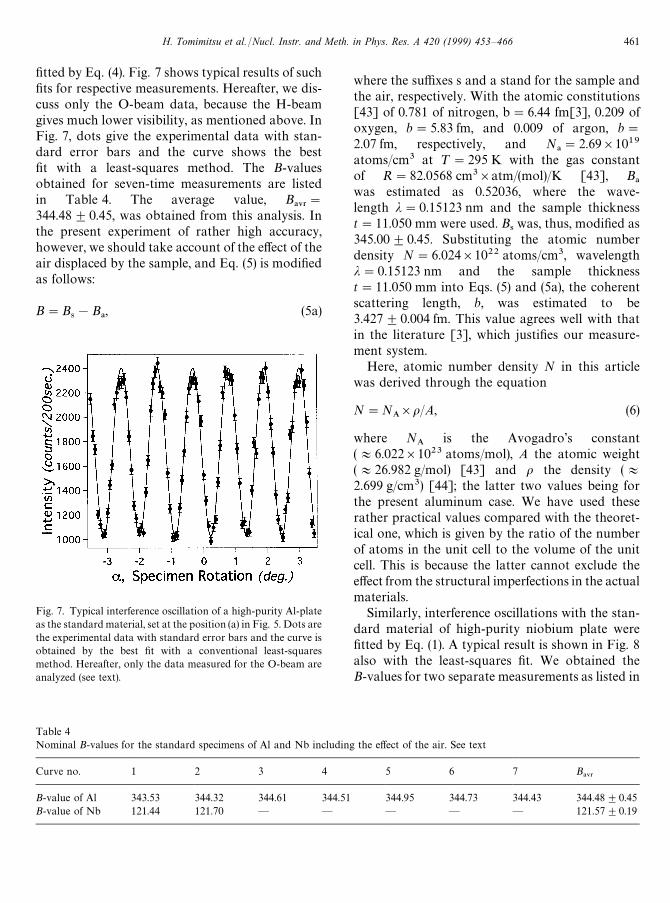
Fig. 7. Typical interference oscillation of a high-purity Al-plateas the standard material, set at the position (a) in Fig. 5. Dots arethe experimental data with standard error bars and the curve isobtained by the best fit with a conventional least-squaresmethod. Hereafter, only the data measured for the O-beam areanalyzed (see text).
Table 4Nominal B-values for the standard specimens of Al and Nb including the effect of the air. See text
Curve no. 1 2 3 4 5 6 7 B!73
B-value of Al 343.53 344.32 344.61 344.51 344.95 344.73 344.43 344.48$0.45B-value of Nb 121.44 121.70 — — — — — 121.57$0.19
fitted by Eq. (4). Fig. 7 shows typical results of suchfits for respective measurements. Hereafter, we dis-cuss only the O-beam data, because the H-beamgives much lower visibility, as mentioned above. InFig. 7, dots give the experimental data with stan-dard error bars and the curve shows the bestfit with a least-squares method. The B-valuesobtained for seven-time measurements are listedin Table 4. The average value, B
!73"
344.48$0.45, was obtained from this analysis. Inthe present experiment of rather high accuracy,however, we should take account of the effect of theair displaced by the sample, and Eq. (5) is modifiedas follows:
B"B4!B
!, (5a)
where the suffixes s and a stand for the sample andthe air, respectively. With the atomic constitutions[43] of 0.781 of nitrogen, b"6.44 fm[3], 0.209 ofoxygen, b"5.83 fm, and 0.009 of argon, b"2.07 fm, respectively, and N
!"2.69]1019
atoms/cm3 at ¹"295 K with the gas constantof R"82.0568 cm3]atm/(mol)/K [43], B
!was estimated as 0.52036, where the wave-length j"0.15123 nm and the sample thicknesst"11.050 mm were used. B
4was, thus, modified as
345.00$0.45. Substituting the atomic numberdensity N"6.024]1022 atoms/cm3, wavelengthj"0.15123 nm and the sample thicknesst"11.050 mm into Eqs. (5) and (5a), the coherentscattering length, b, was estimated to be3.427$0.004 fm. This value agrees well with thatin the literature [3], which justifies our measure-ment system.
Here, atomic number density N in this articlewas derived through the equation
N"NA]o/A, (6)
where NA
is the Avogadro’s constant(+6.022]1023 atoms/mol), A the atomic weight(+26.982 g/mol) [43] and o the density (+2.699 g/cm3) [44]; the latter two values being forthe present aluminum case. We have used theserather practical values compared with the theoret-ical one, which is given by the ratio of the numberof atoms in the unit cell to the volume of the unitcell. This is because the latter cannot exclude theeffect from the structural imperfections in the actualmaterials.
Similarly, interference oscillations with the stan-dard material of high-purity niobium plate werefitted by Eq. (1). A typical result is shown in Fig. 8also with the least-squares fit. We obtained theB-values for two separate measurements as listed in
H. Tomimitsu et al./Nucl. Instr. and Meth. in Phys. Res. A 420 (1999) 453—466 461
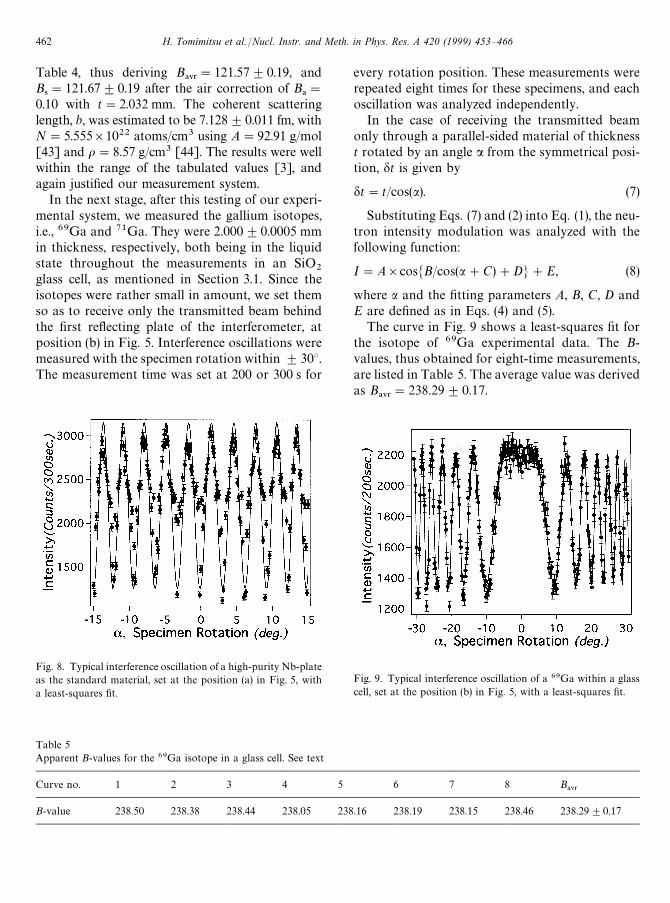
Fig. 8. Typical interference oscillation of a high-purity Nb-plateas the standard material, set at the position (a) in Fig. 5, witha least-squares fit.
Fig. 9. Typical interference oscillation of a 69Ga within a glasscell, set at the position (b) in Fig. 5, with a least-squares fit.
Table 5Apparent B-values for the 69Ga isotope in a glass cell. See text
Curve no. 1 2 3 4 5 6 7 8 B!73
B-value 238.50 238.38 238.44 238.05 238.16 238.19 238.15 238.46 238.29$0.17
Table 4, thus deriving B!73
"121.57$0.19, andB4"121.67$0.19 after the air correction of B
!"
0.10 with t"2.032 mm. The coherent scatteringlength, b, was estimated to be 7.128$0.011 fm, withN"5.555]1022 atoms/cm3 using A"92.91 g/mol[43] and o"8.57 g/cm3 [44]. The results were wellwithin the range of the tabulated values [3], andagain justified our measurement system.
In the next stage, after this testing of our experi-mental system, we measured the gallium isotopes,i.e., 69Ga and 71Ga. They were 2.000$0.0005 mmin thickness, respectively, both being in the liquidstate throughout the measurements in an SiO
2glass cell, as mentioned in Section 3.1. Since theisotopes were rather small in amount, we set themso as to receive only the transmitted beam behindthe first reflecting plate of the interferometer, atposition (b) in Fig. 5. Interference oscillations weremeasured with the specimen rotation within $30°.The measurement time was set at 200 or 300 s for
every rotation position. These measurements wererepeated eight times for these specimens, and eachoscillation was analyzed independently.
In the case of receiving the transmitted beamonly through a parallel-sided material of thicknesst rotated by an angle a from the symmetrical posi-tion, dt is given by
dt"t/cos(a). (7)
Substituting Eqs. (7) and (2) into Eq. (1), the neu-tron intensity modulation was analyzed with thefollowing function:
I"A]cosMB/cos(a#C)#DN#E, (8)
where a and the fitting parameters A, B, C, D andE are defined as in Eqs. (4) and (5).
The curve in Fig. 9 shows a least-squares fit forthe isotope of 69Ga experimental data. The B-values, thus obtained for eight-time measurements,are listed in Table 5. The average value was derivedas B
!73"238.29$0.17.
462 H. Tomimitsu et al./Nucl. Instr. and Meth. in Phys. Res. A 420 (1999) 453—466
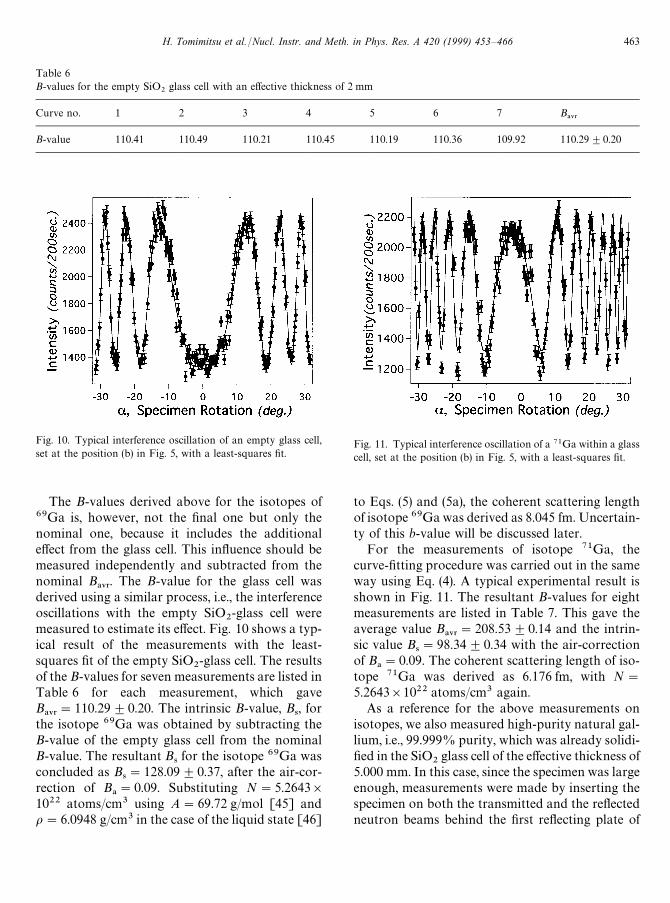
Table 6B-values for the empty SiO
2glass cell with an effective thickness of 2 mm
Curve no. 1 2 3 4 5 6 7 B!73
B-value 110.41 110.49 110.21 110.45 110.19 110.36 109.92 110.29$0.20
Fig. 10. Typical interference oscillation of an empty glass cell,set at the position (b) in Fig. 5, with a least-squares fit.
Fig. 11. Typical interference oscillation of a 71Ga within a glasscell, set at the position (b) in Fig. 5, with a least-squares fit.
The B-values derived above for the isotopes of69Ga is, however, not the final one but only thenominal one, because it includes the additionaleffect from the glass cell. This influence should bemeasured independently and subtracted from thenominal B
!73. The B-value for the glass cell was
derived using a similar process, i.e., the interferenceoscillations with the empty SiO
2-glass cell were
measured to estimate its effect. Fig. 10 shows a typ-ical result of the measurements with the least-squares fit of the empty SiO
2-glass cell. The results
of the B-values for seven measurements are listed inTable 6 for each measurement, which gaveB!73
"110.29$0.20. The intrinsic B-value, B4, for
the isotope 69Ga was obtained by subtracting theB-value of the empty glass cell from the nominalB-value. The resultant B
4for the isotope 69Ga was
concluded as B4"128.09$0.37, after the air-cor-
rection of B!"0.09. Substituting N"5.2643]
1022 atoms/cm3 using A"69.72 g/mol [45] ando"6.0948 g/cm3 in the case of the liquid state [46]
to Eqs. (5) and (5a), the coherent scattering lengthof isotope 69Ga was derived as 8.045 fm. Uncertain-ty of this b-value will be discussed later.
For the measurements of isotope 71Ga, thecurve-fitting procedure was carried out in the sameway using Eq. (4). A typical experimental result isshown in Fig. 11. The resultant B-values for eightmeasurements are listed in Table 7. This gave theaverage value B
!73"208.53$0.14 and the intrin-
sic value B4"98.34$0.34 with the air-correction
of B!"0.09. The coherent scattering length of iso-
tope 71Ga was derived as 6.176 fm, with N"
5.2643]1022 atoms/cm3 again.As a reference for the above measurements on
isotopes, we also measured high-purity natural gal-lium, i.e., 99.999% purity, which was already solidi-fied in the SiO
2glass cell of the effective thickness of
5.000 mm. In this case, since the specimen was largeenough, measurements were made by inserting thespecimen on both the transmitted and the reflectedneutron beams behind the first reflecting plate of
H. Tomimitsu et al./Nucl. Instr. and Meth. in Phys. Res. A 420 (1999) 453—466 463

Table 7Apparent B-values for the 71Ga isotope in a glass cell
Curve no. 1 2 3 4 5 6 7 8 B!73
B-value 208.82 208.55 208.34 208.60 208.41 208.47 208.51 208.54 208.53$0.14
Fig. 12. Typical interference oscillation of a high-purity naturalgallium sample within a glass cell, measured for the reference atthe position (a) in Fig. 5, with a least-squares fit.
Table 8Apparent B-values for the high-purity natural gallium in a glasscell
Curve no. 1 2 3 B!73
B-value 388.38 387.92 388.56 388.29$0.33
the interferometer, at position (a) in Fig. 5. A typi-cal result is shown in Fig. 12, with the least-squaresfit of the experimental data. The B-values for threemeasurements are listed in Table 8, with the aver-aged value B
!73"388.29$0.33, which gave the
intrinsic value B4"278.24$0.53 with the air-cor-
rection of B!"0.24 with the sample thickness of
5.000 mm. The coherent scattering length of thisnatural gallium was derived as 7.212$0.014 fm,with N"5.102]1022 atoms/cm3 using A"
69.72 g/mol [43] and o"5.907 g/cm3 in the caseof the solid state [46]. In this case of highly purenatural gallium, the impurities are supposed tohave less effects on the results. The results agreedwell with the tabulated values [3], (cf. Table 9).
3.3. Refinement of the b-values derived
In the following, the final values of the scatteringlength that we call “the b-values” in this section,
were determined in four significant figures, becausethe B-value derived, the atomic weight in the tableand the specimen thickness measured are known tofour figures or less.
As the first stage, we refine the b-values of thegallium isotopes, by taking the effect of the impu-rities into account (cf. Table 3). The total effects ofthe “pure” impurities, except for the isotopic mu-tual contamination of 69Ga and 71Ga, were esti-mated as 0.002 fm for 69Ga and 0.003 fm for 71Ga,respectively, making use of the tabulated b-valuesof the impurity atoms [3]. Accordingly, the b-values were slightly modified to be 8.043 and6.173 fm for 69Ga and 71Ga, respectively.
As the next step, the effect of the isotopic mutualcontamination was resolved by solving a simple setof the linear equations with two variables as fol-lows:
0.9965]b69#0.0030]b71"8.043, (9a)
0.0040]b69#0.9953]b71"6.173, (9b)
with the coefficients from Table 3. The two vari-ables of b69 and b71 mean the final b-values to bedetermined here for 69Ga and 71Ga, respectively,and both right-hand side members are the b-valuesjust obtained. The b-values for the two isotopeswere finally determined as b69"8.053 fm, andb71"6.170 fm, respectively.
The former is larger by about 2% and the latteris less by about 4% compared to the tabulatedvalues [3]. It is meaningful to compare the b-values
464 H. Tomimitsu et al./Nucl. Instr. and Meth. in Phys. Res. A 420 (1999) 453—466

Table 9Summary of the coherent scattering lengths, b, of gallium iso-topes and reference samples measured, comparing with thetabulated values
Specimen b (derived, fm) b (Table, fm)!
Al 3.427$0.004 3.44—3.445Nb 7.128$0.011 6.9—7.14
Ga (natural) 7.212$0.014 7.2—7.288
69Ga 8.053$0.013 7.8871Ga 6.170$0.011 6.40Ga-reconstr 7.304" (7.29#)
!Values were cited from the Ref. [2], except for the last one." This was made using the b-values derived in the present studyof the isotopes of 69Ga and 71Ga, according to the ratio of theirnatural abundance.# This was made in a similar way as the above using the tablevalues for 69Ga and 71Ga.
for two kinds of “natural” gallium. One is the valueof 7.212 fm really measured in this experiment forthe reference. Another is the “virtual” value of7.304 fm, which is reconstructed by summing up thetwo b-values of 69Ga and 71Ga derived in thepresent study by taking their natural abundanceinto account. The latter is around 101.3% of theformer, and seems to agree well with that similarlyreconstructed using the tabulated values, 7.29 fm,(cf. Table 9) assuming atom densities are the samefor 69Ga and 71Ga.
In the final stage, we estimated the uncertaintiesof the b-values determined above. Uncertainties ofthe Avogadro constant, the density and thewavelength are so small compared to others thatthey can be neglected. For the sake of a reasonableestimation of other uncertainties, we explicitlytreated B
4-value as B
4"B
0(1$b), the atomic
number density as N"N0(1$l) and the thickness
as t"t0(1$q), where, for example, B
0means the
main B4-value derived so far in Section 3.2 and
b means the ratio of the ambiguity of the B4-value
to B0, and so on. From Eq. (5), Eqs. (5a) and (6),
the ambiguity of the b-value, db, can be written,then, as db"b
0(b#l#q). In the present analysis,
these errors can be estimated for both iso-topes, q"dt/t
0"0.0005/2.000"0.00025 and l"
(dNA/N
A#do/o#dA/A)+0.005/69.72"0.00007.
As b is equal to 0.0013 in the case of 69Ga, db/b0
was estimated as 0.0016. Since b equals 0.0015 inthe 71Ga case, on the other hand, db/b
0was esti-
mated as 0.0018. Accordingly, we conclude the finalb-values as follows: b"8.053$0.013 fm for 69Ga,and b"6.170$0.011 fm for 71Ga, respectively.
4. Summary
We installed a special apparatus “PNO” atJRR-3M, for experiments in the field of preciseneutron optics. These include multi-crystal preciseneutron diffractometry, very small-angle neutronscattering, neutron interferometry and neutron dif-fraction topography. Making use of the PNO-ap-paratus with an Si LLL-type neutron inter-ferometer, the derived coherent neutron scatteringlengths of aluminum and niobium as standard sam-ples agreed well with those in the literature, which
justified our measurement system. We then deter-mined the coherent neutron scattering lengths ofthe gallium isotopes of 69Ga and 71Ga indepen-dently with higher accuracy than before. Theirvalues were determined to four significant figures,with the uncertainties of around 0.4%.
They were improved by one figure and differedsignificantly from the tabulated values obtained byother methods [34]. The results derived in thepresent experiment are summarized in Table 9 withthe previously given tabulated values [3].
Acknowledgements
The authors would like to express their thanks tothe crew of JRR-3M in JAERI for their excellentoperation.
References
[1] Proc. Yamada Conf. XLI on Neutron Scattering, PhysicaB 213 and 214 (1994).
[2] S. Igarashi (Ed.), Proc. Int. Conf. Nuclear Data for Scienceand Technology, 1988.
[3] L. Koester, H. Rauch, E. Seymann, Atom. Data Nucl.Data Tables 49 (1991) 65.
[4] C.G. Shull, E.O. Wollan, Phys. Rev. 81 (1951) 527.
H. Tomimitsu et al./Nucl. Instr. and Meth. in Phys. Res. A 420 (1999) 453—466 465

[5] L. Koester, K. Knop, Z. Naturforsch. Teil A 26 (1971)391.
[6] W. Waschkowski, L. Koester, Z. Naturforsch. A 31 (1976)115.
[7] H. Rauch, W. Treimer, U. Bonse, Phys. Lett. 47A (1974)369.
[8] U. Bonse, M. Hart, Appl. Phys. Lett. 6 (1965) 154.[9] H. Rauch, D. Petrascheck, in: H. Dachs (Ed.), Neutron
Diffraction, Current Physics, vol. 6, Springer, New York,1978, pp. 303—351.
[10] U. Bonse, H. Rauch (Eds.), Neutron Interferometry,Clarendon, Oxford, 1979.
[11] A.G. Klein, S.A. Werner, Rep. Progr. Phys. 46 (1983) 259.[12] G. Badurek, H. Rauch, A. Zeilinger, Matter Wave Inter-
ferometry Physica B 151 (1988).[13] M. Hart, Proc. Roy. Soc. A 346 (1975) 1.[14] U. Bonse, G. Materlik, Acta Crystallogr. A 31 (1975)
232.[15] M. Hart, D.P. Siddons, Proc. Roy. Soc. London A 376
(1981) 465.[16] W. Bauspiess, U. Bonse, H. Rauch, Nucl. Instr. and Meth.
157 (1978) 495.[17] H. Kaiser, H. Rauch, G. Badurek, W. Bauspiess, U. Bonse,
Z. Phys. A 291 (1979) 231.[18] B.P. Terburg, P. Verkerk, E. Jericha, M. Zawisky, Nucl.
Instr. and Meth. A 324 (1993) 247.[19] A. Ioffe, P. Lukas, P. Mikula, M. Vrana, V. Zabiyakin, Z.
Phys. A 348 (1994) 243.[20] S. Kikuta, I. Ishikawa, K. Kohra, S. Hosoya, J. Phys. Soc.
Japan 39 (1975) 471.[21] H. Tomimitsu, K. Kamada, K. Doi, Philos. Mag. 38 (1978)
483.[22] T. Takahashi, H. Tomimitsu, Y. Ushigami, S. Kikuta, K.
Doi, Jpn. J. Appl. Phys. 20 (1981) L837.[23] H. Tomimitsu, Philos. Mag. 43 (1981) 469.[24] H. Tomimitsu, K. Doi, K. Kamada, Physica 120B (1983)
96.[25] T. Takahashi, H. Tomimitsu, Y. Ushigami, S. Kikuta, K.
Doi, Physica 120B (1983) 362.[26] T. Takahashi, E. Granzer, H. Tomimitsu, S. Kikuta, K.
Doi, Jpn. J. Appl. Phys. 24 (1985) L218.
[27] T. Takahashi, E. Granzer, H. Tomimitsu, S. Kikuta, K.Doi, Jpn. J. Appl. Phys. 24 (1985) L650.
[28] H. Tomimitsu, T. Takahashi, S. Kikuta, K. Doi, J. Non-Cryst. Solids 88 (1986) 388.
[29] S. Kikuta, T. Takahashi, K. Nakayama, Y. Fujii, S.Hosoya, J. Phys. Soc. Japan 45 (1987) 715.
[30] S. Kikuta, T. Takahashi, K. Nakayama, Y. Fujii, S.Hosoya, J. Phys. Soc. Japan 46 (1987) 1024.
[31] S. Nakatani, Y. Hasegawa, H. Tomimitsu, T. Takahashi, S.Kikuta, Jpn. J. Appl. Phys. 30 (1991) L867.
[32] S. Nakatani, H. Tomimitsu, T. Takahashi, S. Kikuta, Jpn.J. Appl. Phys. 31 (1992) L1137.
[33] S. Nakatani, T. Takahashi, H. Tomimitsu, S. Kikuta, J.Phys. Soc. Japan 65 (Suppl.A) (1996) 77.
[34] L. Koester, K. Knop, W. Waschkowski, A. Kluever, Z.Phys. A 318 (1984) 347.
[35] S.A. Werner, J.-L. Staudenmann, R. Colella, A.W. Over-hauser, in: U. Bonse, H. Rauch (Eds.), Neutron Inter-ferometry, Clarendon, Oxford, 1979, p. 209.
[36] H. Funahashi, K. Aizawa, T. Ebisawa, M. Hashimoto, Y.Otake, T. Takahashi, S. Tasaki, H. Tomimitsu, JAERI-CONF 2, vol. 2 1993 p. 723.
[37] K. Aizawa, H. Tomimitsu, Physica B 213&214 (1995) 884.[38] H. Tomimitsu, K. Aizawa, Y. Hasegawa, S. Kikuta,
JAERI-CONF 2, vol. 2, 1993, p. 752.[39] H. Tomimitsu, K. Iijima, K. Aizawa, A. Yoshinari, Physica
B 213&214 (1995) 818.[40] H. Tomimitsu, Y. Hasegawa, K. Aizawa, S. Kikuta,
Physica B 213&214 (1995) 836.[41] H. Rauch, W. Treimer, U. Bonse, Phys. Lett. A 47 (1974)
369.[42] J.-L. Staudenmann, S.A. Werner, R. Colella, A.W. Over-
hauser, Phys. Rev. Lett. 21 (1980) 1419.[43] Encyclopedia of Science and Technology, 8th ed.,
McGraw-Hill, New York, 1997.[44] International Tables for X-Ray Crystallography, vol. 3,
1968.[45] Scientific Encyclopedia, 6th ed., van Nostrand, Princeton,
NJ, 1983.[46] C. Hampel (Ed.), Rare Metals Hand Book, 2nd ed., Rein-
hold, New York, 1961.
466 H. Tomimitsu et al./Nucl. Instr. and Meth. in Phys. Res. A 420 (1999) 453—466