determination of nitrobenzenes and nitrochlorobenzenes in water samples using dispersive...
TRANSCRIPT
Dynamic Article LinksC<AnalyticalMethods
Cite this: Anal. Methods, 2011, 3, 2254
www.rsc.org/methods PAPER
Publ
ishe
d on
26
Aug
ust 2
011.
Dow
nloa
ded
by U
nive
rsity
of
Win
dsor
on
25/1
0/20
14 0
5:31
:22.
View Article Online / Journal Homepage / Table of Contents for this issue
Determination of nitrobenzenes and nitrochlorobenzenes in water samplesusing dispersive liquid-liquid microextraction and gas chromatography-massspectrometry
Delin Zhang,ab Xiangying Zeng,a Zhiqiang Yu,*a Guoying Shenga and Jiamo Fua
Received 26th January 2011, Accepted 1st July 2011
DOI: 10.1039/c1ay05044c
A rapid and sensitive method was developed for the determination of eight nitrobenzenes and four
nitrochlorobenzenes in water. The method is based on dispersive liquid-liquid microextraction
(DLLME) followed by gas chromatography-mass spectrometry (GC-MS). The key factors influencing
the extraction efficiencies, including the nature and volume of the extraction and dispersion solvent and
the ratios of the extraction solvent and dispersion solvent were examined and optimized. Under the
optimized conditions, the method yields a linear correlation at a concentration range of 0.5 mg L�1–
500.0 mg L�1 for all the target analytes with correlation coefficients (R2) of 0.9915 to 1.0000, and relative
standard deviations (RSD, n¼ 6) of between 4.9% and 8.2%, depending on the compound analysed. In
addition, good pre-concentration factors of 243 to 525 for each specific compound were achieved.
These results suggest that the method presented herein is a rapid and powerful microextraction
technique that is useful for the detection of these organic pollutants in water samples and is suitable for
emergency monitoring.
Introduction
Nitrobenzene and nitrochlorobenzene compounds (NBs, NCBs,
Table 1) are a group of chemicals that are usually used in the
chemical industry in the preparation of dyes, perfumes, synthetic
resins, pesticides, and drugs.1 Of these compounds, 2-NCB and
4-NCB are possible human carcinogens that are produced in high
volume worldwide. Jones et al. also found that hemoglobin
adduct levels resulting from exposure to 2-NCB and 4-NCB in
occupational workers were much higher than those detected
from control workers, and that this was associated with fatigue,
eye irritation, splenomegaly, and cardiovascular effects.1 These
compounds can enter into the aquatic environment via waste-
water discharge, causing pollution of surface water. It has also
been reported that the total concentration of 10 nitrobenzenes
(NB, 2-NT 3-NT, 4-NT, 3-NCB, 4-NCB, 2-NCB, 2,6-DNT, 2,4-
DNT, 2,4-DNCB) in the Yellow River ranged from 0.269 to
9.052 mg L�1, with NB, 4-NCB and 2-NCB being the predomi-
nant contaminants.2 Kang et al. detected 12.32 mg L�1 and 17.82
mg L�1 of NB in the Guanting Reservoir and the Yongding River,
respectively.3
aState Key Laboratory of Organic Geochemistry, Guangdong ProvincialKey Laboratory of Utilization and Protection of Environmental resource,Guangzhou Institute of Geochemistry, Chinese Academy of Sciences,Guangzhou, 510640, China. E-mail: [email protected] School of the Chinese Academy of Sciences, Beijing, 100039,China
2254 | Anal. Methods, 2011, 3, 2254–2260
Several methods have been used successfully for the analysis of
nitrobenzene compounds in water samples, including solid-phase
extraction (SPE),4 solid-phase microextraction (SPME),5–9
headspace solvent microextraction (HSSME),10 non-equilibrium
liquid-phase microextraction (LPME),10 and single drop micro-
extraction (SDME).11 However, there are obvious disadvantages
associated with each of these methods. For example, SPE is time-
consuming and has a high cost due to the expensive cartridge
required, while SPME requires a longer time for equilibrium than
other methods and its fiber is fragile and has a limited lifetime
and desorption temperature. And HSSME, LPME and SDME
require a great deal of time to transfer analytes into the micro
amount of extraction solvent.
In 2006, Rezaee et al.12 introduced a novel extraction method
known as dispersive liquid-liquid microextraction (DLLME).
This method consists of two main steps. The first step is the rapid
injection of a mixture of extraction and dispersion solvents into
the aqueous sample to disperse the extraction solvent into the
aqueous sample, into which the analytes were enriched. Owing to
the large surface area between the extraction solvent and the
aqueous sample, the equilibrium state is achieved quickly, which
is one of the most important advantages of DLLME. In the
second step, the cloudy solution is centrifuged to achieve a sedi-
mented phase, after which the analytes in the sedimented phase
are identified by gas chromatography (GC) combined with mass
spectrometry (MS) or flame ionization detection (FID).
To date, this method has been successfully applied in the
detection of organic compounds such as polycyclic aromatic
This journal is ª The Royal Society of Chemistry 2011
Table 1 Information, ions and instrument detection limits (IDLs) for the analytes
Name Abbreviation M.W. Quantitative ion (m/z) Confirmation ions (m/z) logKow29 IDL (pg)
Nitrobenzene NB 123.11 77 123, 51 1.95 10.82-Nitrotoluene 2-NT 137.14 120 91, 65 2.41 6.33-Nitrotoluene 3-NT 137.14 91 65, 137 2.41 11.14-Nitrotoluene 4-NT 137.14 91 65, 137 2.41 14.33-Nitrochlorobenzene 3-NCB 157.56 111 157, 159 2.64 8.82-Nitrochlorobenzene 2-NCB 157.56 75 111, 157 2.34 4.1a
4-Nitrochlorobenzene 4-NCB 157.56 75 111, 157 2.60 4.1a
2,6-Dinitrotoluene 2,6-DNT 182.14 165 63, 89 2.08 13.02,4-Dinitrotoluene 2,4-DNT 182.13 165 63, 89 2.08 13.42,4-Dinitrochlorobenzene 2,4-DNCB 202.56 75 110, 202 2.06 29.31,3,5-Trinitrobenzene TNB 213.11 75 120, 213 1.22 10.62,4,6-Trinitrotoluene TNT 227.13 210 63, 89 1.68 11.5
a IDLs were calculated based on the co-eluted peaks of 2-NCB and 4-NCB in this study.29
Publ
ishe
d on
26
Aug
ust 2
011.
Dow
nloa
ded
by U
nive
rsity
of
Win
dsor
on
25/1
0/20
14 0
5:31
:22.
View Article Online
hydrocarbons (PAHs), chlorophenols, polychlorinated biphe-
nyls (PCBs), organochlorine pesticides (OCPs), polybrominated
diphenyl ethers (PBDEs), organophosphorus pesticides (OPPs)
and inorganic chemicals in water samples.13,14 In 2009, Ebra-
himzadeh et al.15 successfully used DLLME to study NB, NTs
and DNTs in water samples and achieved acceptable pre-
concentration factors (PFs) using carbon tetrachloride as the
extraction solvent and methanol as the dispersion solvent. Sobhi
et al.16 also established a DLLME method to detect three mon-
onitrotoluenes (2-NT, 3-NT and 4-NT) at trace levels in water
samples and also achieved satisfactory PFs using chlorobenzene
as the extraction solvent and acetonitrile as the dispersion
solvent. However, to the best of our knowledge, little effort has
been made to establish a rapid method for the simultaneous
detection of these nitrobenzenes and nitrochlorobenzenes in
water samples. Therefore, the present study was conducted to
identify a rapid and simple method utilizing DLLME technique
for the determination of the group of NBs and NCBs in water
samples. The effects of various experimental parameters, such as
the type and volume of extraction and dispersion solvent as well
their ratio were studied in detail and optimum conditions were
established.
Experimental
Reagents and standards
The analytes in this study (shown in Table 1) were purchased
from SUPELCO, USA. All of the standard solutions were kept
in the refrigerator at 4 �C. HPLC grade acetonitrile (ACN),
acetone (ACE), and methanol (MeOH) were supplied by Merck,
USA. Reagent grade chloroform (CHCl3), carbon tetrachloride
(CCl4) and dichloromethane (CH2Cl2) were purchased from the
Tianjin Chemical Reagent Company, China. Water was purified
using a Milli-Q water purification system.
Extraction procedure
5.0 mL ofMilli-Q water spiked with 5.0 mg L�1 of each of the NBs
and NCBs was placed in a 10 mL screw-capped glass test tube
with a conical bottom. A suitable volume of the mixture solvent
(composed of a known amount of extraction solvent and
dispersion solvent) was then added rapidly into the water using
This journal is ª The Royal Society of Chemistry 2011
a 1000 mL syringe. A cloudy solution (water/dispersion solvent/
extraction solvent) immediately formed in the test tube . The
mixture was then gently shaken for 20 s by hand, after which it
was centrifuged for 5 min at 810.0� g and 25 �C. This resulted in
the NBs and NCBs in the water sample being extracted efficiently
into fine extraction solvent droplets and then after centrifuging,
the fine particles of extraction solvent formed a sediment in the
bottom of the conical test tube. The volume of the sediment was
measured using a Hamilton 10 microlitre syringe. Next, 1.0 mL of
the extract was obtained and analyzed by GC-MS. Each batch of
samples was analyzed in triplicate.
Instrumental analysis
The identification and quantification of the analytes was carried
out using a Shimadzu 2010 gas chromatograph equipped with
a mass spectra detector and a DB-5MS column (30 m � 0.25 mm
� 0.25 mm, Agilent Technology). The temperature program was
as follows: the initial temperature was 50 �C (held for 10 min),
after which it was increased to 180 �C (held for 1 min) at a rate of
7 �C min�1, and then to 230 �C (held for 2 min) at a rate of 3 �Cmin�1, and finally to 300 �C at a rate of 10 �C min�1 (held for 5
min). The injection temperature was 250 �C. The injection port
was operated in the splitless mode. The flow rate of the carrier
(helium, 99.999%) was 1.1 mL min:1. The mass spectrometer was
operated in electroimpact (EI) and selective ion monitoring
modes (SIM) with a source temperature of 200 �C, an interface
temperature of 280 �C, and a solvent delay of 10 min.
The instrument detection limits (IDLs) were calculated as 3 �(S.D./S),21 where S.D. is the standard deviation of the response
acquired for seven replicate injections of standard individuals
(0.25 mg L�1) and S is the slope of the calibration curve which
was obtained from NBs and NCBs standard solutions in chlo-
roform at a range of 0.005–10 mg L:1. 2-NCB and 4-NCB were
co-eluted under the selected GC conditions and the IDLs were
calculated based on their co-eluted peaks. The retention times,
selected ions and IDLs of the target compounds are shown in
Table 1.
Analytical parameters
Two main parameters, extraction recovery (ER) and pre-
concentration factor (PF), were employed for evaluation of the
Anal. Methods, 2011, 3, 2254–2260 | 2255
Publ
ishe
d on
26
Aug
ust 2
011.
Dow
nloa
ded
by U
nive
rsity
of
Win
dsor
on
25/1
0/20
14 0
5:31
:22.
View Article Online
proposed method. ER was defined as the percentage of total
analytes extracted in the sedimented phase (eqn (1)), while PF
was defined as the ratio of the concentrations of the analytes
extracted in the sedimented phase to the initial concentrations
(eqn (2)):
ER ¼ Crec � Vrec
C0 � Vaq
� 100% (1)
PF ¼ Crec
C0
(2)
where, Crec and C0 were the concentrations of the analytes in the
sedimented phase and the initial concentrations in the water
sample, respectively. Vrec and Vaq are the volumes of the sedi-
mented phases and the water sample, respectively.
In this study, the mean values of ERs and PFs from triplicate
samples were used as the index of extraction efficiency. In
addition, 2-NCB and 4-NCB were co-eluted under the selected
GC condition; therefore, the ERs and PFs were calculated based
on their co-eluted peaks.
Results and discussion
Various parameters influence DLLME performance and effi-
ciency, including the nature and volume of the extraction and the
dispersion solvents, the volume of the mixed solvent, the
extraction time, and salt addition.12 Because an equilibrium state
can be achieved very quickly in DLLME, the extraction time
required is short and has a limited impact on the ERs and
PFs.17–19,22–24 Accordingly, the extraction time was not investi-
gated in our study and a five minute extraction time was selected
according to Ebrahimzadehet et al.15 Additionally, because the
goal of this study was to identify NBs and NCBs in surface water
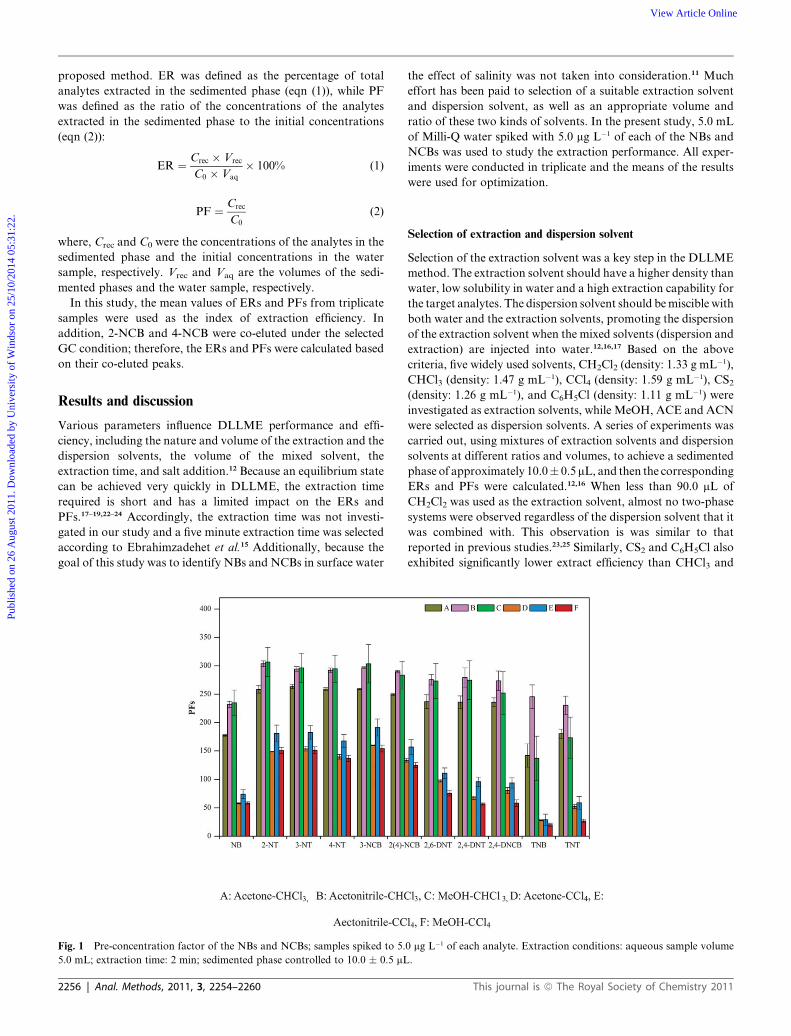
Fig. 1 Pre-concentration factor of the NBs and NCBs; samples spiked to 5.
5.0 mL; extraction time: 2 min; sedimented phase controlled to 10.0 � 0.5 mL
2256 | Anal. Methods, 2011, 3, 2254–2260
the effect of salinity was not taken into consideration.11 Much
effort has been paid to selection of a suitable extraction solvent
and dispersion solvent, as well as an appropriate volume and
ratio of these two kinds of solvents. In the present study, 5.0 mL
of Milli-Q water spiked with 5.0 mg L�1 of each of the NBs and
NCBs was used to study the extraction performance. All exper-
iments were conducted in triplicate and the means of the results
were used for optimization.
Selection of extraction and dispersion solvent
Selection of the extraction solvent was a key step in the DLLME
method. The extraction solvent should have a higher density than
water, low solubility in water and a high extraction capability for
the target analytes. The dispersion solvent should bemiscible with
both water and the extraction solvents, promoting the dispersion
of the extraction solvent when the mixed solvents (dispersion and
extraction) are injected into water.12,16,17 Based on the above
criteria, five widely used solvents, CH2Cl2 (density: 1.33 g mL�1),
CHCl3 (density: 1.47 g mL�1), CCl4 (density: 1.59 g mL�1), CS2(density: 1.26 g mL�1), and C6H5Cl (density: 1.11 g mL�1) were
investigated as extraction solvents, while MeOH, ACE and ACN
were selected as dispersion solvents. A series of experiments was
carried out, using mixtures of extraction solvents and dispersion
solvents at different ratios and volumes, to achieve a sedimented
phase of approximately 10.0� 0.5mL, and then the corresponding
ERs and PFs were calculated.12,16 When less than 90.0 mL of
CH2Cl2 was used as the extraction solvent, almost no two-phase
systems were observed regardless of the dispersion solvent that it
was combined with. This observation is was similar to that
reported in previous studies.23,25 Similarly, CS2 and C6H5Cl also
exhibited significantly lower extract efficiency than CHCl3 and
0 mg L�1 of each analyte. Extraction conditions: aqueous sample volume
.
This journal is ª The Royal Society of Chemistry 2011
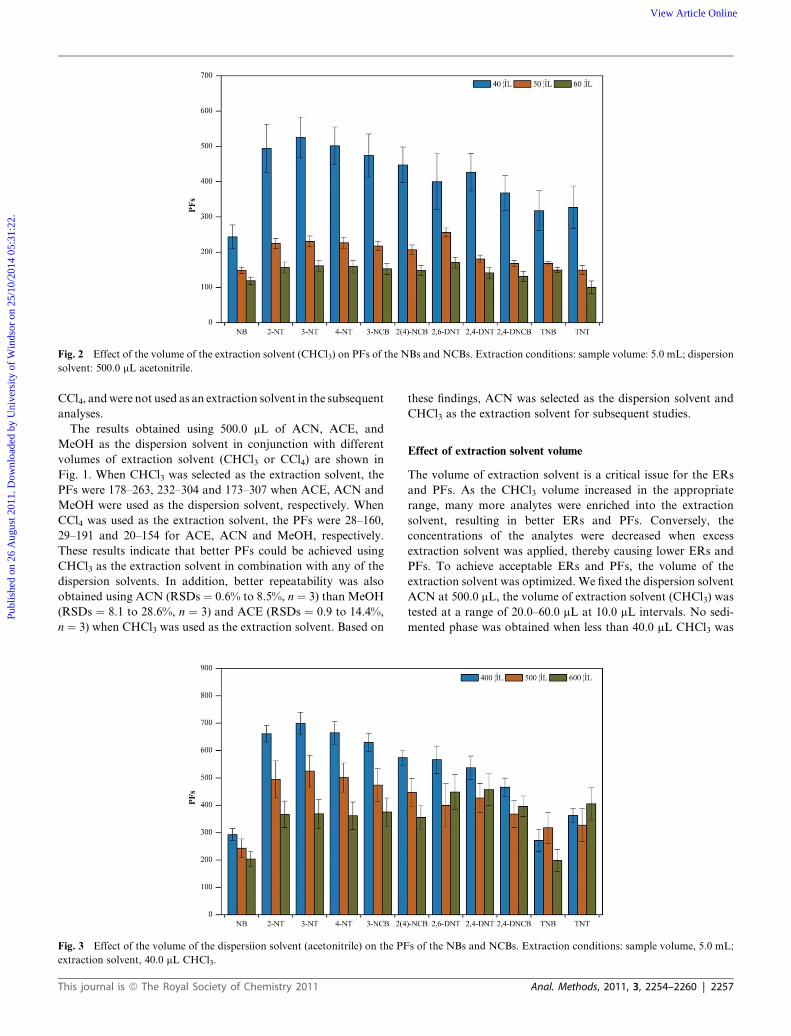
Fig. 2 Effect of the volume of the extraction solvent (CHCl3) on PFs of the NBs and NCBs. Extraction conditions: sample volume: 5.0 mL; dispersion
solvent: 500.0 mL acetonitrile.
Publ
ishe
d on
26
Aug
ust 2
011.
Dow
nloa
ded
by U
nive
rsity
of
Win
dsor
on
25/1
0/20
14 0
5:31
:22.
View Article Online
CCl4, andwere not used as an extraction solvent in the subsequent
analyses.
The results obtained using 500.0 mL of ACN, ACE, and
MeOH as the dispersion solvent in conjunction with different
volumes of extraction solvent (CHCl3 or CCl4) are shown in
Fig. 1. When CHCl3 was selected as the extraction solvent, the
PFs were 178–263, 232–304 and 173–307 when ACE, ACN and
MeOH were used as the dispersion solvent, respectively. When
CCl4 was used as the extraction solvent, the PFs were 28–160,
29–191 and 20–154 for ACE, ACN and MeOH, respectively.
These results indicate that better PFs could be achieved using
CHCl3 as the extraction solvent in combination with any of the
dispersion solvents. In addition, better repeatability was also
obtained using ACN (RSDs ¼ 0.6% to 8.5%, n ¼ 3) than MeOH
(RSDs ¼ 8.1 to 28.6%, n ¼ 3) and ACE (RSDs ¼ 0.9 to 14.4%,
n ¼ 3) when CHCl3 was used as the extraction solvent. Based on
Fig. 3 Effect of the volume of the dispersiion solvent (acetonitrile) on the PF
extraction solvent, 40.0 mL CHCl3.
This journal is ª The Royal Society of Chemistry 2011
these findings, ACN was selected as the dispersion solvent and
CHCl3 as the extraction solvent for subsequent studies.
Effect of extraction solvent volume
The volume of extraction solvent is a critical issue for the ERs
and PFs. As the CHCl3 volume increased in the appropriate
range, many more analytes were enriched into the extraction
solvent, resulting in better ERs and PFs. Conversely, the
concentrations of the analytes were decreased when excess
extraction solvent was applied, thereby causing lower ERs and
PFs. To achieve acceptable ERs and PFs, the volume of the
extraction solvent was optimized. We fixed the dispersion solvent
ACN at 500.0 mL, the volume of extraction solvent (CHCl3) was
tested at a range of 20.0–60.0 mL at 10.0 mL intervals. No sedi-
mented phase was obtained when less than 40.0 mL CHCl3 was
s of the NBs and NCBs. Extraction conditions: sample volume, 5.0 mL;
Anal. Methods, 2011, 3, 2254–2260 | 2257
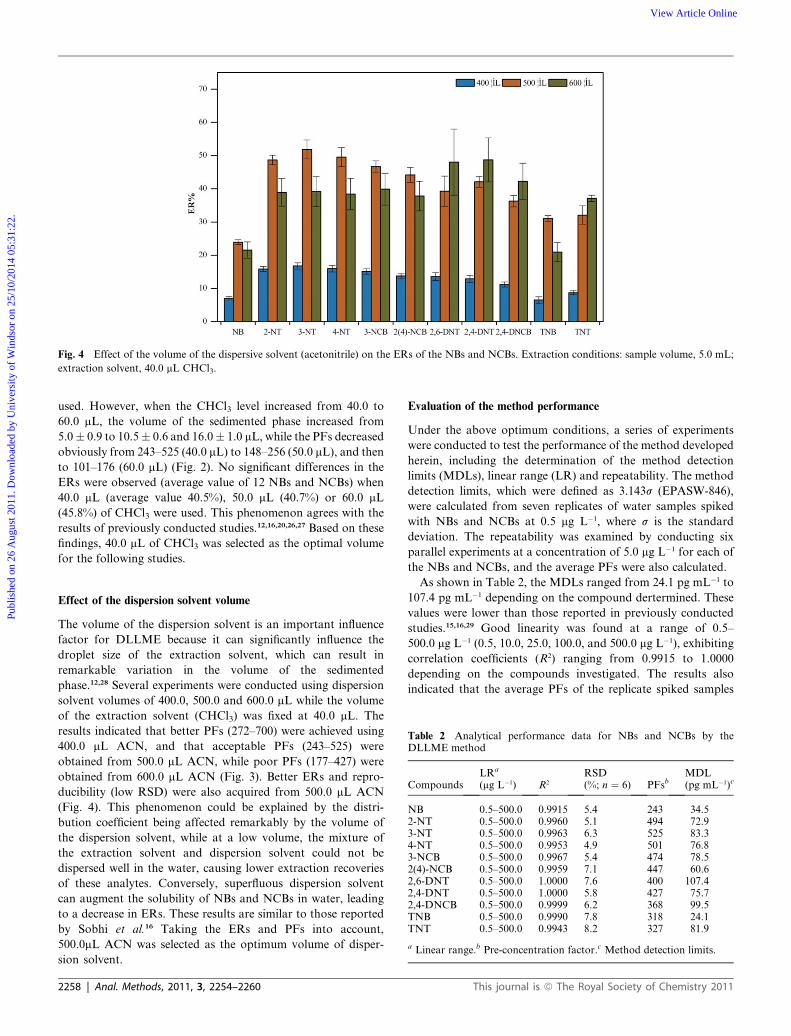
Fig. 4 Effect of the volume of the dispersive solvent (acetonitrile) on the ERs of the NBs and NCBs. Extraction conditions: sample volume, 5.0 mL;
extraction solvent, 40.0 mL CHCl3.
Publ
ishe
d on
26
Aug
ust 2
011.
Dow
nloa
ded
by U
nive
rsity
of
Win
dsor
on
25/1
0/20
14 0
5:31
:22.
View Article Online
used. However, when the CHCl3 level increased from 40.0 to
60.0 mL, the volume of the sedimented phase increased from
5.0� 0.9 to 10.5� 0.6 and 16.0� 1.0 mL, while the PFs decreased
obviously from 243–525 (40.0 mL) to 148–256 (50.0 mL), and then
to 101–176 (60.0 mL) (Fig. 2). No significant differences in the
ERs were observed (average value of 12 NBs and NCBs) when
40.0 mL (average value 40.5%), 50.0 mL (40.7%) or 60.0 mL
(45.8%) of CHCl3 were used. This phenomenon agrees with the
results of previously conducted studies.12,16,20,26,27 Based on these
findings, 40.0 mL of CHCl3 was selected as the optimal volume
for the following studies.
Table 2 Analytical performance data for NBs and NCBs by theDLLME method
CompoundsLRa
(mg L�1) R2
RSD(%; n ¼ 6) PFsb
MDL(pg mL�1)c
NB 0.5–500.0 0.9915 5.4 243 34.52-NT 0.5–500.0 0.9960 5.1 494 72.93-NT 0.5–500.0 0.9963 6.3 525 83.34-NT 0.5–500.0 0.9953 4.9 501 76.83-NCB 0.5–500.0 0.9967 5.4 474 78.52(4)-NCB 0.5–500.0 0.9959 7.1 447 60.62,6-DNT 0.5–500.0 1.0000 7.6 400 107.42,4-DNT 0.5–500.0 1.0000 5.8 427 75.72,4-DNCB 0.5–500.0 0.9999 6.2 368 99.5TNB 0.5–500.0 0.9990 7.8 318 24.1TNT 0.5–500.0 0.9943 8.2 327 81.9
a Linear range.b Pre-concentration factor.c Method detection limits.
Effect of the dispersion solvent volume
The volume of the dispersion solvent is an important influence
factor for DLLME because it can significantly influence the
droplet size of the extraction solvent, which can result in
remarkable variation in the volume of the sedimented
phase.12,28 Several experiments were conducted using dispersion
solvent volumes of 400.0, 500.0 and 600.0 mL while the volume
of the extraction solvent (CHCl3) was fixed at 40.0 mL. The
results indicated that better PFs (272–700) were achieved using
400.0 mL ACN, and that acceptable PFs (243–525) were
obtained from 500.0 mL ACN, while poor PFs (177–427) were
obtained from 600.0 mL ACN (Fig. 3). Better ERs and repro-
ducibility (low RSD) were also acquired from 500.0 mL ACN
(Fig. 4). This phenomenon could be explained by the distri-
bution coefficient being affected remarkably by the volume of
the dispersion solvent, while at a low volume, the mixture of
the extraction solvent and dispersion solvent could not be
dispersed well in the water, causing lower extraction recoveries
of these analytes. Conversely, superfluous dispersion solvent
can augment the solubility of NBs and NCBs in water, leading
to a decrease in ERs. These results are similar to those reported
by Sobhi et al.16 Taking the ERs and PFs into account,
500.0mL ACN was selected as the optimum volume of disper-
sion solvent.
2258 | Anal. Methods, 2011, 3, 2254–2260
Evaluation of the method performance
Under the above optimum conditions, a series of experiments
were conducted to test the performance of the method developed
herein, including the determination of the method detection
limits (MDLs), linear range (LR) and repeatability. The method
detection limits, which were defined as 3.143s (EPASW-846),
were calculated from seven replicates of water samples spiked
with NBs and NCBs at 0.5 mg L�1, where s is the standard
deviation. The repeatability was examined by conducting six
parallel experiments at a concentration of 5.0 mg L�1 for each of
the NBs and NCBs, and the average PFs were also calculated.
As shown in Table 2, the MDLs ranged from 24.1 pg mL�1 to
107.4 pg mL�1 depending on the compound dertermined. These
values were lower than those reported in previously conducted
studies.15,16,29 Good linearity was found at a range of 0.5–
500.0 mg L�1 (0.5, 10.0, 25.0, 100.0, and 500.0 mg L�1), exhibiting
correlation coefficients (R2) ranging from 0.9915 to 1.0000
depending on the compounds investigated. The results also
indicated that the average PFs of the replicate spiked samples
This journal is ª The Royal Society of Chemistry 2011
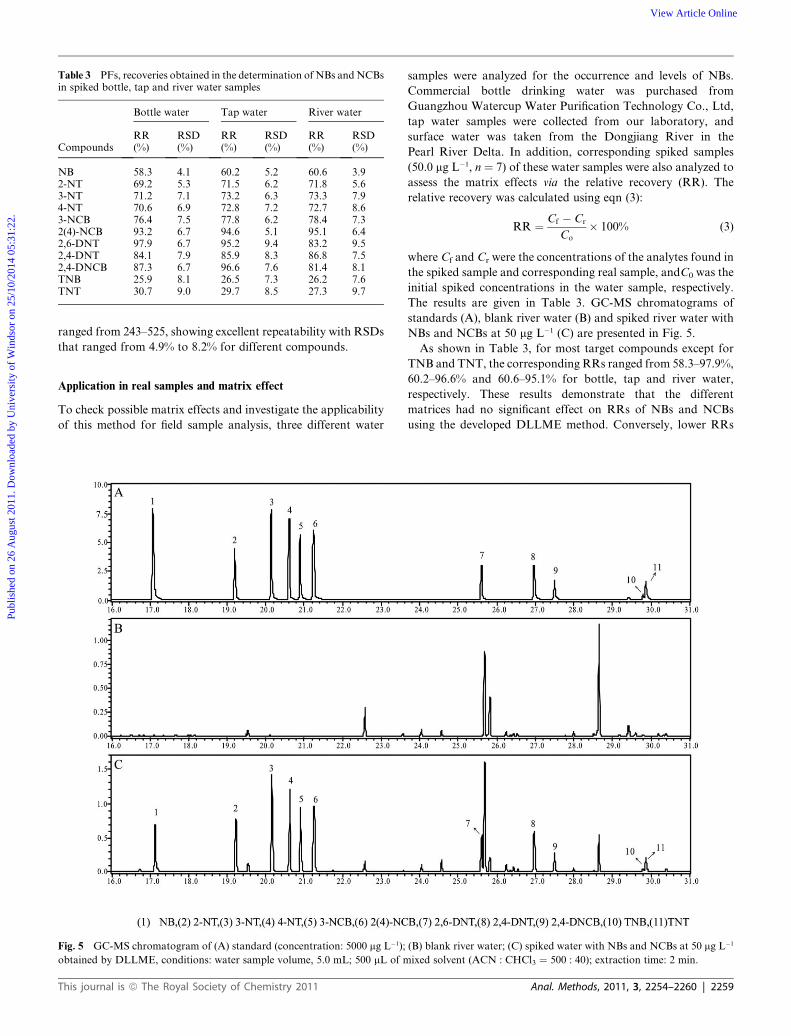
Table 3 PFs, recoveries obtained in the determination of NBs andNCBsin spiked bottle, tap and river water samples
Compounds
Bottle water Tap water River water
RR(%)
RSD(%)
RR(%)
RSD(%)
RR(%)
RSD(%)
NB 58.3 4.1 60.2 5.2 60.6 3.92-NT 69.2 5.3 71.5 6.2 71.8 5.63-NT 71.2 7.1 73.2 6.3 73.3 7.94-NT 70.6 6.9 72.8 7.2 72.7 8.63-NCB 76.4 7.5 77.8 6.2 78.4 7.32(4)-NCB 93.2 6.7 94.6 5.1 95.1 6.42,6-DNT 97.9 6.7 95.2 9.4 83.2 9.52,4-DNT 84.1 7.9 85.9 8.3 86.8 7.52,4-DNCB 87.3 6.7 96.6 7.6 81.4 8.1TNB 25.9 8.1 26.5 7.3 26.2 7.6TNT 30.7 9.0 29.7 8.5 27.3 9.7
Publ
ishe
d on
26
Aug
ust 2
011.
Dow
nloa
ded
by U
nive
rsity
of
Win
dsor
on
25/1
0/20
14 0
5:31
:22.
View Article Online
ranged from 243–525, showing excellent repeatability with RSDs
that ranged from 4.9% to 8.2% for different compounds.
Application in real samples and matrix effect
To check possible matrix effects and investigate the applicability
of this method for field sample analysis, three different water
Fig. 5 GC-MS chromatogram of (A) standard (concentration: 5000 mg L�1);
obtained by DLLME, conditions: water sample volume, 5.0 mL; 500 mL of m
This journal is ª The Royal Society of Chemistry 2011
samples were analyzed for the occurrence and levels of NBs.
Commercial bottle drinking water was purchased from
Guangzhou Watercup Water Purification Technology Co., Ltd,
tap water samples were collected from our laboratory, and
surface water was taken from the Dongjiang River in the
Pearl River Delta. In addition, corresponding spiked samples
(50.0 mg L�1, n ¼ 7) of these water samples were also analyzed to
assess the matrix effects via the relative recovery (RR). The
relative recovery was calculated using eqn (3):
RR ¼ Cf � Cr
Co
� 100% (3)
where Cf and Cr were the concentrations of the analytes found in
the spiked sample and corresponding real sample, andC0 was the
initial spiked concentrations in the water sample, respectively.
The results are given in Table 3. GC-MS chromatograms of
standards (A), blank river water (B) and spiked river water with
NBs and NCBs at 50 mg L�1 (C) are presented in Fig. 5.
As shown in Table 3, for most target compounds except for
TNB and TNT, the corresponding RRs ranged from 58.3–97.9%,
60.2–96.6% and 60.6–95.1% for bottle, tap and river water,
respectively. These results demonstrate that the different
matrices had no significant effect on RRs of NBs and NCBs
using the developed DLLME method. Conversely, lower RRs
(B) blank river water; (C) spiked water with NBs and NCBs at 50 mg L�1
ixed solvent (ACN : CHCl3 ¼ 500 : 40); extraction time: 2 min.
Anal. Methods, 2011, 3, 2254–2260 | 2259
Publ
ishe
d on
26
Aug
ust 2
011.
Dow
nloa
ded
by U
nive
rsity
of
Win
dsor
on
25/1
0/20
14 0
5:31
:22.
View Article Online
(<35.0%) were found for TNB and TNT, which might be due to
their lower logKow value (see Table 1), which is similar to the
results of a previous study.7
Conclusions
In this study, a rapid, simple and sensitive DLLME extraction
technique was established for the determination of eight nitro-
benzenes and four nitrochlorobenzenes exhibiting large differ-
ences in their polarities. The results disclosed that good linearity
in the range 0.5–500.0 mg L�1, lower MDLs, acceptable PFs and
good repeatability were achieved using the developed method.
Under the optimum conditions, NBs in water samples could be
extracted and analyzed in a short time using a limited amount of
organic solvent. This method is especially well suited for rapid
identification and quantification of analogous contaminants in
emergency water pollution situations.
Acknowledgements
This work received financial support from water pollution
control and management technology major project
(2009ZX07528-002-04) and the Chinese National Basic research
Program (2008CB418205). We are grateful to T. S. Xiang for
their technical assistance. This is contribution no. IS-1358 from
GIGCAS.
References
1 C. R. Jones, Y.-Y. Liu, O. Sepai, H. Yan and G. Sabbioni, Environ.Sci. Technol., 2006, 40, 387–394.
2 M. C. He, Y. Sun, X. R. Li and Z. F. Yang, Chemosphere, 2006, 65,365–374.
3 Y. Kang, Z. Gong, Z. Wang andG. Li,Acta Scientlae Circumstantiae,2001, 21, 338–342.
4 M. Smith, G. E. Collins and J. Wang, J. Chromatogr., A, 2003, 991,159–167.
5 S. Jonsson, L. Gustavsson and B. van Bavel, J. Chromatogr., A, 2007,1164, 65–73.
2260 | Anal. Methods, 2011, 3, 2254–2260
6 M. Berg, J. Bolotin and T. B. Hofstetter,Anal. Chem., 2007, 79, 2386–2393.
7 F. Monteil-Rivera, C. Beaulieu and J. Hawari, J. Chromatogr., A,2005, 1066, 177–187.
8 K. G. Furton, J. R. Almirall, M. Bi, J. Wang and L. Wu, J.Chromatogr., A, 2000, 885, 419–432.
9 X. Li, J. M. Chen and L. C. Du, J. Chromatogr., A, 2007, 1140,21–28.
10 R. Zhao, S. Chu and X. Xu, Anal. Sci., 2004, 20, 663–666.11 E. Psillakis and N. Kalogerakis, J. Chromatogr., A, 2001, 907, 211–
219.12 M. Rezaee, Y. Assadi, M.-R. Milani Hosseini, E. Aghaee, F. Ahmadi
and S. Berijani, J. Chromatogr., A, 2006, 1116, 1–9.13 X. H. Zang, Q. H.Wu,M. Y. Zhang, G. H. Xia and Z.Wang,Chin. J.
Anal. Chem., 2009, 37, 161–168.14 C. B. Ojeda and F. S. Rojas, Chromatographia, 2009, 69, 1149–
1159.15 H. Ebrahimzadeh, Y. Yamini and F. Kamarei, Talanta, 2009, 79,
1472–1477.16 H. R. Sobhi, A. Kashtiaray, H. Farahani, M. Javaheri and
M. R. Ganjali, J. Hazard. Mater., 2010, 175, 279–283.17 S. Berijani, Y. Assadi, M. Anbia, M.-R. Milani Hosseini and
E. Aghaee, J. Chromatogr., A, 2006, 1123, 1–9.18 N. Fattahi, Y. Assadi, M. R. M. Hosseini and E. Z. Jahromi, J.
Chromatogr., A, 2007, 1157, 23–29.19 F. Rezaei, A. Bidari, A. P. Birjandi, M. R.M. Hosseini and Y. Assadi,
J. Hazard. Mater., 2008, 158, 621–627.20 H. Farahani, P. Norouzi, R. Dinarvand and M. R. Ganjali, J.
Chromatogr., A, 2007, 1172, 105–112.21 J. M. Perr, K. G. Furton and J. R. Almirall, Talanta, 2005, 67, 430–
436.22 H. Xu, Z. Ding, L. Lv, D. Song and Y.-Q. Feng, Anal. Chim. Acta,
2009, 636, 28–33.23 Q. H. Wu, X. Zhou, Y. M. Li, X. H. Zang, C. Wang and Z. Wang,
Anal. Bioanal. Chem., 2009, 393, 1755–1761.24 Q. Wu, C. Wang, Z. Liu, C. Wu, X. Zeng, J. Wen and Z. Wang, J.
Chromatogr., A, 2009, 1216, 5504–5510.25 C. Xiong, J. Ruan, Y. Cai and Y. Tang, J. Pharm. Biomed. Anal.,
2009, 49, 572–578.26 J. Xiong and B. Hu, J. Chromatogr., A, 2008, 1193, 7–18.27 A. S. Yazdi, N. Razavi and S. R. Yazdinejad,Talanta, 2008, 75, 1293–
1299.28 M. A. Farajzadeh, M. Bahram, B. G. Mehr and J. A. Jonsson,
Talanta, 2008, 75, 832–840.29 Y. Nishikawa and T. Okumura, Anal. Chim. Acta, 1995, 312,
45–55.
This journal is ª The Royal Society of Chemistry 2011