determination of land degradation causes in tongyu county, northeast china via land cover change...
TRANSCRIPT
International Journal of Applied Earth Observation and Geoinformation 12 (2010) 9–16
Determination of land degradation causes in Tongyu County,Northeast China via land cover change detection
Jay Gao a,*, Yansui Liu b
a School of Geography, Geology, and Environmental Science, University of Auckland, Auckland, New Zealandb Institute of Geographic Sciences and Natural Resources Research, Chinese Academy of Sciences, Beijing 100101, China
A R T I C L E I N F O
Article history:
Received 25 February 2009
Accepted 20 August 2009
Keywords:
Land degradation
Rehabilitation of degraded land
Change detection
Landsat TM
Northeast China
A B S T R A C T
Tongyu County in Northeast China is highly prone to land degradation due to its fragile physical settings
characterized by a flat topography, a semi-arid climate, and a shallow groundwater table. This study
aims to determine the causes of land degradation through detecting the long-term trend of land cover
changes. Degraded lands were mapped from satellite images recorded in 1992 and 2002. These land
cover maps revealed that the area subject to land degradation in the form of soil salinization,
waterlogging and desertification increased from 2400 to 4214 km2, in sharp contrast to most severely
degraded land that decreased by 122.5 km2. Newly degraded land stems from productive farmland
(263 km2), harvested farmland (551 km2), and grassland (468 km2). Therefore, the worsened
degradation situation is attributed to excessive reclamation of grassland for farming, over cultivation,
overgrazing, and deforestation. Mechanical, biological, ecological and engineering means should be
adopted to rehabilitate the degraded land.
� 2009 Elsevier B.V. All rights reserved.
Contents lists available at ScienceDirect
International Journal of Applied Earth Observation andGeoinformation
journal homepage: www.e lsev ier .com/ locate / jag
1. Introduction
As one of the most common and serious environmentalproblems in the world, land degradation has affected two billionhectares (22.5%) of the world’s agricultural land, pasture, forestand woodland (Al Dousari et al., 2000; Oldeman et al., 1990).Severe degradation is blamed for the disappearance of around 5–10 million ha of agricultural land annually. Dryland areas areenvironmentally fragile, and thus especially susceptible todegradation. It is estimated that global land degradation indrylands causes a loss of land productivity valued aroundUS$13–28 billion a year (Scherr and Yadav, 1996). The livelihoodof millions of farmers living in the dryland zone around the world isthreatened by degradation of arable farmland. In addition toeconomic loss associated with reduced land productivity (Bojo,1991), land degradation also adversely affects the environment. Airand water are polluted by silt, fertilizer and pesticide fromfarmland. Therefore, it is important to study land degradation andto determine its causes so that it can be reversed.
Land degradation may be studied via several methods, such asfield visits and remote sensing. In comparison with the fieldmethod, remote sensing method is much more cost-effective and
* Corresponding author. Tel.: +64 9 373 7599x85184; fax: +64 9 373 7434.
E-mail addresses: [email protected] (J. Gao), [email protected] (Y. Liu).
0303-2434/$ – see front matter � 2009 Elsevier B.V. All rights reserved.
doi:10.1016/j.jag.2009.08.003
time-efficient in that a huge ground area measured in hundreds ofsquare kilometres can be studied from one image. Remotely sensedimagery is good at revealing the land that has been affected bydegradation to various degrees (Gao and Liu, 2008). Remotelysensed data are effective in identifying and mapping landdegradation risks (Lu et al., 2007). In particular, remotely sensedsatellite data can effectively reveal the spatial extent, magnitudeand temporal behaviour of lands affected by waterlogging andsubsequent salinization/alkalinization (Sujatha et al., 2000), eventhough it may be problematic to retrieve remotely sensed primaryparameters (such as reflectance) (Hill et al., 1995). Sujatha et al.(2000) mapped the spatial distribution of salt-affected soils,waterlogged areas and eroded lands from visual interpretation ofLandsat multispectral scanner and Thematic Mapper (TM) images.A spectral index derived from Advanced Spaceborne ThermalEmission and Reflection Radiometer (ASTER) data has beenproposed to characterize the state of land degradation (Chikhaouiet al., 2005). Degraded land can be mapped more than 70%accurately from ASTER data using both per-pixel and object-oriented image classification methods (Gao, 2008a). In addition,MODIS data have been used to estimate local net primaryproduction, from which long-term land degradation in Zimbabwewas detected and mapped (Prince et al., 2009). If combined withGIS, remote sensing can be used to identify areas of landdegradation and link them to physiographic settings (Van Lyndenand Mantel, 2001). By using remote sensing and GIS, Li et al. (2007)
J. Gao, Y. Liu / International Journal of Applied Earth Observation and Geoinformation 12 (2010) 9–1610
identified land use/cover changes between salinized wastelandand other land covers in the Western part of Northeast China overthe last 50 years. The spatial distribution of regional patterns ofland degradation can be reliably mapped by using the indicesdescribing the spectrum shape and spectral unmixing (Haboudaneet al., 2002). If combined with topographic variables, spectralinformation is very useful for land degradation assessment.
Monitoring of the long-term trend of land degradation requiresconsistent and repeatable data that are available for many years.Multitemporal remote sensing data from various sensors spanningover decades are the perfect source for this application. Informa-tion on land degradation severity and its process can be efficientlymonitored from multitemporal satellite images (Collado et al.,2002). Mapping and monitoring of the evolution of mining-induced land degradation relies on digital analysis of time-seriesLandsat TM images (Almeida-Filho and Shimabukuro, 2002).Analysis of time-series vegetation index maps derived fromLandsat MSS data revealed land degradation in the NorthernProvince of South Africa (Botha and Fouche, 2000). Chen and Rao(2008) determined the rate and status of grassland degradation inNortheast China from multitemporal Landsat TM/ETM data afterthe satellite data were converted into land cover maps using thedecision tree method.
The determination of the long-term trend of land degradationrequires spatial comparison of multiple land cover maps derivedfrom remotely sensed data at different times that must be co-registered with one another to determine spatial changes (Geymenand Baz, 2008). This is commonly known as digital changedetection. Change detection can be implemented in several ways,such as change vector analysis (Warner, 2005; Bayarjargal et al.,2006), image differencing (Lu et al., 2005; Desclee et al., 2006), andimage rationing (Zhao et al., 2004) of raw spectral bands or resultsderived from them (e.g., vegetation index). It is also possible tocombine these detection methods to identify the process of landdegradation. For instance, Adamo and Crews-Meyer (2006)explored desertification processes in West central Argentina basedupon analysis of remotely sensed data using vegetation indices,image differentiation, change detection, and pattern metrics.Gomez-Mendoza et al. (2006) projected land use change processesthat determine land use change in Sierra Norte of Oaxaca, Mexico.Of all detection methods, post-classification change detection is by
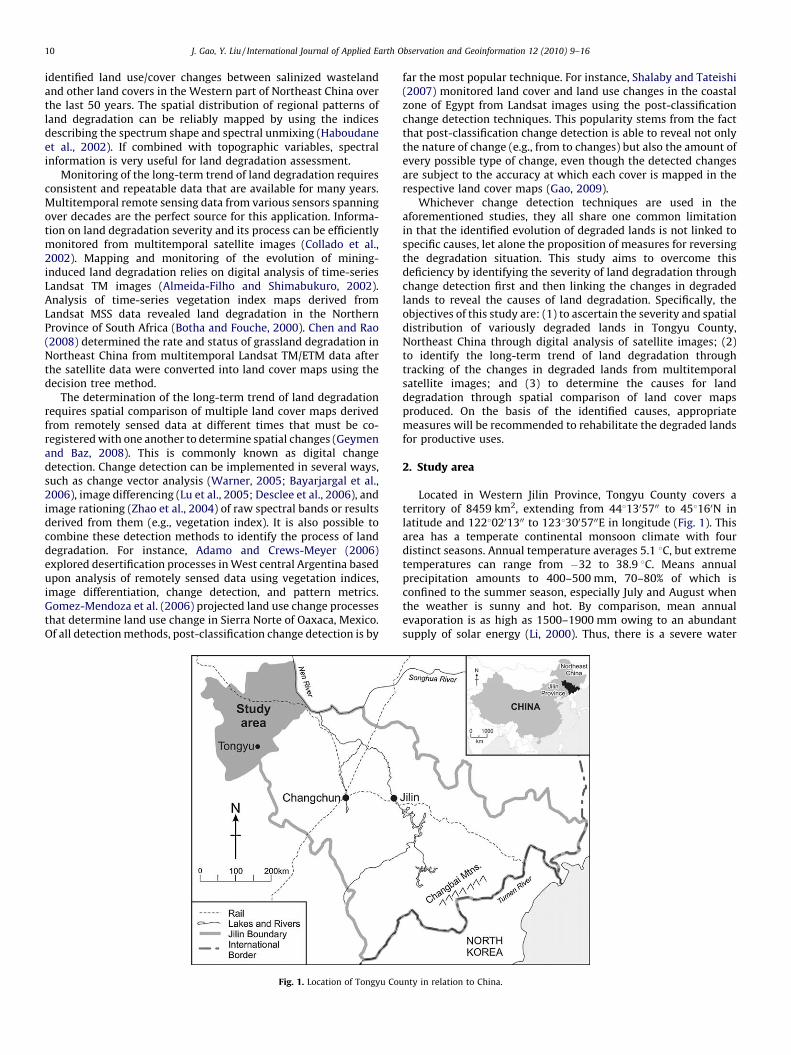
Fig. 1. Location of Tongyu Cou
far the most popular technique. For instance, Shalaby and Tateishi(2007) monitored land cover and land use changes in the coastalzone of Egypt from Landsat images using the post-classificationchange detection techniques. This popularity stems from the factthat post-classification change detection is able to reveal not onlythe nature of change (e.g., from to changes) but also the amount ofevery possible type of change, even though the detected changesare subject to the accuracy at which each cover is mapped in therespective land cover maps (Gao, 2009).
Whichever change detection techniques are used in theaforementioned studies, they all share one common limitationin that the identified evolution of degraded lands is not linked tospecific causes, let alone the proposition of measures for reversingthe degradation situation. This study aims to overcome thisdeficiency by identifying the severity of land degradation throughchange detection first and then linking the changes in degradedlands to reveal the causes of land degradation. Specifically, theobjectives of this study are: (1) to ascertain the severity and spatialdistribution of variously degraded lands in Tongyu County,Northeast China through digital analysis of satellite images; (2)to identify the long-term trend of land degradation throughtracking of the changes in degraded lands from multitemporalsatellite images; and (3) to determine the causes for landdegradation through spatial comparison of land cover mapsproduced. On the basis of the identified causes, appropriatemeasures will be recommended to rehabilitate the degraded landsfor productive uses.
2. Study area
Located in Western Jilin Province, Tongyu County covers aterritory of 8459 km2, extending from 4481305700 to 458160N inlatitude and 12280201300 to 12383005700E in longitude (Fig. 1). Thisarea has a temperate continental monsoon climate with fourdistinct seasons. Annual temperature averages 5.1 8C, but extremetemperatures can range from �32 to 38.9 8C. Means annualprecipitation amounts to 400–500 mm, 70–80% of which isconfined to the summer season, especially July and August whenthe weather is sunny and hot. By comparison, mean annualevaporation is as high as 1500–1900 mm owing to an abundantsupply of solar energy (Li, 2000). Thus, there is a severe water
nty in relation to China.
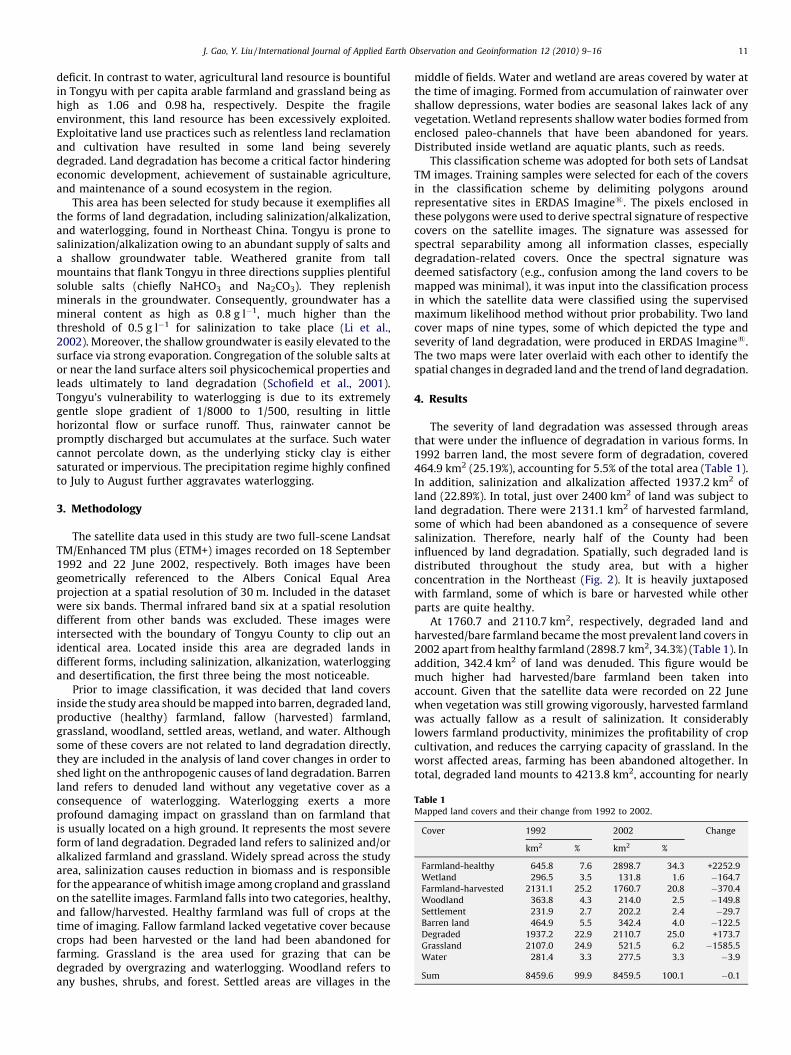
Table 1Mapped land covers and their change from 1992 to 2002.
Cover 1992 2002 Change
km2 % km2 %
Farmland-healthy 645.8 7.6 2898.7 34.3 +2252.9
Wetland 296.5 3.5 131.8 1.6 �164.7
Farmland-harvested 2131.1 25.2 1760.7 20.8 �370.4
Woodland 363.8 4.3 214.0 2.5 �149.8
Settlement 231.9 2.7 202.2 2.4 �29.7
Barren land 464.9 5.5 342.4 4.0 �122.5
Degraded 1937.2 22.9 2110.7 25.0 +173.7
Grassland 2107.0 24.9 521.5 6.2 �1585.5
Water 281.4 3.3 277.5 3.3 �3.9
Sum 8459.6 99.9 8459.5 100.1 �0.1
J. Gao, Y. Liu / International Journal of Applied Earth Observation and Geoinformation 12 (2010) 9–16 11
deficit. In contrast to water, agricultural land resource is bountifulin Tongyu with per capita arable farmland and grassland being ashigh as 1.06 and 0.98 ha, respectively. Despite the fragileenvironment, this land resource has been excessively exploited.Exploitative land use practices such as relentless land reclamationand cultivation have resulted in some land being severelydegraded. Land degradation has become a critical factor hinderingeconomic development, achievement of sustainable agriculture,and maintenance of a sound ecosystem in the region.
This area has been selected for study because it exemplifies allthe forms of land degradation, including salinization/alkalization,and waterlogging, found in Northeast China. Tongyu is prone tosalinization/alkalization owing to an abundant supply of salts anda shallow groundwater table. Weathered granite from tallmountains that flank Tongyu in three directions supplies plentifulsoluble salts (chiefly NaHCO3 and Na2CO3). They replenishminerals in the groundwater. Consequently, groundwater has amineral content as high as 0.8 g l�1, much higher than thethreshold of 0.5 g l�1 for salinization to take place (Li et al.,2002). Moreover, the shallow groundwater is easily elevated to thesurface via strong evaporation. Congregation of the soluble salts ator near the land surface alters soil physicochemical properties andleads ultimately to land degradation (Schofield et al., 2001).Tongyu’s vulnerability to waterlogging is due to its extremelygentle slope gradient of 1/8000 to 1/500, resulting in littlehorizontal flow or surface runoff. Thus, rainwater cannot bepromptly discharged but accumulates at the surface. Such watercannot percolate down, as the underlying sticky clay is eithersaturated or impervious. The precipitation regime highly confinedto July to August further aggravates waterlogging.
3. Methodology
The satellite data used in this study are two full-scene LandsatTM/Enhanced TM plus (ETM+) images recorded on 18 September1992 and 22 June 2002, respectively. Both images have beengeometrically referenced to the Albers Conical Equal Areaprojection at a spatial resolution of 30 m. Included in the datasetwere six bands. Thermal infrared band six at a spatial resolutiondifferent from other bands was excluded. These images wereintersected with the boundary of Tongyu County to clip out anidentical area. Located inside this area are degraded lands indifferent forms, including salinization, alkanization, waterloggingand desertification, the first three being the most noticeable.
Prior to image classification, it was decided that land coversinside the study area should be mapped into barren, degraded land,productive (healthy) farmland, fallow (harvested) farmland,grassland, woodland, settled areas, wetland, and water. Althoughsome of these covers are not related to land degradation directly,they are included in the analysis of land cover changes in order toshed light on the anthropogenic causes of land degradation. Barrenland refers to denuded land without any vegetative cover as aconsequence of waterlogging. Waterlogging exerts a moreprofound damaging impact on grassland than on farmland thatis usually located on a high ground. It represents the most severeform of land degradation. Degraded land refers to salinized and/oralkalized farmland and grassland. Widely spread across the studyarea, salinization causes reduction in biomass and is responsiblefor the appearance of whitish image among cropland and grasslandon the satellite images. Farmland falls into two categories, healthy,and fallow/harvested. Healthy farmland was full of crops at thetime of imaging. Fallow farmland lacked vegetative cover becausecrops had been harvested or the land had been abandoned forfarming. Grassland is the area used for grazing that can bedegraded by overgrazing and waterlogging. Woodland refers toany bushes, shrubs, and forest. Settled areas are villages in the
middle of fields. Water and wetland are areas covered by water atthe time of imaging. Formed from accumulation of rainwater overshallow depressions, water bodies are seasonal lakes lack of anyvegetation. Wetland represents shallow water bodies formed fromenclosed paleo-channels that have been abandoned for years.Distributed inside wetland are aquatic plants, such as reeds.
This classification scheme was adopted for both sets of LandsatTM images. Training samples were selected for each of the coversin the classification scheme by delimiting polygons aroundrepresentative sites in ERDAS Imagine1. The pixels enclosed inthese polygons were used to derive spectral signature of respectivecovers on the satellite images. The signature was assessed forspectral separability among all information classes, especiallydegradation-related covers. Once the spectral signature wasdeemed satisfactory (e.g., confusion among the land covers to bemapped was minimal), it was input into the classification processin which the satellite data were classified using the supervisedmaximum likelihood method without prior probability. Two landcover maps of nine types, some of which depicted the type andseverity of land degradation, were produced in ERDAS Imagine1.The two maps were later overlaid with each other to identify thespatial changes in degraded land and the trend of land degradation.
4. Results
The severity of land degradation was assessed through areasthat were under the influence of degradation in various forms. In1992 barren land, the most severe form of degradation, covered464.9 km2 (25.19%), accounting for 5.5% of the total area (Table 1).In addition, salinization and alkalization affected 1937.2 km2 ofland (22.89%). In total, just over 2400 km2 of land was subject toland degradation. There were 2131.1 km2 of harvested farmland,some of which had been abandoned as a consequence of severesalinization. Therefore, nearly half of the County had beeninfluenced by land degradation. Spatially, such degraded land isdistributed throughout the study area, but with a higherconcentration in the Northeast (Fig. 2). It is heavily juxtaposedwith farmland, some of which is bare or harvested while otherparts are quite healthy.
At 1760.7 and 2110.7 km2, respectively, degraded land andharvested/bare farmland became the most prevalent land covers in2002 apart from healthy farmland (2898.7 km2, 34.3%) (Table 1). Inaddition, 342.4 km2 of land was denuded. This figure would bemuch higher had harvested/bare farmland been taken intoaccount. Given that the satellite data were recorded on 22 Junewhen vegetation was still growing vigorously, harvested farmlandwas actually fallow as a result of salinization. It considerablylowers farmland productivity, minimizes the profitability of cropcultivation, and reduces the carrying capacity of grassland. In theworst affected areas, farming has been abandoned altogether. Intotal, degraded land mounts to 4213.8 km2, accounting for nearly
Fig. 2. Distribution of degraded land in 1992, derived from analysis of a Landsat TM image recorded on 18 September 1992.
J. Gao, Y. Liu / International Journal of Applied Earth Observation and Geoinformation 12 (2010) 9–1612
50% of the area. Most of the degraded land is distributed again inthe right half of the study area surrounded by bare/harvestedfarmland (Fig. 3). This spatial distribution pattern bears a strikingresemblance to that shown in Fig. 2.
One of the most noticeable changes in land degradation is theincrease in salinized and alkanized land by 173.7 km2 over the 10-year study period (Table 1). In contrast, barren land was reduced by122.5 km2. Similarly, harvested/bare farmland also decreased by370.4 km2. This reduction was related partly to the differentialtiming of imaging (to be analyzed in more detail below). Thischange pattern suggests that severely degraded areas havedecreased while land under the influence of degradation hasexpanded during the study period. Two other notable changesshown in the table are the huge increase in healthy farmland(2252.9 km2) and a considerable decrease in grassland(1585.5 km2). These changes are not pertaining to land degrada-tion directly, but their analysis to be presented in the next sectionwill shed light on the causes of land degradation.
Examination of the conversion among specific land covers(Table 2) is beneficial to ascertain the reasons behind the observedchanges. Besides, this spatial comparison is more conducive torevelation of specific changes in the actual area of degraded landthan the net figures in Table 1. Representing the break down oftheir counterparts in Table 1, figures in Table 2 illustrate all thepossible changes between any two covers. Some of these figureshaving a low value are probably not genuine as a result ofmisclassifications. However, they do not affect the general trend ofland degradation. In order to reveal this trend, this sectionconcentrates on the critical changes. For instance, 262.9 km2 ofhealthy farmland and 551.4 km2 of harvested farmland becamedegraded during 1992–2002. These changes indicate that overcultivation of crops in this vulnerable environment has contributedto land degradation. Furthermore, 468.0 km2 of grassland was also
degraded during the study period. Similar to farmland, grassland isvulnerable to degradation if its carrying capacity is exceeded. Thedecrease in woodland by 149.8 km2 is due to conversion tofarmland (e.g., land reclamation through deforestation), urbaniza-tion, and flooding. These changes are indicative of a deterioratingdegradation situation that may worsen in the future.
At a first glance, the increase in healthy farmland from645.8 km2 in 1992 to 2898.7 km2 has nothing to do with landdegradation. Nevertheless, it is still worthwhile to explore thereasons for this rise. The first cause for the increase is related to thechanged timing of the images from 18 September to 22 June whenmost crops were still growing vigorously. The second, moreworrying cause of this increase is the loss of grassland at1585.5 km2. As shown in Table 2, 1143.9 km2 of grassland wasconverted into healthy farmland. Thus, the newly gained farmlandwas created through reclamation of grassland in the eastern half ofthe County. Although this land was identified as healthy at the timeof study (June 2002), it is questionable whether this will be the casein the future. Given the vulnerable environmental settings in thestudy area, newly reclaimed farmland is highly susceptible todegradation. Possibly, this part of the study area may follow thesuit of its counterpart in the right half.
5. Discussion
5.1. Use of the satellite data
In change detection studies, the multitemporal remote sensingdata used should ideally be anniversary in order to avoid anypotential artificial changes related to phonology in vegetation-related covers. In this study the TM/ETM+ data were recorded at aspan from June to September. While this temporal discrepancymay cause some artificial changes to the detected results, it will
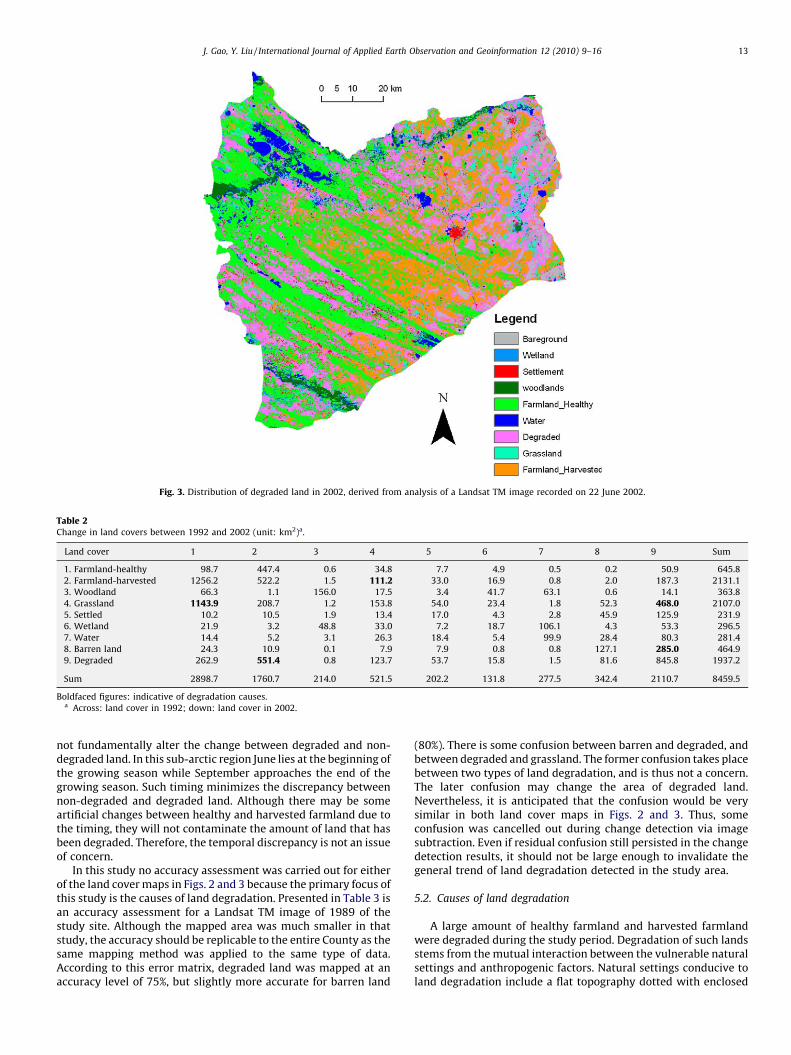
Fig. 3. Distribution of degraded land in 2002, derived from analysis of a Landsat TM image recorded on 22 June 2002.
Table 2Change in land covers between 1992 and 2002 (unit: km2)a.
Land cover 1 2 3 4 5 6 7 8 9 Sum
1. Farmland-healthy 98.7 447.4 0.6 34.8 7.7 4.9 0.5 0.2 50.9 645.8
2. Farmland-harvested 1256.2 522.2 1.5 111.2 33.0 16.9 0.8 2.0 187.3 2131.1
3. Woodland 66.3 1.1 156.0 17.5 3.4 41.7 63.1 0.6 14.1 363.8
4. Grassland 1143.9 208.7 1.2 153.8 54.0 23.4 1.8 52.3 468.0 2107.0
5. Settled 10.2 10.5 1.9 13.4 17.0 4.3 2.8 45.9 125.9 231.9
6. Wetland 21.9 3.2 48.8 33.0 7.2 18.7 106.1 4.3 53.3 296.5
7. Water 14.4 5.2 3.1 26.3 18.4 5.4 99.9 28.4 80.3 281.4
8. Barren land 24.3 10.9 0.1 7.9 7.9 0.8 0.8 127.1 285.0 464.9
9. Degraded 262.9 551.4 0.8 123.7 53.7 15.8 1.5 81.6 845.8 1937.2
Sum 2898.7 1760.7 214.0 521.5 202.2 131.8 277.5 342.4 2110.7 8459.5
Boldfaced figures: indicative of degradation causes.a Across: land cover in 1992; down: land cover in 2002.
J. Gao, Y. Liu / International Journal of Applied Earth Observation and Geoinformation 12 (2010) 9–16 13
not fundamentally alter the change between degraded and non-degraded land. In this sub-arctic region June lies at the beginning ofthe growing season while September approaches the end of thegrowing season. Such timing minimizes the discrepancy betweennon-degraded and degraded land. Although there may be someartificial changes between healthy and harvested farmland due tothe timing, they will not contaminate the amount of land that hasbeen degraded. Therefore, the temporal discrepancy is not an issueof concern.
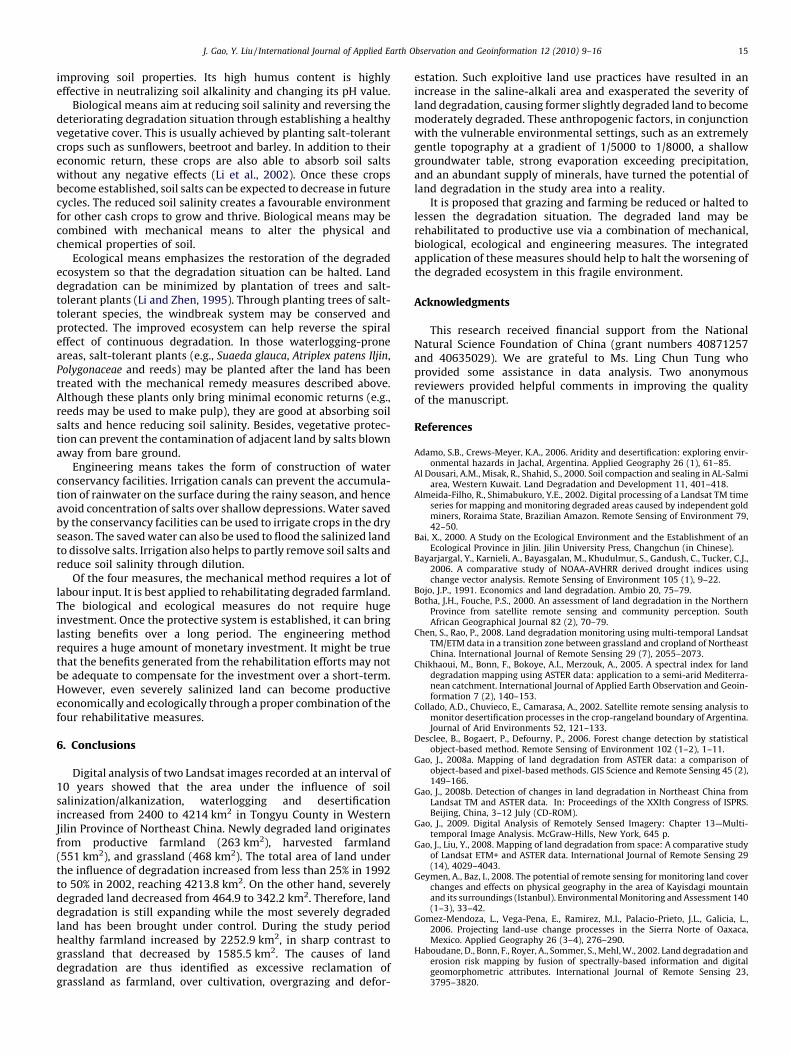
In this study no accuracy assessment was carried out for eitherof the land cover maps in Figs. 2 and 3 because the primary focus ofthis study is the causes of land degradation. Presented in Table 3 isan accuracy assessment for a Landsat TM image of 1989 of thestudy site. Although the mapped area was much smaller in thatstudy, the accuracy should be replicable to the entire County as thesame mapping method was applied to the same type of data.According to this error matrix, degraded land was mapped at anaccuracy level of 75%, but slightly more accurate for barren land
(80%). There is some confusion between barren and degraded, andbetween degraded and grassland. The former confusion takes placebetween two types of land degradation, and is thus not a concern.The later confusion may change the area of degraded land.Nevertheless, it is anticipated that the confusion would be verysimilar in both land cover maps in Figs. 2 and 3. Thus, someconfusion was cancelled out during change detection via imagesubtraction. Even if residual confusion still persisted in the changedetection results, it should not be large enough to invalidate thegeneral trend of land degradation detected in the study area.
5.2. Causes of land degradation
A large amount of healthy farmland and harvested farmlandwere degraded during the study period. Degradation of such landsstems from the mutual interaction between the vulnerable naturalsettings and anthropogenic factors. Natural settings conducive toland degradation include a flat topography dotted with enclosed
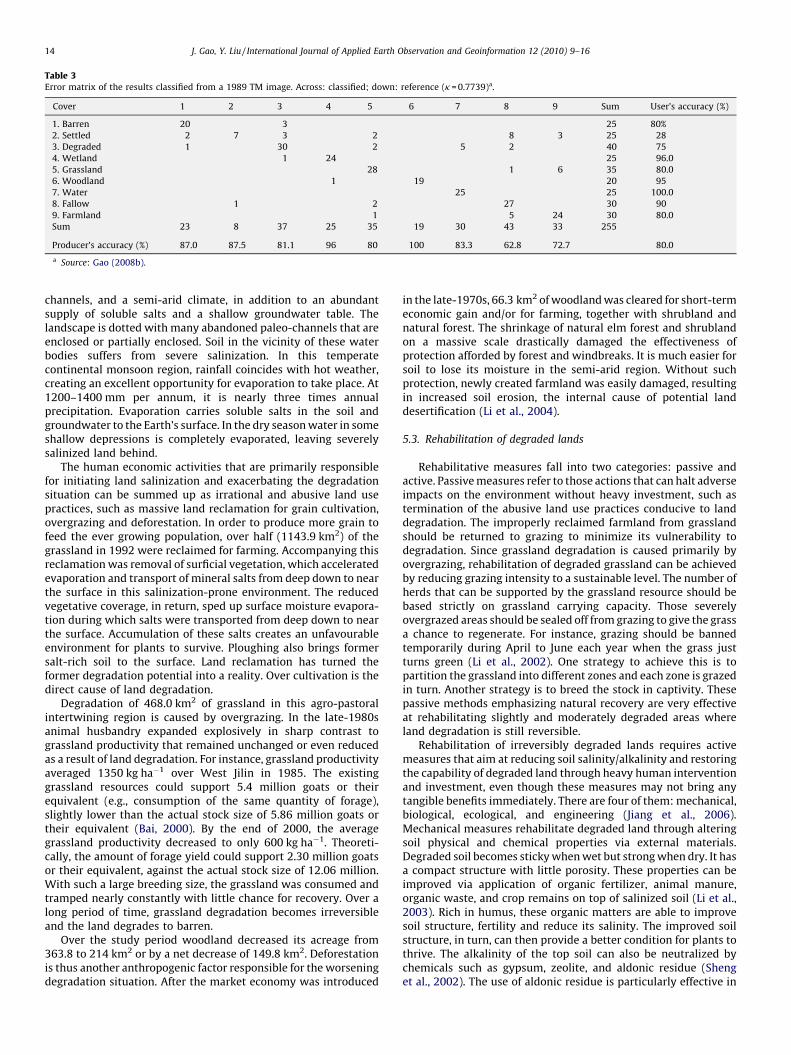
Table 3Error matrix of the results classified from a 1989 TM image. Across: classified; down: reference (k = 0.7739)a.
Cover 1 2 3 4 5 6 7 8 9 Sum User’s accuracy (%)
1. Barren 20 3 25 80%
2. Settled 2 7 3 2 8 3 25 28
3. Degraded 1 30 2 5 2 40 75
4. Wetland 1 24 25 96.0
5. Grassland 28 1 6 35 80.0
6. Woodland 1 19 20 95
7. Water 25 25 100.0
8. Fallow 1 2 27 30 90
9. Farmland 1 5 24 30 80.0
Sum 23 8 37 25 35 19 30 43 33 255
Producer’s accuracy (%) 87.0 87.5 81.1 96 80 100 83.3 62.8 72.7 80.0
a Source: Gao (2008b).
J. Gao, Y. Liu / International Journal of Applied Earth Observation and Geoinformation 12 (2010) 9–1614
channels, and a semi-arid climate, in addition to an abundantsupply of soluble salts and a shallow groundwater table. Thelandscape is dotted with many abandoned paleo-channels that areenclosed or partially enclosed. Soil in the vicinity of these waterbodies suffers from severe salinization. In this temperatecontinental monsoon region, rainfall coincides with hot weather,creating an excellent opportunity for evaporation to take place. At1200–1400 mm per annum, it is nearly three times annualprecipitation. Evaporation carries soluble salts in the soil andgroundwater to the Earth’s surface. In the dry season water in someshallow depressions is completely evaporated, leaving severelysalinized land behind.
The human economic activities that are primarily responsiblefor initiating land salinization and exacerbating the degradationsituation can be summed up as irrational and abusive land usepractices, such as massive land reclamation for grain cultivation,overgrazing and deforestation. In order to produce more grain tofeed the ever growing population, over half (1143.9 km2) of thegrassland in 1992 were reclaimed for farming. Accompanying thisreclamation was removal of surficial vegetation, which acceleratedevaporation and transport of mineral salts from deep down to nearthe surface in this salinization-prone environment. The reducedvegetative coverage, in return, sped up surface moisture evapora-tion during which salts were transported from deep down to nearthe surface. Accumulation of these salts creates an unfavourableenvironment for plants to survive. Ploughing also brings formersalt-rich soil to the surface. Land reclamation has turned theformer degradation potential into a reality. Over cultivation is thedirect cause of land degradation.
Degradation of 468.0 km2 of grassland in this agro-pastoralintertwining region is caused by overgrazing. In the late-1980sanimal husbandry expanded explosively in sharp contrast tograssland productivity that remained unchanged or even reducedas a result of land degradation. For instance, grassland productivityaveraged 1350 kg ha�1 over West Jilin in 1985. The existinggrassland resources could support 5.4 million goats or theirequivalent (e.g., consumption of the same quantity of forage),slightly lower than the actual stock size of 5.86 million goats ortheir equivalent (Bai, 2000). By the end of 2000, the averagegrassland productivity decreased to only 600 kg ha�1. Theoreti-cally, the amount of forage yield could support 2.30 million goatsor their equivalent, against the actual stock size of 12.06 million.With such a large breeding size, the grassland was consumed andtramped nearly constantly with little chance for recovery. Over along period of time, grassland degradation becomes irreversibleand the land degrades to barren.
Over the study period woodland decreased its acreage from363.8 to 214 km2 or by a net decrease of 149.8 km2. Deforestationis thus another anthropogenic factor responsible for the worseningdegradation situation. After the market economy was introduced
in the late-1970s, 66.3 km2 of woodland was cleared for short-termeconomic gain and/or for farming, together with shrubland andnatural forest. The shrinkage of natural elm forest and shrublandon a massive scale drastically damaged the effectiveness ofprotection afforded by forest and windbreaks. It is much easier forsoil to lose its moisture in the semi-arid region. Without suchprotection, newly created farmland was easily damaged, resultingin increased soil erosion, the internal cause of potential landdesertification (Li et al., 2004).
5.3. Rehabilitation of degraded lands
Rehabilitative measures fall into two categories: passive andactive. Passive measures refer to those actions that can halt adverseimpacts on the environment without heavy investment, such astermination of the abusive land use practices conducive to landdegradation. The improperly reclaimed farmland from grasslandshould be returned to grazing to minimize its vulnerability todegradation. Since grassland degradation is caused primarily byovergrazing, rehabilitation of degraded grassland can be achievedby reducing grazing intensity to a sustainable level. The number ofherds that can be supported by the grassland resource should bebased strictly on grassland carrying capacity. Those severelyovergrazed areas should be sealed off from grazing to give the grassa chance to regenerate. For instance, grazing should be bannedtemporarily during April to June each year when the grass justturns green (Li et al., 2002). One strategy to achieve this is topartition the grassland into different zones and each zone is grazedin turn. Another strategy is to breed the stock in captivity. Thesepassive methods emphasizing natural recovery are very effectiveat rehabilitating slightly and moderately degraded areas whereland degradation is still reversible.
Rehabilitation of irreversibly degraded lands requires activemeasures that aim at reducing soil salinity/alkalinity and restoringthe capability of degraded land through heavy human interventionand investment, even though these measures may not bring anytangible benefits immediately. There are four of them: mechanical,biological, ecological, and engineering (Jiang et al., 2006).Mechanical measures rehabilitate degraded land through alteringsoil physical and chemical properties via external materials.Degraded soil becomes sticky when wet but strong when dry. It hasa compact structure with little porosity. These properties can beimproved via application of organic fertilizer, animal manure,organic waste, and crop remains on top of salinized soil (Li et al.,2003). Rich in humus, these organic matters are able to improvesoil structure, fertility and reduce its salinity. The improved soilstructure, in turn, can then provide a better condition for plants tothrive. The alkalinity of the top soil can also be neutralized bychemicals such as gypsum, zeolite, and aldonic residue (Shenget al., 2002). The use of aldonic residue is particularly effective in
J. Gao, Y. Liu / International Journal of Applied Earth Observation and Geoinformation 12 (2010) 9–16 15
improving soil properties. Its high humus content is highlyeffective in neutralizing soil alkalinity and changing its pH value.
Biological means aim at reducing soil salinity and reversing thedeteriorating degradation situation through establishing a healthyvegetative cover. This is usually achieved by planting salt-tolerantcrops such as sunflowers, beetroot and barley. In addition to theireconomic return, these crops are also able to absorb soil saltswithout any negative effects (Li et al., 2002). Once these cropsbecome established, soil salts can be expected to decrease in futurecycles. The reduced soil salinity creates a favourable environmentfor other cash crops to grow and thrive. Biological means may becombined with mechanical means to alter the physical andchemical properties of soil.
Ecological means emphasizes the restoration of the degradedecosystem so that the degradation situation can be halted. Landdegradation can be minimized by plantation of trees and salt-tolerant plants (Li and Zhen, 1995). Through planting trees of salt-tolerant species, the windbreak system may be conserved andprotected. The improved ecosystem can help reverse the spiraleffect of continuous degradation. In those waterlogging-proneareas, salt-tolerant plants (e.g., Suaeda glauca, Atriplex patens Iljin,Polygonaceae and reeds) may be planted after the land has beentreated with the mechanical remedy measures described above.Although these plants only bring minimal economic returns (e.g.,reeds may be used to make pulp), they are good at absorbing soilsalts and hence reducing soil salinity. Besides, vegetative protec-tion can prevent the contamination of adjacent land by salts blownaway from bare ground.
Engineering means takes the form of construction of waterconservancy facilities. Irrigation canals can prevent the accumula-tion of rainwater on the surface during the rainy season, and henceavoid concentration of salts over shallow depressions. Water savedby the conservancy facilities can be used to irrigate crops in the dryseason. The saved water can also be used to flood the salinized landto dissolve salts. Irrigation also helps to partly remove soil salts andreduce soil salinity through dilution.
Of the four measures, the mechanical method requires a lot oflabour input. It is best applied to rehabilitating degraded farmland.The biological and ecological measures do not require hugeinvestment. Once the protective system is established, it can bringlasting benefits over a long period. The engineering methodrequires a huge amount of monetary investment. It might be truethat the benefits generated from the rehabilitation efforts may notbe adequate to compensate for the investment over a short-term.However, even severely salinized land can become productiveeconomically and ecologically through a proper combination of thefour rehabilitative measures.
6. Conclusions
Digital analysis of two Landsat images recorded at an interval of10 years showed that the area under the influence of soilsalinization/alkanization, waterlogging and desertificationincreased from 2400 to 4214 km2 in Tongyu County in WesternJilin Province of Northeast China. Newly degraded land originatesfrom productive farmland (263 km2), harvested farmland(551 km2), and grassland (468 km2). The total area of land underthe influence of degradation increased from less than 25% in 1992to 50% in 2002, reaching 4213.8 km2. On the other hand, severelydegraded land decreased from 464.9 to 342.2 km2. Therefore, landdegradation is still expanding while the most severely degradedland has been brought under control. During the study periodhealthy farmland increased by 2252.9 km2, in sharp contrast tograssland that decreased by 1585.5 km2. The causes of landdegradation are thus identified as excessive reclamation ofgrassland as farmland, over cultivation, overgrazing and defor-
estation. Such exploitive land use practices have resulted in anincrease in the saline-alkali area and exasperated the severity ofland degradation, causing former slightly degraded land to becomemoderately degraded. These anthropogenic factors, in conjunctionwith the vulnerable environmental settings, such as an extremelygentle topography at a gradient of 1/5000 to 1/8000, a shallowgroundwater table, strong evaporation exceeding precipitation,and an abundant supply of minerals, have turned the potential ofland degradation in the study area into a reality.
It is proposed that grazing and farming be reduced or halted tolessen the degradation situation. The degraded land may berehabilitated to productive use via a combination of mechanical,biological, ecological and engineering measures. The integratedapplication of these measures should help to halt the worsening ofthe degraded ecosystem in this fragile environment.
Acknowledgments
This research received financial support from the NationalNatural Science Foundation of China (grant numbers 40871257and 40635029). We are grateful to Ms. Ling Chun Tung whoprovided some assistance in data analysis. Two anonymousreviewers provided helpful comments in improving the qualityof the manuscript.
References
Adamo, S.B., Crews-Meyer, K.A., 2006. Aridity and desertification: exploring envir-onmental hazards in Jachal, Argentina. Applied Geography 26 (1), 61–85.
Al Dousari, A.M., Misak, R., Shahid, S., 2000. Soil compaction and sealing in AL-Salmiarea, Western Kuwait. Land Degradation and Development 11, 401–418.
Almeida-Filho, R., Shimabukuro, Y.E., 2002. Digital processing of a Landsat TM timeseries for mapping and monitoring degraded areas caused by independent goldminers, Roraima State, Brazilian Amazon. Remote Sensing of Environment 79,42–50.
Bai, X., 2000. A Study on the Ecological Environment and the Establishment of anEcological Province in Jilin. Jilin University Press, Changchun (in Chinese).
Bayarjargal, Y., Karnieli, A., Bayasgalan, M., Khudulmur, S., Gandush, C., Tucker, C.J.,2006. A comparative study of NOAA-AVHRR derived drought indices usingchange vector analysis. Remote Sensing of Environment 105 (1), 9–22.
Bojo, J.P., 1991. Economics and land degradation. Ambio 20, 75–79.Botha, J.H., Fouche, P.S., 2000. An assessment of land degradation in the Northern
Province from satellite remote sensing and community perception. SouthAfrican Geographical Journal 82 (2), 70–79.
Chen, S., Rao, P., 2008. Land degradation monitoring using multi-temporal LandsatTM/ETM data in a transition zone between grassland and cropland of NortheastChina. International Journal of Remote Sensing 29 (7), 2055–2073.
Chikhaoui, M., Bonn, F., Bokoye, A.I., Merzouk, A., 2005. A spectral index for landdegradation mapping using ASTER data: application to a semi-arid Mediterra-nean catchment. International Journal of Applied Earth Observation and Geoin-formation 7 (2), 140–153.
Collado, A.D., Chuvieco, E., Camarasa, A., 2002. Satellite remote sensing analysis tomonitor desertification processes in the crop-rangeland boundary of Argentina.Journal of Arid Environments 52, 121–133.
Desclee, B., Bogaert, P., Defourny, P., 2006. Forest change detection by statisticalobject-based method. Remote Sensing of Environment 102 (1–2), 1–11.
Gao, J., 2008a. Mapping of land degradation from ASTER data: a comparison ofobject-based and pixel-based methods. GIS Science and Remote Sensing 45 (2),149–166.
Gao, J., 2008b. Detection of changes in land degradation in Northeast China fromLandsat TM and ASTER data. In: Proceedings of the XXIth Congress of ISPRS.Beijing, China, 3–12 July (CD-ROM).
Gao, J., 2009. Digital Analysis of Remotely Sensed Imagery: Chapter 13—Multi-temporal Image Analysis. McGraw-Hills, New York, 645 p.
Gao, J., Liu, Y., 2008. Mapping of land degradation from space: A comparative studyof Landsat ETM+ and ASTER data. International Journal of Remote Sensing 29(14), 4029–4043.
Geymen, A., Baz, I., 2008. The potential of remote sensing for monitoring land coverchanges and effects on physical geography in the area of Kayisdagi mountainand its surroundings (Istanbul). Environmental Monitoring and Assessment 140(1–3), 33–42.
Gomez-Mendoza, L., Vega-Pena, E., Ramirez, M.I., Palacio-Prieto, J.L., Galicia, L.,2006. Projecting land-use change processes in the Sierra Norte of Oaxaca,Mexico. Applied Geography 26 (3–4), 276–290.
Haboudane, D., Bonn, F., Royer, A., Sommer, S., Mehl, W., 2002. Land degradation anderosion risk mapping by fusion of spectrally-based information and digitalgeomorphometric attributes. International Journal of Remote Sensing 23,3795–3820.
J. Gao, Y. Liu / International Journal of Applied Earth Observation and Geoinformation 12 (2010) 9–1616
Hill, J., Sommer, S., Mehl, W., Megier, J., 1995. Use of Earth observation satellite datafor land degradation mapping and monitoring in Mediterranean ecosystems:towards a satellite-observatory. Environmental Monitoring and Assessment 37(1–3), 143–158.
Jiang, D., Zong, W., Li, X., Liu, Z., Yan, Q., He, S., 2006. Rehabilitation of desertifiedlands in Western Horqin steppe. Chinese Journal of Ecology 25 (3), 243–248 (inChinese).
Li, F., He, Y.F., Liu, Z.M., Zhang, B., 2004. Dynamics of sandy desertification and itsdriving forces in Western Jilin Province. Chinese Geographical Science 14, 57–62.
Li, J., Zhen, H., 1995. Ecological restoration of the alkali-saline land in the SongnenPlain and the optimal model of restoration. Journal of Northeast NormalUniversity (Natural Science Edition) 27 (3), 67–71.
Li, Q.S., Li, X.J., Li, X.S., Wang, Z.C., Song, C.C., Zhang, G.X., 2003. Sodium bicarbonatesoil management and utilization in Songnen Plain. Resources Science 25 (1), 15–20 (in Chinese).
Li, X.J., 2000. The alkali-saline land and agricultural sustainable development of theWestern Songnen plain in China. Scientia Geographica Sinica 20, 51–55 (inChinese).
Li, X.J., Li, Q.S., Wang, Z.C., Liu, X.T., 2002. A research on characteristics and rationalexploitation of soda saline land in the Western Songnen Plain. Research ofAgricultural Modernization 23, 361–364 (in Chinese).
Li, X.J., Wang, Z., Song, K., Zhang, B., Liu, D., Guo, Z., 2007. Assessment for salinizedwasteland expansion and land use change using GIS and remote sensing in theWest part of Northeast China. Environmental Monitoring and Assessment 131(1–3), 421–437.
Lu, D., Batistella, M., Mausel, P., Moran, E., 2007. Mapping and monitoring landdegradation risks in the Western Brazilian Amazon using multitemporal Land-sat TM/ETM+ images. Land Degradation and Development 18, 41–54.
Lu, D., Mausel, P., Batistella, M., Moran, E., 2005. Land-cover binary change detectionmethods for use in the moist tropical region of the Amazon: a comparativestudy. International Journal of Remote Sensing 26 (1), 101–114.
Oldeman, R.L., Hakkeling, R.T.A., Sombroek, W.G., 1990. World Map of the Status ofHuman-induced Soil Degradation: An Explanatory Note. International SoilReference and Information Centre, Wageningen, Netherlands.
Prince, S.D., Becker-Reshef, I., Rishmawi, K., 2009. Detection and mapping of long-term land degradation using local net production scaling: application to Zim-babwe. Remote Sensing of Environment 113, 1046–1057.
Scherr, S.J., Yadav, S., 1996. Land Degradation in the Developing World: Implicationsfor Food, Agriculture, and the Environment to 2020. Food, Agriculture, and theEnvironment Discussion Paper 14, International Food Policy Research Institute,Washington, DC, 35 p.
Schofield, R., Thomas, D.S.G., Kirkby, M.J., 2001. Causal processes of soil salinizationin Tunisia, Spain and Hungary. Land Degradation and Development 12, 163–181.
Shalaby, A., Tateishi, R., 2007. Remote sensing and GIS for mapping and monitoringland cover and land-use changes in the Northwestern coastal zone of Egypt.Applied Geography 27 (1), 28–41.
Sheng, L.X., Ma, X.F., Wang, Z.P., 2002. Study on the recovery and control of thealkali-saline lands in Songnen Plain. Journal of Northeast Normal University 34(1), 30–35.
Sujatha, G., Dwivedi, R.S., Sreenivas, K., Venkataratnam, L., 2000. Mapping andmonitoring of degraded lands in part of Jaunpur district of Uttar Pradesh usingtemporal spaceborne multispectral data. International Journal of Remote Sen-sing 21, 519–531.
Van Lynden, G.W.J., Mantel, S., 2001. The role of GIS and remote sensing in landdegradation assessment and conservation mapping: some user experiences andexpectations. International Journal of Applied Earth Observation and Geoin-formation 2001 (1), 61–68.
Warner, T., 2005. Hyperspherical direction cosine change vector analysis. Interna-tional Journal of Remote Sensing 26 (6), 1201–1215.
Zhao, G.X., Lin, G., Warner, T., 2004. Using Thematic Mapper data for changedetection and sustainable use of cultivated land: a case study in the YellowRiver delta, China. International Journal of Remote Sensing 25 (13), 2509–2522.