determinants of low inflation in an emerging, small … working paper no. 267 determinants of low...
TRANSCRIPT
NBP Working Paper No. 267
Determinants of low inflation in an emerging, small open economy.A comparison of aggregated and disaggregated approaches
Karol Szafranek, Aleksandra Hałka
Economic Research DepartmentWarsaw, 2017
NBP Working Paper No. 267
Determinants of low inflation in an emerging, small open economy.A comparison of aggregated and disaggregated approaches
Karol Szafranek, Aleksandra Hałka

Published by: Narodowy Bank Polski Education & Publishing Department ul. Świętokrzyska 11/21 00-919 Warszawa, Poland www.nbp.pl
ISSN 2084-624X
© Copyright Narodowy Bank Polski, 2017
Karol Szafranek – Narodowy Bank Polski and Warsaw School of EconomicsAleksandra Hałka – Narodowy Bank Polski
The views expressed herein are those of their authors and do not necessarily reflect those of Narodowy Bank Polski. Correspondence should be directed to: [email protected]. Postal address: ul. Świętokrzyska 11/21, 00-919 Warszawa, Poland.
1 Introduction 5
2 Literature review 8
3 Methodology and data 11
3.1 The model and the data 113.2 The identification scheme 13
4 Results 17
4.1 Inflation determinants during low inflation 174.2 Comparison between the period of excessive disinflation and deflation 214.3 Sensitivity indices and robustness check 25
5 Conclusion 29
3NBP Working Paper No. 267
Contents
Abstract
We analyse the determinants of the protracted period of exceptionally low inflation
in the emerging, small open economy of Poland. We consider a fairly standard set of
macroeconomic variables and establish a structural VAR model estimated using Bayesian
methods and disentangle the influence of the global and domestic, supply and demand
factors affecting headline and core inflation by means of the mixture of zero and sign
restrictions. Next, we extend the analysis on a battery of inflation components and construct
inflation indices sensitive to the global and domestic factors. We find that the excessive
disinflation has been primarily caused by the deteriorating domestic conditions whilst
deflation has resulted from the convolution of waning global demand and plummeting
oil prices. Disaggregated analysis corroborates the conclusion of the aggregated approach
but reveals considerable heterogeneities in the sensitivity of inflation components to the
identified shocks. We conclude that the disaggregated analysis brings important information
for the monetary policy conduct.
JEL: C32, E31, E52
Keywords: low inflation, small open economy, Bayesian Vector Autoregression, sign
restrictions
2
Narodowy Bank Polski4
Abstract
1 Introduction
For several years the development of the headline inflation rates in many countries has
continued to surprise macroeconomic analysts, central bankers and the general public. Two
exceptional periods are frequently distinguished in the empirical literature. First, following
the outburst of the great financial crisis headline inflation in a number of economies has
not decreased accordingly to the severity of the recession raising the question of the missing
deflation. Second, after 2011 headline inflation has been systematically declining across major
advanced and emerging economies, disproportionately to the level of the observed domestic
real activity. This phenomenon has sparked an extensive debate on the determinants of the
period of systematically falling inflation and an unexpected and protracted period of persistently
low inflation. Consequently, it has attracted sizeable attention of both policy makers (e.g
Wickman-Parak, 2013; Constancio, 2016) as well as established a topic for an intense economic
research (to mention only few recent works: Coibion and Gorodnichenko, 2015; Christiano
et al., 2015; Friedrich, 2016; International Monetary Fund, 2016; Conti et al., 2017; Bobeica
and Jarocinski, 2017; European Central Bank, 2017). In the paper we extend this discussion
by studying the relative importance of the global and domestic demand and supply factors
shaping the recent nominal fluctuations in an emerging, small open economy. For this purpose
we examine the Polish case.
To the best of our knowledge, at the current juncture little empirical evidence has been
presented for small, open economies experiencing a period of persistently low inflation. Therefore,
the principal aim and the main contribution of this paper is to fill this niche in the literature.
We shed light on this under-explored phenomenon by identifying the determinants of the low
inflation in Poland.
We follow a recent notion in the empirical literature and disentangle the structural shocks
influencing the headline and the core inflation by employing a mixture of zero and sign restrictions
in a Bayesian VAR framework. For that purpose we adopt the methodology presented in Bobeica
and Jarocinski (2017) as well as Conti et al. (2017). In this approach we grant the identified
shocks an economic interpretation and assess the relative importance of the global and domestic,
supply and demand factors shaping inflation in Poland. Secondly, we extend this analysis
on a large number of inflation components to inspect whether conclusions drawn from the
disaggregated approach justify the results of the analysis performed on the aggregated level.
We take further advantage of the disaggregated approach by marking inflation components
as sensitive or resilient to the developments of the global and domestic factors and construct
indices measuring the foreign and domestic nominal fluctuations.
The phenomenon of the excessive disinflation and a subsequent, protracted period of
deflation is a subject of the economic discussion also in emerging, small open economies
(Szafranek, 2017). As illustrated on figure 1, the peculiar behaviour of inflation after the
outburst of the great financial crisis is particularly starkly exemplified in Poland. On the one
hand, the headline inflation has remained elevated in the aftermath of the global financial
crisis as the firm domestic demand cushioned the Polish economy from the impact of the
negative external shocks. On the other hand, after 2011 the the headline inflation has been
subordinated to the phenomenon of the excessive disinflation (missing inflation) that manifested
predominantly in the European countries. After reaching 4.4% in 2011Q4, the annual headline
inflation rate in Poland has experienced an abrupt and unanticipated decrease to -1.5%, a
historically low level. Deflation was hardly a short-lived episode as the decline in the consumer
3
5NBP Working Paper No. 267
Chapter 1

prices endured for an unprecedented period of two and a half years. A simple decomposition
illustrates that the diminishing price dynamics has resulted predominantly from the falling
and negative energy and food inflation which analysts have primarily attributed to the excess
supply of the main commodities on the global market. However, since the end of the 2011 core
inflation has been systematically declining as well.
Figure 1: The development of the headline and core inflation along with the decomposi-
tion of the annual headline inflation rate in Poland
Note: The figure presents the annual headline and core inflation rate as well as the contribution of the changes in the inflation of food,
energy, non-energy industrial goods and services to the overall headline inflation developments in Poland. Source: Central Statistical
Office in Poland, own calculations.
This conundrum seems especially baffling when looking through the lenses of the adjustments
in the domestic real activity. Experiencing only a short breath at the turn of 2012, the economic
growth in Poland has remained robust throughout the global financial crisis and the subsequent
European sovereign debt crisis. Simultaneously, the situation on the labour market has continued
to systematically improve leading to the historically lowest unemployment and exceptionally
high consumer confidence. However, the increase in the wage dynamics has not been profound,
partly due to the underutilization of labour (Wyszynski, 2016). The downward pressure on
wages could be further exacerbated by recently intensified immigration of the labour force with
low bargaining power, similarly to the Spanish case (Bentolila et al., 2008). Currently, while
the headline inflation has rebounded vigorously primarily due to the fading statistical effect
of low commodity prices, the core inflation remains only marginally positive. Taking these
developments into consideration, we focus our attention on the period of low inflation starting
in 2012 which urges us to investigate and reassess the relative importance of the global and
domestic shocks influencing the consumer prices in Poland. We put forward a hypothesis that
the underlying domestic inflation remains low due to inadequate demand while the importance
of the global factors has strengthened for both aggregate headline inflation measure as well as
across the disaggregated components of the Polish consumer price index.
Understanding the prevailing regime is important for the monetary policy conduct. Iden-
tifying the determinants shaping headline inflation is crucial to achieve the central bank’s
main purpose – maintaining the stability of prices. Moreover, it provides a useful tool for
4
Narodowy Bank Polski6
the proper communication process with the general public (Blinder et al., 2008). From the
central bank’s standpoint our study entails three valuable pieces of information. Firstly, it
evaluates the relative importance of the demand and supply shocks affecting inflation. The
former resemble the changes in the domestic or the foreign real activity and their effects are likely
distributed over a period of time. Moreover, domestic demand shocks often lead to adjusting
the monetary policy. On the other hand, supply shocks have mostly exogenous and transitory
nature. However, as they often influence the prices of primary consumer goods (e.g. food and
energy), some central banks could be more anxious to mitigate the negative effects of imported
shocks (Holtemoller and Mallick, 2016) even at the expense of slower economic growth. Secondly,
the study discusses the extent of the global nature of inflation in Poland. Rising impact of the
foreign factors on the domestic consumer prices decreases the effectiveness of the monetary
policy in fighting inflationary or deflationary pressures. Thirdly, the study introduced indices
of inflation determined by different economic developments which help track the source of the
nominal fluctuations on a regular basis.
Several conclusions are warranted in the paper. Firstly, we show that the domestic demand
remains a significant determinant of inflation in the emerging, small open economy of Poland.
In particular, the deteriorating domestic conditions have turned out to be the primary source
of the excessive disinflation in Poland. Secondly, we identify the rising importance of the global
factors during the deflation period. In particular, we conclude that deflation has been an
entirely imported phenomenon as the waning global demand and plummeting oil prices have
exerted a considerable downward pressure on consumer prices. This is further confirmed by the
development of the inflation index of components sensitive to the domestic demand. Thirdly, the
presented evidence on the relative importance of the global and domestic shocks corroborates
recent findings in the empirical literature. Hence, it indicates that in the period of low inflation
a structural break in the mechanism of setting prices has not appeared. Fourthly, the analysis
repeated on the number of inflation components generally validates the conclusions of the
study performed on the aggregate inflation indices. However, we find substantial heterogeneities
in the relative importance of shocks across the distinguished inflation indices during the
excessive disinflation and deflation. Whereas some inflation components remain resilient to the
developments in the global economy, we argue that during deflation the inflation of services
has been increasingly influenced by the foreign factors. Lastly, we conclude that the monetary
policy has remained neutral throughout the low inflation period.
The outline of the paper is as follows. In section 2 we review the recent empirical literature
on the determinants of low inflation. We present also a broader perspective on the inflation
determinants. In section 3 we describe the data as well as the applied methodology. The main
results as well as the robustness check along with the discussion of the outcomes are presented
in section 4. Section 5 concludes.
5
7NBP Working Paper No. 267
Introduction
2 Literature review
The debate on the relative importance of the global and domestic demand and supply
factors shaping inflation developments remains unsettled and concentrates mainly on highly
developed economies. In this section we discuss the presented evidence on the determinants of
the recent nominal fluctuations. Our empirical study is closely related to four recent articles by:
Globan et al. (2016), Jovicic and Kunovac (2017), Conti et al. (2017) as well as Bobeica and
Jarocinski (2017) which provide an in-depth analyses of the sources of the inflation behaviour
in the U.S., the euro area and the EU new member states. Inspired by these works, we take a
broader perspective on the phenomenon of low inflation in Poland by comparing the conclusions
from the aggregated and disaggregated approach.
The prevailing evidence on the determinants of the low inflation episode in the emerging,
small open economies is scarce. Globan et al. (2016) focus on the ongoing debate regarding
the drivers of inflation in UE new member states. The authors argue that foreign shocks play
a dominant role in explaining the dynamics of consumer prices in the medium-term in the
majority of the analysed economies while in the short run domestic shocks affect inflation to
the major extent. However, from our perspective the study leaves room for further empirical
research. Firstly, the presented evidence does not take into account the low inflation episode
in the European economies which could introduce a qualitative change. Secondly, the authors
identify the structural shocks by employing a mixture of short-run and long-run zero restrictions.
Therefore, the results can be sensitive to the specific assumptions regarding the ordering of
the variables. A similar structural approach – based on the timing restriction – is employed
by Ha�lka and Kot�lowski (2016). Using a two-step procedure and the sample of a battery of
inflation components ending before the period of the protracted deflation in Poland, Ha�lka
and Kot�lowski (2016) find that the sources of inflation fluctuations are country-specific, but
domestic conditions prevail as an important factor behind the developments of consumer prices.
In our approach we alleviate the shortcomings of the Choleski identification scheme by
pursuing a sign restriction identification pattern for our VAR model that enables us to precisely
identify all structural shocks and grant them an economic interpretation. Moreover, due to data
availability we include in our analysis the whole period of low inflation. However, contrary to
the analyses by Globan et al. (2016) as well as Ha�lka and Kot�lowski (2016), we zoom in on
this phenomenon by studying only the Polish case. In this context, our framework is similar to
the approach by Jovicic and Kunovac (2017) who examine in a recent paper the low inflation
episode from the Croatian perspective and find that foreign shocks are relevant drivers of the
Croatian economy. However, one important difference is the cyclical position of the Croatian
economy during the low inflation period – contrary to the Polish case the GDP growth rate has
been deeply negative since the global financial crisis for a prolonged period of time.
The phenomenon of low inflation is investigated thoroughly for advanced economies. In
particular, Conti et al. (2017) argue that with a varying intensity the collapsing oil prices
as well as a significant weakness in the aggregate demand have played a considerable role in
shaping headline inflation rates across main countries of the euro area. The popular puzzles of
missing deflation and missing inflation in the euro area and the U.S. are also investigated by
Bobeica and Jarocinski (2017). The authors employ a conditional forecast exercise based on a
medium-scale Bayesian VAR and a complementary, more parsimonious structural VAR model
to conclude that the inflation development in the studied economies in the immediate wake
of the great financial crisis has been primarily driven by the global determinants, whereas the
6
Narodowy Bank Polski8
Chapter 2
missing inflation episode has been mainly caused by the deplorable domestic demand. They
signal that at the end of their sample waning global demand and the plummeting oil prices
began to contribute to the rising importance of the external developments. Our paper is inspired
by these analyses and presents complementary evidence, as we examine an emerging, small
open European economy tightly connected with the euro area. Moreover, while our preferred
identification scheme follows a similar logic, we introduce some additional restrictions given the
nature of the examined economy. Furthermore, we extend the analysis on a number of inflation
components.
In a broader perspective, we voice our stance on the determinants of inflation in an emerging,
small open economy after the great financial crisis. Firstly, a large strand of literature is devoted
to the relation between inflation and the domestic real activity. In particular, the flattening
of the Phillips curve is exemplified in numerous, prominent studies for advanced economies
(e.g. Musso et al., 2009; Matheson and Stavrev, 2013; Blanchard et al., 2015) implying that the
domestic real activity gradually ceases to impact inflation at the expense of global developments
(e.g. Ciccarelli and Mojon, 2010). Moreover, increasing integration of the European transition
economies has systematically decreased the relevance of the domestic economic conditions at
the advantage of supply shocks in triggering inflation episodes (Petrovic et al., 2011). The
analysis of the new Keynesian Phillips curve in an emerging, small open economy of Poland
(Szafranek, 2017) delivers similar conclusions. With the structural analysis conducted in this
paper we aim to provides further evidence on the relative importance of the global and domestic
factors shaping inflation in Poland.
Secondly, the Polish economy becomes increasingly open and vulnerable to the varying
global economic conditions or turmoil in commodity prices. From the theoretical standpoint,
increasing openness and the tightening of the integration through trade diminished mark-ups
and lowers inflation across economies (Melitz and Ottaviano, 2008). A significant body of
empirical literature postulates that inflation measured at the national level becomes a globally
determined phenomenon which reduces its average level and variability (Mumtaz and Surico,
2012). In an influential analysis, Borio and Filardo (2007) argue that inflation in many countries
is heavily impacted by the global demand and supply factors. Moreover they suggest that
exchange rate pass through weakens which has been proved for Poland (Kapuscinski et al., 2016)
as well as the euro area (Comunale and Kunovac, 2017). The prevailing paradigm of the global
inflation is postulated also by, inter alia, Ciccarelli and Mojon (2010), Aastveit et al. (2016) as
well as Ferroni and Mojon (2016) who state that a dominant fraction (around 50-70%) of the
variance of national inflation rates remains under a heavy influence of the global component.
Recent inflation variability is typically associated with the substantial decline in the commodity
prices (e.g. Conti et al., 2017; Bobeica and Jarocinski, 2017) as well as a sluggish international
trade growth after the great trade collapse (Lewis and De Schryder, 2015; Constantinescu et al.,
2015; International Monetary Fund, 2016) which has affected the prices of the tradable goods.
Moreover, increasing importance of the global value chains leading to rising direct and indirect
competition puts higher priority on the global economic slack (Auer et al., 2017). Finally,
spillovers between large developed economies as well as small, open emerging economies can
markedly influence inflation (Ha�lka and Szafranek, 2016). In the paper we connect with these
notions by inspecting the extent of headline inflation as well as its components affected by the
external developments.
Finally, an important question arises whether the policy conclusions drawn from the
7
9NBP Working Paper No. 267
Literature review
analysis conducted on the aggregated data and disaggregated data are concurrent. Several
studies examine the issue of disaggregation in the context of the forecast accuracy of inflation
indices (e.g Duarte and Rua, 2007; Bermingham and D’Agostino, 2014). A relatively limited
strand of literature dwells on the dependencies between the macroeconomic conditions and the
disaggregated price development. However, empirical analyses conducted on the disaggregated
data reveal that not all inflation components react in the same manner. Firstly, Bryan and
Meyer (2010) point out that the sensitivity of individual prices may differ. Moreover, the prices
of certain goods and services react differently to the changes in the domestic real economic
activity. Froehling and Lommatzsch (2011) as well as Ha�lka and Kot�lowski (2014) show that
a sizeable fraction of inflation components remains resilient to the changes in the domestic
economic slack in the euro area countries and in Poland. Finally, Monacelli and Sala (2009)
show that a level of aggregation matters for policy conclusions. Their evaluation of a lower
bound for the contribution of international factors at 15-30% of the variance of consumer prices
at disaggregated level stands in contrast with the evidence put forward by Ciccarelli and Mojon
(2010). In our paper we compare if the policy conclusions from disaggregated approach and
aggregated approach are consistent.
8
missing inflation episode has been mainly caused by the deplorable domestic demand. They
signal that at the end of their sample waning global demand and the plummeting oil prices
began to contribute to the rising importance of the external developments. Our paper is inspired
by these analyses and presents complementary evidence, as we examine an emerging, small
open European economy tightly connected with the euro area. Moreover, while our preferred
identification scheme follows a similar logic, we introduce some additional restrictions given the
nature of the examined economy. Furthermore, we extend the analysis on a number of inflation
components.
In a broader perspective, we voice our stance on the determinants of inflation in an emerging,
small open economy after the great financial crisis. Firstly, a large strand of literature is devoted
to the relation between inflation and the domestic real activity. In particular, the flattening
of the Phillips curve is exemplified in numerous, prominent studies for advanced economies
(e.g. Musso et al., 2009; Matheson and Stavrev, 2013; Blanchard et al., 2015) implying that the
domestic real activity gradually ceases to impact inflation at the expense of global developments
(e.g. Ciccarelli and Mojon, 2010). Moreover, increasing integration of the European transition
economies has systematically decreased the relevance of the domestic economic conditions at
the advantage of supply shocks in triggering inflation episodes (Petrovic et al., 2011). The
analysis of the new Keynesian Phillips curve in an emerging, small open economy of Poland
(Szafranek, 2017) delivers similar conclusions. With the structural analysis conducted in this
paper we aim to provides further evidence on the relative importance of the global and domestic
factors shaping inflation in Poland.
Secondly, the Polish economy becomes increasingly open and vulnerable to the varying
global economic conditions or turmoil in commodity prices. From the theoretical standpoint,
increasing openness and the tightening of the integration through trade diminished mark-ups
and lowers inflation across economies (Melitz and Ottaviano, 2008). A significant body of
empirical literature postulates that inflation measured at the national level becomes a globally
determined phenomenon which reduces its average level and variability (Mumtaz and Surico,
2012). In an influential analysis, Borio and Filardo (2007) argue that inflation in many countries
is heavily impacted by the global demand and supply factors. Moreover they suggest that
exchange rate pass through weakens which has been proved for Poland (Kapuscinski et al., 2016)
as well as the euro area (Comunale and Kunovac, 2017). The prevailing paradigm of the global
inflation is postulated also by, inter alia, Ciccarelli and Mojon (2010), Aastveit et al. (2016) as
well as Ferroni and Mojon (2016) who state that a dominant fraction (around 50-70%) of the
variance of national inflation rates remains under a heavy influence of the global component.
Recent inflation variability is typically associated with the substantial decline in the commodity
prices (e.g. Conti et al., 2017; Bobeica and Jarocinski, 2017) as well as a sluggish international
trade growth after the great trade collapse (Lewis and De Schryder, 2015; Constantinescu et al.,
2015; International Monetary Fund, 2016) which has affected the prices of the tradable goods.
Moreover, increasing importance of the global value chains leading to rising direct and indirect
competition puts higher priority on the global economic slack (Auer et al., 2017). Finally,
spillovers between large developed economies as well as small, open emerging economies can
markedly influence inflation (Ha�lka and Szafranek, 2016). In the paper we connect with these
notions by inspecting the extent of headline inflation as well as its components affected by the
external developments.
Finally, an important question arises whether the policy conclusions drawn from the
7
Narodowy Bank Polski10
3 Methodology and data
In this section we introduce the vector autoregression (VAR) model in both the reduced
and the structural form. In the second step, we discuss briefly the Bayesian estimation we
employ. Next, we present the data used for the estimation in the aggregate as well as the
disaggregate approaches. With this respect, we introduce a simple methodology of marking
inflation components as sensitive or resilient to the identified shocks and briefly discuss an
alternative approach based on the traditional, classic estimation. We end this section by devoting
considerable attention to the identification of the economically interpretable structural shocks
via the combination of zero and sign restrictions.
3.1 The model and the data
Let yt = (yt,1, . . . , yt,n) denote a n× 1 vector of macroeconomic variables. Firstly, we start
by establishing a reduced-form VAR model describing the joint dynamics of the distinguished
variables as given in equation (1):
yt = B1yt−1 +B2yt−2 + · · ·+Bpyt−p + Cxt + �t et ∼ N(0,Σn) t = 1, . . . , T (1)
where: Bj is a n× n matrix of fixed parameters for 1 ≤ j ≤ p, C is a matrix of fixed coefficients
of dimension n×m for the vector of exogenous regressors xt of size m× 1, �t = (�1,t, . . . , �n,t)
denotes the vector of residuals following the multivariate normal distribution with zero mean
and the variance-covariance matrix Σn. The sample size is denoted by T .
Secondly, to distinguish the structural shocks we introduce a structural version of the
model (1). The joint dynamics of the variables in a structural vector autoregression is described
by the following system of linear equations:
A0yt = A1yt−1 + · · ·+Apyt−p +Dxt + νt νt ∼ N(0, In) t = 1, . . . , T (2)
where: A0 is invertible and νt represents the vector of structural innovations with zero mean
and the variance-covariance matrix In. This implies that the shocks are mutually orthogonal
(uncorrelated) and arise independently. The link between the structural model (2) with its
reduced-form representation (1) is given by the following set of equations: Bj = A−10 Aj ,
C = A−10 D and �t = A−1
0 νt. As a results, E(νtνTt ) = Ω = (AT
0 A0)−1. Identification of the
structural shocks is conducted with means of the combination of zero and sign restrictions
imposed upon the contemporaneous matrix A0. We discuss it in detail in the next section.
Due to the relative scarcity of observations we estimate the model by employing the Bayesian
framework. For the estimation we assume the natural-conjugate (i.e the Normal-Wishart) prior
in the tradition of Sims and Zha (1998) with most of the hyperparameters in line with Bobeica
and Jarocinski (2017). In particular, we fix the value of the own first lag coefficient to β0 = 0.8,
set the overall tightness λ1 = 0.05, the cross-specific weighting λ2 = 0.5, the lag decay factor
λ3 = 1, the exogenous variable tightness λ4 = 2.5× 10³. Additionally, we include the weight on
the no-cointegration (i.e the sum-of-coefficient) dummy observation prior λ5 = 2 and the weight
on the one unit root dummy observation prior (i.e. the initial dummy observation) λ6 = 2. As a
robustness, we experiment with different priors and various set of hyperparameters, but broadly
they deliver qualitatively similar results. In all estimations we rely on the routines developed
by Dieppe et al. (2016) where further technical aspects regarding the estimation of the VAR
models in a Bayesian manner as well as imposing zero and sign restrictions are thoroughly
9
11NBP Working Paper No. 267
Chapter 3
reported. Since computing a considerable number of structural models identified with the means
of zero and sign restrictions is a time-consuming process, we set the total number of draws to
2500 with 1500 burn-in iterations.
Our preferred VAR model includes six variables (n = 6) and a constant term (m = 1). In
the model we include the nominal effective exchange rate, the short-term interest rate, the oil
prices, the ratio between the real GDP in Poland and the rest-of-the-world GDP (approximated
by the real GDP of the twenty major economies), the domestic output gap and a selected price
index. The interest rate, the output gap as well as the share indicating the relative size of
the Polish in the global economy enter the model in levels. The remaining three variables are
log-transformed first. Additionally, we have seasonally adjusted variables with clear seasonal
patters using the Arima-X13-Seats procedure. The data cover the period 2002Q1-2016Q4
(T = 60). Although the sample is relatively short, employing the Bayesian framework helps to
alleviate the problem of overparametrization of the model, present in the traditional approach.
As we utilize quarterly data we set the maximum lag of the reduced-form VAR model to p = 4.
We start by estimating the model for the headline inflation. As central banks frequently
downplay the direct impact of foreign developments on inflation, in the second step we inspect
the drivers of the core inflation defined as the headline inflation net of food, non-alcoholic
beverages and energy prices which should, at least in principle, better reflect the medium-term
inflationary pressure. Thirdly, in the disaggregate analysis we re-estimate the specified model
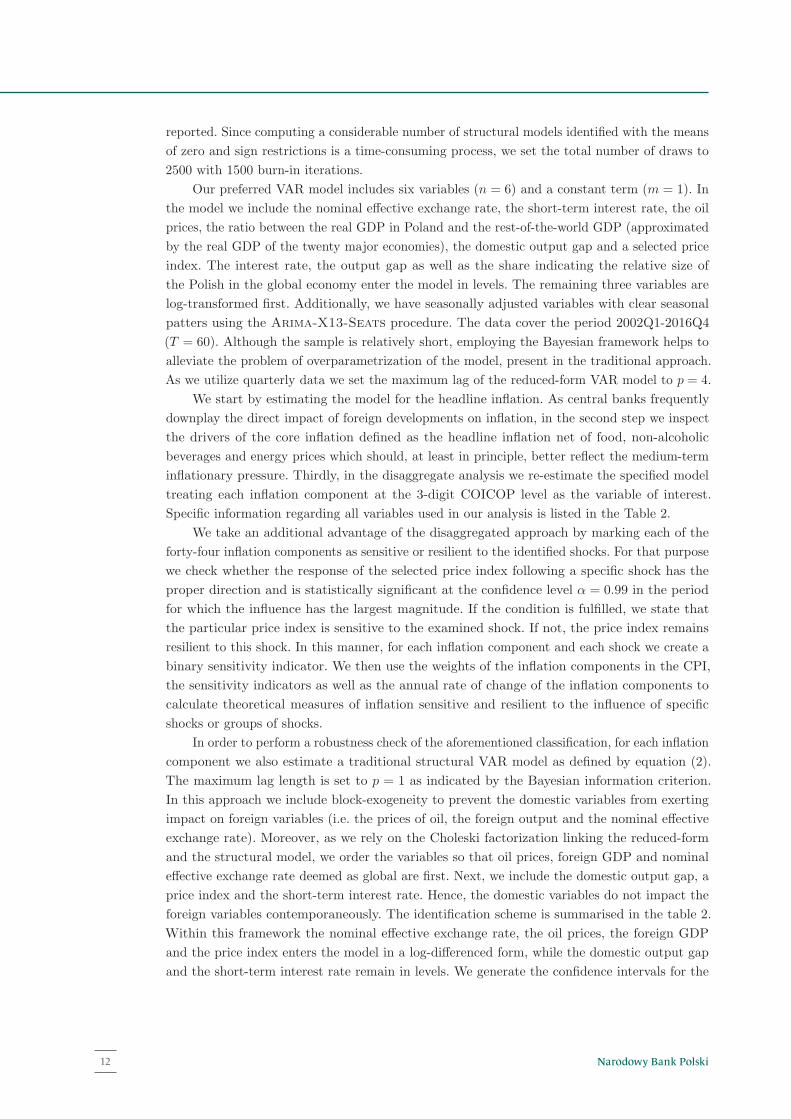
treating each inflation component at the 3-digit COICOP level as the variable of interest.
Specific information regarding all variables used in our analysis is listed in the Table 2.
We take an additional advantage of the disaggregated approach by marking each of the
forty-four inflation components as sensitive or resilient to the identified shocks. For that purpose
we check whether the response of the selected price index following a specific shock has the
proper direction and is statistically significant at the confidence level α = 0.99 in the period
for which the influence has the largest magnitude. If the condition is fulfilled, we state that
the particular price index is sensitive to the examined shock. If not, the price index remains
resilient to this shock. In this manner, for each inflation component and each shock we create a
binary sensitivity indicator. We then use the weights of the inflation components in the CPI,
the sensitivity indicators as well as the annual rate of change of the inflation components to
calculate theoretical measures of inflation sensitive and resilient to the influence of specific
shocks or groups of shocks.
In order to perform a robustness check of the aforementioned classification, for each inflation
component we also estimate a traditional structural VAR model as defined by equation (2).
The maximum lag length is set to p = 1 as indicated by the Bayesian information criterion.
In this approach we include block-exogeneity to prevent the domestic variables from exerting
impact on foreign variables (i.e. the prices of oil, the foreign output and the nominal effective
exchange rate). Moreover, as we rely on the Choleski factorization linking the reduced-form
and the structural model, we order the variables so that oil prices, foreign GDP and nominal
effective exchange rate deemed as global are first. Next, we include the domestic output gap, a
price index and the short-term interest rate. Hence, the domestic variables do not impact the
foreign variables contemporaneously. The identification scheme is summarised in the table 2.
Within this framework the nominal effective exchange rate, the oil prices, the foreign GDP
and the price index enters the model in a log-differenced form, while the domestic output gap
and the short-term interest rate remain in levels. We generate the confidence intervals for the
10
Narodowy Bank Polski12
Table 1: Abbreviations of variables used alond with their expansions and additional in-
formation.
Variable Explanation Transformation Source
NEER Nominal Effective Exchange Rate ln(·) BIS
WIBOR Three-month Warsaw Interbank Offered Rate in level Reuters
OIL Spot oil prices ln(·) IMF
ROW Real GDP in the G20 economies sa, in level OECD
RGDP Real GDP in Poland sa, in level NBP
PLRT Ratio of the Polish real GDP to the G20 real GDP in level OECD, NBP
OG Output gap in Poland derived from a production function in % NBP
CPI Headline inflation index sa, ln(·) CSO
CORE Core inflation index sa, ln(·) NBP
C011 Food inflation index sa, ln(·) CSO
C012 Non-alcoholic beverages inflation index sa, ln(·) CSO
C021 Alcoholic beverages inflation index sa, ln(·) CSO
C022 Tobacco inflation index sa, ln(·) CSO
C031 Clothing inflation index sa, ln(·) CSO
C032 Footwear inflation index sa, ln(·) CSO
C041 Actual rentals for housing inflation index sa, ln(·) CSO
C043 Maintenance and repair of the dwelling inflation index sa, ln(·) CSO
C044 Water supply and miscellaneous services relating to the dwelling inflation index sa, ln(·) CSO
C045 Electricity, gas and other fuels inflation index sa, ln(·) CSO
C051 Furniture and furnishings, carpets and other floor coverings inflation index sa, ln(·) CSO
C052 Household textiles inflation index sa, ln(·) CSO
C053 Household appliances inflation index sa, ln(·) CSO
C054 Glassware, tableware and household utensils inflation index sa, ln(·) CSO
C055 Tools and equipment for house and garden inflation index sa, ln(·) CSO
C056 Goods and services for routine household maintenance inflation index sa, ln(·) CSO
C061 Medical products, appliances and equipment inflation index sa, ln(·) CSO
C062 Out-patient services inflation index sa, ln(·) CSO
C063 Hospital services inflation index sa, ln(·) CSO
C071 Purchase of vehicles inflation index sa, ln(·) CSO
C072 Operation of personal transport equipment inflation index sa, ln(·) CSO
C073 Transport services inflation index sa, ln(·) CSO
C081 Postal services inflation index sa, ln(·) CSO
C082 Telephone and telefax equipment inflation index sa, ln(·) CSO
C083 Telephone and telefax services inflation index sa, ln(·) CSO
C091 Audio-visual, photographic and information processing equipment inflation index sa, ln(·) CSO
C092 Other major durables for recreation and culture inflation index sa, ln(·) CSO
C093 Other recreational items and equipment, gardens and pets inflation index sa, ln(·) CSO
C094 Recreational and cultural services inflation index sa, ln(·) CSO
C095 Newspapers, books and stationery inflation index sa, ln(·) CSO
C096 Package holidays inflation index sa, ln(·) CSO
C101 Pre-primary and primary education inflation index sa, ln(·) CSO
C102 Secondary education inflation index sa, ln(·) CSO
C103 Post-secondary non-tertiary education inflation index sa, ln(·) CSO
C104 Tertiary education inflation index sa, ln(·) CSO
C105 Education not definable by level inflation index sa, ln(·) CSO
C111 Catering services inflation index sa, ln(·) CSO
C112 Accommodation services inflation index sa, ln(·) CSO
C121 Personal care inflation index sa, ln(·) CSO
C123 Personal effects n.e.c. inflation index sa, ln(·) CSO
C124 Social protection inflation index sa, ln(·) CSO
C125 Insurance inflation index sa, ln(·) CSO
C126 Financial services n.e.c. inflation index sa, ln(·) CSO
C127 Other services n.e.c. inflation index sa, ln(·) CSO
Note: In the table sa denotes a seasonally adjusted variable, whereas ln(·) signals that the variable enters the equation in logarithms.
Source: own elaborations.
impulse responses at the significance level α = 0.99 using 5000 bootstrap replications.
3.2 The identification scheme
The identification of the structural shocks based on the Choleski factorisation is character-
ized by several important caveats. Firstly, as it relies on the timing restriction the identified
shocks are not based on clear theoretical foundations and cannot be strictly interpreted. Secondly,
11
13NBP Working Paper No. 267
Methodology and data
the ordering of the variables may impact the estimation outcomes in the Choleski identifica-
tion scheme. Identification via sign restrictions allow to distinguish a full set of economically
interpretable structural shocks and the order of the variables entering the VAR model does not
affect the outcomes. In this paper we adopt the identification strategy based on a mixture of
zero and sign restrictions recently exploited by Bobeica and Jarocinski (2017). We introduce
small refinements due to the nature of the examined economy and identify the exchange rate
shock, the monetary policy shock, the global oil supply shock, the foreign demand shock, the
domestic demand shock and the domestic supply shock. Our preferred identification scheme I
is summarized in the table 2. We apply the restrictions upon the contemporaneous matrix A0.
We do not extend the restrictions on any further periods as Canova and Paustian (2011) show
that imposing the restrictions upon the contemporaneous relationships between the variables
mitigates several types of model misspecification. During the estimation we use the routines
implemented by Dieppe et al. (2016) that follow the proposal by Arias et al. (2014).
The first shock is an exchange rate shock. Following Bobeica and Jarocinski (2017) we
identify this shock using the timing restriction – an appreciation of the exchange rate is
exogenous and has no contemporaneous impact on any other variable in the system. Moreover,
as we report in the results the importance of this shock in explaining inflation is minor. This
allows us to downplay the possible misspecification pointed out by Conti et al. (2017) who
argue that identifying the shock in this particular manner may capture several foreign shocks,
for instance a monetary policy shock in the U.S. (or in the euro area for that matter).
We define the second shock as a conventional monetary policy shock. Recursively identified,
the shock immediately increases the short-term interest rates and adjusts the nominal effective
exchange rate. Due to the imposed zero restrictions, other variables in the system can be
influenced by this shock with a lag of one period.
The identification of the remaining four shocks relies on the sign restrictions. Firstly, we
assume that a contractionary global oil supply shock leads to the increase in the prices of oil.
Obviously, direct effects of higher oil prices emerge instantly and feed into the selected inflation
measure. Moreover, higher oil prices pick up energy costs which propagate to the production
costs of firms, inducing indirect effects and exerting further upward pressure on inflation.
Evidence for the euro area suggests that the direct effects have increased at the expense of
indirect and second round effects (Alvarez et al., 2011), presumably due to the increased central
bank credibility. On the other hand, Szafranek (2017) points out that the importance of the
indirect effects in the period of low inflation in Poland has magnified. In any case, the identified
oil shock should include both the direct as well as indirect effects of the fluctuation of oil
prices. Furthermore, following a negative (positive) oil supply shock the output should decrease
(increase) quicker than the potential output resulting in the proper adjustment of the output
gap. Moreover, despite the dilemma an oil supply shock poses for the monetary authorities,
especially in the emerging, open economies highly dependent on the evolution of commodity
prices (Holtemoller and Mallick, 2016), we assume that the central bank in Poland does not
react initially to the shock perceived as transitory. This assumption is justified by the minutes
published by the Polish central bank in times of swiftly rising commodity prices (Narodowy
Bank Polski, 2007, 2008). Hence, opposite to Conti et al. (2017) we restrict the response of the
short-term interest rate to zero. Finally, given the correlation between the oil price shock and
the nominal exchange rate we force the nominal effective exchange rate to appreciate following
a negative oil supply shock. The response of the variable measuring the relative importance of
12
the Polish economy with respect to the global economy is left unconstrained.
Secondly, a crucial assumption is connected with distinguishing the global demand shock
from the domestic demand shock. We rely on the identification scheme presented by Corsetti
et al. (2014) as well as Bobeica and Jarocinski (2017). In particular, in our model we assume
that since a global shock originates abroad it should primarily impact the foreign economy.
As a result, we expect the relative size of the domestic economy with respect to the global
economy to diminish. Still, due to the openness of the domestic economy, an increase in the
foreign demand should lead to a higher domestic output gap exerting an upward pressure
on prices. Moreover, a positive global demand shock should lead to the increase in the oil
prices since the global demand rises. In this context, Baumeister and Kilian (2016) as well
as Caldara et al. (2016) point out that the movements in oil prices do not only suffer from
strategic decisions of producers and emerging technology, but are heavily influenced by the
adjustments in the demand as well. That said, the recent slowdown in the international trade
(Lewis and De Schryder, 2015) and the subdued global activity has not only curbed the oil
prices (Baumeister and Kilian, 2016) but may have affected the prices of tradable goods as well,
leading to a more severe reaction of the headline inflation. In identifying the global demand
shock we acknowledge the caveat aired by Bobeica and Jarocinski (2017) who argue that a
shock global in its nature may in fact increase the demand for domestic products by a wider
margin than for the foreign products. This would induce a positive co-movement between the
domestic output gap and the share of the domestic economy in the world economy and should
be labelled as a domestic shock. As a result, the following identification may deem some foreign
shocks as domestic.
Thirdly, we expect a domestic demand shock to increase the relative share of the Polish
output in the foreign output as the shock originates domestically and influences primarily the
small, open economy. Due to the rise in the demand, the consumer prices should pick up as
well. Moreover, opposite to the identification schemes provided for the euro area (Bobeica and
Jarocinski, 2017; Conti et al., 2017) given the size of the Polish economy we restrict a domestic
demand shock not to influence the prices of oil. Finally, we do not impose any restrictions on
the responses of the nominal effective exchange rate or the short-term interest rate following
the identified demand shocks.
Fourthly, in line with the conventional approach we disentangle the domestic supply shock
from the domestic demand shock by restricting the reaction of inflation and the real activity
following the appearance of the shocks. Whereas for the demand shock we force the response of
the output gap and inflation to be positive, we assume that after a positive domestic supply
shock the output gap should increase as it takes time for the potential output to adjust while
the prices should decrease due to lower production costs and higher profit margins. Again, we
label the shock domestic due to the relative increase in the share of the Polish output in the
foreign output. Finally, we assume that the nominal effective exchange rate should appreciate
following a domestic supply shock.
Throughout the analysis we focus our attention on the relative importance of each shock
in contributing to the overall inflation fluctuations in the period of low inflation (2012Q1-
2016Q4). For that purpose we employ the historical decomposition delivering the relative
contribution of each structural shock to the observed development of the headline and core
inflation measures. However, we inspect also the relative importance of shocks in a broader
manner by classifying them into somewhat simpler categories: global, domestic, demand and
13
Narodowy Bank Polski14
the Polish economy with respect to the global economy is left unconstrained.
Secondly, a crucial assumption is connected with distinguishing the global demand shock
from the domestic demand shock. We rely on the identification scheme presented by Corsetti
et al. (2014) as well as Bobeica and Jarocinski (2017). In particular, in our model we assume
that since a global shock originates abroad it should primarily impact the foreign economy.
As a result, we expect the relative size of the domestic economy with respect to the global
economy to diminish. Still, due to the openness of the domestic economy, an increase in the
foreign demand should lead to a higher domestic output gap exerting an upward pressure
on prices. Moreover, a positive global demand shock should lead to the increase in the oil
prices since the global demand rises. In this context, Baumeister and Kilian (2016) as well
as Caldara et al. (2016) point out that the movements in oil prices do not only suffer from
strategic decisions of producers and emerging technology, but are heavily influenced by the
adjustments in the demand as well. That said, the recent slowdown in the international trade
(Lewis and De Schryder, 2015) and the subdued global activity has not only curbed the oil
prices (Baumeister and Kilian, 2016) but may have affected the prices of tradable goods as well,
leading to a more severe reaction of the headline inflation. In identifying the global demand
shock we acknowledge the caveat aired by Bobeica and Jarocinski (2017) who argue that a
shock global in its nature may in fact increase the demand for domestic products by a wider
margin than for the foreign products. This would induce a positive co-movement between the
domestic output gap and the share of the domestic economy in the world economy and should
be labelled as a domestic shock. As a result, the following identification may deem some foreign
shocks as domestic.
Thirdly, we expect a domestic demand shock to increase the relative share of the Polish
output in the foreign output as the shock originates domestically and influences primarily the
small, open economy. Due to the rise in the demand, the consumer prices should pick up as
well. Moreover, opposite to the identification schemes provided for the euro area (Bobeica and
Jarocinski, 2017; Conti et al., 2017) given the size of the Polish economy we restrict a domestic
demand shock not to influence the prices of oil. Finally, we do not impose any restrictions on
the responses of the nominal effective exchange rate or the short-term interest rate following
the identified demand shocks.
Fourthly, in line with the conventional approach we disentangle the domestic supply shock
from the domestic demand shock by restricting the reaction of inflation and the real activity
following the appearance of the shocks. Whereas for the demand shock we force the response of
the output gap and inflation to be positive, we assume that after a positive domestic supply
shock the output gap should increase as it takes time for the potential output to adjust while
the prices should decrease due to lower production costs and higher profit margins. Again, we
label the shock domestic due to the relative increase in the share of the Polish output in the
foreign output. Finally, we assume that the nominal effective exchange rate should appreciate
following a domestic supply shock.
Throughout the analysis we focus our attention on the relative importance of each shock
in contributing to the overall inflation fluctuations in the period of low inflation (2012Q1-
2016Q4). For that purpose we employ the historical decomposition delivering the relative
contribution of each structural shock to the observed development of the headline and core
inflation measures. However, we inspect also the relative importance of shocks in a broader
manner by classifying them into somewhat simpler categories: global, domestic, demand and
13
supply. From the perspective of a small, open economy we assume that an oil supply shock, a
foreign demand as well as a nominal effective exchange shocks rate are global in their nature.
On the other hand, we perceive a domestic demand, a domestic supply and a monetary policy
shocks as domestic. Moreover, we group domestic and foreign demand, exchange rate and
monetary policy shocks as demand shocks with the rest being categorized as supply ones.
Table 2: Identification scheme of shocks in the VAR models.
I. Sign restriction identification scheme
Exchange rate Monetary policy Global oil supply Global demand Domestic demand Domestic supply
shock shock shock shock shock shock
NEER + · + · · +
WIBOR 0 + 0 · · ·OIL 0 0 + + 0 ·
PLRT 0 0 · - + +
OG 0 0 - + + +
INF 0 0 + + + -
II. Choleski identification scheme
Global Global Global Domestic Own Domestic
shock shock shock shock shock shock
OIL + 0 0 0 0 0
ROW · + 0 0 0 0
NEER · · + 0 0 0
OG · · · + 0 0
INF · · · · + 0
WIBOR · · · · · +
Note: The table presents the identification schemes employed to identify the shocks in the VAR model. The baseline model uses the
combination of zero and sign restriction identification scheme. Choleski recursive identification pattern is employed for robustness.
In the table · denotes unconstrained reaction, + denotes an increase and − denotes a decrease of the response of a given variable
following a specific shock. All restrictions are imposed upon the contemporaneous matrix A0. Source: own elaborations.
14
15NBP Working Paper No. 267
Methodology and data

supply. From the perspective of a small, open economy we assume that an oil supply shock, a
foreign demand as well as a nominal effective exchange shocks rate are global in their nature.
On the other hand, we perceive a domestic demand, a domestic supply and a monetary policy
shocks as domestic. Moreover, we group domestic and foreign demand, exchange rate and
monetary policy shocks as demand shocks with the rest being categorized as supply ones.
Table 2: Identification scheme of shocks in the VAR models.
I. Sign restriction identification scheme
Exchange rate Monetary policy Global oil supply Global demand Domestic demand Domestic supply
shock shock shock shock shock shock
NEER + · + · · +
WIBOR 0 + 0 · · ·OIL 0 0 + + 0 ·
PLRT 0 0 · - + +
OG 0 0 - + + +
INF 0 0 + + + -
II. Choleski identification scheme
Global Global Global Domestic Own Domestic
shock shock shock shock shock shock
OIL + 0 0 0 0 0
ROW · + 0 0 0 0
NEER · · + 0 0 0
OG · · · + 0 0
INF · · · · + 0
WIBOR · · · · · +
Note: The table presents the identification schemes employed to identify the shocks in the VAR model. The baseline model uses the
combination of zero and sign restriction identification scheme. Choleski recursive identification pattern is employed for robustness.
In the table · denotes unconstrained reaction, + denotes an increase and − denotes a decrease of the response of a given variable
following a specific shock. All restrictions are imposed upon the contemporaneous matrix A0. Source: own elaborations.
14
Narodowy Bank Polski16
4 Results
In this section we present the results of the conducted analysis. Firstly, we discuss the
determinants of the recent headline and core inflation behaviour relying on the historical
decomposition – a recently popular method of identifying the sources of low inflation in the U.S.
and the euro area countries (e.g. Bobeica and Jarocinski, 2017; Conti et al., 2017). Secondly,
taking a cross-section perspective across inflation components we inspect the relative importance
of the drivers of the consumer prices in the period of excessive disinflation and deflation. Thirdly,
we report the indices of inflation sensitive and resilient to the identified shocks. Finally, we
present the robustness check based on the estimation of the SVAR models in a traditional
manner.
4.1 Inflation determinants during low inflation
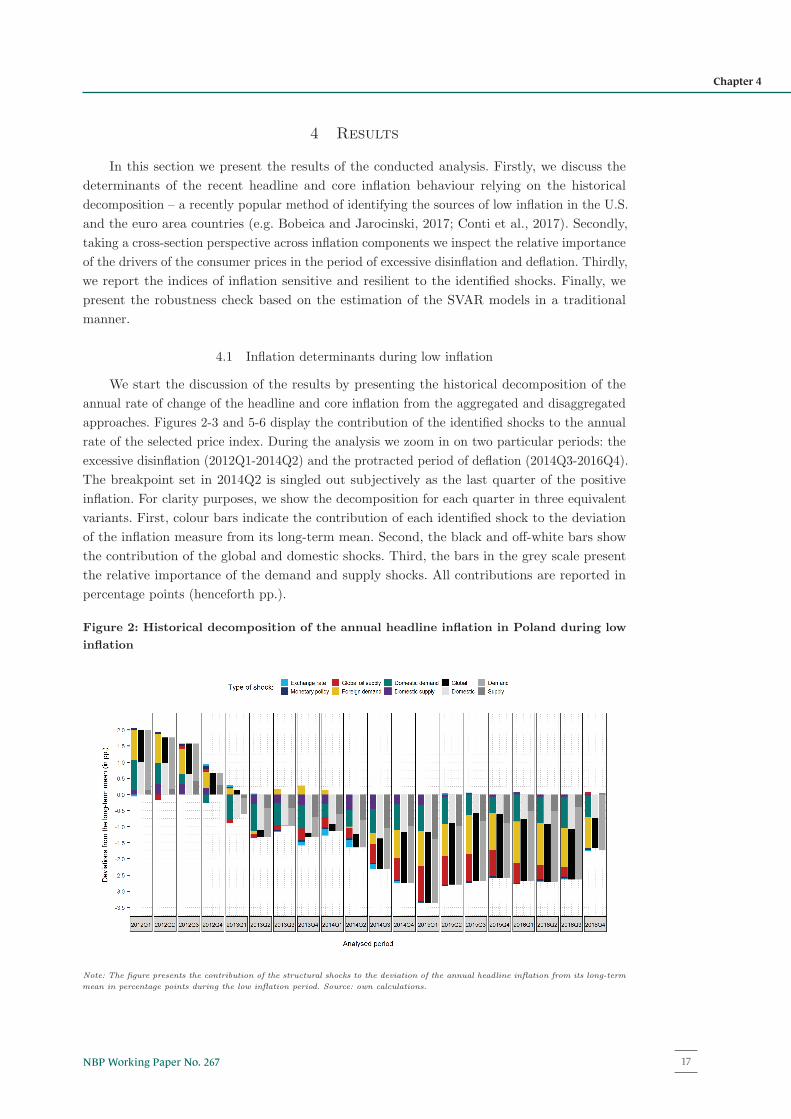
We start the discussion of the results by presenting the historical decomposition of the
annual rate of change of the headline and core inflation from the aggregated and disaggregated
approaches. Figures 2-3 and 5-6 display the contribution of the identified shocks to the annual
rate of the selected price index. During the analysis we zoom in on two particular periods: the
excessive disinflation (2012Q1-2014Q2) and the protracted period of deflation (2014Q3-2016Q4).
The breakpoint set in 2014Q2 is singled out subjectively as the last quarter of the positive
inflation. For clarity purposes, we show the decomposition for each quarter in three equivalent
variants. First, colour bars indicate the contribution of each identified shock to the deviation
of the inflation measure from its long-term mean. Second, the black and off-white bars show
the contribution of the global and domestic shocks. Third, the bars in the grey scale present
the relative importance of the demand and supply shocks. All contributions are reported in
percentage points (henceforth pp.).
Figure 2: Historical decomposition of the annual headline inflation in Poland during low
inflation
Note: The figure presents the contribution of the structural shocks to the deviation of the annual headline inflation from its long-term
mean in percentage points during the low inflation period. Source: own calculations.
15
17NBP Working Paper No. 267
Chapter 4

Regardless of the type of the analysis as well as the preferred inflation measure, the
presented historical decompositions have four common features. Firstly, they reveal that the
deteriorating domestic conditions should be held responsible for the substantial decline in
inflation since 2012 as the domestic output gap has considerably widened following a transitory
slowdown in the domestic economy. Secondly, during deflation the relative downturn in the
global economic conditions as well as plummeting oil prices have played a predominant role in
explaining the fall in consumer prices. Moreover, supposing the contribution of the global shock
in a counter-factual analysis was null, the deflation in the Polish economy would not appear.
Hence, we conclude that deflation has been an entirely imported phenomenon. Thirdly, the
monetary policy has remained neutral throughout the whole period of low inflation. Lastly, the
exchange rate shock plays a minor role in shaping the nominal fluctuations in Poland supporting
the conclusions of the analysis of the exchange rate pass-through conducted by Kapuscinski
et al. (2016).
Our results for the small open economy are consistent with previous findings in the
empirical literature. During the low inflation period the contribution of the global shocks has
been marginally larger and explained more than 50% of the total deviation of the headline and
core inflation from their long-term means. Although the impact of foreign factors on inflation
has increased, domestic conditions have prevailed as a significant determinant of consumer
prices. Finally, our estimate for the influence of the global shock resides within the bands
provided by recent empirical studies (50-70%) as argued by Aastveit et al. (2016) as well as
Ferroni and Mojon (2016). This indicates that during low inflation a structural break in the
mechanism of setting prices has not emerged. However, at a disaggregated level we provide
evidence similar to Monacelli and Sala (2009) pointing out a considerable heterogeneity in the
sensitivity of inflation components to the identified shocks. We now discuss the results in more
detail.
Figure 3: Historical decomposition of the annual core inflation in Poland during low
inflation
Note: The figure presents the contribution of the structural shocks to the deviation of the annual core inflation from its long-term
mean in percentage points during the low inflation period. Source: own calculations.
16
Narodowy Bank Polski18
The analysis conducted for the headline and core inflation in the aggregated approach
indicates that the excessive disinflation has been primarily caused by the abating demand
shocks as illustrated on figures 2-3. However, although their relative strength has systematically
decreased over time, they have prevailed a significant drivers of consumer prices. Breaking
down the aggregated shocks into the originally identified ones, we conclude that the main factor
behind the diminishing headline inflation rate has been the systematically fading domestic
demand. Furthermore, since the fourth quarter of 2012 its contribution has turned and remained
negative reflecting the persistently inadequate real activity in Poland, despite the observed
stable economic growth. In particular, the impact of the domestic demand shock has been largest
in 2013 accounting for around 54% of the deviation from the long-term mean and lowering
headline inflation by approximately 0.8 pp. This has coincided with the decrease in the domestic
output gap to around -3%. Further fall in the inflation rate has been exacerbated by the waning
global demand that only occasionally has turned positive as well as slightly decreasing oil prices.
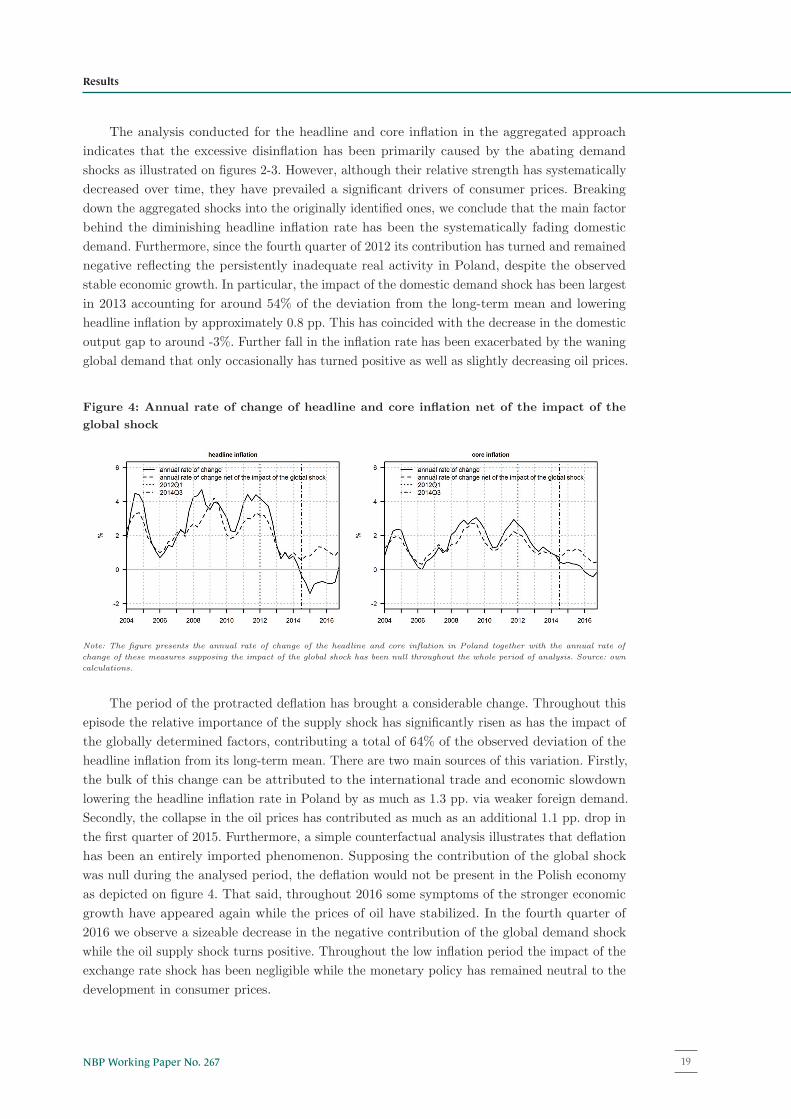
Figure 4: Annual rate of change of headline and core inflation net of the impact of the
global shock
Note: The figure presents the annual rate of change of the headline and core inflation in Poland together with the annual rate of
change of these measures supposing the impact of the global shock has been null throughout the whole period of analysis. Source: own
calculations.
The period of the protracted deflation has brought a considerable change. Throughout this
episode the relative importance of the supply shock has significantly risen as has the impact of
the globally determined factors, contributing a total of 64% of the observed deviation of the
headline inflation from its long-term mean. There are two main sources of this variation. Firstly,
the bulk of this change can be attributed to the international trade and economic slowdown
lowering the headline inflation rate in Poland by as much as 1.3 pp. via weaker foreign demand.
Secondly, the collapse in the oil prices has contributed as much as an additional 1.1 pp. drop in
the first quarter of 2015. Furthermore, a simple counterfactual analysis illustrates that deflation
has been an entirely imported phenomenon. Supposing the contribution of the global shock
was null during the analysed period, the deflation would not be present in the Polish economy
as depicted on figure 4. That said, throughout 2016 some symptoms of the stronger economic
growth have appeared again while the prices of oil have stabilized. In the fourth quarter of
2016 we observe a sizeable decrease in the negative contribution of the global demand shock
while the oil supply shock turns positive. Throughout the low inflation period the impact of the
exchange rate shock has been negligible while the monetary policy has remained neutral to the
development in consumer prices.
17
19NBP Working Paper No. 267
Results
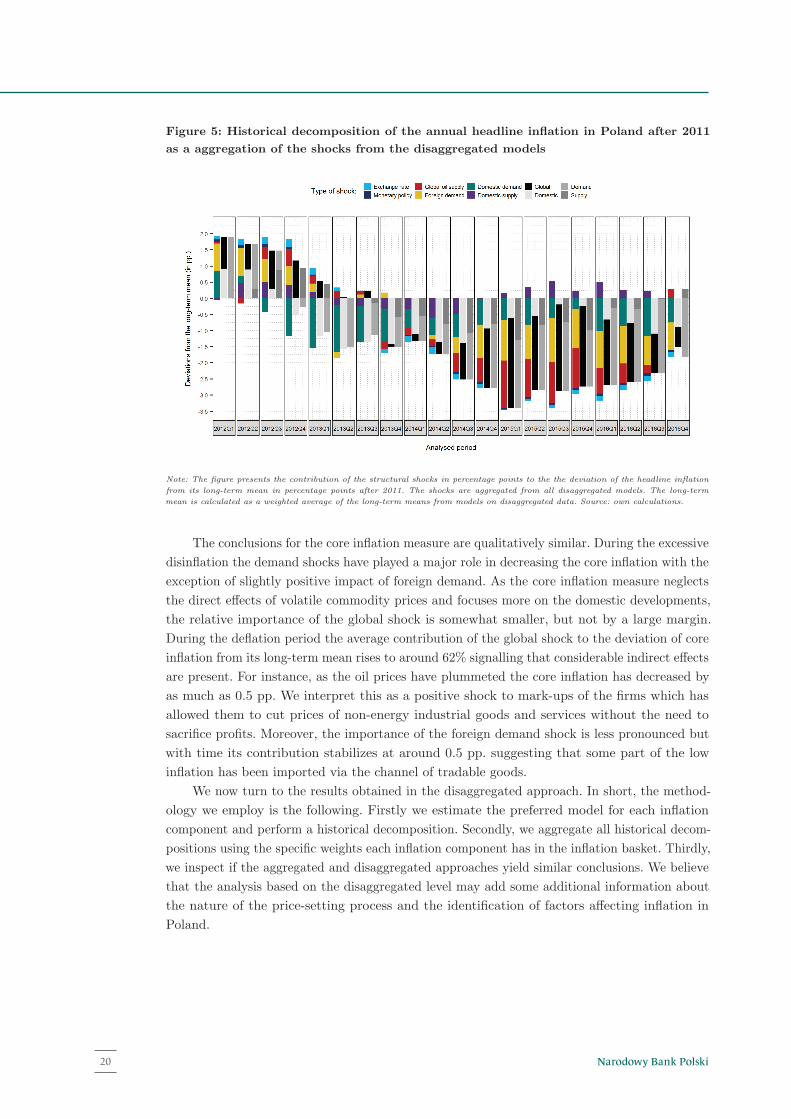
Figure 5: Historical decomposition of the annual headline inflation in Poland after 2011
as a aggregation of the shocks from the disaggregated models
Note: The figure presents the contribution of the structural shocks in percentage points to the the deviation of the headline inflation
from its long-term mean in percentage points after 2011. The shocks are aggregated from all disaggregated models. The long-term
mean is calculated as a weighted average of the long-term means from models on disaggregated data. Source: own calculations.
The conclusions for the core inflation measure are qualitatively similar. During the excessive
disinflation the demand shocks have played a major role in decreasing the core inflation with the
exception of slightly positive impact of foreign demand. As the core inflation measure neglects
the direct effects of volatile commodity prices and focuses more on the domestic developments,
the relative importance of the global shock is somewhat smaller, but not by a large margin.
During the deflation period the average contribution of the global shock to the deviation of core
inflation from its long-term mean rises to around 62% signalling that considerable indirect effects
are present. For instance, as the oil prices have plummeted the core inflation has decreased by
as much as 0.5 pp. We interpret this as a positive shock to mark-ups of the firms which has
allowed them to cut prices of non-energy industrial goods and services without the need to
sacrifice profits. Moreover, the importance of the foreign demand shock is less pronounced but
with time its contribution stabilizes at around 0.5 pp. suggesting that some part of the low
inflation has been imported via the channel of tradable goods.
We now turn to the results obtained in the disaggregated approach. In short, the method-
ology we employ is the following. Firstly we estimate the preferred model for each inflation
component and perform a historical decomposition. Secondly, we aggregate all historical decom-
positions using the specific weights each inflation component has in the inflation basket. Thirdly,
we inspect if the aggregated and disaggregated approaches yield similar conclusions. We believe
that the analysis based on the disaggregated level may add some additional information about
the nature of the price-setting process and the identification of factors affecting inflation in
Poland.
18
Narodowy Bank Polski20
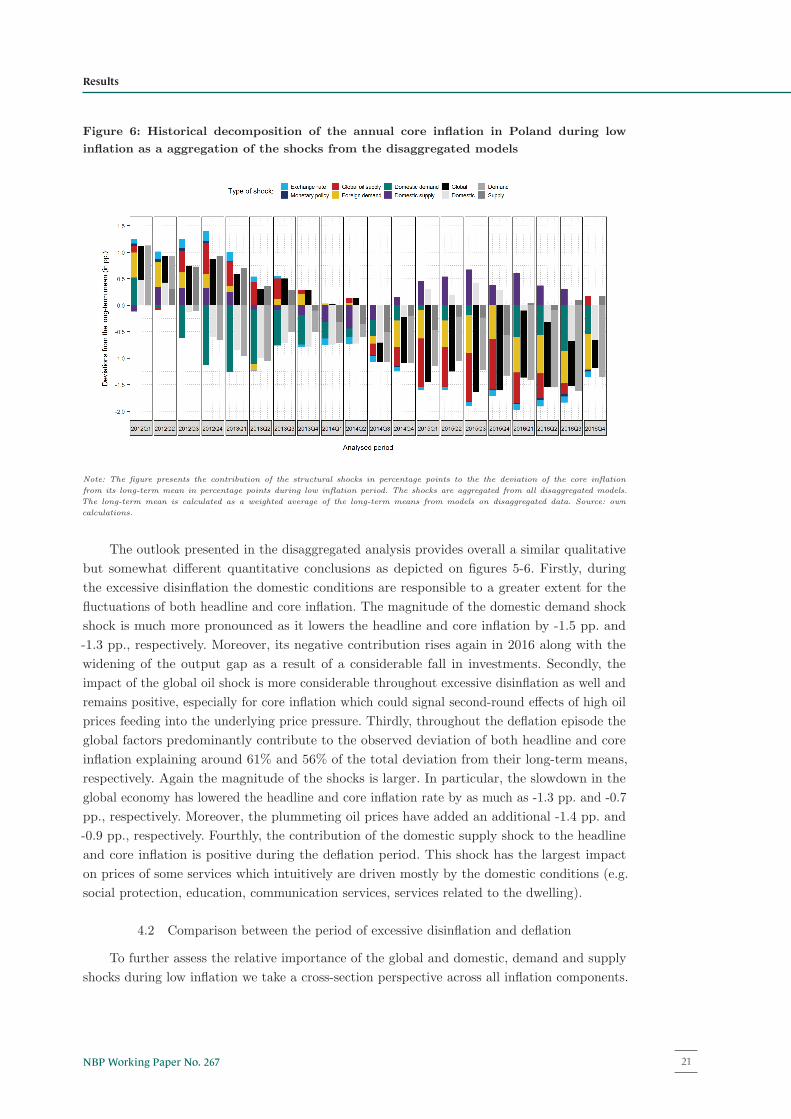
Figure 6: Historical decomposition of the annual core inflation in Poland during low
inflation as a aggregation of the shocks from the disaggregated models
Note: The figure presents the contribution of the structural shocks in percentage points to the the deviation of the core inflation
from its long-term mean in percentage points during low inflation period. The shocks are aggregated from all disaggregated models.
The long-term mean is calculated as a weighted average of the long-term means from models on disaggregated data. Source: own
calculations.
The outlook presented in the disaggregated analysis provides overall a similar qualitative
but somewhat different quantitative conclusions as depicted on figures 5-6. Firstly, during
the excessive disinflation the domestic conditions are responsible to a greater extent for the
fluctuations of both headline and core inflation. The magnitude of the domestic demand shock
shock is much more pronounced as it lowers the headline and core inflation by -1.5 pp. and
-1.3 pp., respectively. Moreover, its negative contribution rises again in 2016 along with the
widening of the output gap as a result of a considerable fall in investments. Secondly, the
impact of the global oil shock is more considerable throughout excessive disinflation as well and
remains positive, especially for core inflation which could signal second-round effects of high oil
prices feeding into the underlying price pressure. Thirdly, throughout the deflation episode the
global factors predominantly contribute to the observed deviation of both headline and core
inflation explaining around 61% and 56% of the total deviation from their long-term means,
respectively. Again the magnitude of the shocks is larger. In particular, the slowdown in the
global economy has lowered the headline and core inflation rate by as much as -1.3 pp. and -0.7
pp., respectively. Moreover, the plummeting oil prices have added an additional -1.4 pp. and
-0.9 pp., respectively. Fourthly, the contribution of the domestic supply shock to the headline
and core inflation is positive during the deflation period. This shock has the largest impact
on prices of some services which intuitively are driven mostly by the domestic conditions (e.g.
social protection, education, communication services, services related to the dwelling).
4.2 Comparison between the period of excessive disinflation and deflation
To further assess the relative importance of the global and domestic, demand and supply
shocks during low inflation we take a cross-section perspective across all inflation components.
19
21NBP Working Paper No. 267
Results
Firstly, we report the relative contribution of the global, domestic, supply and demand shocks
to the deviation of the selected inflation measure from its long-term mean in the period of the
excessive disinflation and the protracted period of deflation in table 3. In the second step, to
evaluate the statistical significance of the change in the importance of the global shock ρ, the
domestic shock β, the demand shock λ and the supply shock γ we regress their contribution
observed in the excessive disinflation period (denoted by 1 ) on those reported for the deflation
period (denoted by 2 ) using a simple OLS estimator. Equation (3) summarizes this step where
y represents the contribution of interest:
y(2) = κyy(1) + �y, y = {ρ, β, λ, γ, θ} (3)
In the course of the analysis we restrict the intercept of these regressions to zero – that way
the estimated parameter κy informs us about the average change of the importance between
these factors in the two distinguished time periods. We subject the parameter κy to a one-sided
t-test1.
Table 3-4 and the figure 7 present the results of the analysis. Each plot illustrates the
changes in the contribution of the global, domestic, demand and supply shock to the total
deviation from the long-term mean of a selected inflation component. Each point on the graph
represents a pair of coefficients. The first coordinate resembles the relative contribution in
the excessive disinflation (2012Q1-2014Q2) and the second coordinate reflects the relative
contribution during the deflation period (2014Q3-2016Q4). The 45-degree line illustrates the
no-change border. Additionally, the results of the fitting procedure through the cloud of points
are printed in the top-left corner of the plots.
In general, the comparison between the period of excessive disinflation and the protracted
deflation corroborates previous findings. During the period of falling consumer prices the role of
global factors has increased considerably at the expense of the domestic determinants. Across
all inflation components, the impact of the global shock is on average around 27% stronger and
statistically significant. Moreover, we have observed an increasing role of the supply factors (by
roughly 15%) during deflation due to the severe plunge of the global oil prices.
Still, when inspecting the relative importance of shocks across inflation components we spot
a substantial heterogeneity. Firstly, we show that fuel prices are driven mainly by the demand
factors which is consistent with the finding for the oil prices in general (Baumeister and Kilian,
2016). Secondly, during the excessive disinflation the majority of services inflation components
remains less sensitive to the global conditions and react more to the domestic factors. However,
during deflation this situation changes as a considerable number of services inflation components
becomes more sensitive to global shocks. To give an example, the contribution of the global
shocks to the transport services inflation or the catering services inflation rises significantly
to around 64% of the total deviation from the long-term mean during deflation. Therefore,
we believe that the global shocks influenced the development of the services inflation via the
cost channel. Thirdly, during excessive disinflation the contribution of the global shock has
been largest mainly for the tradable, heavily imported goods, i.e. footwear, vehicles or clothing.
Interestingly, for a limited number of inflation components of the non-energy industrial goods
1Under the null hypothesis H0 : κy = 1 which reflects that the relative importance of the shocks has not
changed between samples. The alternative hypothesis is one-sided depending on whether κy < 1 or κy > 1 holds
for the parameter κy . To account for the probable problem of influential observations we impose a specific Hac
correction on the variance-covariance matrix (Cribari-Neto, 2004) which improves the small sample performance
of Hc estimators.
20
Narodowy Bank Polski22
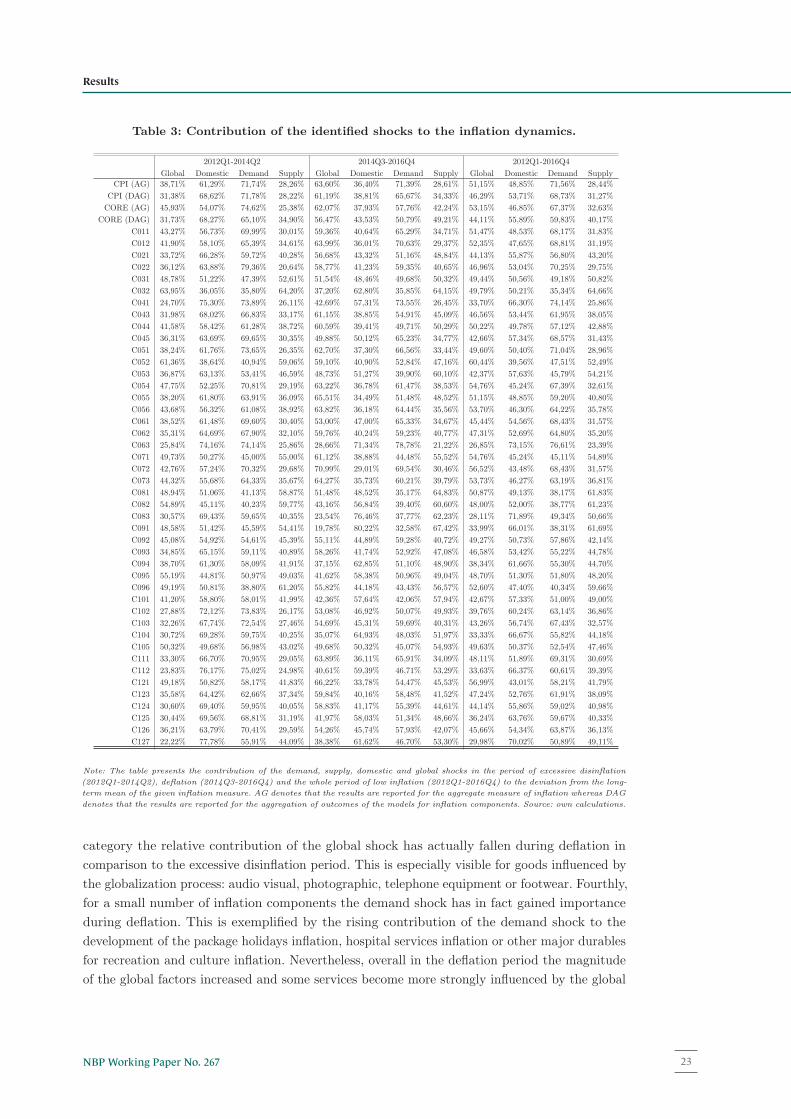
Table 3: Contribution of the identified shocks to the inflation dynamics.
2012Q1-2014Q2 2014Q3-2016Q4 2012Q1-2016Q4
Global Domestic Demand Supply Global Domestic Demand Supply Global Domestic Demand Supply
CPI (AG) 38,71% 61,29% 71,74% 28,26% 63,60% 36,40% 71,39% 28,61% 51,15% 48,85% 71,56% 28,44%
CPI (DAG) 31,38% 68,62% 71,78% 28,22% 61,19% 38,81% 65,67% 34,33% 46,29% 53,71% 68,73% 31,27%
CORE (AG) 45,93% 54,07% 74,62% 25,38% 62,07% 37,93% 57,76% 42,24% 53,15% 46,85% 67,37% 32,63%
CORE (DAG) 31,73% 68,27% 65,10% 34,90% 56,47% 43,53% 50,79% 49,21% 44,11% 55,89% 59,83% 40,17%
C011 43,27% 56,73% 69,99% 30,01% 59,36% 40,64% 65,29% 34,71% 51,47% 48,53% 68,17% 31,83%
C012 41,90% 58,10% 65,39% 34,61% 63,99% 36,01% 70,63% 29,37% 52,35% 47,65% 68,81% 31,19%
C021 33,72% 66,28% 59,72% 40,28% 56,68% 43,32% 51,16% 48,84% 44,13% 55,87% 56,80% 43,20%
C022 36,12% 63,88% 79,36% 20,64% 58,77% 41,23% 59,35% 40,65% 46,96% 53,04% 70,25% 29,75%
C031 48,78% 51,22% 47,39% 52,61% 51,54% 48,46% 49,68% 50,32% 49,44% 50,56% 49,18% 50,82%
C032 63,95% 36,05% 35,80% 64,20% 37,20% 62,80% 35,85% 64,15% 49,79% 50,21% 35,34% 64,66%
C041 24,70% 75,30% 73,89% 26,11% 42,69% 57,31% 73,55% 26,45% 33,70% 66,30% 74,14% 25,86%
C043 31,98% 68,02% 66,83% 33,17% 61,15% 38,85% 54,91% 45,09% 46,56% 53,44% 61,95% 38,05%
C044 41,58% 58,42% 61,28% 38,72% 60,59% 39,41% 49,71% 50,29% 50,22% 49,78% 57,12% 42,88%
C045 36,31% 63,69% 69,65% 30,35% 49,88% 50,12% 65,23% 34,77% 42,66% 57,34% 68,57% 31,43%
C051 38,24% 61,76% 73,65% 26,35% 62,70% 37,30% 66,56% 33,44% 49,60% 50,40% 71,04% 28,96%
C052 61,36% 38,64% 40,94% 59,06% 59,10% 40,90% 52,84% 47,16% 60,44% 39,56% 47,51% 52,49%
C053 36,87% 63,13% 53,41% 46,59% 48,73% 51,27% 39,90% 60,10% 42,37% 57,63% 45,79% 54,21%
C054 47,75% 52,25% 70,81% 29,19% 63,22% 36,78% 61,47% 38,53% 54,76% 45,24% 67,39% 32,61%
C055 38,20% 61,80% 63,91% 36,09% 65,51% 34,49% 51,48% 48,52% 51,15% 48,85% 59,20% 40,80%
C056 43,68% 56,32% 61,08% 38,92% 63,82% 36,18% 64,44% 35,56% 53,70% 46,30% 64,22% 35,78%
C061 38,52% 61,48% 69,60% 30,40% 53,00% 47,00% 65,33% 34,67% 45,44% 54,56% 68,43% 31,57%
C062 35,31% 64,69% 67,90% 32,10% 59,76% 40,24% 59,23% 40,77% 47,31% 52,69% 64,80% 35,20%
C063 25,84% 74,16% 74,14% 25,86% 28,66% 71,34% 78,78% 21,22% 26,85% 73,15% 76,61% 23,39%
C071 49,73% 50,27% 45,00% 55,00% 61,12% 38,88% 44,48% 55,52% 54,76% 45,24% 45,11% 54,89%
C072 42,76% 57,24% 70,32% 29,68% 70,99% 29,01% 69,54% 30,46% 56,52% 43,48% 68,43% 31,57%
C073 44,32% 55,68% 64,33% 35,67% 64,27% 35,73% 60,21% 39,79% 53,73% 46,27% 63,19% 36,81%
C081 48,94% 51,06% 41,13% 58,87% 51,48% 48,52% 35,17% 64,83% 50,87% 49,13% 38,17% 61,83%
C082 54,89% 45,11% 40,23% 59,77% 43,16% 56,84% 39,40% 60,60% 48,00% 52,00% 38,77% 61,23%
C083 30,57% 69,43% 59,65% 40,35% 23,54% 76,46% 37,77% 62,23% 28,11% 71,89% 49,34% 50,66%
C091 48,58% 51,42% 45,59% 54,41% 19,78% 80,22% 32,58% 67,42% 33,99% 66,01% 38,31% 61,69%
C092 45,08% 54,92% 54,61% 45,39% 55,11% 44,89% 59,28% 40,72% 49,27% 50,73% 57,86% 42,14%
C093 34,85% 65,15% 59,11% 40,89% 58,26% 41,74% 52,92% 47,08% 46,58% 53,42% 55,22% 44,78%
C094 38,70% 61,30% 58,09% 41,91% 37,15% 62,85% 51,10% 48,90% 38,34% 61,66% 55,30% 44,70%
C095 55,19% 44,81% 50,97% 49,03% 41,62% 58,38% 50,96% 49,04% 48,70% 51,30% 51,80% 48,20%
C096 49,19% 50,81% 38,80% 61,20% 55,82% 44,18% 43,43% 56,57% 52,60% 47,40% 40,34% 59,66%
C101 41,20% 58,80% 58,01% 41,99% 42,36% 57,64% 42,06% 57,94% 42,67% 57,33% 51,00% 49,00%
C102 27,88% 72,12% 73,83% 26,17% 53,08% 46,92% 50,07% 49,93% 39,76% 60,24% 63,14% 36,86%
C103 32,26% 67,74% 72,54% 27,46% 54,69% 45,31% 59,69% 40,31% 43,26% 56,74% 67,43% 32,57%
C104 30,72% 69,28% 59,75% 40,25% 35,07% 64,93% 48,03% 51,97% 33,33% 66,67% 55,82% 44,18%
C105 50,32% 49,68% 56,98% 43,02% 49,68% 50,32% 45,07% 54,93% 49,63% 50,37% 52,54% 47,46%
C111 33,30% 66,70% 70,95% 29,05% 63,89% 36,11% 65,91% 34,09% 48,11% 51,89% 69,31% 30,69%
C112 23,83% 76,17% 75,02% 24,98% 40,61% 59,39% 46,71% 53,29% 33,63% 66,37% 60,61% 39,39%
C121 49,18% 50,82% 58,17% 41,83% 66,22% 33,78% 54,47% 45,53% 56,99% 43,01% 58,21% 41,79%
C123 35,58% 64,42% 62,66% 37,34% 59,84% 40,16% 58,48% 41,52% 47,24% 52,76% 61,91% 38,09%
C124 30,60% 69,40% 59,95% 40,05% 58,83% 41,17% 55,39% 44,61% 44,14% 55,86% 59,02% 40,98%
C125 30,44% 69,56% 68,81% 31,19% 41,97% 58,03% 51,34% 48,66% 36,24% 63,76% 59,67% 40,33%
C126 36,21% 63,79% 70,41% 29,59% 54,26% 45,74% 57,93% 42,07% 45,66% 54,34% 63,87% 36,13%
C127 22,22% 77,78% 55,91% 44,09% 38,38% 61,62% 46,70% 53,30% 29,98% 70,02% 50,89% 49,11%
Note: The table presents the contribution of the demand, supply, domestic and global shocks in the period of excessive disinflation
(2012Q1-2014Q2), deflation (2014Q3-2016Q4) and the whole period of low inflation (2012Q1-2016Q4) to the deviation from the long-
term mean of the given inflation measure. AG denotes that the results are reported for the aggregate measure of inflation whereas DAG
denotes that the results are reported for the aggregation of outcomes of the models for inflation components. Source: own calculations.
category the relative contribution of the global shock has actually fallen during deflation in
comparison to the excessive disinflation period. This is especially visible for goods influenced by
the globalization process: audio visual, photographic, telephone equipment or footwear. Fourthly,
for a small number of inflation components the demand shock has in fact gained importance
during deflation. This is exemplified by the rising contribution of the demand shock to the
development of the package holidays inflation, hospital services inflation or other major durables
for recreation and culture inflation. Nevertheless, overall in the deflation period the magnitude
of the global factors increased and some services become more strongly influenced by the global
21
23NBP Working Paper No. 267
Results
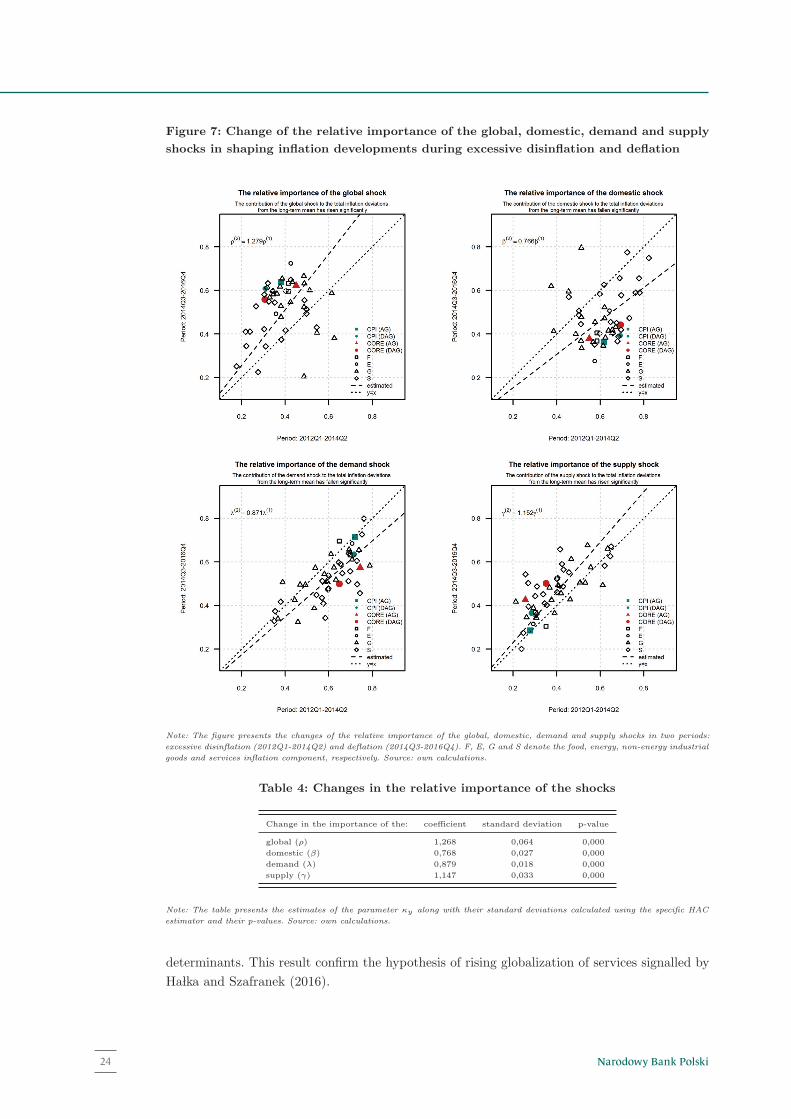
Figure 7: Change of the relative importance of the global, domestic, demand and supply
shocks in shaping inflation developments during excessive disinflation and deflation
Note: The figure presents the changes of the relative importance of the global, domestic, demand and supply shocks in two periods:
excessive disinflation (2012Q1-2014Q2) and deflation (2014Q3-2016Q4). F, E, G and S denote the food, energy, non-energy industrial
goods and services inflation component, respectively. Source: own calculations.
Table 4: Changes in the relative importance of the shocks
Change in the importance of the: coefficient standard deviation p-value
global (ρ) 1,268 0,064 0,000
domestic (β) 0,768 0,027 0,000
demand (λ) 0,879 0,018 0,000
supply (γ) 1,147 0,033 0,000
Note: The table presents the estimates of the parameter κy along with their standard deviations calculated using the specific HAC
estimator and their p-values. Source: own calculations.
determinants. This result confirm the hypothesis of rising globalization of services signalled by
Ha�lka and Szafranek (2016).
22
Narodowy Bank Polski24
4.3 Sensitivity indices and robustness check
In this section we deliver two main blocks of results based on the disaggregated analysis.
Firstly, we report and discuss the developments of the inflation indices sensitive and resilient to
the specific shocks. In the second step we inspect the difference between the indices of inflation
sensitive to global and domestic adjustments based on the sensitivity indicators calculated from
preferred identification scheme relying on a mixture of zero and sign restrictions as well as for
the Choleski factorisation scheme which we implement as a robustness check.
During the disaggregated analysis we mark each inflation component as sensitive or resilient
to the identified shocks. Next, we combine the sensitivity indicators, the annual rate of change
of all inflation components as well as their weights to obtain inflation indices of goods sensitive
or resilient to the specified shocks. These measures are presented on figure 8.
In general, the calculated indices indicate that during financial crisis domestic conditions
have heightened inflation whereas foreign demand has put a downward pressure on consumer
prices in Poland with the inflation of goods sensitive to foreign demand falling below -3%
y-o-y. The weak external conditions after the outbreak of the great financial crisis has lead
mainly to the strong decline of prices of vehicles, fuels, footwear, audio-visual and photographic
equipment prices – goods strongly affected by the deteriorating demand in the developed as well
as emerging economies. At the same time the domestic conditions have been pushing inflation
upwards, in some months even above 6% y-o-y. The main factor behind this development was
the positive output gap, which influenced the prices of components perceived to be strongly
influenced by the domestic conditions, especially services.
The second episode of deflationary pressure exerted by foreign factors has been the
protracted period of deflation in Polish economy. Again, fading external economic conditions
has put a downward pressure on consumer prices which have been falling for a prolonged period
of two and the half year. However, this time domestic conditions were not favourable either
since from the beginning of 2012 the output gap in Poland has remained negative. Yet, the
inflation of goods sensitive to the domestic demand during deflation has been low evolving
around zero which indicates that the demand pressure in the Polish economy has been narrow
but not deflationary. Improving domestic conditions in the second half of 2016 reflected in the
acceleration of the economic growth in Poland has lead to the increase of the inflation of goods
sensitive to the domestic demand and supply. Additionally, in the last quarter of 2016 the global
economic has improved which brought surge of the inflation of goods sensitive to the foreign
demand, generating the increase of the Polish inflation.
One particular fact needs to be highlighted. The inflation of goods sensitive to the global
oil supply shock closely resembles the headline inflation. This results from the composition this
measure as nearly all inflation components are sensitive to the oil supply shock. In fact, the
prices of only three important components are resilient to this shock – clothing (which prices are
rather influenced by the globalisation process), medical products (where nearly half of the prices
are administered, not depending on the economic conditions, but rather on the negotiation
process between the Ministry of Health and the pharmaceutical companies) and recreational
and cultural services (like television and radio licence fees which prices are administered2. The
statistically significant reaction of nearly all CPI subcomponents to the changes in the oil prices
is not surprising as the energy prices are an important cost factor in the production of goods and
2In case of other administered prices, like electricity, heating energy, gas, transport services changes in the
commodity prices on the international markets are also taken into account whilst setting the prices).
23
25NBP Working Paper No. 267
Results
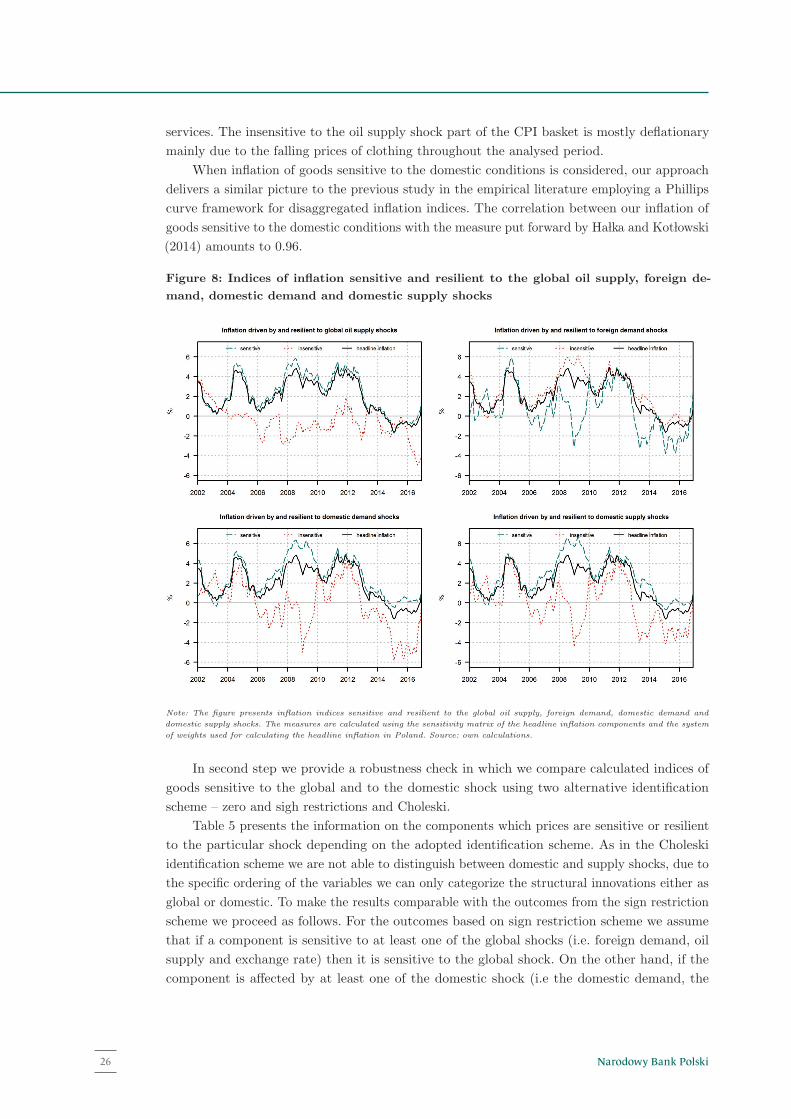
services. The insensitive to the oil supply shock part of the CPI basket is mostly deflationary
mainly due to the falling prices of clothing throughout the analysed period.
When inflation of goods sensitive to the domestic conditions is considered, our approach
delivers a similar picture to the previous study in the empirical literature employing a Phillips
curve framework for disaggregated inflation indices. The correlation between our inflation of
goods sensitive to the domestic conditions with the measure put forward by Ha�lka and Kot�lowski
(2014) amounts to 0.96.
Figure 8: Indices of inflation sensitive and resilient to the global oil supply, foreign de-
mand, domestic demand and domestic supply shocks
Note: The figure presents inflation indices sensitive and resilient to the global oil supply, foreign demand, domestic demand and
domestic supply shocks. The measures are calculated using the sensitivity matrix of the headline inflation components and the system
of weights used for calculating the headline inflation in Poland. Source: own calculations.
In second step we provide a robustness check in which we compare calculated indices of
goods sensitive to the global and to the domestic shock using two alternative identification
scheme – zero and sigh restrictions and Choleski.
Table 5 presents the information on the components which prices are sensitive or resilient
to the particular shock depending on the adopted identification scheme. As in the Choleski
identification scheme we are not able to distinguish between domestic and supply shocks, due to
the specific ordering of the variables we can only categorize the structural innovations either as
global or domestic. To make the results comparable with the outcomes from the sign restriction
scheme we proceed as follows. For the outcomes based on sign restriction scheme we assume
that if a component is sensitive to at least one of the global shocks (i.e. foreign demand, oil
supply and exchange rate) then it is sensitive to the global shock. On the other hand, if the
component is affected by at least one of the domestic shock (i.e the domestic demand, the
24
Narodowy Bank Polski26
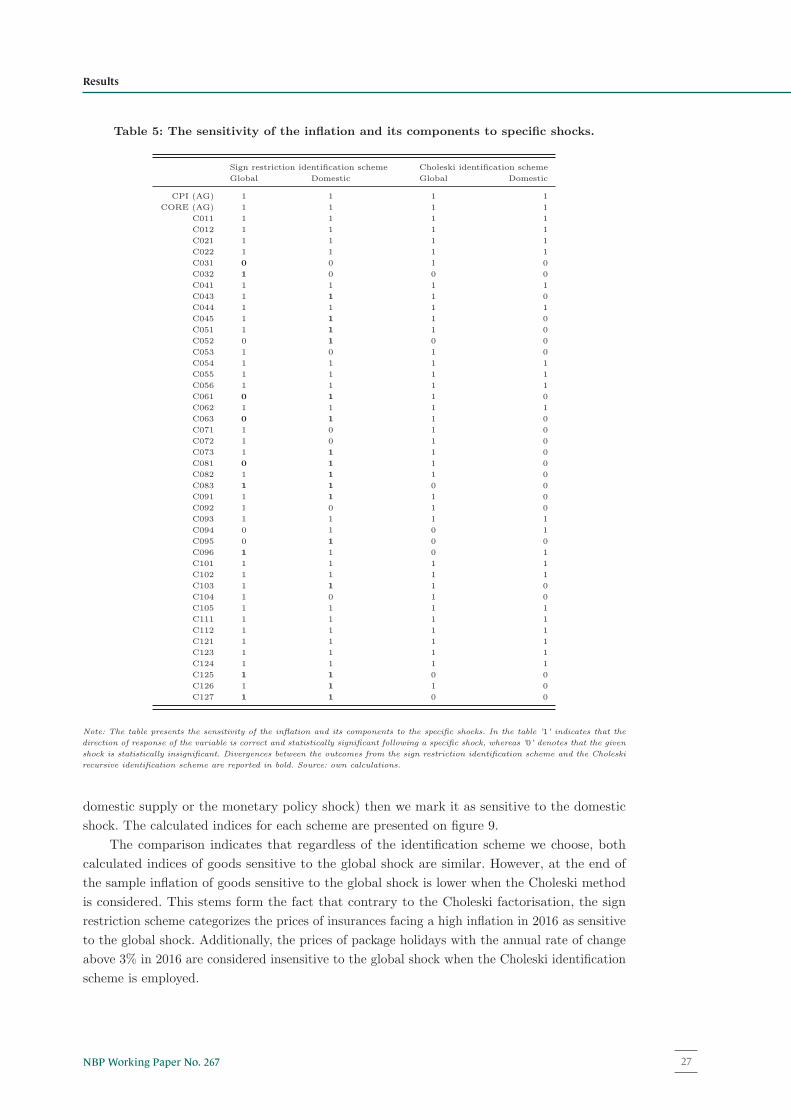
Table 5: The sensitivity of the inflation and its components to specific shocks.
Sign restriction identification scheme Choleski identification scheme
Global Domestic Global Domestic
CPI (AG) 1 1 1 1
CORE (AG) 1 1 1 1
C011 1 1 1 1
C012 1 1 1 1
C021 1 1 1 1
C022 1 1 1 1
C031 0 0 1 0
C032 1 0 0 0
C041 1 1 1 1
C043 1 1 1 0
C044 1 1 1 1
C045 1 1 1 0
C051 1 1 1 0
C052 0 1 0 0
C053 1 0 1 0
C054 1 1 1 1
C055 1 1 1 1
C056 1 1 1 1
C061 0 1 1 0
C062 1 1 1 1
C063 0 1 1 0
C071 1 0 1 0
C072 1 0 1 0
C073 1 1 1 0
C081 0 1 1 0
C082 1 1 1 0
C083 1 1 0 0
C091 1 1 1 0
C092 1 0 1 0
C093 1 1 1 1
C094 0 1 0 1
C095 0 1 0 0
C096 1 1 0 1
C101 1 1 1 1
C102 1 1 1 1
C103 1 1 1 0
C104 1 0 1 0
C105 1 1 1 1
C111 1 1 1 1
C112 1 1 1 1
C121 1 1 1 1
C123 1 1 1 1
C124 1 1 1 1
C125 1 1 0 0
C126 1 1 1 0
C127 1 1 0 0
Note: The table presents the sensitivity of the inflation and its components to the specific shocks. In the table ’1’ indicates that the
direction of response of the variable is correct and statistically significant following a specific shock, whereas ’0’ denotes that the given
shock is statistically insignificant. Divergences between the outcomes from the sign restriction identification scheme and the Choleski
recursive identification scheme are reported in bold. Source: own calculations.
domestic supply or the monetary policy shock) then we mark it as sensitive to the domestic
shock. The calculated indices for each scheme are presented on figure 9.
The comparison indicates that regardless of the identification scheme we choose, both
calculated indices of goods sensitive to the global shock are similar. However, at the end of
the sample inflation of goods sensitive to the global shock is lower when the Choleski method
is considered. This stems form the fact that contrary to the Choleski factorisation, the sign
restriction scheme categorizes the prices of insurances facing a high inflation in 2016 as sensitive
to the global shock. Additionally, the prices of package holidays with the annual rate of change
above 3% in 2016 are considered insensitive to the global shock when the Choleski identification
scheme is employed.
25
27NBP Working Paper No. 267
Results
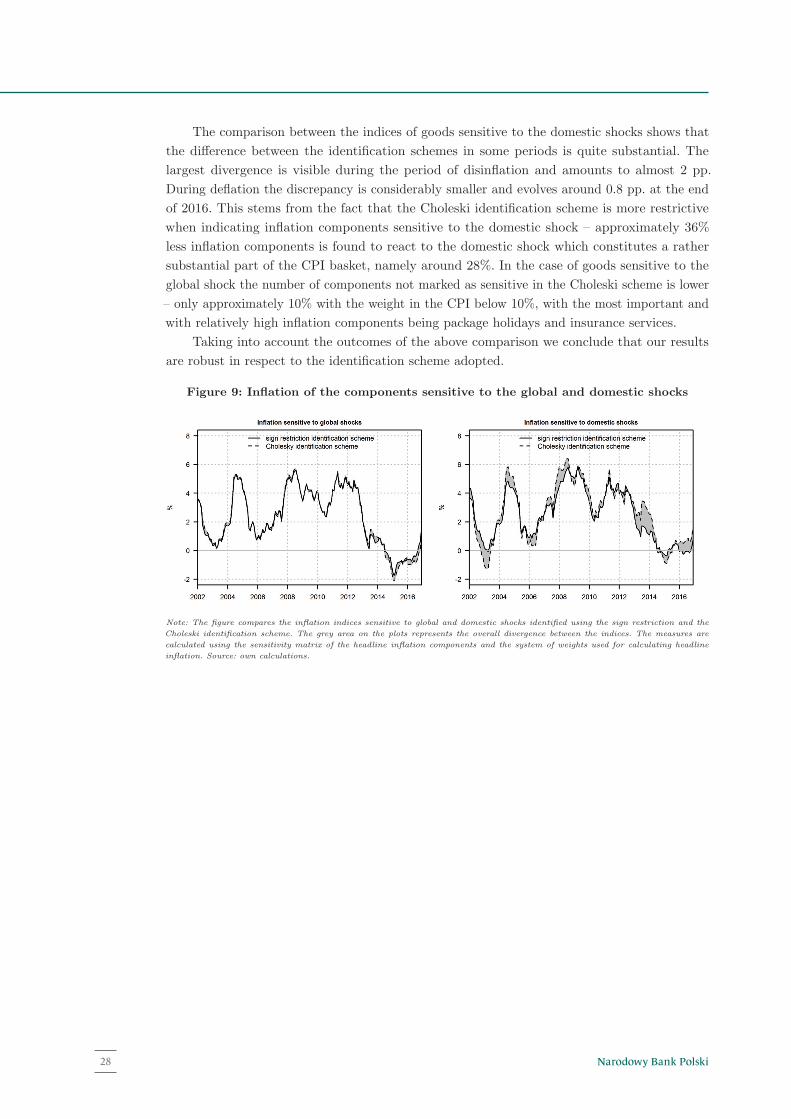
The comparison between the indices of goods sensitive to the domestic shocks shows that
the difference between the identification schemes in some periods is quite substantial. The
largest divergence is visible during the period of disinflation and amounts to almost 2 pp.
During deflation the discrepancy is considerably smaller and evolves around 0.8 pp. at the end
of 2016. This stems from the fact that the Choleski identification scheme is more restrictive
when indicating inflation components sensitive to the domestic shock – approximately 36%
less inflation components is found to react to the domestic shock which constitutes a rather
substantial part of the CPI basket, namely around 28%. In the case of goods sensitive to the
global shock the number of components not marked as sensitive in the Choleski scheme is lower
– only approximately 10% with the weight in the CPI below 10%, with the most important and
with relatively high inflation components being package holidays and insurance services.
Taking into account the outcomes of the above comparison we conclude that our results
are robust in respect to the identification scheme adopted.
Figure 9: Inflation of the components sensitive to the global and domestic shocks
Note: The figure compares the inflation indices sensitive to global and domestic shocks identified using the sign restriction and the
Choleski identification scheme. The grey area on the plots represents the overall divergence between the indices. The measures are
calculated using the sensitivity matrix of the headline inflation components and the system of weights used for calculating headline
inflation. Source: own calculations.
26
Narodowy Bank Polski28
5 Conclusion
In the recent years the development of the headline inflation rates across countries has
continued to surprise. This peculiar behaviour of inflation is particularly starkly exemplified in
the small open economy of Poland. The main aim of this paper was to identify the determinants
of the nominal fluctuations in the period of low inflation in an emerging, small open economy. For
this purpose we have considered a fairly standard set of macroeconomic variables and estimated
a structural VAR model in a Bayesian framework. We have alleviated the shortcomings of
the Choleski factorisation and identified economically interpretable structural shocks affecting
consumer prices by following a recent notion in the empirical literature and employing the mixture
of zero and sign restrictions. This approach has enabled us to assess the relative importance
of the global and domestic, supply and demand factors in shaping inflation developments in
Poland. Moreover, we have extend this analysis on a large number of inflation components to
inspect whether conclusions drawn from the aggregated approach are in line with the results
of the analysis performed on the disaggregated data. We have taken further advantage of the
disaggregated approach by marking inflation components as sensitive or resilient to the changes
in the developments of the global and domestic factors. Based on the calculated sensitivity
indicators we have constructed indices of inflation sensitive and resilient to the distinguished
determinants.
Our paper grants several important conclusions. Firstly, in line with the previous studies
for the small open economy of Poland we have shown that the domestic demand remains
a significant determinant of the nominal fluctuations. In particular, we conclude that the
deteriorating domestic conditions have turned out to be a primary source of the excessive
disinflation in Poland. Secondly, we confirm the rising importance of the global factors during the
deflation period. We provide evidence that deflation has been an entirely imported phenomenon
that resulted from the downward pressure exerted by the waning global demand and plummeting
oil prices on consumer prices. Further analysis of the development of the inflation indices sensitive
to the domestic demand as well as the global shock corroborate this outcome. Thirdly, our
presented evidence on the relative importance of the global and domestic shocks is consistent
with the findings in the previous empirical studies not necessarily accounting for the low inflation
period. We interpret this as a lack of a structural break in the mechanism of setting prices
during the episode of falling prices. Fourthly, the analysis repeated on the number of inflation
components generally has confirmed the conclusions of the study performed on the aggregate
inflation indices. However, we present and discuss substantial heterogeneities in the relative
importance of the identified shocks across the distinguished inflation indices during the excessive
disinflation and deflation. In particular, whereas some inflation components remain resilient to
the developments in the global economy, we argue that during deflation the inflation of services
has been increasingly influenced by the foreign factors. Lastly, we present evidence that the
monetary policy has remained neutral throughout the low inflation period.
We provide a number of guidelines for the monetary policy. Firstly, despite the increasing
role of the global developments the domestic slack remains a significant factor influencing the
development of consumer prices in the small, open economy of Poland. Therefore, is should
remain as an object of all possible scrutiny. However, as the small open economy becomes
increasingly integrated with the global economy the monetary authorities should take into
account as wide range of factors as possible when reaching policy decisions. Secondly, we
acknowledge the additional information the disaggregated analysis introduces whilst studying
27
29NBP Working Paper No. 267
Chapter 5

the development of the consumer prices. In particular, it should be highlighted that some
of the distinguished inflation components react quite differently in the period of disinflation
and deflation which should be taken into consideration whilst adjusting the monetary policy.
Finally, inflation indices sensitive to the domestic and global conditions may quite precisely
reflect foreign and domestic inflationary or deflationary pressures. In fact, we perceive them as
a convenient tool to monitor the nominal developments in the domestic economy. Evaluating
their forecasting capabilities would be an interesting topic for future research.
28
Narodowy Bank Polski30
References
Aastveit, K. A., H. C. Bjørnland, and L. A. Thorsrud (2016). The World Is Not Enough! Small Open
Economies and Regional Dependence. The Scandinavian Journal of Economics 118 (1), 168–195.
Arias, J. E., J. F. Rubio-Ramirez, and D. Waggoner (2014). Inference Based on SVARs Identified with
Sign and Zero Restrictions: Theory and Applications. International Finance Discussion Papers 1100,
Board of Governors of the Federal Reserve System (U.S.).
Auer, R. A., C. Borio, and A. Filardo (2017). The Globalisation of Inflation: The Growing Importance
of Global Value Chains. Technical report.
Baumeister, C. and L. Kilian (2016, February). Forty Years of Oil Price Fluctuations: Why the Price
of Oil May Still Surprise Us. Journal of Economic Perspectives 30 (1), 139–60.
Bentolila, S., J. J. Dolado, and J. F. Jimeno (2008). Does immigration affect the Phillips curve? Some
evidence for Spain. European Economic Review 52 (8), 1398 – 1423.
Bermingham, C. and A. D’Agostino (2014). Understanding and forecasting aggregate and disaggregate
price dynamics. Empirical Economics 46 (2), 765–788.
Blanchard, O., E. Cerutti, and L. Summers (2015, November). Inflation and Activity – Two Explorations
and their Monetary Policy Implications. NBER Working Papers 21726, National Bureau of Economic
Research, Inc.
Blinder, A. S., M. Ehrmann, M. Fratzscher, J. De Haan, and D.-J. Jansen (2008, December). Central
Bank Communication and Monetary Policy: A Survey of Theory and Evidence. Journal of Economic
Literature 46 (4), 910–45.
Bobeica, E. and M. Jarocinski (2017). ’Missing disinflation and missing inflation: the puzzles that
aren’t. Technical report.
Borio, C. E. V. and A. Filardo (2007, May). Globalisation and inflation: New cross-country evidence
on the global determinants of domestic inflation. BIS Working Papers 227, Bank for International
Settlements.
Bryan, M. F. and B. Meyer (2010). Are some prices in the CPI more forward looking than others? We
think so. Economic Commentary (May 19).
Caldara, D., M. Cavallo, and M. Iacoviello (2016, July). Oil Price Elasticities and Oil Price Fluctuations.
International Finance Discussion Papers 1173, Board of Governors of the Federal Reserve System
(U.S.).
Canova, F. and M. Paustian (2011). Business cycle measurement with some theory. Journal of Monetary
Economics 58 (4), 345–361.
Christiano, L. J., M. Eichenbaum, and M. Trabandt (2015). Understanding the Great Recession.
American Economic Journal: Macroeconomics 7 (1), 110–67.
Ciccarelli, M. and B. Mojon (2010, August). Global Inflation. The Review of Economics and Statis-
tics 92 (3), 524–535.
Coibion, O. and Y. Gorodnichenko (2015, January). Is the Phillips Curve Alive and Well after All? Infla-
tion Expectations and the Missing Disinflation. American Economic Journal: Macroeconomics 7 (1),
197–232.
29
31NBP Working Paper No. 267
References
Comunale, M. and D. Kunovac (2017). Exchange rate pass-through in the euro area. Working Paper
Series 2003, European Central Bank.
Constantinescu, C., A. Mattoo, and M. Ruta (2015). The Global Trade Slowdown. Cyclical or Structural?
Policy Research Working Paper 7158, World Bank Group.
Constancio, V. (2016). Understanding Inflation Dynamics and Monetary Policy, Panel remarks at the
Jackson Hole Economic Policy Symposium, Federal Reserve Bank of Kansas City.
Conti, A. M., S. Neri, and A. Nobili (2017, January). Low inflation and monetary policy in the euro
area. Working Paper Series 2005, European Central Bank.
Corsetti, G., L. Dedola, and S. Leduc (2014, 02). The International Dimension Of Productivity And
Demand Shocks In The Us Economy. Journal of the European Economic Association 12 (1), 153–176.
Cribari-Neto, F. (2004). Asymptotic Inference Under Heteroskedasticity of Unknown Form. Computa-
tional Statistics & Data Analysis 45 (2), 215 – 233.
Dieppe, A., R. Legrand, and B. van Roye (2016). The bear toolbox. Working Paper Series 1934,
European Central Bank.
Duarte, C. and A. Rua (2007). Forecasting inflation through a bottom-up approach: How bottom is
bottom? Economic Modelling 24 (6), 941 – 953.
European Central Bank (2017, January). Low Inflation in the Euro Area: Causes and Consequences.
Occasional Paper Series 181, European Central Bank.
Ferroni, F. and B. Mojon (2016). Domestic and global inflation. Technical report, Banque de France,
University of Surrey and Ecole Polytechnique, mimeo.
Friedrich, C. (2016). Global inflation dynamics in the post-crisis period: What explains the puzzles?
Economics Letters 142 (C), 31–34.
Froehling, A. and K. Lommatzsch (2011). Output sensitivity of inflation in the euro area: Indirect
evidence from disaggregated consumer prices. Technical report.
Globan, T., V. Arcabic, and P. Soric (2016). Inflation in New EU Member States: A Domestically or
Externally Driven Phenomenon? Emerging Markets Finance and Trade 52 (1), 154–168.
Ha�lka, A. and J. Kot�lowski (2014). Does the Domestic Output Gap Matter for Inflation in a Small
Open Economy? Eastern European Economics 52 (3), 89–107.
Ha�lka, A. and J. Kot�lowski (2016). Global or Domestic? Which Shocks Drive Inflation in European
Small Open Economies? Emerging Markets Finance and Trade 0 (ja), null.
Ha�lka, A. and K. Szafranek (2016). Whose Inflation Is It Anyway? Inflation Spillovers Between the
Euro Area and Small Open Economies. Eastern European Economics 54 (2), 109–132.
Holtemoller, O. and S. Mallick (2016). Global food prices and monetary policy in an emerging market
economy: The case of India. Journal of Asian Economics 46, 56 – 70.
International Monetary Fund (2016, October). Global disinflation in an era of constrained monetary
policy. In World Economic Outlook – Subdued demand - symptoms and remedies, Chapter 3, pp.
121–170. International Monetary Fund.
Jovicic, G. and D. Kunovac (2017, April). What Is Driving Inflation and GDP in a Small European
Economy: The Case of Croatia. Working Paper Series W-49, Croatian National Bank.
30
Narodowy Bank Polski32
Kapuscinski, M., A. Koci ↪ecki, H. Kowalczyk, T. �Lyziak, J. Przystupa, E. Stanis�lawska, A. Sznajderska,
and E. Wrobel (2016). Monetary policy transmission mechanism in Poland.What do we know in
2015? Technical report.
Lewis, J. and S. De Schryder (2015, November). Export dynamics since the Great Trade Collapse: a
cross-country analysis. Bank of England working papers 535, Bank of England.
Alvarez, L. J., S. Hurtado, I. Sanchez, and C. Thomas (2011). The impact of oil price changes on
Spanish and euro area consumer price inflation. Economic Modelling 28 (1–2), 422 – 431.
Matheson, T. and E. Stavrev (2013). The Great Recession and the inflation puzzle. Economics
Letters 120 (3), 468–472.
Melitz, M. and G. Ottaviano (2008). Market Size, Trade, and Productivity. Review of Economic
Studies 75 (3), 985–985.
Monacelli, T. and L. Sala (2009). The International Dimension of Inflation: Evidence from Disaggregated
Consumer Price Data. Journal of Money, Credit and Banking 41, 101–120.
Mumtaz, H. and P. Surico (2012). Evolving international inflation dynamics: World and country-specific
factors. Journal of the European Economic Association 10 (4), 716.
Musso, A., L. Stracca, and v. D. Dijk (2009, June). Instability and Nonlinearity in the Euro-Area
Phillips Curve. International Journal of Central Banking 5 (2), 181–212.
Narodowy Bank Polski (2007). Minutes of the Monetary Policy Council decision-making meeting held
on 19 December 2007.
Narodowy Bank Polski (2008). Minutes of the Monetary Policy Council decision-making meeting held
on 30 January 2008.
Petrovic, P., Z. Mladenovic, and A. Nojkovic (2011). Inflation Triggers in Transition Economies: Their
Evolution and Specific Features. Emerging Markets Finance and Trade 47 (5), 101–124.
Rubio-Ramırez, J. F., D. F. Waggoner, and T. Zha (2010). Structural Vector Autoregressions: Theory
of Identification and Algorithms for Inference. Review of Economic Studies 77 (2), 665–696.
Sims, C. A. and T. Zha (1998, November). Bayesian Methods for Dynamic Multivariate Models.
International Economic Review 39 (4), 949–968.
Szafranek, K. (2017). Flattening of the New Keynesian Phillips curve: Evidence for an emerging, small
open economy . Economic Modelling 63, 334 – 348.
Wickman-Parak, B. (2013, May). Independence, inflation targeting and the importance of not being
dead certain, Breakfast meeting, SEB, Stockholm.
Wyszynski, R. (2016). Zjawisko niepe�lnego wykorzystania zasobu pracy – czym jest i co mowi o rynku
pracy w Polsce [The Phenomenon of Underemployment - What Is It and What Does it Reveal about
the Polish Labour Market]. Bank i Kredyt 47 (3), 267–284.
31
33NBP Working Paper No. 267
References

www.nbp.pl