determinants of international financial...
TRANSCRIPT

DETERMINANTS OF INTERNATIONAL FINANCIAL
INTEGRATION
Xuan Vinh Vo
School of Economics - University of New South Wales -NSW 2052 - Australia
Tel: 61. 2. 9385 1346 - Fax: 61.2. 9313 6337 - Email: [email protected]
Abstract
It is generally accepted that there has been an increase in the degree of international financial integration over the last two decades. Countries are trying to remove the restrictions on cross-border capital movement, deregulate domestic financial markets and offer competitive investment environments to encourage investment. As a result, international financial integration has been a topical area for many financial economists. However, there is a limited amount of research focusing on the determinants of international financial integration theoretically and empirically. To enrich the literature on this topic, the current paper will empirically investigate the potential “drivers” of international financial integration including policy on capital controls and other components of financial structure which are the level of economic and educational development, economic growth, the institutional and legal environment, trade openness, financial development and tax policy. JEL Classification: F02, F21, F3, F4 Keywords: international financial integration, economic growth, panel, FDI, Portfolio Investment, Private Capital Flows. Acknowledgement An earlier version of this paper was presented at the Financial Markets Asia – Pacific Conference 2005, Sydney and COE/JEPA Joint International Conference, Japan and is significantly benefited from discussion of Junichi Goto. The author is grateful for critical comments and helpful suggestions from Tom Valentine, Jonathan Batten, Kevin Daly, Craig Ellis and Ian Eddie. Any remaining errors are my own responsibilities.

DETERMINANTS OF INTERNATIONAL FINANCIAL
INTEGRATION
1. Introduction
It is generally agreed by many financial economists and practitioners that there has
been an increase in the degree of international financial integration (IFI) over the last
two decades (Agenor 2003; Lane & Milesi-Ferretti 2003; Morrison & White 2004).
Countries are trying to remove the restrictions on cross-border capital movement,
deregulate domestic financial markets and offer competitive investment environments
to encourage investment. The use of capital controls in the OECD countries has now
reached the lowest point in over fifty years (Epstein & Schor 1992). Not only the
OECD but also developing countries’ financial linkages with the global economy
have risen in recent years (Prasad et al. 2003). In addition, there has been a rapid
increase in the size of capital flows when national financial markets are deregulated
and international capital flows are liberalized. As a result, international financial
integration has been a topical area for financial economists.
Many researchers consider the concept of international financial integration and
provide a wide array of indicators to proxy for international financial integration even
though none of those definitions can be generally accepted or considered as
benchmark (Edison, Levine et al. 2002; Prasad et al. 2003; Von Furstenberg 1998).
They clearly differentiate definitions of IFI and different types of indicators: de jure
indicators to proxy for the prerequisites of international financial integration and de
facto indicators for the consequences of international financial integration. In
addition, Vo & Daly (2005a; 2005b) provide tests of other international financial
integration concepts where measures of international financial integration involving
testing correlations between different macroeconomic variables. This is effectively
2

testing the law of one price, of which must hold if the complete international financial
integration exists (Vo 2005c).
The main purpose of this paper is to empirically investigate the determinants of
international financial integration. Firstly, it is important to identify suitable
quantitative variables to proxy for international financial integration1. Vo (2005b)
constructs many IFI indicators using data from the International Financial Statistics
(IFS) of the International Monetary Fund (IMF). We use indicators of international
financial integration which are the aggregate stock of assets and liabilities as a share
of GDP (IFI01), the stock of liabilities as a share of GDP (IFI02), the aggregate stock
of foreign direct investment (FDI) and portfolio investment (PI) as a share of GDP
(IFI03), the stock of FDI and PI inflows as a share of GDP (IFI04), the aggregate
flows of equity as a share of GDP (IFIEF), the inflows of equity as a share of GDP
(IFIEFI), the aggregate stock of equity as a share of GDP (IFIES) and the stock of
equity inflows as a share of GDP (IFIESI). The rationale for the inclusion of the
equity measures is that equity flows might be driven by a different mechanism (Lane
& Milesi-Ferretti 2003). The decision to include both stock measures and flow
measures to proxy for IFI is because flow measures are subject to short-term
fluctuations while stock measures are not. In addition, it is contended that de facto
measures of international financial integration which are also considered as volume-
based capital account openness measures should cover not only the ability of foreign
investors investing domestically but also the ability of residents in the host country to
invest abroad. Secondly, a number of control variables need to be identified to serve
as candidates to represent determinants of IFI.
1 See Vo(2005b) for a detailed discussion of the advantages and disadvantages of IFI indicators.
3

Some previous empirical research examines the determinants of capital controls
(Alesina et al. 1994; Epstein & Schor 1992; Lemmen & Eijffinger 1996; Milesi-
Ferretti 1995). However, capital controls are considered as prerequisites for
international financial integration (Vo 2005b). This paper focus on the de jure
measures of international financial integration. Hence, for the purpose of this
empirical investigation, the de facto volume-based capital flow measures are
considered as a dependent variable while the de jure measures2 are used as control
variables in the regressions. In addition, it is recognized that international financial
integration does not arise spontaneously as soon as legal barriers are lifted and it is
not self-coordinating from below but as the possible end result of an organized
process requiring many formal and practical elements of institutionalization and a
system of rules to allow international financial markets to function both competitively
and securely (Von Furstenberg 1998). This is consistent with the claim from Kearney
and Lucey (2004) that the world’s economic and financial system is becoming
increasingly integrated due to the rapid expansion of international trade in
commodities, services and financial assets. Hence, we will assess many other
variables identified in the literature as potential “drivers” of international financial
integration. In other words, we relate the link between the variation in the degree of
international financial integration to a number of economic and development
indicators including capital account liberalization, the level of development,
international trade openness and country risk.
Lane (2000) empirically studies gross international investment positions using the
gross holding of foreign assets and liabilities in a cross-section sample of 19
countries. He finds that more open countries with larger domestic financial markets 2 These de jure measures are also classified as indicators of international financial liberalization. In this paper, we consider the de facto IFI variables as dependent variables. Hence, when we mention IFI it means de facto IFI.
4

tend to hold greater quantities of foreign assets and liabilities. Martin and Rey (2001)
present a two-country macroeconomic model with an endogenous number of financial
assets. This model can be employed to analyse the impact of IFI on welfare and on the
geographical location of financial centre. Lane & Milesi-Ferretti (2003) address the
issue of international financial integration and its relationship with equity return.
However, this study is restricted to a very limited number of countries (18 OECD
countries in the sample) and there are drawbacks in the analysis (Engel 2003). This
research will try to address those shortcomings and fill the gap in Lane & Milesi-
Ferretti (2003) using Engel (2003) and extending the dataset to a larger number of
countries and expand the volume-based measures of IFI.
This work is clearly relevant to the process of policy formation as a thorough
understanding of the determinants of international financial integration may provide
important insights into the process of financial and monetary integration in the global
market. This research advances other previous research by employing the annual
frequency dataset covering 79 countries over an extended period of time from 1980 to
2003 and taking advantage of the indicators of international financial integration3
constructed using data from the IMF’s International Financial Statistics and the World
Bank’s World Development Indicators. Previous research investigating the
determinants of international financial integration normally relies on dummy variables
or capital control indices to measure the degree of international financial integration
(Alesina et al. 1994; Epstein & Schor 1992; Grilli & Milesi-Ferretti 1995; Milesi-
Ferretti 1995) and these do not reflect the actual realized volume of capital flows.
This work employs de facto measures to proxy for IFI of which a subset of these
measures has been used previously. Thus, this work is complementary to the literature
3 de facto indicators
5

in terms of extending to a large number of countries in the dataset over a considerable
time period. In addition, we advance other studies by using a number of newly
developed techniques in panel data estimation to alleviate the bias caused by data and
specification in the model to provide more reliable estimation results.
The remainder of this paper is outlined as follows. Section two reviews the literature.
Section three formulates the model. Section four describes the data and methodology.
Section five reports the results. Section six concludes the paper.
2. Literature Review
Theoretically, Von Furstenberg (1998) is amongst the very first authors to investigate
the prerequisites for IFI in his essay of capital mobility and international financial
integration. He forcefully argues that IFI could not be assessed in isolation from a
country’s financial structure, which is the structure of financial institutions and
markets that constitute a country’s financial system. Agenor (2003) reviews the
literature on the benefits and costs of international financial integration. Lane &
Milesi-Ferretti (2003) and Vo (2005b) provide a detailed discussion of international
financial integration, characterizing its salient features over the last two decades, and
a comparison of the degree of international financial integration across countries and
over time.
In terms of empirical work on international financial integration, many authors
examine different aspects of this concept. Kalemli-Ozcan et al. (1999) empirically
assert that capital market integration leads to higher specialization in production
through better risk sharing. Bekaert and Harvey (2000) propose a cross-sectional
time-series asset price model to assess the impact of market liberalizations in
emerging equity markets on the cost of capital, volatility, beta and correlation with
world market returns. Henry (2000a) investigates the impact of international financial
6

integration on domestic investment. In other study, he examines international
financial integration in terms of financial liberalization (freedom of foreign investors
entry) in emerging markets (Henry 2000b). Beck et al. (2000) report a strong link
between financial intermediaries and economic growth and total factor productivity
growth. They argue that better financial intermediaries can encourage foreign
investment leading to a higher degree of international financial integration and this
helps to fuel economic growth. Many other authors investigate the relationship
between international financial integration and economic growth (Edison, Klein et al.
2002; Edison, Levine et al. 2002; Vo 2005c). Obstfeld & Taylor (2001) provide a
historical review of financial integration and capital markets. Adam et al. (2002)
investigate capital market integration in the European Union. Prasad et al. (2003)
offer evidence on the effects of financial international integration on developing
countries.
A number of authors assess the determinants of de jure measures of international
financial integration - capital controls. Epstein & Schor (1992) investigate the factors
that influence capital controls. Alesina et al. (1994) and Milesi-Ferretti (1995) report
a panel investigation of the incidence of capital controls. Epstein & Schor (1992)
construct an annual capital control index based on the IMF’s annual publication
entitled “Annual Report on Exchange Arrangements and Exchange Restrictions
(AREAER)”. Lemmen & Eijffinger (1996) employ a continuous (and time-varying)
measure for capital controls and find that inflation rates, government instability and
investment are key determinants of capital controls within the European Union.
Obstfeld (1998) argues that the international capital market has the potential to yield
enormous benefits, but that it also constrains national choices over monetary and
fiscal policies, and may facilitate excessive borrowing. Over the medium term,
7

integration into the global capital market also makes it more difficult to tax
internationally footloose capital relative to less mobile factors of production,
especially labour. La Porta et al. (1997) suggest that structure of external finance in a
country depends on the legal rights of shareholders and creditors, as well as on the
degree to which the relevant laws are enforced. The authors give evidence of a strong
link between poor investor protection and smaller and narrower capital markets both
in equity and debt markets. La Porta et al. (1998) further examine legal rules covering
protection of corporate shareholders and creditors, the origin of these rule, and the
quality of these rules and the quality of their enforcement in a cross section sample of
49 countries. They report a negative link between concentration of ownership of
shares in the largest public companies and investor protection and this is consistent
with the hypothesis that small, diversified shareholders are unlikely to be important in
countries that fail to protect their rights.
Portes and Rey (1999) study the determinants of bilateral gross cross-border equity
flows. They offer substantial empirical evidence on the positive linkage between such
flows and various measures of country size (GDP, market capitalization or financial
wealth) and sophistication of the market and negative linkage with transaction costs
and informational frictions. Martin & Rey (2001) demonstrate the importance of the
size of economies and transaction costs for trade flows in assets. Lane & Milesi-
Ferretti (2003) examine the trend of international financial integration in a sample of
18 OECD countries. They look at the correlation with various possible explanatory
variables including the degree of financial restriction, the depth of financial markets,
the openness to international trade etc. They then examine various returns on different
classes of assets in an attempt to measure the degree of international diversification
offered by international investments. Even though Lane & Milesi-Ferretti (2003) are
8

amongst the early financial economists to initiate the analysis of international
financial integration using a subset of de facto measures of IFI, their research is
limited to a number of small countries in the OECD.
In lieu of the current literature, this work will clearly enrich the existing empirical
literature on assessing the determinants of international financial integration. It also
advances other research by providing a large number of indicators to proxy for
international financial integration, extending the sample in the dataset to a large
number of cross-country (79 countries) and over a long period of time (1980-2003). In
addition, we will exploit the advance techniques in panel data estimation to alleviate
biases to provide more reliable results.
3. Model Formulation
We follow the suggestion of Von Furstenberg (1998) to assess international financial
integration in connection with financial structure of a country. To achieve that, as
recommended by Cottarelli & Kourelis (1994) and Hubbard (2004), we examine a
wide array of variables constituting the financial structure including policy on capital
controls, the degree of economic development, the depth of financial markets,
economic growth, the country political and investment environment risk index and the
openness of international trade as the potential determinants of international financial
integration. In other words, this study considers a set of country characteristics that
may influence the level of international financial integration. These include the
variables that might have a potential direct causal relationship like policy on capital
controls or other variables which might indirectly influence the benefits and costs of
international financial integration.
Policy on Capital Controls
9

The impact of government official controls on cross-border capital movements is
considered as an important player in explaining variation in international financial
integration. Capital account liberalization is characterized by the relaxation of official
policy on cross-border capital controls. A high degree of international financial
integration must be associated with free capital mobility without any impediment. If
controls are binding, the level of international asset cross-holdings should increase if
the capital account is liberalized (Lane & Milesi-Ferretti 2003). It is clear that
international financial integration will be affected by the policy on cross-border
capital account transactions. In many studies, capital control measures are classified
as de jure indicators or considered as pre-requisites for international financial
integration (Prasad et al. 2003; Von Furstenberg 1998). It is generally accepted that
the level of international financial integration would be increased if the capital
account is liberalised. However, there is evidence that some developing countries with
capital account restrictions have found these restrictions ineffective in controlling
actual capital flows with episodes of capital flight from some Latin American
countries in the 1970s and 1980s. On the other hand, some countries in Africa have
few restrictions but have experienced only a minimal volume of capital flows (Prasad
et al. 2003). In this paper, the two measures of official capital restrictions viz the
IMF’s Restriction dummy variable (CT1) and the Miniane’s indicator (CT2)4 from
Miniane (2004) are employed.
Level of Development
Edison et al (2002) and Prasad et al (2003) indicate that countries which are rich and
well educated tend to be highly integrated. Hence, to confirm this correlation, we
include lagged GDP per capita [GDP(-1)] and the secondary education enrolment rate
4 See Vo (2005b) for more details.
10

[EDU] in the model to proxy for level of economic development and education
attainment.
Economic growth
Many other studies investigate the relationship between international financial
integration and economic growth (Agenor 2003; Edison, Levine et al. 2002). The
Institute of International Finance (2001; 2003) reports that economic growth acts as a
stimulant for private capital flows into emerging countries. Vo and Daly (2004) state
that net private capital flows to emerging economies do not accelerate economic
growth and suggest a reversed relationship. In addition, Edison et al. (2002) reports a
weak and fragile impact of international financial integration on economic growth and
suggests a potential reversal relationship between IFI and economic growth.
Therefore, we will examine the impact of economic growth on IFI in this paper by
using real per capita GDP (EG) as a control variable.
Institutional, Legal and Investment Environment
Von Furstenberg (1998) argues that IFI requires mutual confidence and the ability to
form reputation capital and charter value to provide a firm basis for trust in the
suppliers of financial services and in the appropriateness of their incentives. Secure
institutional foundations, credibility, internal management controls and ethical
infrastructure are very important prerequisites for IFI. To reap the full benefits and
minimize associated risks, IFI must be closely coordinated with the development of a
sound institutional, legal and investment environment. Moreover, La Porta et al.
(1997) suggest that the structure of external finance in a country depends on the legal
rights of shareholders and creditors, as well as on the degree to which the relevant
laws are enforced. They show that countries with poorer investor protection,
measured by both the character of their legal rules and the quality of law enforcement,
11

have smaller and narrower capital markets. The findings apply to both equity and debt
markets. In other research, La Porta et al. (1998) investigate legal rules covering the
protection of corporate shareholders and creditors, the origin of these rules, and the
quality of their enforcement in 49 countries. The results show that there is close
relationship between laws and international financial integration. In our model, we
use a country risk index from PRS Group5 to represent the level of political risk and
investment risk which allows comparison across countries and over time. This index
ranges from 0 (lowest risk) to 100 (highest risk) and the variable enters the regression
in the natural logarithm form [Ln(ICRG)]. The assumption is the higher the degree of
international financial integration the higher the value of the index. This is according
to the common belief that apart from the priority of a higher rate of return, capital will
flow to the countries with stable economic conditions and lower levels or risk.
In addition, Lemmen and Eijffinger (1996) suggest that inflation rates significantly
explain international financial integration within the European Union. Hence, we
include inflation as a proxy for economic stability (INF). The argument is that
countries with high inflation rates will have the domestic currency depreciated and
create unfavourable conditions for foreign investors. As a consequence, this will lead
to lower capital flow into those countries.
Trade Openness
We also investigate the connection between trade in goods and services and trade in
assets. Hummels et al. (2001) and Yi (2003) examine the importance of trade growth
and suggest that the striking growth in the trade share of output is one of the most
important developments in the world economy. Increased trade openness is also one
of major factors influencing globalization. According to Lane & Milesi-Ferretti
5 This index is calculated based on 22 different types of risk including economic, investment, political and environmental risks by the PRS Group (www.prsgroup.com).
12

(2003), trade openness may contribute to the increased international financial
integration for several reasons. Firstly, trade in goods directly results in corresponding
financial transactions such as trade credit, transportation costs and export insurance.
Secondly, as stated by Obstfeld and Rogoff (2000), there is a close connection
between the gains to international financial diversification and the extent of goods
trade: trade costs create an international wedge between marginal rates of substitution
and hence limit the gains to asset trade. Thirdly, goods trade and financial positions
are jointly determined in some situations, as is often the case with FDI, given the
importance of intra-firm intermediate trade. Finally, openness in goods markets may
increase the willingness to conduct cross-border financial transactions, reducing
financial home bias (a ‘familiarity’ effect) (Lane & Milesi-Ferretti 2003). Thus it
makes sense to include the trade openness (TO) as an explanatory variable in the
model.
Financial Market Development, Financial System and Banking System
It is also argued in the literature that the level of international financial integration is
also dependent on the level of domestic financial development (Von Furstenberg
1998). We use different variables to proxy for the level of financial development
including the size of the stock market (STOCAP), domestic stock market activity or
liquidity (STOACT) and stock market efficiency (STOTO) as suggested by (Beck et
al. 1999). A well-developed financial market helps to attract foreign investors to
diversify their portfolio and increase portfolio investment inflows and hence acts as
stimulants to increased international financial integration. Portes and Rey (1999)
document that the level of gross cross-border capital flows is influenced by the
market size, transaction costs and informational friction. Moreover, Henry (2000a;
13

2000b) investigates the effects of financial market development on investment and
international financial integration and finds that there is a strong link between them.
In addition, we use the ratio of domestic credit to GDP (DCREDIT) and a financial
depth indicator which is the ratio of liquid liabilities to GDP (M2) to proxy for the
development of the domestic financial system. In integrated financial markets
monetary policy cannot control interest rates and exchange rates simultaneously
without the use of another instrument – capital controls. Controls on capital inflows
are intended to keep a strong currency from becoming stronger whereas controls on
capital outflows are intended to support a weak currency. The imposition of capital
controls allows the authorities to pursue “inconsistent” monetary policies for a while.
Consequently, high (low) levels of domestic credit and M2 may indicate the increased
presence of capital export (import) controls (Lemmen & Eijffinger 1996) and hence
the obstruction to international financial integration.
Tax Policy
Tax policy is also a factor which may influence the degree of international financial
integration (Lane & Milesi-Ferretti 2003) and governments are competing over the
tax rate to attract investment (Devereux, Griffith et al. 2002; Devereux, Lockwood et
al. 2002). Firstly, corporations will shift their assets to countries with lower corporate
income tax rates. Secondly, lower tax rates will attract foreign firms and international
financial intermediaries to engage in offshore transactions to take advantage of them.
Thirdly, higher income tax rates will force investors to invest rather than keep income
to avoid the tax burden and by doing so, they will seek lower tax rates in other
countries. Finally, investing overseas may be a good channel for investors to hide
income from domestic regulators (Lane & Milesi-Ferretti 2003). In this research, we
14

use the government tax share of GDP (TAX) as an indicator for tax policy. The
assumption is that a greater tax share indicates a higher tax burden for investors.
The Model
In view of the above discussion, we formulate the model as follows:
it it it itIFI Xα β ε= + +
where IFI is the variable to proxy for the degree of international financial integration,
X is a vector set of variables identified to be the potential determinants of
international financial integration including policy on capital control and other factors
constituting financial structure which are lagged GDP per capita, secondary education
enrolment rate, economic growth, country risk index, inflation, trade openness, capital
market development indicators, financial system indicators and tax policy indicator as
defined in the appendix. The subscript i and t indicate the country unit and time period
respectively.
4. Data and Methodology
Data is a major issue in empirical work investigating the issue of international
financial integration. The paper makes use of the data from the IMF’s International
Financial Statistics and the World Bank’s World Development Indicators. However,
the IMF and the World Bank are collecting data from national reporting bureau of
statistics. It is very important to note that each country uses different methodology to
construct data. In addition, it is noted that some countries report data on foreign
assets, liabilities and their components in book value and some report in market value.
Generally, book value estimates understate the market value of the underlying assets
and liabilities. Similar to other empirical studies employing the data on external
holding, we strive to use a dataset as homogeneous as possible, taking into account
both structural breaks and methodological differences in the calculation of assets and
15

liabilities. Nevertheless, as stated by many financial economists, heterogeneities in the
data unavoidably remain in empirical studies using cross-country data (Engel 2003; Lane
& Milesi-Ferretti 2003).
It is a common belief and recognized by many researchers that there has been an
increased degree of international financial integration during the 1980s and 1990s
(Edison, Levine et al. 2002; Lane & Milesi-Ferretti 2003; Vo 2005a, 2005b). Hence,
our data ranging from 1980 to 2003 clearly exhibit this trend and allowing for short-
term fluctuations. In addition, our sample is comprised of developed and developing
countries6 to uncover any difference in the “drivers” of international financial
integration.
Table 1 exhibits the summary statistics of the data. There is considerable variation
across countries and over time. For example, for the share of the aggregate stock of
assets and liabilities in GDP when employed as an indicator for international financial
integration, the mean is 216%, the median is 124% but the maximum value is 3597%
and the minimum is 19%, while the standard deviation is 377%. There is also a strong
variation in the inflation rates amongst countries and over time. Thus, the dataset
offers substantial cross-country variation for exploring the link between international
financial integration and various economic and investment environment indicators.
INSERT TABLE 1 ABOUT HERE
To obtain an unbiased empirical result, we will employ assorted econometric
techniques to estimate the model. We first use the Least Square Panel Estimator to
estimate the relationship between the determinants and international financial
6 This division is based on the World Bank classification.
16

integration. In addition, we also use other estimators including Two Stage Least
Squares and the Generalized Method of Moments (GMM) panel estimator developed
for dynamic panel data designed by Holtz-Eakin et al. (1990), Arellano and Bond
(1991), Arellano and Bover (1995) and Blundell and Bond (1997) to extract
consistent and efficient estimates of the impact on international financial integration.
The advantages of this GMM panel estimation method is to exploit the time-series
variation in the data, and it accounts for unobserved country-specific effects, allows
for the inclusion of lagged dependent variables as regressors, and controls for the
endogeneity of the explanatory variables. This method has been recently employed by
Carkovic & Levine (2002) and Edison et al. (2002) to study economic growth. To
allow for cross-country differences, we use cross-sectional (country) fixed effects and
White standard errors and covariance with no degree of freedom correction.
5. Results
Figure 1 to 4 represents the broad trend of the selected measures of international
financial integration over the last two decades. Overall, there is an increased trend in
the degree of international financial integration over the last two decades. This salient
character of the increasing trend of international financial integration is consistent
with the current literature.
INSERT FIGURE 1 ABOUT HERE
INSERT FIGURE 2 ABOUT HERE
INSERT FIGURE 3 ABOUT HERE
17

INSERT FIGURE 4 ABOUT HERE
Table 2 shows the correlation matrix of the variables employed in the panel analysis.
It is clear that there is a negative relationship between IFI indicators and capital
control measures where the correlation coefficients are in the range from -19% to -
55%. This supports the view that countries with strict capital controls will be of a
lower degree of international financial integration. In addition, countries which are
rich and well educated tend to be of a higher degree of international financial
integration. This table also represents a positive relationship between international
financial integration and trade openness, the level of financial development, domestic
credit and financial deepening. However, there is a clear negative relationship
between IFI and inflation. Low correlation coefficients reinforce the supposition of a
weak link between economic growth rate and international financial integration as in
Vo (2005a). Moreover, there is a very fragile relationship between tax policy and IFI
as indicated in the last column of the table 2.
INSERT TABLE 2 ABOUT HERE
The table 3 to table 10 report the estimation results in explaining variation in IFI for a
range of specifications from the formulated model. As the least square estimator and
two stage least square estimator offer similar results, we do not report those results
here to save space. In general, the estimated models are characterized by very high R
square (mostly more than 97%). Overall, the Miniane measure (CT2) of capital
controls does not do a good job in explaining variation in IFI as its estimated
coefficient is not significant throughout. On the other hand, the estimated coefficient
18

for the IMF dummy variable (CT1) is generally negative and significant (at both the
5% and 10% level) and this indicates that removing barriers on capital controls helps
to promote international financial integration.
INSERT TABLE 3 & TABLE 4 ABOUT HERE
In table 3 and table 4, we employ the aggregate stock of assets and liabilities as a
share of GDP and the stock of liabilities as a share of GDP respectively as dependent
variables. There is a negative relationship between these measures of international
financial integration and economic growth where the estimated coefficients are in line
5 (three out of four estimated coefficients are significant at 10%). This is perhaps to
support the view suggested by Edison et al. (2002) that less developed and less
integrated countries tend to growth faster. In addition, there are other significant
estimated coefficients including level of economic development (GDP(-1)), however,
this is a negative linkage suggesting the rate of change in the degree of international
financial integration is lower in richer countries. The results from the table 3 and 4
also support the view that increased openness in international trade also associated
with increased international financial integration.
INSERT TABLE 5 TO TABLE 10 HERE
It is clear from the results that domestic credit as a share of GDP (DCREDIT) is a
significant driver of international financial integration (table 3, 4, 5, 6, 9, 10) except
the aggregate flow of equity and inflow of equity (table 7 and table 8). There is also a
negative link between the government tax share and international financial integration
19

even though it is insignificant. This confirms the hypothesis that lower income tax is
an incentive for higher international investment and international financial integration.
Overall, the level of financial market development is positively associated with
stronger international financial integration but this relationship is very fragile (mixed
evidence of significance). Our results represent a weak linkage between inflation and
IFI and this is not like the previous finding of Lemmen & Eijffinger (1996).
Moreover, the financial deepening indicator (M2) does not help in explaining
variation in stock and flow measures of IFI but it does a good job to serve as
determinant of equity measures of IFI. However, it is not robust here because the
estimated coefficient for M2 is positive and significant in Table 8 (at both the 5% and
10% level) but it is negative (even though significant) in Table 9.
In summary, the results from the investigation of the determinants of the variation in
the degree of international financial integration are provided. Even though there is
some insignificant variables, the model are quite successful in explaining variation in
the degree of international financial integration. We have concluded that variables
such as the IMF capital control policy dummy variable, international trade openness,
domestic credit and economic growth are quite successful candidates to act as drivers
of international financial integration.
6. Conclusion
This paper investigates the structural determinants of international financial
integration. The potential “drivers” of international financial integration are identified
from the vast literature including indicators of financial liberalization, level of
economic development, education, country risk index, financial development and tax
policy. The main objective of this paper is to highlight some empirical features of the
growth of the degree of international financial integration. An assorted number of
20

indicators are employed to proxy for international financial integration. In addition,
we use advanced econometric methodology for panel data estimation to estimate the
model in order to alleviate potential biases and to produce more reliable results.
Overall, the results provide strong evidence of an increase in the degree of
international financial integration in the last decade and this is consistent with
previous findings. Even though some variables are unsuccessful in explaining
variation in the degree of international financial integration using volume-based de
facto measures as proxies, the analysis indicates that some variables including the
IMF capital control policy dummy variable, trade openness, domestic credit and
economic growth are potential candidates to explain variation in the degree of
international financial integration. In addition, the results also suggest follow-up
research to better establish lines of causality between these variables which is clearly
a relevant topic and a challenge for both future theoretical and empirical research.
21

Appendices
Appendix 1 - Description of variables
Variable Symbol Description Source
Aggregate Stock of
Assets and
Liabilities
IFI01 Ratio of Total Stock of Assets +
Liabilities to GDP
Vo (2005b)
Stock of Liabilities IFI02 Ratio of Stock of Liabilities to
GDP
Vo (2005b)
Aggregate Stock of
FDI and PI
IFI03 Ratio of Stock FDI + PI to GDP Vo (2005b)
Stock of FDI and PI
inflows
IFI04 Ratio of Stock FDI + PI inflows to
GDP
Vo (2005b)
Aggregate Flows of
Equity
IFIEF Ratio of Flows of FDI + PI equity
to GDP
Vo (2005b)
Inflows of Equity IFIEFI Ratio of Inflows of FDI + PI
equity to GDP
Vo (2005b)
Aggregate Stock of
Equity
IFIES Ratio of Stock FDI + PI equity to
GDP
Vo (2005b)
Stock of Equity
Inflows
IFIESI Ratio of Stock FDI + PI equity
inflows to GDP
Vo (2005b)
IMF Dummy CT1 Capital Restriction Measures from
AREAER
Vo (2005b)
Miniane’s Indicator CT2 Miniane (2004)
Lagged GDP per
capita
GDP(-1) Previous year GDP per capita World Bank’s World
Development Indicators
2004 CDRom
Secondary
Education
Enrolment Rate
EDU The proportion of population that
enrols in secondary education
World Bank’s World
Development Indicators
2004 CDRom
Economic Growth EG Annual growth rate of real per
capita GDP
World Bank’s World
Development Indicators
2004 CDRom
Institutional, Legal
and Investment
Environment
Indicator
ICRG International Country Risk Index
ranging from 0 (highest risk) to
100 (lowest risk)
World Bank’s World
Development Indicators
2004 CDRom
Inflation INF This is defined as the difference in
the natural logarithm of consumer
priced index
IMF’s International
Financial Statistics
22

Trade Openness TO Total Import and Export as share
of GDP
IMF’s Direction of Trade
Statistics or World Bank’s
World Development
Indicators 2004 CDRom
The size of stock
market
STOCAP the stock market capitalization to
GDP ratio which equals the value
of listed shares divided by GDP.
Both numerator and denominator
are deflated appropriately, with
the numerator equalling the
average of the end-of-year value
for year t and year t-1, both
deflated by the respective end-of-
year CPI, and the GDP deflated by
the annual value of the CPI.
Standard & Poor's,
Emerging Stock Markets
Factbook and
supplemental S&P data,
and World Bank and
OECD GDP estimates.
The domestic stock
market activity or
liquidity
STOACT the total value of trades of stock
on domestic exchanges as a share
of GDP. Since both numerator and
denominator are flow variables
measured over the same time
period, deflating is not necessary
in this case.
Standard & Poor's,
Emerging Stock Markets
Factbook and
supplemental S&P data,
and World Bank and
OECD GDP estimates.
The stock market
efficiency
STOTO the stock market turnover ratio as
efficiency indicator of stock
markets. It is defined as the ratio
of the value of total shares traded
and market capitalization. It
measures the activity or liquidity
of a stock market relative to its
size. A small but active stock
market will have a high turnover
ratio whereas a large, while a less
liquid stock market will have a
low turnover ratio. Since this
indicator is the ratio of a stock and
a flow variable, we apply a similar
deflating procedure as for the
market capitalization indicator.
Standard & Poor's,
Emerging Stock Markets
Factbook and
supplemental S&P data,
and World Bank and
OECD GDP estimates.
Domestic Credit DCREDIT Domestic Credit Provided By
banks and financial institution
World Bank’s World
Development Indicators
23

2004 CDRom
Financial Depth M2 Ratio of liquid liabilities to GDP World Bank’s World
Development Indicators
2004 CDRom
Tax Share TAX Government Tax share in GDP World Bank’s World
Development Indicators
2004 CDRom
Appendix 2 - List of Countries in the sample
Developed Countries
Australia, Austria, Bahamas, Bahrain, Canada, Cyprus, Denmark, Finland, France, Germany, Greece,
Iceland, Ireland, Israel, Italy, Japan, Korea, Kuwait, Luxembourg, Malta, Netherlands, Netherlands
Antilles, New Zealand, Norway, Portugal, Singapore, Spain, Sweden, Switzerland, United Kingdom,
United States.
Developing Countries
Argentina, Barbados, Bolivia, Botswana, Brazil, Cape Verde, Chile, China, Colombia, Congo, Costa
Rica, Czech Republic, Egypt, El Salvador, Fiji, Gabon, Haiti, Hungary, India, Indonesia, Jamaica,
Jordan, Kenya, Libya, Malaysia, Mali, Mauritius, Mexico, Morocco, Namibia, Nigeria, Pakistan,
Paraguay, Peru, Philippines, Senegal, Seychelles, South Africa, Sri Lanka, Swaziland, Thailand, Togo,
Tunisia, Turkey, Uruguay, Vanuatu, Venezuela.
24

List of Tables and Figures
Table 1 Data Descriptive Statistics
Mean Median Maximum Minimum Std. Dev. IFI01 2.16 1.24 35.97 0.19 3.77 IFI02 1.14 0.76 17.44 0.08 1.80 IFI03 0.82 0.51 10.02 0.03 0.96 IFI04 0.46 0.36 5.08 0.02 0.46 IFIEF 0.07 0.04 1.36 0.00 0.13 IFIEFI 0.04 0.02 1.00 0.00 0.08 IFIES 0.59 0.38 5.91 0.02 0.68 IFIESI 0.33 0.23 4.39 0.01 0.40 CT1 0.50 1.00 1.00 0.00 0.50 CT2 0.53 0.50 1.00 0.08 0.32 LGDPCAL 8.36 8.37 10.99 5.05 1.45 EDU 0.75 0.76 1.61 0.06 0.32 EG 0.02 0.02 0.35 -0.25 0.04 LN(ICRG) 4.22 4.26 4.56 3.24 0.22 INFLATION 0.37 0.06 117.50 -1.00 3.72 TRADE 0.78 0.67 2.96 0.12 0.46 STOCAP 0.49 0.31 3.30 0.00 0.50 STOACT 0.27 0.09 3.26 0.00 0.45 STOTO 0.49 0.33 4.75 0.00 0.57 DCREDIT 0.55 0.45 2.03 0.03 0.39 M2 0.47 0.40 1.73 0.04 0.29 TAX 0.22 0.20 0.49 0.00 0.09
25

Table 2 Correlation Matrix IFI01 IFI02 IFI03 IFI04 IFIEF IFIEFI IFIES IFIESI CT1 CT2 GDP(-1) EDU EG LN(ICRG) INFLATION
TRADE OPENNESS STOCAP STOACT STOTO DCREDIT M2 TAX
IFI01 1.00 0.99 0.71 0.58 0.65 0.56 0.73 0.69 -0.41 -0.55 0.11 0.14 0.00 0.05 -0.02 0.45 0.33 0.22 0.02 0.08 0.19 -0.21
IFI02 1.00 0.70 0.60 0.69 0.60 0.71 0.70 -0.42 -0.54 0.07 0.14 -0.01 0.01 -0.01 0.45 0.32 0.19 0.01 0.04 0.18 -0.22
IFI03 1.00 0.95 0.84 0.74 0.97 0.92 -0.42 -0.52 0.34 0.45 0.00 0.34 -0.18 0.23 0.51 0.48 0.17 0.37 0.33 0.09
IFI04 1.00 0.86 0.78 0.93 0.94 -0.46 -0.52 0.28 0.48 -0.01 0.31 -0.19 0.25 0.46 0.45 0.16 0.26 0.24 0.16
IFIEF
1.00 0.97 0.83 0.88 -0.30 -0.33 0.18 0.40 0.21 0.22 -0.05 0.43 0.32 0.24 0.02 0.18 0.28 0.11
IFIEFI 1.00 0.72 0.82 -0.19 -0.19 0.08 0.26 0.17 0.14 -0.04 0.41 0.19 0.13 -0.01 0.10 0.23 -0.08
IFIES 1.00 0.95 -0.30 -0.38 0.31 0.38 0.03 0.34 -0.15 0.27 0.57 0.55 0.17 0.41 0.34 0.08
IFIESI 1.00 -0.28 -0.33 0.14 0.25 -0.01 0.22 -0.11 0.37 0.46 0.42 0.06 0.21 0.19 0.08
CT1 1.00 0.76 -0.58 -0.52 -0.04 -0.58 0.15 -0.32 -0.33 -0.35 -0.15 -0.53 -0.66 -0.27
CT2 1.00 -0.75 -0.66 -0.03 -0.65 0.17 -0.09 -0.13 -0.26 -0.29 -0.39 -0.53 -0.46
GDP(-1) 1.00 0.84 0.05 0.75 -0.04 0.15 0.39 0.37 0.19 0.62 0.37 0.47
EDU 1.00 0.10 0.66 -0.07 0.00 0.33 0.30 0.33 0.53 0.36 0.50
EG 1.00 0.28 -0.10 0.09 0.12 0.12 0.19 0.11 0.08 0.08
LOG(ICRG) 1.00 -0.19 0.15 0.40 0.34 0.19 0.60 0.42 0.46
INFLATION 1.00 -0.08 -0.09 -0.06 -0.03 -0.06 -0.11 -0.08
TO 1.00 0.17 0.15 -0.14 0.14 0.38 0.24
STOCAP 1.00 0.71 0.20 0.58 0.41 0.04
STOACT 1.00 0.58 0.51 0.26 -0.02
STOTO 1.00 0.27 0.09 -0.06
DCREDIT 1.00 0.66 0.24
M2 1.00 0.18
TAX 1.00

Table 3 Panel Estimation of the Aggregate Stock of Assets and Liabilities as share of GDP
Coefficient t-statistics Probability Coefficient t-
statistics Probability
CT1 -0.65* -(3.13) 0.00 CT2 0.74** (1.77) 0.09 GDP(-1) -1.62* -(3.16) 0.00 -1.35* -(2.23) 0.03 EDU 0.28 (0.95) 0.35 -0.23 -(1.02) 0.32 EG -2.44* -(2.90) 0.01 -1.56 -(1.50) 0.14 LN(ICRG) 0.28 (0.61) 0.55 0.88 (1.50) 0.15 INFLATION 0.07** (1.73) 0.09 -0.08 -(0.60) 0.55 TO 1.63* (3.26) 0.00 0.67 (1.35) 0.19 STOCAP 0.27* (3.91) 0.00 0.11 (1.45) 0.16 STOACT -0.38* -(3.40) 0.00 -0.24* -(2.73) 0.01 STOTO 0.66* (3.79) 0.00 0.33* (2.47) 0.02 DCREDIT 1.44* (6.05) 0.00 1.35* (6.36) 0.00 M2 -0.37 -(0.48) 0.64 0.91 (1.65) 0.11 TAX -2.41 -(1.05) 0.30 -2.06 -(0.79) 0.43
R2 0.9712 0.9708
Note: Dependent variable is Aggregate Stock of Assets and Liabilities as share of GDP, GMM Estimator * Significant at both 5% and 10% level ** Significant at 10% level

Table 4 Panel Estimation of the Stock of Liabilities as share of GDP
Coefficient t-statistics Probability Coefficient t-
statistics Probability
CT1 -0.49* -(3.35) 0.00 CT2 0.24 (1.11) 0.28 GDP(-1) -0.76* -(2.48) 0.02 -0.50 -(1.41) 0.17 EDU 0.27** (1.86) 0.07 -0.02 -(0.14) 0.89 EG -1.42* -(3.42) 0.00 -0.98** -(1.89) 0.07 LN(ICRG) -0.14 -(0.45) 0.65 0.40 (1.10) 0.28 INFLATION 0.03 (1.66) 0.11 -0.06 -(0.72) 0.48 TO 0.68* (2.60) 0.01 0.12 (0.43) 0.67 STOCAP 0.20* (5.25) 0.00 0.09** (1.93) 0.06 STOACT -0.24* -(4.54) 0.00 -0.14* -(2.89) 0.01 STOTO 0.43* (4.36) 0.00 0.20* (2.46) 0.02 DCREDIT 0.97* (8.32) 0.00 0.89* (7.49) 0.00 M2 0.06 (0.14) 0.89 0.75* (2.57) 0.02 TAX -1.85 -(1.61) 0.12 -1.15 -(0.83) 0.42
R2 0.9767 0.9709
Note: Dependent variable is Stock of Liabilities as share of GDP, GMM Estimator * Significant at both 5% and 10% level ** Significant at 10% level
28

Table 5 Panel Estimation of the Aggregate Stock of FDI and Portfolio Investment Assets and Liabilities as share of GDP
Coefficient t-statistics Probability Coefficient t-
statistics Probability
CT1 -0.29 -(1.33) 0.20 CT2 0.47 (1.64) 0.11 GDP(-1) -1.44* -(5.72) 0.00 -1.44* -(4.58) 0.00 EDU -0.13 -(0.58) 0.57 -0.52* -(2.59) 0.02 EG -0.99** -(1.91) 0.07 -0.16 -(0.31) 0.76 LN(ICRG) 0.16 (0.82) 0.42 0.39 (1.58) 0.13 INFLATION 0.01 (0.39) 0.70 -0.06 -(0.95) 0.35 TO 0.17 (0.75) 0.46 -0.50* -(2.67) 0.01 STOCAP 0.08 (0.96) 0.35 -0.04 -(0.64) 0.53 STOACT -0.15 -(1.59) 0.13 -0.08 -(1.38) 0.18 STOTO 0.20 (1.16) 0.26 0.02 (0.25) 0.80 DCREDIT 0.96* (5.99) 0.00 0.99* (9.07) 0.00 M2 0.10 (0.41) 0.68 0.79** (1.87) 0.07 TAX -0.43 -(0.22) 0.83 -2.45 -(1.34) 0.19
R2 0.9748 0.9785
Note: Dependent variable is Aggregate Stock of FDI and Portfolio Investment Assets and Liabilities as share of GDP, GMM Estimator * Significant at both 5% and 10% level ** Significant at 10% level
29

Table 6 Panel Estimation of the Stock of FDI and PI inflows as share of GDP
Coefficient t-statistics Probability Coefficient t-
statistics Probability
CT1 -0.35* -(5.74) 0.00 CT2 0.08 (0.51) 0.62 GDP(-1) -0.82* -(4.33) 0.00 -0.63* -(2.65) 0.01 EDU 0.02 (0.18) 0.86 -0.16 -(1.53) 0.14 EG -0.53* -(2.03) 0.05 -0.30 -(1.04) 0.31 LN(ICRG) -0.05 -(0.38) 0.70 0.35 (1.63) 0.12 INFLATION 0.00 (0.00) 1.00 -0.06 -(1.14) 0.26 TO -0.17 -(1.39) 0.18 -0.54* -(3.98) 0.00 STOCAP 0.10* (2.94) 0.01 0.03 (0.88) 0.39 STOACT -0.10* -(2.79) 0.01 -0.04 -(1.10) 0.28 STOTO 0.19* (4.40) 0.00 0.04 (0.68) 0.50 DCREDIT 0.63* (6.67) 0.00 0.56* (6.35) 0.00 M2 0.68* (2.53) 0.02 1.09* (3.78) 0.00 TAX -0.64 -(0.75) 0.46 -0.05 -(0.05) 0.96
R2 0.9846 0.9803
Note: Dependent variable is Stock of FDI and PI inflows as share of GDP, GMM Estimator * Significant at both 5% and 10% level ** Significant at 10% level
30

Table 7 Panel Estimation of the Aggregate Flows of Equity as share of GDP
Coefficient t-statistics Probability Coefficient t-
statistics Probability
CT1 -0.01 -(0.49) 0.62 CT2 -0.04 -(0.55) 0.59 GDP(-1) 0.08 (0.86) 0.40 0.15 (1.61) 0.12 EDU -0.03 -(0.68) 0.50 -0.04 -(0.85) 0.40 EG -0.04 -(0.42) 0.68 -0.08 -(0.73) 0.47 LN(ICRG) 0.00 -(0.04) 0.97 -0.01 -(0.39) 0.70 INFLATION 0.01 (1.52) 0.14 0.01* (2.28) 0.03 TO 0.31 (1.55) 0.13 0.22 (1.22) 0.23 STOCAP -0.04** -(1.69) 0.10 0.02 (0.67) 0.51 STOACT 0.03** (1.91) 0.06 0.03 (1.45) 0.16 STOTO -0.01 -(0.66) 0.51 0.00 -(0.21) 0.84 DCREDIT -0.04 -(0.32) 0.75 -0.13 -(1.09) 0.28 M2 -0.19 -(0.74) 0.46 -0.12 -(0.48) 0.64 TAX -0.65* -(2.33) 0.03 -0.67* -(2.03) 0.05
R2 0.7524 0.7655
Note: Dependent variable is Aggregate Flows of Equity as share of GDP, GMM Estimator * Significant at both 5% and 10% level ** Significant at 10% level
31
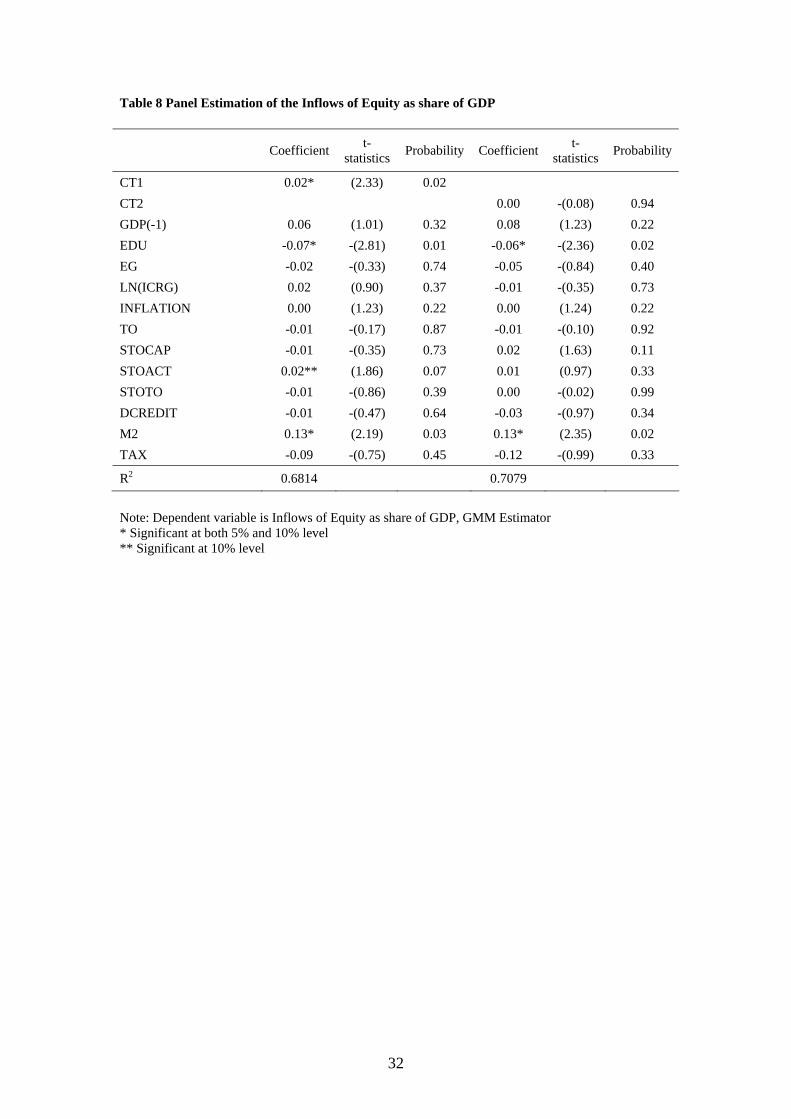
Table 8 Panel Estimation of the Inflows of Equity as share of GDP
Coefficient t-statistics Probability Coefficient t-
statistics Probability
CT1 0.02* (2.33) 0.02 CT2 0.00 -(0.08) 0.94 GDP(-1) 0.06 (1.01) 0.32 0.08 (1.23) 0.22 EDU -0.07* -(2.81) 0.01 -0.06* -(2.36) 0.02 EG -0.02 -(0.33) 0.74 -0.05 -(0.84) 0.40 LN(ICRG) 0.02 (0.90) 0.37 -0.01 -(0.35) 0.73 INFLATION 0.00 (1.23) 0.22 0.00 (1.24) 0.22 TO -0.01 -(0.17) 0.87 -0.01 -(0.10) 0.92 STOCAP -0.01 -(0.35) 0.73 0.02 (1.63) 0.11 STOACT 0.02** (1.86) 0.07 0.01 (0.97) 0.33 STOTO -0.01 -(0.86) 0.39 0.00 -(0.02) 0.99 DCREDIT -0.01 -(0.47) 0.64 -0.03 -(0.97) 0.34 M2 0.13* (2.19) 0.03 0.13* (2.35) 0.02 TAX -0.09 -(0.75) 0.45 -0.12 -(0.99) 0.33
R2 0.6814 0.7079
Note: Dependent variable is Inflows of Equity as share of GDP, GMM Estimator * Significant at both 5% and 10% level ** Significant at 10% level
32

Table 9 Panel Estimation of the Stock of Equity as share of GDP
Coefficient t-statistics Probability Coefficient t-
statistics Probability
CT1 0.07 (0.39) 0.70 CT2 0.44 (1.33) 0.20 GDP(-1) -2.61* -(3.46) 0.00 -2.73* -(4.53) 0.00 EDU 0.44 (1.53) 0.14 0.04 (0.17) 0.87 EG -2.15* -(2.36) 0.03 -0.67 -(0.71) 0.49 LN(ICRG) -0.03 -(0.05) 0.96 0.31 (0.73) 0.48 INFLATION -1.57 -(1.09) 0.29 -0.08 -(0.11) 0.91 TO 1.34** (1.99) 0.06 0.35 (0.83) 0.42 STOCAP 0.05 (0.72) 0.48 -0.10 -(1.58) 0.13 STOACT -0.12 -(1.28) 0.22 -0.09 -(0.78) 0.45 STOTO 0.24 (1.61) 0.12 0.18 (0.98) 0.34 DCREDIT 0.84* (6.85) 0.00 0.89* (4.92) 0.00 M2 -1.89* -(2.78) 0.01 -0.94* -(2.65) 0.02 TAX 1.72 (0.81) 0.43 -1.03 -(0.57) 0.58
R2 0.9643 0.9691
Note: Dependent variable is Stock of Equity as share of GDP, GMM Estimator. * Significant at both 5% and 10% level ** Significant at 10% level
33

Table 10 Panel Estimation of the Stock of Equity Inflows as share of GDP
Coefficient t-statistics Probability Coefficient t-statistics Probability
CT1 -0.10 -(1.20) 0.24 CT2 0.11 (0.88) 0.39 GDP(-1) -0.41* -(2.88) 0.01 -0.41* -(2.35) 0.03 EDU -0.01 -(0.10) 0.92 -0.13 -(1.19) 0.25 EG -0.22 -(1.26) 0.22 0.03 (0.12) 0.90 LN(ICRG) -0.03 -(0.30) 0.76 0.09 (0.65) 0.52 INFLATION 0.01 (0.39) 0.70 -0.02 -(0.69) 0.50 TO -0.10 -(1.11) 0.28 -0.30* -(2.36) 0.03 STOCAP 0.07 (1.47) 0.15 0.03 (0.78) 0.45 STOACT -0.07 -(1.40) 0.17 -0.05 -(1.25) 0.22 STOTO 0.10 (1.27) 0.22 0.04 (0.96) 0.35 DCREDIT 0.51* (6.41) 0.00 0.52* (7.65) 0.00 M2 0.24 (1.31) 0.20 0.44 (1.56) 0.13 TAX 0.51 (0.64) 0.53 0.00 (0.01) 1.00
R2 0.9651 0.9666
Note: Dependent variable is Stock of Equity Inflows as share of GDP, GMM Estimator * Significant at both 5% and 10% level ** Significant at 10% level
34

Figure 1 Broad trend of Stock Assets and Liabilities and Stock of Liabilities
0.0
0.5
1.0
1.5
2.0
2.5
3.0
3.5
80 82 84 86 88 90 92 94 96 98 00 02
Mean Stock of assets and liabilities as share of GDPMean Stock of libabilities as share of GDP
35

Figure 2 Broad trend of Gross Stock FDI + PI and Stock of FDI and PI inflows
0.0
0.2
0.4
0.6
0.8
1.0
1.2
1.4
1.6
80 82 84 86 88 90 92 94 96 98 00 02
Mean Gross Stock FDI + Portfolio Investment as share of GDPMean Stock FDI and Portfolio Investment Inflows as share of GDP
36

Figure 3 Broad trend of Aggregate Flows of Equity and Inflows of Equity
.00
.04
.08
.12
.16
.20
80 82 84 86 88 90 92 94 96 98 00 02
Mean Aggregate Flows of Equity as share of GDPMean Inflows of Equity as share of GDP
37

Figure 4 Broad trend of Aggregate Stock Equity and Stock of Equity Inflows
0.1
0.2
0.3
0.4
0.5
0.6
0.7
0.8
0.9
1.0
80 82 84 86 88 90 92 94 96 98 00 02
Mean Aggregate Stock Equity as share of GDPMean Stock of Equity Inflows as share of GDP
38

References
Adam, K. et al. 2002, 'Analyse, Compare, and Supply Alternative Indicators and Monitoring Methodologies to Measure the Evolution of Capital Market Integration in the European Union', Mimeo, University of Salerno.
Agenor, P.-R. 2003, 'Benefits and Costs of International Financial Integration: Theory and Facts', World Economy, vol. 26, no. 8, pp. 1089-1118.
Alesina, A. et al. 1994, 'The Political Economy of Capital Controls', in L. Leiderman & A. Razin (eds), Capital Mobility: The Impact on Consumption, Investment and Growth, Cambridge University Press, Cambridge.
Arellano, M. & Bond, S. 1991, 'Some Tests of Specification for Panel Data: Monte Carlo Evidence and an Application to Employment Equations', Review of Economic Studies, vol. 58, no. 194, pp. 277-297.
Arellano, M. & Bover, O. 1995, 'Another Look at the Instrumental-Variable Estimation of Error-Components Models', Journal of Econometrics, vol. 68, no. 1, pp. 29-51.
Beck, T. et al. 1999, 'A New Database on Financial Development and Structure', Financial Sector Discussion Paper, no. 2.
Beck, T. et al. 2000, 'Finance and the Sources of Growth', Journal of Financial Economics, vol. 58, no. 1-2, pp. 261-300.
Bekaert, G. & Harvey, C.R. 2000, 'Foreign Speculators and Emerging Equity Markets', Journal of Finance, vol. 55, no. 2, pp. 565-613.
Blundell, R. & Bond, S. 1997, 'Initial Conditions and Moment Restrictions in Dynamic Panel Data Models', University College London Discussion Paper, no. 97-07.
Carkovic, M. & Levine, R. 2002, Does Foreign Direct Investment Accelerate Economic Growth?, World Bank, viewed 10/10/2004 <http://www.worldbank.org/research/conferences/financial_globalization/fdi.pdf>.
Cottarelli, C. & Kourelis, A. 1994, 'Financial Structure, Bank Lending Rates, and the Transmission Mechanism of Monetary Policy', International Monetary Fund Staff Papers, vol. 41, no. 4, pp. 587-623.
Devereux, M.P. et al. 2002, 'Corporate Income Tax Reforms and International Tax Competition', Economic Policy, vol. 17, no. 35, pp. 450-495.
Devereux, M.P. et al. 2002, 'Do Countries Compete over Corporate Tax Rates?' C.E.P.R Discussion Papers, no. 3400.
Edison, H.J. et al. 2002, 'Capital Account Liberalization and Economic Performance: Survey and Synthesis', National Bureau of Economic Research Working Paper, no. 9100.
Edison, H.J. et al. 2002, 'International Financial Integration and Economic Growth', Journal of International Money and Finance, vol. 21, no. 6, pp. 749-776.
Engel, C. 2003, 'Comments on "International Financial Integration"', IMF Staff Papers, vol. 50, no. Special Issue, pp. 114-119.
Epstein, G.A. & Schor, J.B. 1992, 'Structural Determinants and Economics Effects of Capital Controls in Oecd Countries', in T. Banuri & J.B. Schor (eds), Financial Openness and National Autonomy, Opportunities and Constraints, Clarendon Press, Oxford.
Grilli, V. & Milesi-Ferretti, G.M. 1995, 'Economic Effects and Structural Determinants of Capital Controls', IMF Staff Paper, vol. 42, no. 3, pp. 517-551.
39

Henry, P.B. 2000a, 'Do Stock Market Liberalizations Cause Investment Booms?' Journal of Financial Economics, vol. 58, no. 1-2, pp. 301-334.
Henry, P.B. 2000b, 'Stock Market Liberalization, Economic Reform, and Emerging Market Equity Prices', Journal of Finance, vol. 55, no. 2, pp. 529-564.
Holtz-Eakin, D. et al. 1990, 'Estimating Vector Autoregressions with Panel Data', Econometrica, vol. 56, no. 6, pp. 1371-1395.
Hubbard, R.G. 2004, Money, the Financial System, and the Economy, 5 edn, Pearson Education.
Hummels, D. et al. 2001, 'The Nature and Growth of Vertical Specialization in World Trade', Journal of International Economics, vol. 54, no. 1, pp. 75-96.
Institute of International Finance 2001, Capital Flows to Emerging Market Economies, Institute of International Finance, Inc., New York.
Institute of International Finance 2003, Capital Flows to Emerging Market Economies, Institute of International Finance, Inc., New York.
Kalemli-Ozcan, S. et al. 1999, 'Risk Sharing and Industrial Specialization: Regional and International Evidence', Mimeo, Tel Aviv University.
Kearney, C. & Lucey, B.M. 2004, 'International Equity Market Integration: Theory, Evidence and Implications', International Review of Financial Analysis, vol. 13, no. 5, pp. 571-583.
La Porta, R. et al. 1997, 'Legal Determinants of External Finance', Journal of Finance, vol. 52, no. 3, pp. 1131-1150.
La Porta, R. et al. 1998, 'Law and Finance', Journal of Political Economy, vol. 106, no. 6, pp. 1113-1155.
Lane, P.R. 2000, 'International Investment Positions: A Cross-Sectional Analysis', Journal of International Money and Finance, vol. 19, no. 4, pp. 513-534.
Lane, P.R. & Milesi-Ferretti, G.M. 2003, 'International Financial Integration', Institute for International Integration Studies Discussion Paper.
Lemmen, J.J.G. & Eijffinger, S.C.W. 1996, 'The Fundamental Determinants of Financial Integration in the European Union', Weltwirtschaftliches Archiv: Review of World Economics, vol. 132, no. 3, pp. 432-487.
Martin, P. & Rey, H. 2001, 'Financial Super-Markets: Size Matters for Asset Trade', National Bureau of Economic Research Working Paper, vol. 8476.
Milesi-Ferretti, G.M. 1995, 'Why Capital Controls? Theory and Evidence', Positive Political Economy: Theory and Evidence, Center for Economic Research of Tilburg University.
Miniane, J. 2004, 'A New Set of Measures on Capital Account Restrictions', IMF Staff Papers, vol. 51, no. 2, pp. 276-308.
Morrison, A.D. & White, L. 2004, 'Financial Liberalisation and Capital Regulation in Open Economies', Oxford Financial Research Centre Working Paper, no. 2004-FE-10.
Obstfeld, M. 1998, 'The Global Capital Market: Benefactor or Menace?' Journal of Economic Perspectives, vol. 12, no. 4, pp. 9-30.
Obstfeld, M. & Rogoff, K. 2000, 'The Six Major Puzzles in International Macroeconomics: Is There a Common Cause?' NBER Working Paper Series, vol. 7777.
Obstfeld, M. & Taylor, A.M. 2001, 'Globalization and Capital Markets', Globalization in Historical Perspective, Santa Barbara.
Portes, R. & Rey, H. 1999, 'The Determinants of Cross-Border Equity Flows', National Bureau of Economic Research Working Paper, no. 7336.
40

Prasad, E. et al. 2003, Effects of Financial Globalization on Developing Countries: Some Empirical Evidence, The Centre de Referència d'Economia Analítica, viewed 28/01/2005 <www.barcelonaeconomics.org/FinancialGlobalization.doc>.
Vo, X.V. 2005a, International Financial Integration and Economic Growth - a Panel Analysis, Working Paper Series, School of Economics and Finance - University of Western Sydney.
Vo, X.V. 2005b, A New Set of Measures on International Financial Integration, Working Paper Series, School of Economics and Finance, University of Western Sydney.
Vo, X.V. 2005c, 'A New Set of Measures on International Financial Integration', Proceedings of the 3rd Financial Market Asia Pacific Conference, University of Western Sydney, Sydney.
Vo, X.V. & Daly, K.J. 2004, 'The Relationships between Net Private Capital Flows and Economic Growth in Emerging Asian Economies', International Business Research Conference - World Business Institute, ed. M. Hoque, Victoria University of Technology, Melbourne.
Vo, X.V. & Daly, K.J. 2005a, 'European Equity Market Integration - Implication for Us Investors', Journal of Research in International Business and Finance, vol. 19, no. 1, pp. 155-170.
Vo, X.V. & Daly, K.J. 2005b, 'International Financial Integration: An Empirical Investigation into Asian Equity Markets Pre and Post 1997 Asian Financial Crisis', in T.A. Fetherston & J.A. Batten (eds), Asian Pacific Financial Markets in Comparative Perspective: Issues and Implications for the 21st Century, vol. 87, Elsevier Science, Amsterdam Netherlands.
Von Furstenberg, G.M. 1998, 'From Worldwide Capital Mobility to International Financial Integration: A Review Essay', Open Economies Review, vol. 9, pp. 53-89.
Yi, K.M. 2003, 'Can Vertical Specialization Explain the Growth of World Trade?' Journal of Political Economy, vol. 111, no. 1, pp. 52-102.
41