determinants of homeowner's response to energy conservation in non-metropolitan areas
TRANSCRIPT
Energy Vol. 14, No. 7, pp. 397408, 1989 0360-5442/89 $3.00 + 0.00 Printed in Great Britain. All rights reserved Copyright @ 1989 Pergamon Press plc
DETERMINANTS OF HOMEOWNER’S RESPONSE TO ENERGY CONSERVATION IN NON-METROPOLITAN
AREAS?
JOSEPH LAQUATRA and PETER S. K. CHI
College of Human Ecology, Cornell University, Ithaca, NY 14853, U.S.A.
(Received 26 July 1988)
Abstract-The purpose of this paper is to analyze determinants of the household energy response, including physical adjustments of the house and behavioral adjustments of household members. Three models are constructed: the first is used to quantify conservation actions using an index of energy conservation; the second is employed to identify factors related to behavioral adjustments with respect to no-cost measures; the third model deals with household future energy conservation plans. One of the most important observations from this study is that energy conservation is a cumulative process for households that is multi-dimensional in scope. Another important finding is that household participation in a utility energy audit program is highly related to levels of energy conservation. Special attention is paid to particular socioeconomic groups, who are identified as having specific needs for tailored educational programs.
INTRODUCTION
The largest component of energy demand at the household level in northern climates is used for space heating. Identified determinants of this demand include variables related to weather, fuel prices, structural characteristics of housing, and levels of thermal integrity.‘,* Interactions among these and other variables, such as the household financial situation and demographic composition, can influence the decision to implement energy-conservation measures.3 A better understanding of these relationships would be useful for policy makers, providers of energy services, and builders, in targeting various segments of the market for residential energy efficiency.
This paper deals with an analysis of determinants of the household energy response, which is defined as the decision to implement energy conserving measures. Two important aspects of the energy response are physical adjustments of the house and behavioral adjustments of household members.
REVIEW OF RELATED LITERATURE
In the literature, various dimensions of the household energy response have been examined from a number of perspectives. Tonn and Berry4 report on studies that have shown a curvilinear relationship between age and conservation behavior: one- and two-member households with a young or elderly head invest less in conservation than do those with middle-aged heads of households. Similar findings, based on family life-cycle stage, were reported by Marganus and Badenhop’ and Fritzche.‘j
Relationships between particular residential energy conservation measures and characteris- tics of households that conserve were examined by Press and Tanur.3 Three specific improvements to the home level of thermal integrity comprised the focus of their study: (1) addition of storm windows and doors or window/door replacement with efficient alternatives; (2) addition of attic, roof, or wall insulation; and (3) installation of caulking, weatherstripping, or plastic over doors and windows. Using data on 1641 households from the National Interim
tThis paper was originally presented at the Sixth Annual International Conference of the Energy Efficient Building Association, Portland, Maine (April 1988).
397
398 JOSEPH LAQUATRA and PETER S. K. CHI
Energy Consumption Survey, which was conducted during the winter of 1978-1979, two models were estimated. One of these dealt with behavior associated with the implementation of energy conservation measures and the other with an examination of household propensity to conserve energy. Marginal and joint probabilities of adopting the measures indicated interdependence among factors leading to conservation decisions. Among other findings in this study were observations that the probability of implementing all three measures when storm windows were not in place increased when households were rural with young children, and as heating degree-days increased. Another finding was that the joint probability of implementing all three measures when insulation was not in place increased when households were urban and were occupied by married couples, but decreased with the presence of elderly people in the household and as the age of the house increased.
Whether or not heating-fuel consumption is reduced through conservation measures (such as insulation and storm windows) or alternative generating strategies (such as passive solar designs), benefits can be identified as savings in expenditures for fuel inputs, plus the portion of house equity attributable to any durable good investment. In perfectly functioning capital markets, the present value of an investment good is the discounted flow of its net benefits through time.
Wurtzenbach and Waller7 have supplied a rationale for the application of discounted cash-flow analysis to investments in residential energy efficiency. From the perspective of a homeowner choosing between conservation expenditures or deposits into some type of savings account, the choice can be viewed as an investment decision. Within this context, the homeowner is evaluating future benefit and cost streams, and in so doing is discounting. While few homeowners may know their own discount rates, implicit rates can be calculated from observations on conservation investments.
In a discounted cash-flow analysis that focused not on net present value but on before- and after-tax rates of return, Gates’ compared selected energy-conservation options, including wall and attic insulation, window coverings, and solar domestic hot water, with traditional investment opportunities: stocks, bonds, money market funds, and real estate investment trusts. An observation in this study was that before-tax rates of return on all conservation measures except for solar domestic hot water systems, exceeded those of traditional investments. However, Gates concluded that higher yields alone are not enough to induce energy-conservation investments, and he listed other criteria that are important to the financial decision such as liquidity considerations, risk, and the cost of information, three factors on which conservation investments rank lower than traditional alternatives.
Using ethnographic techniques, Kempton and Montgomery” explored the issue of decision making with regard to energy conservation and reported that what may be called folk quantification of energy consumption is common. While less sophisticated than the analytical tools of energy experts, a variety of folk measurements and heuristics are used by households in calculating the value of energy savings. These authors observed that measurement inaccuracies are not randomly distributed but rather are systematically biased and result in less conservation than is predicted by a rational response to price changes. To address this issue, Rosenfeld and Wagneri’ advocated making reliable information readily available: they proposed the use of energy ratings of buildings coupled with consumption predictions tailored to individual households.
Our study differs from the number of studies that dealt with analyses of determinants of individual conservation measures and their related investment aspects in that the energy conservation decision is viewed as a cumulative process. To some extent, people evaluate energy efficiency when a home is purchased, but improvements to this aspect of a home are not the result of single, discrete decisions. Instead, a cumulative process is involved when thermal integrity is upgraded. In addition, household energy conservation is a multi-dimensional activity that can involve both structural and behavioral adjustments. Many choices are possible in the former category, such as storm windows, attic or wall insulation, weatherstripping, caulking, or the addition of solar equipment. On the other hand, behavioral adjustments on the part of house occupants are possible, merely by lowering thermostat settings, without making any physical changes to the house. The focus of this analysis is to examine these two

Homeowner’s response to energy conservation 399
dimensions of the energy-conservation measures that either have been implemented by householders up to a given point in time or which are planned for implementation in the future and to determine the interactive effects between structural and behavioral adjustments.
THE DATA
The study area includes 14 nonmetropolitan counties in western New York: Allegany, Cattaraugus, Chautauqua, Chemung, Genesee, Livingston, Ontario, Orleans, Schuyler, Steuben, Tompkins, Wayne, Wyoming, and Yates. The survey was conducted in March and April of 1987.
A two-stage stratified sampling technique was used in this study. First, the 14 non- metropolitan counties in western New York were stratified in the manner suggested by the use of the cluster analysis procedure for pattern recognition. The basic approach of cluster analysis is explained at length by Tyron and Bailey.” The objective of this approach is to identify mutually exclusive sets of objects, within each of which sets all objects seem to have similar attributes. In our case, the objects are the non-metropolitan counties in western New York and the attributes are six population and housing characteristics of the counties obtained from the 1980 census of Population and Housing: (1) persons per household, (2) proportion of housing units in multi-unit structures, (3) proportion of housing units that are mobile homes, (4) proportion of housing units which are renter-occupied, (5) proportion of housing units built prior to 1969, and (6) proportion of housing units built between 1969 and 1979.
The data for the 14 counties were analyzed using the SAS hierarchical cluster analysis. Our use of the technique begins by forming one cluster for each object in the analysis. The two closest clusters are combined into a new cluster, then the two closest of the new sets are combined into another level of cluster, and so on.13 Through this procedure, four clusters were finally identified: an urban cluster with two counties, Chautauqua and Chemung, contains the two major cities of the region, Jamestown and Elmira; a rural cluster includes Allegany, Schuyler and Yates counties; a mixed cluster consists of eight counties (Cattaraugus, Genesee, Livingston, Ontario, Orleans, Steuben, Wayne, and Wyoming). Tompkins county, in which Cornell University and Ithaca College are located, and which is unique in that it does not resemble any other country in the area, is isolated as the fourth cluster. Within each cluster, one county was chosen at random to represent the cluster. The counties so chosen were Chautauqua, Yates, Wyoming, and Tompkins.
After the four representative counties were designated, the second step was to select representative urban and rural households within each county that were proportional to corresponding figures in the entire region. The first contact with the sampled householders was initiated by an advance letter, informing them of the nature of the survey, and stating that they would be called within a week to decide whether they were willing to participate in the study. The telephone list contained 640 households. After telephone contacts to the householders, 300 agreed to participate in the study. Among non-participants, 190 refused, 27 were ineligible because of a wrong number or number not working and, for the remaining 123 households, the line was busy or there was no answer. Under the latter circumstance, the call-back procedure was to call up to six times.
In order to adjust a potential unrepresentative bias from many non-responses, we computed a ratio between proportions of certain types of households in a given population cluster and sampled respondents in the same category. For example, while 11.27% of the urban householders were actually living in the mixed cluster, we selected only 4.59% from that category. Consequently, a weighting factor of 2.4569 (0.1127/0.0459) was applied in the statistical analysis to correct for our undersampling.
Questionnaires were sent to the participating householders and, a week later, county agents of Cornell Cooperative Extension collected them at the homes of respondents. The total sample size was 253, but only 222 homeowners are included in this paper.
Because our analysis is based on data collected from household self reports, some discussion of reliability is warranted. Hirst and Goeltz’4 assessed the issue of self-reporting accuracy with

400 JOSEPH LAQUATRA and PETER S. K. CHI
regard to energy conservation attributes and behaviors by analyzing a few studies for which multiple sources of data were available. They reported that in the samples analyzed, householders could accurately recall whether they participated in a utility energy-audit program, but their reported dates of such participation generally did not agree with utility company records. Disagreements with utility company records were also noted in reports of energy-conservation measures installed in homes of people who had received loans from these utility companies. A comparison of mail and telephone surveys conducted 3 months apart showed disagreement in about 20% of the cases over conservation actions and measures. Because only a limited number of studies were analyzed in this manner by these authors, they were careful not to draw conclusions other than to urge skepticism of householder reports on conservation actions and when they occurred.
While our study is based on self-reports, reasonable reliability of these reports can be assumed for several reasons. First, we did not represent a utility company nor did we make any reference to one, other than to question participation in an energy-audit program. Secondly, we did not question whether utility company loans were incurred for energy-conservation purposes. These are important distinctions in our study, because a possible reason for the disagreements noted previously is that people who received loans from utility companies for the purpose of retrofitting conservation measures are likely to feel obligated to report that they did indeed install such measures when so questioned. In addition, we did not attempt to obtain information on actual fuel consumption. Our questions were related to specific activities within a given reference period.
Three models were constructed for the purpose of observing determinants of energy- conservation behavior. In the first model, an index of energy efficiency was calculated for
ANALYTICAL FRAMEWORK
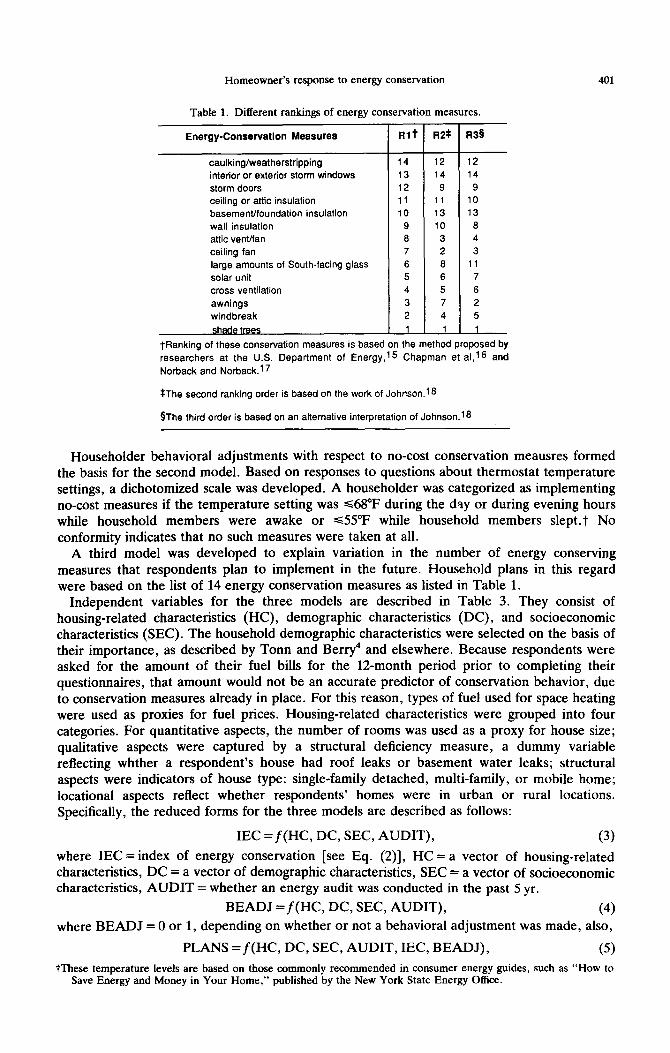
householders in the sample, based on the degree to which they had made physical adjustments to their homes for conservation purposes. The instrument used to assess householders’ energy conservation activities was a checklist which contained 14 conservation measures. Respondents used this list to indicate whether or not the measures existed when they moved into their homes, if they added these measures to their houses, or if the measures were not in place and were not added. Three different rankings commonly used in the literature were assigned to the conservation measures on the basis of energy savings and cost effectiveness. While each house is unique and actual savings depend on a number of individual factors, the rankings reflect general practice with regard to implementation priorities,‘5-‘8 and are presented in Table 1. Scores were assigned to each household, based on the extent to which conservation measures had been implemented, viz.
DEC = ~ Rig, (1) i=l
where DEC = degree of energy conservation, Ri = 1,2, 3, . . . , 14, Wi = 0, 1, 2. Here, Rj refers to rankings assigned to 14 conservation measures as listed in Table 1. w indicates the extent to which energy conservation measures have been implemented, where 0 indicates that one of the 14 measures was not in place when the survey respondents moved into their homes nor was added later; score 1 refers to the addition of one of the measures when none had been in place previously or the same measure was in place but no addition was made afterward, and score 2 indicates that one measure was in place and an addition was also made subsequently. The minimum DEC value is 0 and the maximum is 210. A standardized index of energy conservation was then developed from the degree of energy conservation, as in Eq. (2). The index may vary from 0 to 100; the higher the index score, the greater the degree of energy conservation. The index is given by
IEC = [(DEC - L)/(H - L)] x 100, (2)
where IEC = index of energy conservation, H = the highest possible score, L = the lowest possible score.
Homeowner’s response to energy conservation
Table 1. Different rankings of energy conservation measures.
401
Energy-Conservation Measures
caulking/weatherstripping interior or exterior storm windows storm doors ceiling or attic insulation basement/foundation insulation wall insulation attic vent/fan ceiling fan large amounts of South-facing glass solar unit cross ventilation awnings windbreak
trees
u1t Fl2*
14 12 13 14 12 9 11 11 10 13 ! 9 10
0 3 7 2 6 0 5 6 4 5 3 7 2 4
R3§
12 14 9
10 13
a 4 3
11 7 6 2 5
1
TRanking of these conservation measures is based on the method proposed by researchers at the U.S. Department of Energy,15 Chapman et al,‘6 and Norback and Norback.’ 7
*The second ranking order is based on the work of Johnsonf6
§The third order is based on an alternative interpretation of Johnson.16
Householder behavioral adjustments with respect to no-cost conservation meausres formed the basis for the second model. Based on responses to questions about thermostat temperature settings, a dichotomized scale was developed. A householder was categorized as implementing no-cost measures if the temperature setting was ~68°F during the day or during evening hours while household members were awake or 655°F while household members slept.? No conformity indicates that no such measures were taken at all.
A third model was developed to explain variation in the number of energy conserving measures that respondents plan to implement in the future. Household plans in this regard were based on the list of 14 energy conservation measures as listed in Table 1.
Independent variables for the three models are described in Table 3. They consist of housing-related characteristics (HC), demographic characteristics (DC), and socioeconomic characteristics (SEC). The household demographic characteristics were selected on the basis of their importance, as described by Tonn and Berry4 and elsewhere. Because respondents were asked for the amount of their fuel bills for the 12-month period prior to completing their questionnaires, that amount would not be an accurate predictor of conservation behavior, due to conservation measures already in place. For this reason, types of fuel used for space heating were used as proxies for fuel prices. Housing-related characteristics were grouped into four categories. For quantitative aspects, the number of rooms was used as a proxy for house size; qualitative aspects were captured by a structural deficiency measure, a dummy variable reflecting whther a respondent’s house had roof leaks or basement water leaks; structural aspects were indicators of house type: single-family detached, multi-family, or mobile home; locational aspects reflect whether respondents’ homes were in urban or rural locations. Specifically, the reduced forms for the three models are described as follows:
IEC = f(HC, DC, SEC, AUDIT), (3) where IEC = index of energy conservation [see Eq. (2)], HC = a vector of housing-r&ted
characteristics, DC = a vector of demographic characteristics, SEC = a vector of socioeconomic characteristics, AUDIT = whether an energy audit was conducted in the past 5 yr.
BEADJ =f(HC, DC, SEC, AUDIT), (4) where BEADJ = 0 or 1, depending on whether or not a behavioral adjustment was made, also,
PLANS =f(HC, DC, SEC, AUDIT, IEC, BEADJ), (5) tThese temperature levels are based on those commonly recommended in consumer energy guides, such as “How to
Save Energy and Money in Your Home,” published by the New York State Energy Office.

Tab
le
2.
Inte
rcor
rela
tion
(u
pper
di
agon
al)
and
leve
ls
of
sign
ific
ance
(l
ower
di
agon
al)
betw
een
vari
ous
mea
sure
s of
en
ergy
co
nser
vati
on
and
annu
al
per
unit
co
st
of
utili
ties
.
Mea
sure
s o
f E
ner
gy
Co
nse
rvat
ion
(I)
Ran
k 1
and
w
eig
ht
1
(2)R
ank
2 an
d
wei
gh
t 1
(3)R
ank
3 an
d
wei
gh
t 1
(4)R
ank
1 an
d
wei
gh
t 2
@R
ank
2 an
d
wei
gh
t 2
(6)R
ank
3 an
d
wei
gh
t 2
(7)P
er U
nii
Co
st
01 U
tilit
ies
(an
nu
al)
Mea
n
Sta
nd
ard
D
evia
tio
n
(1)
Ran
k 1
and
wel
gh
t
--&
00.0
001
00.0
001
00.0
001
00.0
001
00.0
001
00.0
406
0.01
49
0.01
50
29.5
1 26
.66
26.3
4
10.6
8 10
.09
10.0
1
(2)
Ran
k 2
(3)
Ran
k 3
(4)
Ran
k 1
(5)
Ran
k 2
(6)
Ran
k 3
(7)
per
un
it c
ost
an
d w
eig
ht
and
wel
gh
t an
d w
eig
ht
and
wei
gh
t an
d w
eig
ht
of
uti
litie
s 1
1 2
2 2
(an
nu
al)
0.96
07
\
0.00
01
0.00
01
o.o
oo
i
o.o
oo
1
0.97
71
0.99
26
\
0.00
01
0.00
01
0.00
01
0.99
75
0.98
02
0.97
78
0.97
57
0.99
16
0.99
77
0.97
90
0.99
32
\
-0.1
520
0.9976
-0.1
602
0.97
57
ky
0.9894
-0.1
801
0.98
22
-0.1
531
0.0001
-0.1
796
0.00
01
0.00
01
-0.1
600
0.01
51
25.4
1
9.29
l.oo
\ $1
90.3
0
$ 92
.58

Homeowner’s response to energy conservation
Table 3. Means and standard deviations for all variables used in the three models.
I Variable Variable Description Name Range
1. Index of Energy Conservation EC 0 - 68.5: 29.51 2. Future Energy Conservation
Measures PLANS O-6 0.60 3. Whether Behavioral
Adjustment Was Made BEADJ o-1 0.59 4. Whether Energy Audit Was
Conducted in the Past 5 Years AUDIT o-1 0.13
1. Number of Rooms ROOMS 4- 15 0.88 2. Presence of Housing
Deficiencies DEFECT 0- 1 0.44 3. Dwelling Types
Single Detached Unit SINGLE 0- 1 0.66 Mobile Home MOBILE 0- 1 0.05 Multi-family Unit -T _
4. Fuel Types for Space Heatin Natural Gas GAS O-l 0.49 Electricity ELEC o-1 0.06 Oil OIL o-1 0.16 Wood WOOD O-l 0.22 Others - -
5. Location Urban URBAN o-1 0.39 Rural
PBmpOraohic Char- =-I= 1. No. of Children Under 18 CHILD o-5 1.05 2. Age Groups
65+ OLD
I o-1 0.14
30 - 64 MIDDLE 0- 1 0.77 c30 - -
Standard Deviation
10.68
1.25
0.46
0.31
2.06
0.46
0.30 0.20
0.47 0.26 0.34 0.39
0.46
1. Education I- Elementary School ZLEM o-1 0.11 High School - College COLLEGE o-1 0.35
2. Household Annual Income <$20,000 _OINCOME o-1 0.33 %$XJJo $40,000 -
-tIINCOME o-1 0.16
1.12
0.33 0.40
0.29
0.44
0.44
0.36
The symbol T indicates a missing category in the regression models
403
where PLANS = number of energy conservation measures that a respondent plans to implement in the future.
In the third model [Eq. (5)], since the dependent variable is a measure of future energy-conservation plans, it is logical to reason that the respondents’ current levels of energy conservation [as measured by the Index of Energy Conservation (IEC)] and existing behavioral adjustments (BEADJ) may influence their future plans for energy conservation. Since the energy-conservation decision is viewed as a cumulative process, we hypothesize that the higher the levels of energy conservation, the less likely the respondents will be to plan on making additional conservation efforts in the future and that existing behavioral adjustments may also reduce the need for further conservation efforts.
The behavioral adjustment model [Eq. (4)] will be estimated using a probit procedure that accommodates a dichotomous dependent variable, whereas an ordinary least squares (OLS) procedure will be used to estimate models 1 [Eq. (3)] and 3 [Eq. (5)].

404 JOSEPH LAQUATRA and PETER S. K. CHI
Reliability and validity of the Index of Energy Conservation
Since the Index of Energy Conservation is a key variable used in this study and the index is constructed in terms of a unique ranking order and weighting scale, it is critical to determine whether the index value would be affected by different ranking orders and different weighting scales. Three different rankings of 14 energy conservation measures are obtained from the literature (see Table l), and two different weighting scales are used to measure the extent to which energy conservation measures have been implemented. One scale involves use of 0, 1,2, as described in the previous section; in the second scale, scores 1, 5, and 10 are used to measure the levels of energy conservation. Based on three different rankings and two types of weighting scales, we constructed six different measures of IEC. The intercorrelations among these six different measures are presented in Table 2. The extremely high correlation coefficients (all are higher than 0.977) indicate that the Index of Energy Conservation is a reliable measure and is not affected by ranking orders and weighting scales.
The Index of Energy Conservation is a composite measure of the cumulative effects of a householder’s energy conservation activities. The index value should be positively related to the home level of thermal integrity. Unfortunately, a direct measure of thermal integrity is not available in this study. Instead, the annual per unit cost of utilities (total annual costs of utilities divided by the number of rooms) is used as a proxy for measuring the energy efficiency of a housing unit. It is hypothesized that a home with a high degree of energy conservation (as indicated by a high IEC value) will have a low annual per unit cost of utilities. The results in Table 2 show that this proxy variable is negatively related to all six measures of energy conservation. Although the magnitude of these correlation coefficients is relatively low (from -0.152 to -0.1802), all of them are statistically significant.
These low correlation coefficients may be due to two factors: (1) variations in utility prices among different locations are not statistically controlled; (2) total utility costs measured in this study include not only heating and electric lighting costs but also water and sewer costs. In other words, this proxy variable does not reflect the exact degree of energy efficiency. Given these limitations, the significant negative correlations observed between various measures of energy conservation and annual per unit energy cost seem to indicate that the Index of Energy Conservation is a valid measure of energy efficiency.
EMPIRICAL RESULTS
Means and standard deviations for all variables used in the three models are presented in Table 3. Although index values of energy conservation (IEC) range from 0 to 68.5, the average is around 30% of the maximum level of energy conservation. Some 59% of respondents in our sample reported that they had lowered their daytime thermostat temperature settings, while 13% of the sample respondents had had energy audits conducted in the past 5 yr. The last two findings clearly indicate that our respondents in general have relatively higher levels of energy conservation activities than those reported in previous studies.4
The higher levels of energy conservation adjustments observed for our respondents correspond to their relatively higher socioeconomic status. For example, 35% of the sample are college educated and 67% had annual household incomes over $20,000 in 1987 (18% over $40,000; see Table 3). The respondents are predominately white; very few minorities are included in the sample. This result reflects the racial composition of the 14 non-metropolitan counties in western New York. Most of the respondents are middle-aged; 14% are over 65; and only 9% are less than 30.
About 88% of the homeowners in the sample live in single-family detached units, 5% in mobile homes, and the rest in multi-unit dwellings. The average number of rooms is around nine, but 44% of the units have either a leaking roof or a wet basement. These findings indicate that many homeowners in our sample live in large and old houses. Efficiency in energy conservation is certainly an area of concern for these people. Their primary fuel type for space heating is natural gas (49%), followed by wood (22%), oil (16%) and electricity (8%). Over 60% of the homeowners live in rural and farm areas and fewer than 40% are urban residents.
The results of the regression model on levels of energy conservation are presented in Table

Homeowner’s response to energy conservation
Table 4. Regression models on homeowners’ levels of energy consetvationt and future energy conservation p1ans.S
405
Variables§
1. ROOMS 2. DEFECT 3. SINGLE
4. MOBILE 5. GAS 6. ELEC
7. OIL 8. WOOD 9. URBAN lO.CHILD ll.OLD 12.MIDDLE 13.ELEM 14. COLLEGE 15. LOINCOME
lG.HIINCOME
17.AUDIT
16. BEADJ
0.65 1.57
-2.42
-9.49 -1.44 3.04
-4.14 0.17
-0.80 -1.07 -1.15 -3.76 -0.11 1.43
-2.48
-3.85
6.66
19.IEC
Intercept 31.24
F Value
Adjusted R2
N
f Em b
Levels Future
.
i
y Conservation q--T--
0.37 1.767 -0.05 0.04 -1.22 1.62 0.97 0.07 0.19 0.34 3.24 -0.75 -0.25 0.38 -0.05 5.12 -1.65q 0.02 0.61 0.04 4.44 -0.32 0.37 0.53 0.71 4.95 0.76 -0.19 0.59 -0.32 4.69 -0.68 1.12 0.56 2.0211 4.67 0.04 0.13 0.55 0.24 1.72 -0.47 -0.01 0.20 -0.06 0.71 -1.49 -0.03 0.09 -0.35 3.60 -0.30 -0.56 0.45 -1.25 3.07 -1.23 -0.22 0.36 -0.60 2.66 -0.04 0.26 0.32 0.81 1.76 0.63 0.25 0.21 1.21 1.93 -1.29 -0.09 0.23 -0.40 2.23 -1.731 -0.06 0.27 -0.21
2.45 3.54# 0.29 0.30 0.98
-I- ,,/z 2.4111 1.56q
0.117 0 06 222 222
b
0.01
-0.02
1.76
Energy Consr SE
1 0.19 0.06
0.01 -1.9ofi
0.70 2.2511
m ration Plans t
t Index of energy conservation (IEC) is the dependent variable.
* Future energy conservation measures (PLANS) is the dependent variable.
5 Descriptions of variables are given in Table 3.
7 p 5 0.008; 11 p 5 0.005; # p 5 0.001
4. Some significant findings can be observed. When demographic, socioeconomic, and audit variables are statistically controlled, respondents living in large houses are more likely to adopt energy conservation measures than those in small ones, becase the former group could receive higher economic savings from conservation efforts. Mobile home owners, particularly those living in older units, tend to have lower levels of energy conservation than those living in multi-family units, whereas owners of single-family detached homes have levels of energy conservation similar to those of their multi-unit counterparts. Compared with higher income families, both middle income and lower income families are more likely to adopt energy conservation practices, other things being equal. This finding may reflect the fact that the latter groups may be more sensitive to energy cost reductions. Having an energy audit conducted is
strongly related to higher levels of energy conservation. It is quite possible that homeowners who had an energy audit conducted in the past 5 yr might have implemented some energy conservation measures subsequently. Since we have no direct evidence to prove such a causal linkage, this result is only indicative, not conclusive. The overall model is statistically significant (as indicated by the F value) and explains about 11.7% of the variance in the householders’ levels of energy conservation.
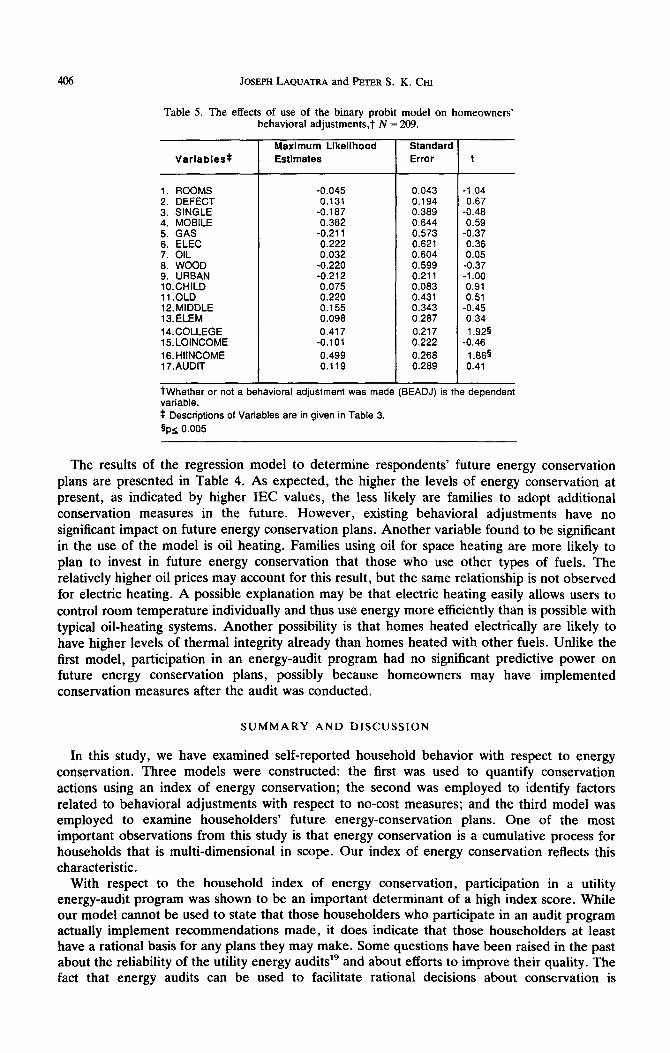
Respondents’ behavioral adjustments are explained in a binary probit model and the results are presented in Table 5. Whether a respondent would lower thermostat temperature settings is largely determined by his/her socioeconomic status. It seems ironic that families who can least afford the high energy costs are less likely to make a no-cost behavioral response. This finding suggests that public energy-conservation campaigns and intensive educational programs are definitely needed to target lower and middle socioeconomic groups. No other significant relationship is found in the results derived from use of this model.
EGY 14:7-c
406 JOSEPH LAQUATRA and PETER S. K. CHI
Table 5. The effects of use of the binary probit model on homeowners’ behavioral adjustments,? N = 209.
Variables*
1. ROOMS 2. DEFECT 3. SINGLE 4. MOBILE 5. GAS 6. ELEC 7. OIL a. WOOD 9. URBAN lO.CHILD ll.OLD 12.MIDDLE 13. ELEM
14.COLLEGE 15. LOINCOME 16. HIINCOME 17.AUDIT
Maximum Likelihood Standard Estimates Error
-0.045 0.131
-0.187 0.382
-0.211 0.222 0.032
-0.220 -0.212 0.075 0.220 0.155 0.098
0.417 -0.101
0.499 0.119
t
0.043 -1.04 0.194 0.67 0.389 -0.48 0.644 0.59 0.573 -0.37 0.621 0.36 0.604 0.05 0.599 -0.37 0.211 -1.00 0.083 0.91 0.431 0.51 0.343 -0.45 0.287 0.34 0.217 1.925 0.222 -0.46 0.268 1.86s 0.289 0.41
TWhether or not a behavioral adjustment was made (BEADJ) is the dependent variable. $ Descriptions of Variables are in given in Table 3.
§p5 0.005
The results of the regression model to determine respondents’ future energy conservation plans are presented in Table 4. As expected, the higher the levels of energy conservation at present, as indicated by higher IEC values, the less likely are families to adopt additional conservation measures in the future. However, existing behavioral adjustments have no significant impact on future energy conservation plans. Another variable found to be significant in the use of the model is oil heating. Families using oil for space heating are more likely to plan to invest in future energy conservation that those who use other types of fuels. The relatively higher oil prices may account for this result, but the same relationship is not observed for electric heating. A possible explanation may be that electric heating easily allows users to
control room temperature individually and thus use energy more efficiently than is possible with typical oil-heating systems. Another possibility is that homes heated electrically are likely to have higher levels of thermal integrity already than homes heated with other fuels. Unlike the first model, participation in an energy-audit program had no significant predictive power on future energy conservation plans, possibly because homeowners may have implemented conservation measures after the audit was conducted.
SUMMARY AND DISCUSSION
In this study, we have examined self-reported household behavior with respect to energy conservation. Three models were constructed: the first was used to quantify conservation actions using an index of energy conservation; the second was employed to identify factors related to behavioral adjustments with respect to no-cost measures; and the third model was employed to examine householders’ future energy-conservation plans. One of the most important observations from this study is that energy conservation is a cumulative process for households that is multi-dimensional in scope. Our index of energy conservation reflects this characteristic.
With respect to the household index of energy conservation, participation in a utility
energy-audit program was shown to be an important determinant of a high index score. While
our model cannot be used to state that those householders who participate in an audit program actually implement recommendations made, it does indicate that those householders at least have a rational basis for any plans they may make. Some questions have been raised in the past about the reliability of the utility energy audits” and about efforts to improve their quality. The fact that energy audits can be used to facilitate rational decisions about conservation is
Homeowner’s response to energy conservation 407
important because of the significant relationship between participation in an audit and a householder’s level of energy conservation. Other significant variables that were observed to be statistically related to the index of energy conservation were house size and type, with owners of large houses scoring relatively higher on the index and owners of mobile homes scoring lower. A policy implication of this finding is that owners of small homes and mobile homes may need programs tailored for their specific needs so that they can be encouraged to implement conservation measures.
With respect to behavioral adjustments, highly educated, high income people were seen to be more likely to implement no-cost conservation measures than those in low income groups with less education. While people in the higher education and income groups are likely to have a greater understanding of the benefits of energy conservation, it is ironic that low-income groups are less likely to implement such measures. A more intensive educational campaign about such easily implemented adjustments, targeted to low-income people, may be necessary. Another possibility is that those with higher levels of income and education may have invested in automatic set-back thermostats, which would make behavioral adjustments easier to implement. We do not have data to verify this conjecture.
Future energy-conservation plans were seen to be primarily determined by the household’s current level of energy efficiency. Fuel prices were also seen to affect future plans, a finding that may have implications for anticipated future energy price increases.
Some results that we expected to see with our models did not occur. The age and education levels of respondents and the type of fuel used did not significantly affect levels of energy-conservation or future energy conservation plans. This outcome may have been due to the homogeneity of our sample: 77% of those surveyed were middle-aged, with young people represented by only 9%. The sample is also predominantly white, probably because of its largely rural nature, with 61% of the householders living in rural areas. More sampling in metropolitan areas would likely have resulted in greater representation of minorities.
An overall observation from the three models is that, given the demonstrated significance of participation in a utility energy-audit program for raising a householder’s level of energy efficiency, some steps may need to be taken to improve the effectiveness of such audits. Better instrumentation, through the use of techniques such as infrared scanning and blower door tests, in addition to educational campaigns, to assist homeowners in understanding the investment aspects of energy conservation, may improve participation in these programs and ultimately encourage higher levels of energy efficiency in the residential sector.
Acknowledgemenl-This research was sponsored by the U.S. Department of Agriculture, through NC-178: Economic, Social, Psychological, and Health Consequences of the Housing Decisions of Rural Families.
1. 2. 3. 4. 5.
6. 7. 8. 9.
10. 11.
12. 13. 14. 15.
REFERENCES
A. Scott, Energy Econ. 2, 130 (1980). L. Karp, Energy Econ. 6, 208 (1984). J. S. Press and J. M. Tanur, Social Sci. Res. 16, 169 (1987). B. Tonn and L. Berry, Energy 11, 785 (1986). M. Marganus and S. Badenhop, Families and Energy: Conference Proceedings, B. M. Morrison and W. Kempton eds., Michigan State University, Lansing, MI (1984). D. J. Fritzsche, J. Mark. Res. 18, 227 (1981). C. H. Wurtzenbach and N. G. Waller, Appraisal J. Ll, 66 (1983). R. W. Gates, Energy Policy 11, 63 (1983). American Society of Heating, Refrigerating, and Air-Conditioning Engineers (ASHRAE), Inc., ASHRAE Handbook: 198.5 Fundamentals, ASHRAE, Atlanta, GA (1985). W. Kempton and L. Montgomery, Energy 7, 817 (1982). A. H. Rosenfeld and B. S. Wagner, paper presented at the Annual Conference of the American Council for an Energy Efficient Economy, Santa Cruz, CA (1982). R. C. Tyron and D. E. Bailey, Cluster Analysis, McGraw-Hill, New York, NY (1970). SAS User’s Guide, SAS Institute, Raleigh, NC (1979). E. Hirst and R. Goeltz, Social Sci. J. 22, 19 (1985). U. S. Department of Energy, “Instructions for Energy Auditors,” National Technical Information Service, Washington, DC (1978).

408 JOSEPH LAQUATFCA and PETER S. K. Cm
16.
17.
18.
19.
R. E. Chapman, R. W. Crenshaw, K. A. Barnes and P. T. Chen, “Optimizing Weatherization Investments in Low-Income Housing: Economic Guidelines and Forecasts,” Community Service Administration, Washington, DC (1980). P. Norback and C. Norback, The Consumer’s Engergy Handbook, Van Nostrand-Reinhold, New York, NY (1981). R. J. Johnson, “Energy Efficient Residence; Research Results,” U.S. Department of Housing and Urban Development, Washington, DC (1981). E. Hirst and R. Goeltz, ASHRAE J. 26,24 (1984).