determinants of growth in consumption of rural household in
TRANSCRIPT
Talukder and Chile, International Journal of Applied Economics, March 2013, 10(1), 39-63 39
Determinants of Growth in Consumption of Rural
Household in Bangladesh: A Regression Analysis
Dayal Talukder and Love Chile
ICL Business School and Auckland University of Technology
Abstract
The purpose of this study is to investigate the determinants of growth in consumption of
rural households in Bangladesh in the post-liberalisation era. Using data from both primary
and secondary sources, the study applied the ordinary least square (OLS) regression models
to assess the determinants. It also used both economic and non-economic characteristics
(endowments) simultaneously for considering their joint effects on determinants. The study
found that non-farm household dummy was the largest positive determinant of household
consumption followed by household land area in 2010. Conversely, net buyer dummy
variable was the largest negative determinant followed by rice price in the same year. Food
consumption was the largest determinant of growth in household consumption followed by
household land area in 1985-86. Rice consumption was the largest negative determinant of
growth in consumption in 1985-86 but was the largest positive determinant in 2005. This
study argues that agricultural trade liberalisation contributed to an increase in rice
production and consumption, leading to higher growth in household consumption in the
post-liberalisation era. Three difference variables – changes in share of income from
agriculture, business-commerce, and house rent – were the positive determinants of growth
in both 1985-86 and 2005. However, income-from-rice and change-in-income-from-rice
were not statistically significant. This analysis suggests that it was not the rice income but
income from other sources were responsible for the growth in household consumption in
both 1985-86 2005. The study suggests that while agricultural trade liberalisation positively
impacted on rice production, resulting from technological transformation and leading to a
substantial decrease in both producer and consumer prices of rice, farm households were not
benefited much from rice income in determining consumption growth (welfare). This might
be attributed to a greater decrease in the producer price than that in the consumer price. This
study argues that some farmers may shift from rice to other agricultural or non-farm
activities, thus jeopardising the country‟s food security and self-sufficiency efforts in food
grain production. Therefore, it is crucial to formulate government policies to support farm
households in the form of income transfer such as tax reduction and production subsidy in
order to avoid food security and macroeconomic instability, resulting from high food prices
due to a shortage of rice production.
Key words: Agricultural trade liberalisation, determinants of consumption, growth in
consumption, rural households, Bangladesh
JEL classification code: C13, D60, F10
Talukder and Chile, International Journal of Applied Economics, March 2013, 10(1), 39-63 40
1. Introduction
Bangladesh is an agricultural economy. More than 80 percent of its population depend
directly or indirectly on agriculture for their livelihoods. This segment of the population is
also predominantly made up of rural households. The agricultural sector contributed around
20 percent to gross domestic product (GDP) and employed more than 60 percent of the total
labour force of the economy in 2010 (Ministry of Finance, 2012; World Bank, 2011a,
2011b). The economy went through a series of deregulation and agricultural trade
liberalisation measures in the late 1980s and early 1990s with a view to increasing
productivity in agriculture and achieving self-sufficiency in food-grain production. Major
reforms in agricultural policy included liberalisation of input markets, shrinking the role of
government agencies in distribution of inputs, substantial reduction and rationalisation of
tariffs, removal of quantitative restrictions, moving from multiple to a unified exchange rate,
and from fixed to a flexible exchange rate system (Ahmed et al., 2007: 9; Ahmed and Sattar,
2004: 11, 12; Hoque and Yusop, 2010: 39; Hossain and Verbeke, 2010: 78; Islam and
Habib, 2007: 4; Moazzem et al., 2012: 9; Salim and Hossain, 2006: 2569). Agricultural trade
liberalisation generated significant impacts on major structural reforms and technological
transformation in rice production, enabling the country to achieve self-sufficiency in
food-grain production in the early 1990s (Ahmed and Sattar, 2004: 19; Faroque et al., 2013:
2; Islam and Habib, 2007: 4; Klytchnikova and Diop, 2006: 3).
Despite this impressive growth performance, the rate of decline in the incidence of poverty
over the two decades 1990-2010 was rather insignificant. The decline in poverty was an
average of less than 1 percent (over the twenty-year period), leaving poverty at a remarkably
high level – with more than 40 percent of the country‟s population and the majority of them
in rural areas (Ahmed and Sattar, 2004: 18; BBS, 2007b: 57; Klytchnikova and Diop, 2006:
2; Ministry of Finance, 2010: 177). Thus, a significant question arises – to what extent has
agricultural trade liberalisation influenced the determinants of consumption (welfare) of
rural households in Bangladesh? Therefore, the focus of this study is to examine the
determinants of consumption and growth in consumption in the post-liberalisation era.
Although other factors might also have affected the growth in consumption of rural
households, agricultural trade liberalisation was the most important policy reform because of
households‟ critical dependence on rice in terms of both income and consumption. The study
assumed rice as the representative of agriculture, thereby, considering changes in the rice
price to analyse the impact of agricultural trade liberalisation on consumption of rural
households for two main reasons. Firstly, agricultural trade liberalisation influenced rice
production significantly: agricultural trade liberalisation directly impacted on new
technology for rice production (such as irrigation, fertilisers, and high-yielding-varieties
seeds). Secondly, rice is the major agricultural product in Bangladesh, capturing the largest
share of the agricultural sector. It accounted for 75 percent of the total crop production
value, 63 percent of total crop sales, and 75 percent of total cultivated area of the country in
2005 (Klytchnikova and Diop, 2006: 13). In addition, rice is the staple food in the economy.
Therefore, any change in rice production and the price of rice impacts directly on the
livelihoods and welfare of most households in the country.
Bangladesh was a large country in terms of the size of its population (164 million) with a
very high density of 1246 people per sq km in 2009. However, it was a small economy in
terms of gross domestic product (GDP) (89.38 billion US dollars) and gross national income
Talukder and Chile, International Journal of Applied Economics, March 2013, 10(1), 39-63 41
(GNI) per capita (590 US dollars) in the same year (Ministry of Finance, 2012; World Bank,
2011a, 2011b). Agriculture plays an important role in supplying food as well as in
maintaining food security of this very large and fast-growing population. The food security
and self-sufficiency in food grain production of the economy depends mainly on how
agricultural trade liberalisation impacted consumption (welfare) of rice farmers (farm
households) in the post-liberalisation era and how they would response to rice production in
the future.
The main objective of this study is to analyse the impact of agricultural trade liberalisation
on the welfare of rural households in Bangladesh. The focus of this study is to explore the
changes in welfare of rural households due to the changes in productivity and prices of rice
as a result of agricultural trade liberalisation. The study focuses on a link between
agricultural trade liberalisation measures and their impacts on technological transformation
in agriculture, productivity growth, changes in producer and consumer price as well as on
changes in household welfare. A change in agricultural productivity affects directly the
welfare of farm households and may affect indirectly the welfare of both farm and non-farm
households through changes in producer and consumer price of agricultural products. These
changes may have impact on household income and consumption. Although other factors
might also have affected the growth in real income or consumption of rural households,
agricultural trade liberalisation is the most important policy reform because of households‟
crucial dependence on agriculture in terms of both income and consumption.
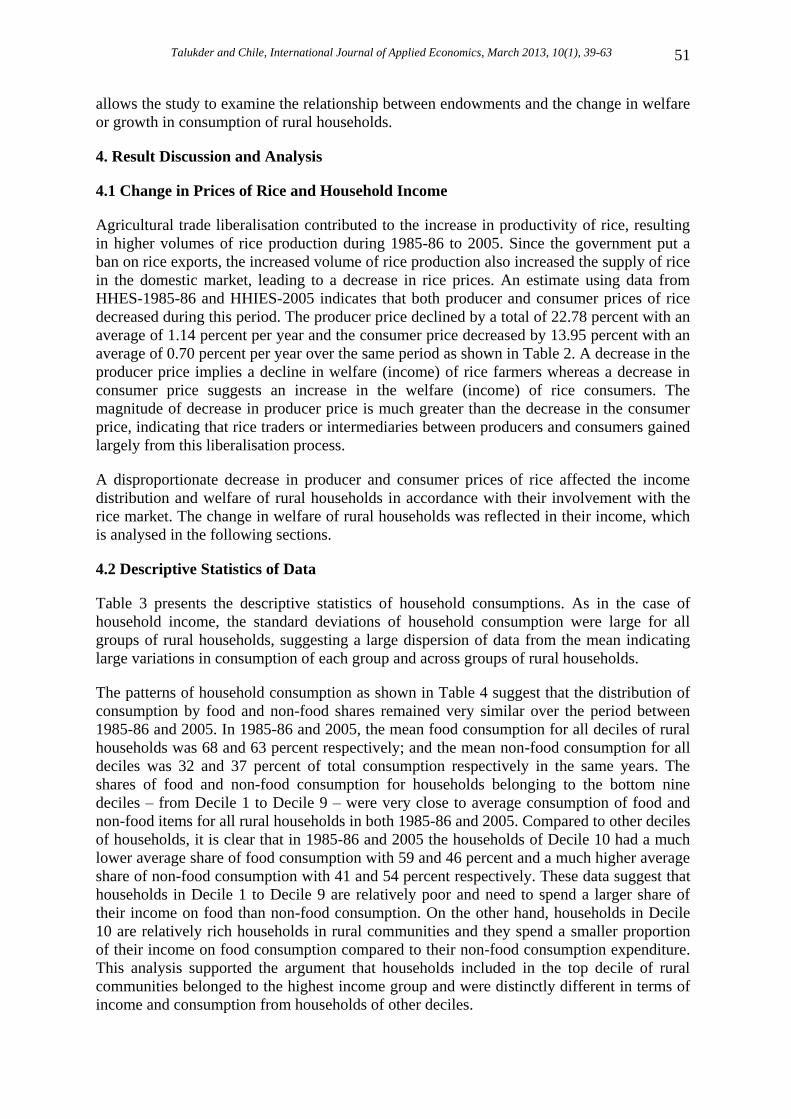
Therefore, this study is intended to examine the determinants of consumption and growth in
consumption with a view to analysing the changes in welfare of rural households in the
post-liberalisation era. It also intended to suggest a policy framework for the government to
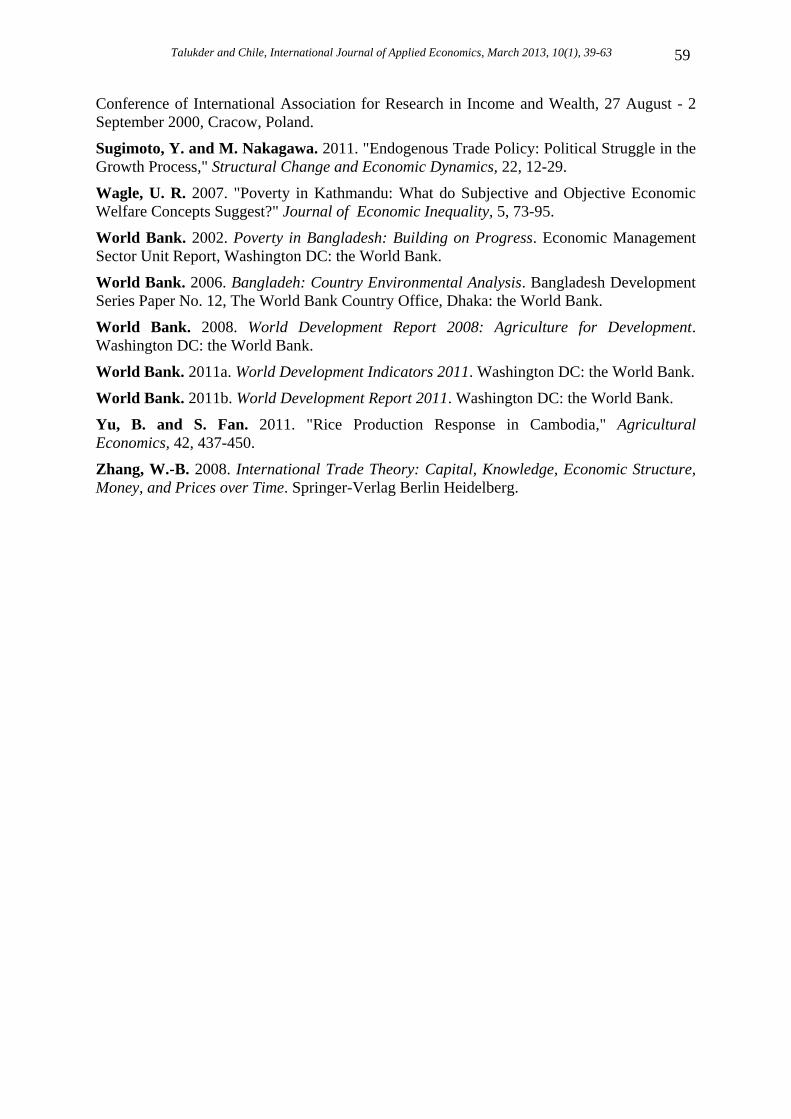
cope with food security and food production issues in the future. The framework of this
study is presented in Figure 1.
The following sections include literature review, methodology and research design, result
discussion and analysis, and conclusion.
2. Literature Review
According to advocates of trade liberalisation, agricultural trade liberalisation is likely to
direct scarce resources into areas of Bangladesh‟s comparative advantage, promote
specialisation resulting in higher productivity and growth, accelerate investment by allowing
access to bigger markets and permit economies of scale, and encourage imports of
previously unavailable or scarce capital goods and intermediate inputs for agriculture
(Ahmed and Sattar, 2004: 1; McCulloch et al., 2003: 15, 16; Montalbano, 2011: 1; Stone
and Shepherd, 2011: 5; Zhang, 2008: 175). Liberalisation of import markets for fertilisers,
pesticides and irrigation equipment might have facilitated farmers‟ access to the improved
production technology, and enabled Bangladesh‟s agriculture to reallocate resources for
specialisation in efficient rice crop cultivation (Ahmed and Sattar, 2004: 1; McCulloch, et
al., 2003: 15, 16; Montalbano, 2011: 1; Stone and Shepherd, 2011: 5; Zhang, 2008: 175).
However, this argument assumes that resources such as land and labour would be fully
employed in the first place; whereas in Bangladesh unemployment is persistently high.
Therefore, agricultural trade liberalisation could result in labour temporarily going from
low-productivity protected sector to zero-productivity unemployment (Chang et al., 2005: 2;
Chang et al., 2009: 1; Krugman and Obstfeld, 2006: 405, 406; Panagariya, 2004: 1150;
Stiglitz and Charlton, 2007: 25, 26).
Talukder and Chile, International Journal of Applied Economics, March 2013, 10(1), 39-63 42
Advocates of free trade argue that agricultural trade liberalisation would produce a
knowledge spill-over effect through technological innovation that is embodied in imported
machinery, leading to higher growth in Bangladesh‟s agriculture. This growth would
enhance returns to the economy‟s relatively abundant factor of production – the unskilled
labour – by raising real wages for them, thereby contributing to an improvement in income
distribution (Ahmed and Sattar, 2004: 2; Gabre-Madhin et al., 2002: 2; Islam and Habib,
2007: 4; Klytchnikova and Diop, 2006: 6; Lee and Vivarelli, 2006: 7).
On the contrary, the critics of trade liberalisation argued that trade liberalisation could
reduce the wages of unskilled labour, thereby widening the income gap between the rich and
the poor in the economy (Acharya, 2011: 60; Hoque and Yusop, 2010; Keleman, 2010: 13).
Similarly, even if agricultural trade liberalisation brings about higher economic growth
through technological transformation, the income gap between the poor and the rich might
be widened in the long run because the poor could not afford investments associated with the
adoption of new technology to increase production (Acharya, 2011: 60; Banerjee and
Newman, 2004: 2; Keleman, 2010: 13; Rakotoarisoa, 2011: 147). Moreover, as the economy
is open to global competition, the domestic economic factors are more likely to be
influenced by international price shocks and other global variables than by domestic factors
(Montalbano, 2011: 8; Sugimoto and Nakagawa, 2011: 12). Thus, there is greater pressure
on policy-makers to ensure macroeconomic stability for sustaining economic growth.
Agricultural trade liberalisation may not produce similar welfare impact across all rural
households. In practice, some households might have experienced benefit and others might
have experienced loss from this liberalisation, resulting in diverse distributional
consequences across rural households (Hossain and Verbeke, 2010: 77, 78; Isik-Dikmelik,
2006: 3; Klytchnikova and Diop, 2006: 4; World Bank, 2008: 29, 53). The reason for such
possible diverse outcomes can be explained by the fact that agricultural trade liberalisation
affects the prices of goods and factors. Thus the changes in prices of goods and factors may
diversely affect the welfare of rural households due to their various degrees of involvement
with goods and factors markets such as producers or consumers, farm or non-farm
households, and net buyers or net sellers (Hossain and Verbeke, 2010: 77, 78; Isik-Dikmelik,
2006: 3; Klytchnikova and Diop, 2006: 4; World Bank, 2008: 29, 53).
In Bangladesh, amongst agricultural products, rice is dominant in terms of staple food,
volume of production and cultivated areas. Therefore, farmers use the main proportion of
agricultural inputs such as fertilisers, pesticides, irrigation, and seeds for rice cultivation.
From the theoretical point of view, agricultural trade liberalisation may affect productivity of
rice farmers through technological transformation. As a result, this may improve producers‟
welfare through the positive effect on their profits (Anderson, 2004: 1; Klytchnikova and
Diop, 2006: 5; OECD, 2010: 11). However, productivity improvement may also translate
into lower output prices, which in turn have a negative effect on producer welfare
(Anderson, 2004: 1; Gabre-Madhin, et al., 2002: 2; Klytchnikova and Diop, 2006: 5). Some
studies such as Byerlee et al. (2005); Islam and Habib (2007); Mendola (2007); and
Alauddin and Quiggin (2008) argued that gains from new agricultural technology might
influence the poor directly by raising incomes of farm households and indirectly by raising
employment and wages of functionally landless labourers, and also by lowering the price of
food staples.
The majority of farm households in Bangladesh are involved in small and subsistence
farming. Thus, at different times of a year, most of the farm households belong to two
groups simultaneously: producers and consumers. However, over the course of the year they
Talukder and Chile, International Journal of Applied Economics, March 2013, 10(1), 39-63 43
can be defined as either net sellers or net buyers of rice (Deaton, 1989: 4; Isik-Dikmelik,
2006: 3; Karfakis et al., 2011: 6, 25; Klytchnikova and Diop, 2006: 5; World Bank, 2008:
109). An increase in income of net sellers due to an improvement in productivity of rice
depends on elasticity of output and elasticity of price. The income of net sellers will rise as
long as elasticity of output is greater than elasticity of price with respect to technological
change (Isik-Dikmelik, 2006: 3; Karfakis, et al., 2011: 8; Klytchnikova and Diop, 2006: 5;
Yu and Fan, 2011: 448). If output increases faster than the price falls in response to
technological change, net sellers will enjoy a higher income and welfare, even if some of the
gains accrue to net buyers. Therefore, the net effect will depend on whether the household is
ultimately a net buyer (subsistence farmer) or a net seller (market-integrated farmer) (Isik-
Dikmelik, 2006: 3; Karfakis, et al., 2011: 25; Klytchnikova and Diop, 2006: 5; Yu and Fan,
2011: 448).
Like many other developing countries in the world, the agricultural labour market in
Bangladesh is imperfect in terms of competition and mostly seasonal in nature (Ahmed,
1978: 1281; Hossain and Verbeke, 2010: 77; Klytchnikova and Diop, 2006: 6; Stiglitz and
Charlton, 2007: 89). Therefore, disguised unemployment and under-employment are the
common features of this labour market (Ahmed, 1978: 1281; Briones, 2006: 79; Hossain and
Verbeke, 2010: 77; Klytchnikova and Diop, 2006: 6). Similarly, an important characteristic
of Bangladesh‟s agriculture is that households often work on their own farm in subsistence
agriculture, rather than working for a wage in the farm or non-farm sectors. Therefore,
changes in rice price and productivity induced by technological transformation can affect the
implicit trade-off between family work and wage employment (Dorosh and Shahabuddin,
2002: 3; Hossain and Verbeke, 2010: 77; Isik-Dikmelik, 2006: 15; Karfakis, et al., 2011: 3;
Klytchnikova and Diop, 2006: 6). By stimulating rice production and the demand for
agricultural labour, the lower rice price may benefit the rural poor through the induced wage
response and increased real income (Hossain and Verbeke, 2010: 77; Isik-Dikmelik, 2006:
15; Karfakis, et al., 2011: 3; Klytchnikova and Diop, 2006: 6; Ravallion, 1990: 474). From
theoretical standpoints, technological improvement is likely to increase productivity of
factors and volume of output. However, this increased output is often valued at a lower
price, induced by productivity improvement (Gabre-Madhin, et al., 2002: 3; Isik-Dikmelik,
2006: 16; Klytchnikova and Diop, 2006: 6; Stiglitz and Charlton, 2007: 26). Thus, if
marginal productivity of factors increases faster than prices fall in response to technological
transformation in agriculture, employment and wages will rise simultaneously, benefiting
agricultural wage earners (Gabre-Madhin, et al., 2002: 6; Hossain and Verbeke, 2010: 77;
Isik-Dikmelik, 2006: 15; Klytchnikova and Diop, 2006: 6). Therefore, agricultural wage
earners in Bangladesh might have benefited from technological innovation because of
agricultural trade liberalisation.
The impact of technological transformation on the rural livelihoods of Bangladesh‟s
economy may come through an increase in real income or consumption resulting from
productivity improvement and reduced rice prices (Karfakis, et al., 2011: 4; Klytchnikova
and Diop, 2006: 7; Rahman, 2000: 3, 4). With a given demand function of rice, an increase
in the volume of rice production (supply) induced by productivity improvement may cause a
decrease in the rice price, leading to an increase in real income. This argument is based on
the fact that rice is basically a non-exported good in Bangladesh; the price of rice is thereby
much more affected by domestic factors than by international price fluctuations (Hossain
and Verbeke, 2010: 90; Karfakis, et al., 2011: 23, 24; Klytchnikova and Diop, 2006: 7;
Rahman, 2000: 3, 4). Therefore, an increase in the volume of rice production may induce a
Talukder and Chile, International Journal of Applied Economics, March 2013, 10(1), 39-63 44
decline in the rice price, under a given domestic demand function, to attain a new
equilibrium in the domestic rice market.
Bangladesh has been pursuing the green revolution programme since its independence in
1971 with a view to increasing productivity in agriculture for attaining self-sufficiency in
food production. Agricultural trade liberalisation and technological transformation in the
1980s and the early 1990s generated further momentum in Bangladesh‟s agriculture,
resulting in a significant increase in the volume of rice production which led to
self-sufficiency in food-grains by the early 1990s (Ahmed and Sattar, 2004: 19; Islam and
Habib, 2007: 4; Rahman, 2008: 16).
Many studies have attempted to shed light on productivity of agriculture and income
distribution in the rural economy. Mujeri (2002) argued that while Bangladesh‟s greater
integration into the world economy was generally “pro-poor”, the gains were relatively small
due to structural bottlenecks and other constraints. In another study, Mujeri and Khondker
(2002) found that trade liberalisation stimulated growth in the agricultural sector. The World
Bank (2002) showed that the benefits of economic growth during the 1990s had not been
distributed evenly across the regions. Dorosh and Shahabuddin (2002) found that
agricultural trade liberalisation and market deregulation contributed to rice price stabilisation
in the 1990s. They argued that price stabilisation following major production shortfalls was
largely due to private sector imports. Hossain and Deb (2003) found that trade liberalisation
improved productivity in the agricultural sector but Bangladesh did not have a comparative
advantage on major agricultural products. Although it had a comparative advantage in the
production of high yielding varieties (HYV) of rice, the unit cost of production was
relatively high due to government policy. Hossain (2004) found that the long-term trend in
agricultural production showed a cyclical pattern with a few years of rapid growth followed
by a few years of stagnation. He argued that, since most of the land and other agricultural
resources were tied up in rice production, agricultural diversification could not be achieved
unless resources were released from rice cultivation. World Bank (2006) argued that trade
liberalisation made available cheap imports of agricultural inputs such as pesticides,
irrigation equipment, fertilisers and seeds. Salim and Hossain (2006) found that there were
wide variations in productive efficiency across farms as a result of agricultural reforms. The
efficiency differentials were largely explained by farm size, infrastructure, households‟
off-farm income, and reduction of government anti-agricultural bias in relation to trade and
domestic policies. Klytchnikova and Diop (2006) found that reform in the agricultural sector
contributed significant growth to the economy but its impact on the reduction of rural
poverty was considered very insignificant. They argued that agricultural trade liberalisation
improved the production of rice considerably, leading to a significant decrease in rice price.
They found that net buyers gained and net sellers lost from this process. BBS (2009) found
that during last decade significant changes took place in the agricultural sector. These
changes included new production structures with a combination of irrigation, fertilisers, high
yielding varieties of seeds and pesticides, and mechanisation in land preparation. All these
changes contributed to an increase in production of food-grains in Bangladesh. Hossain
(2009) found that agricultural trade liberalisation contributed to the development of minor
irrigation dominated by shallow tube-wells leading to the expansion of Boro rice cultivation.
Consequently, rice production increased significantly. Hossain and Verbeke (2010) found
that agricultural trade liberalisation contributed to the integration of rice markets across the
six regions (divisions) and therefore the long-run equilibrium was stable. Conversely, in the
short run the market integration as measured by the magnitude of market interdependence
and the speed of price transmission between the divisional markets was weak. Alam, et al.
Talukder and Chile, International Journal of Applied Economics, March 2013, 10(1), 39-63 45
(2011) attempted to analyse the welfare impact of policy interventions in food grain markets
during 1980–2003. They argued that the loss in consumer surplus exceeded the gain in
producer surplus from government control over food grain markets, resulting in a
deadweight loss for the society. Conversely, they further argued that the gain in consumer
surplus and government revenue from liberalisation of foodgrain markets was greater than
the loss in producer surplus, implying a net welfare gain to the society. Similarly, Karfakis et
al. (2011) attempted to identify the impact of rice price changes on household welfare. They
argued that rural households exhibited higher welfare losses than urban households from an
increase in the rice price. This study assessed determinants of consumption and its growth
with a view to examining the impact of agricultural trade liberalisation on the welfare of
rural households in the post-liberalisation era.
3. Methodology and Research Design
3.1 Data
The study used data from both primary and secondary sources. Secondary data was required
to measure changes in variables from a base year to a current year for assessing determinants
of consumption and growth in consumption.
Secondary Data
The study used secondary data on household income mainly from two household surveys of
the Bangladesh Bureau of Statistics (BBS) including Household Income and Expenditure
Survey(HHIES) 2005 (BBS, 2007b), and Household Expenditure Surveys (HHES) 1985-86
(BBS, 1988). It has selected 1985-86 as a the base year because of availability of data as
well as the substantial agricultural trade liberalisation in the late 1980s. Similarly, it has
selected 2005 as the current year due to availability of the latest household survey data.
Therefore, changes in household income is measured using data of HHES 1985-86 as the
base year and data of HHIES 2005 as the current year.
Primary Data
The study used a mixed method research design in primary data collection. Questionnaire
and face-to-face interview techniques were used for collecting primary data. A structured
survey questionnaire was designed with both closed-ended and open-ended questions.
Therefore, the datasets included both quantitative (closed-ended) information through using
a closed-ended checklist and qualitative (open-ended) information through interviews with
participants. The choice of this method was warranted to achieve the objectives of the study.
The household head or a senior person of the household who had access to information of all
household members answered this structured interview questionnaire. This structured
interview was conducted through asking participants the questions and writing their answers.
If a participant did not have information about all members of the household, the participant
was not requested to participate in the survey.
The study used both probability and non-probability sampling methods for field survey to
collect primary data. Using convenience and judgment sampling, non-probability sampling
methods (Bartlett-II et al., 2008: 47), it selected Comilla amongst the sixty-four districts of
Bangladesh for conducting the field survey.
Talukder and Chile, International Journal of Applied Economics, March 2013, 10(1), 39-63 46
1. Comilla was a pioneer district in the field of the Green Revolution in Bangladesh. It
was expected that it might have experienced significant technological transformation
in agriculture as a result of agricultural trade liberalisation.
2. It is basically an agricultural district. It is neither a hilly nor a coastal area,
representing the typical geographical feature, which is conducive to agricultural
activities. Therefore, data would not be affected by geographical bias. The farmers of
this district produce three crops of rice – Aus, Amon, and Boro, representing the
basic characteristics of rice cultivation in Bangladesh.
3. The Bangladesh Academy for Rural Development (BARD), a research institute for
agriculture and rural development, is located in the Comilla district. The BARD and
other research institutes usually conduct surveys in this district and the participants
are familiar with surveys and research. Therefore, it was expected that conducting a
field survey in this district would present fewer logistical challenges.
According to the Bangladesh Bureau of Statistics (BBS, 2007a), there were thirteen upazilas
(sub-districts) in the Comilla district. They are: 1) Barura, 2) Brahmanpara, 3) Burichang, 4)
Chandina, 5) Chauddagram, 6) Daudkandi, 7) Debidwar, 8) Homna, 9) Comilla Sadar, 10)
Laksam, 11) Meghna, 12) Muradnagar, and 13) Nangalkot.
The study selected Comilla Sadar Upazila, then Chouara Union from that upazila and finally
Shrimontapur village from that union for conducting the field survey. Based on cluster
sampling, the households of the selected village were divided into three clusters (A, B and
C) and then, using the random sampling technique, the cluster C was selected for the field
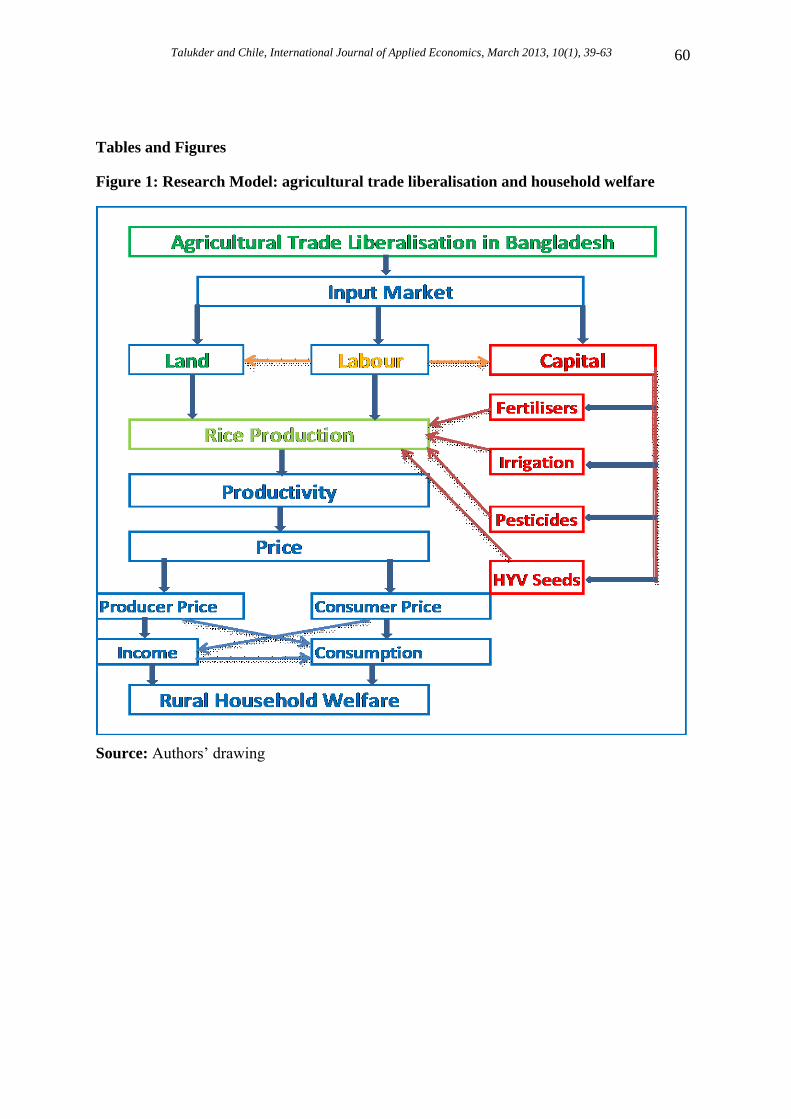
survey. The study surveyed all 60 households from this cluster. Therefore, the sample size of
this survey was 60 households of that village. The details of observations are presented in
Table 1.
If a participant did not have information about all members of the household, the participant
was not requested to participate in the survey. Therefore, all 60 observations for all
questions were found correct/valid and no sample was dropped from the original data set.
The study also conducted a Data Exploratory Analysis to identify outliers and no outlier was
found in this data set.
3.2 Theoretical Framework: Welfare Analysis and Its Dimensions
The study used consumption to measure economic welfare, as it capture the means by which
households can achieve welfare (Strengmann-Kuhn, 2000: 2; Wagle, 2007: 75). In most
empirical studies, income is the indicator used for household welfare and resources (Wagle,
2007: 75). This study used consumption to analyse household welfare as consumption
reflects better reality of welfare that income in developing countries like Bangladesh. This is
because of the fact that income is not recorded properly, thereby imposing difficulties in
determining household welfare (Deaton, 1997: 36; Strengmann-Kuhn, 2000: 8).
The study investigated the changes in welfare of rural households in the post-liberalisation
era. Here the changes in welfare were measured through the changes in determinants of
consumption. The study assumed that households were uniform in terms of rational
behaviour – they wanted to maximise their welfare subject to their budget and resource
constraints. The term „welfare‟ was treated as the meaning conveyed by the concepts
„satisfaction‟, „well-being‟ and „utility‟ that are used in economics and other social sciences
(Conceição and Bandura, 2008: 2; Strengmann-Kuhn, 2000: 2).
Talukder and Chile, International Journal of Applied Economics, March 2013, 10(1), 39-63 47
Household welfare is dependent on their real income. The welfare function may differ across
the rural households and across circumstances, indicating that the same amount of real
income may produce different levels of welfare. Thus, the welfare function depends not only
on the real income but in some cases also on age, health status, employment status and other
socio-economic factors. Therefore, the study considered both economic and non-economic
characteristics of household in determining household welfare.
The study examined the effects of changes in both consumer and producer prices of rice on
the distribution of real income or consumption across different households of rural
communities. It analysed the consumption and production patterns of rice in relation to
household characteristics, particularly the types of households and their living standards,
with a view to providing an easily comprehended map of the effects of price changes. As
Deaton (1989) assumed, household expenditure per head (xpc) was used as a preferred
measure of household living standards and was measured as total household expenditure on
non-durables per month divided by the number of persons in a household. A simple
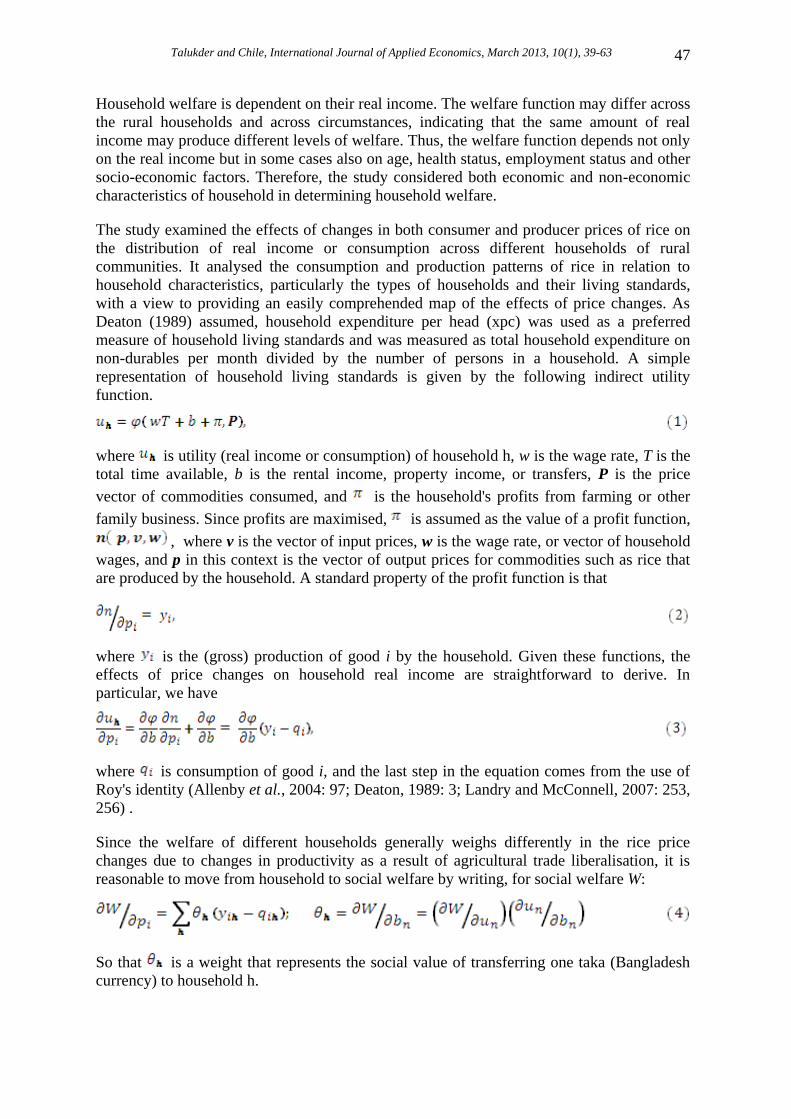
representation of household living standards is given by the following indirect utility
function.
where is utility (real income or consumption) of household h, w is the wage rate, T is the
total time available, b is the rental income, property income, or transfers, P is the price
vector of commodities consumed, and is the household's profits from farming or other
family business. Since profits are maximised, is assumed as the value of a profit function,
, where v is the vector of input prices, w is the wage rate, or vector of household
wages, and p in this context is the vector of output prices for commodities such as rice that
are produced by the household. A standard property of the profit function is that
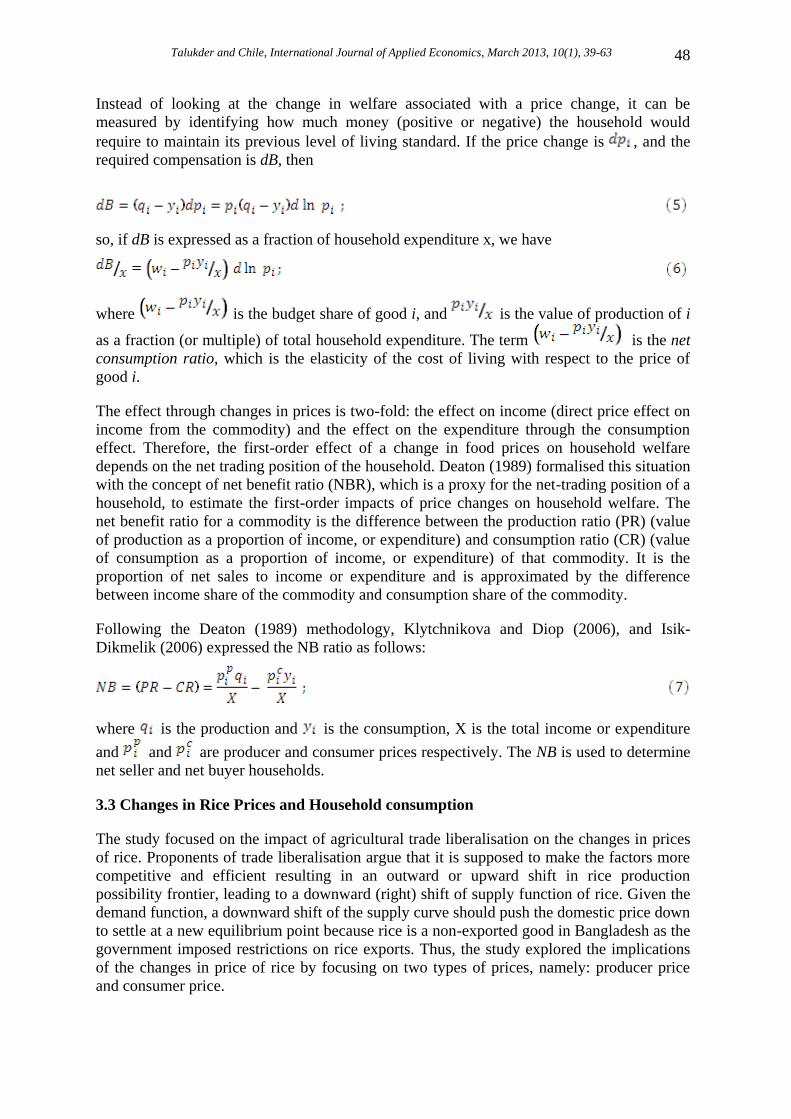
where is the (gross) production of good i by the household. Given these functions, the
effects of price changes on household real income are straightforward to derive. In
particular, we have
where is consumption of good i, and the last step in the equation comes from the use of
Roy's identity (Allenby et al., 2004: 97; Deaton, 1989: 3; Landry and McConnell, 2007: 253,
256) .
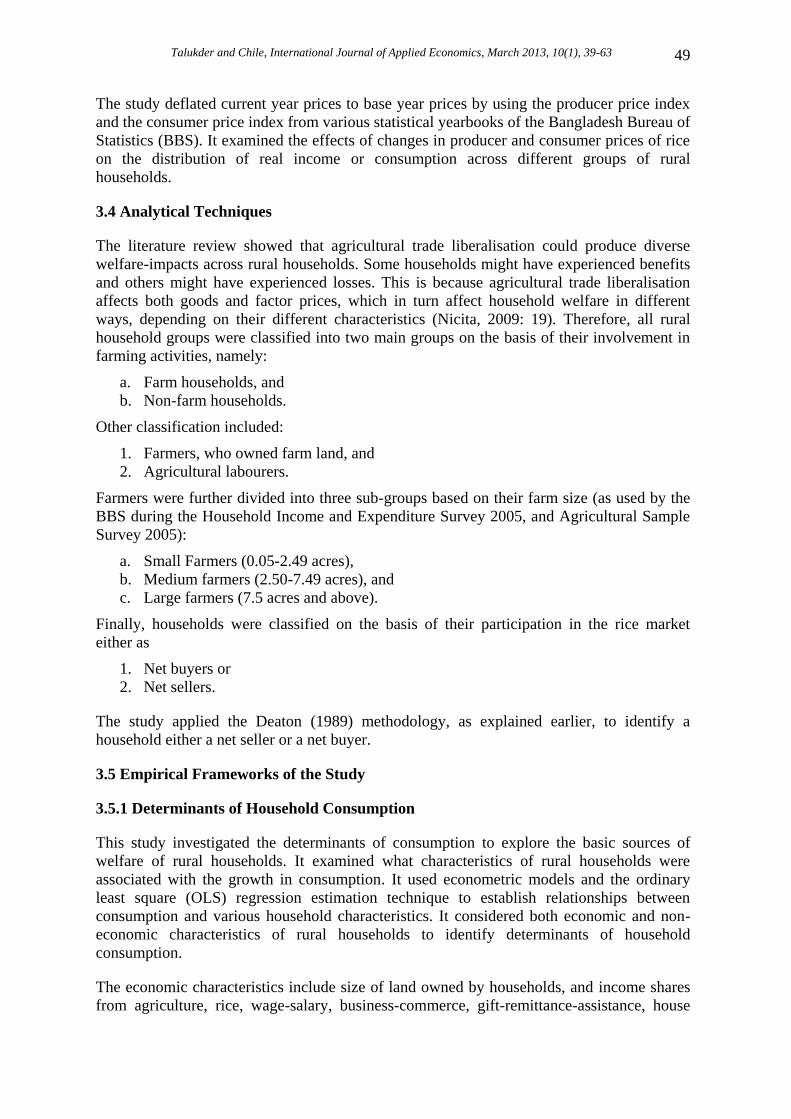
Since the welfare of different households generally weighs differently in the rice price
changes due to changes in productivity as a result of agricultural trade liberalisation, it is
reasonable to move from household to social welfare by writing, for social welfare W:
So that is a weight that represents the social value of transferring one taka (Bangladesh
currency) to household h.
Talukder and Chile, International Journal of Applied Economics, March 2013, 10(1), 39-63 48
Instead of looking at the change in welfare associated with a price change, it can be
measured by identifying how much money (positive or negative) the household would
require to maintain its previous level of living standard. If the price change is , and the
required compensation is dB, then
so, if dB is expressed as a fraction of household expenditure x, we have
where is the budget share of good i, and is the value of production of i
as a fraction (or multiple) of total household expenditure. The term is the net
consumption ratio, which is the elasticity of the cost of living with respect to the price of
good i.
The effect through changes in prices is two-fold: the effect on income (direct price effect on
income from the commodity) and the effect on the expenditure through the consumption
effect. Therefore, the first-order effect of a change in food prices on household welfare
depends on the net trading position of the household. Deaton (1989) formalised this situation
with the concept of net benefit ratio (NBR), which is a proxy for the net-trading position of a
household, to estimate the first-order impacts of price changes on household welfare. The
net benefit ratio for a commodity is the difference between the production ratio (PR) (value
of production as a proportion of income, or expenditure) and consumption ratio (CR) (value
of consumption as a proportion of income, or expenditure) of that commodity. It is the
proportion of net sales to income or expenditure and is approximated by the difference
between income share of the commodity and consumption share of the commodity.
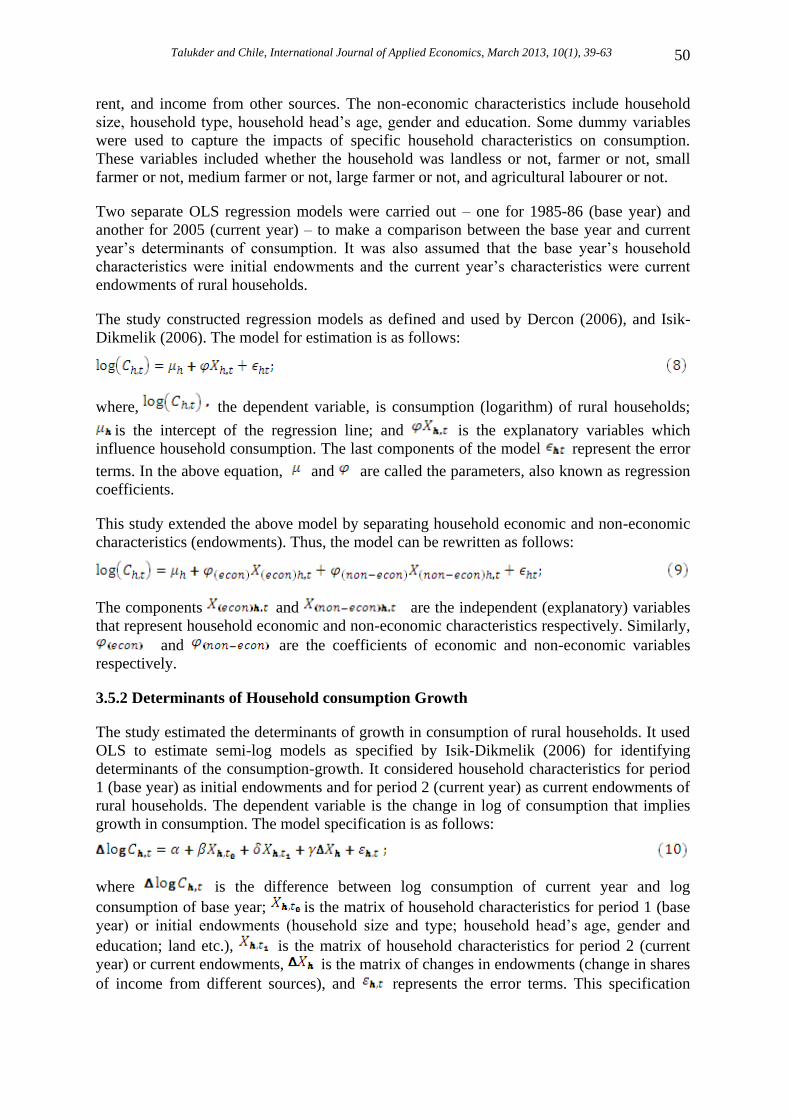
Following the Deaton (1989) methodology, Klytchnikova and Diop (2006), and Isik-
Dikmelik (2006) expressed the NB ratio as follows:
where is the production and is the consumption, X is the total income or expenditure
and and are producer and consumer prices respectively. The NB is used to determine
net seller and net buyer households.
3.3 Changes in Rice Prices and Household consumption
The study focused on the impact of agricultural trade liberalisation on the changes in prices
of rice. Proponents of trade liberalisation argue that it is supposed to make the factors more
competitive and efficient resulting in an outward or upward shift in rice production
possibility frontier, leading to a downward (right) shift of supply function of rice. Given the
demand function, a downward shift of the supply curve should push the domestic price down
to settle at a new equilibrium point because rice is a non-exported good in Bangladesh as the
government imposed restrictions on rice exports. Thus, the study explored the implications
of the changes in price of rice by focusing on two types of prices, namely: producer price
and consumer price.
Talukder and Chile, International Journal of Applied Economics, March 2013, 10(1), 39-63 49
The study deflated current year prices to base year prices by using the producer price index
and the consumer price index from various statistical yearbooks of the Bangladesh Bureau of
Statistics (BBS). It examined the effects of changes in producer and consumer prices of rice
on the distribution of real income or consumption across different groups of rural
households.
3.4 Analytical Techniques
The literature review showed that agricultural trade liberalisation could produce diverse
welfare-impacts across rural households. Some households might have experienced benefits
and others might have experienced losses. This is because agricultural trade liberalisation
affects both goods and factor prices, which in turn affect household welfare in different
ways, depending on their different characteristics (Nicita, 2009: 19). Therefore, all rural
household groups were classified into two main groups on the basis of their involvement in
farming activities, namely:
a. Farm households, and
b. Non-farm households.
Other classification included:
1. Farmers, who owned farm land, and
2. Agricultural labourers.
Farmers were further divided into three sub-groups based on their farm size (as used by the
BBS during the Household Income and Expenditure Survey 2005, and Agricultural Sample
Survey 2005):
a. Small Farmers (0.05-2.49 acres),
b. Medium farmers (2.50-7.49 acres), and
c. Large farmers (7.5 acres and above).
Finally, households were classified on the basis of their participation in the rice market
either as
1. Net buyers or
2. Net sellers.
The study applied the Deaton (1989) methodology, as explained earlier, to identify a
household either a net seller or a net buyer.
3.5 Empirical Frameworks of the Study
3.5.1 Determinants of Household Consumption
This study investigated the determinants of consumption to explore the basic sources of
welfare of rural households. It examined what characteristics of rural households were
associated with the growth in consumption. It used econometric models and the ordinary
least square (OLS) regression estimation technique to establish relationships between
consumption and various household characteristics. It considered both economic and non-
economic characteristics of rural households to identify determinants of household
consumption.
The economic characteristics include size of land owned by households, and income shares
from agriculture, rice, wage-salary, business-commerce, gift-remittance-assistance, house
Talukder and Chile, International Journal of Applied Economics, March 2013, 10(1), 39-63 50
rent, and income from other sources. The non-economic characteristics include household
size, household type, household head‟s age, gender and education. Some dummy variables
were used to capture the impacts of specific household characteristics on consumption.
These variables included whether the household was landless or not, farmer or not, small
farmer or not, medium farmer or not, large farmer or not, and agricultural labourer or not.
Two separate OLS regression models were carried out – one for 1985-86 (base year) and
another for 2005 (current year) – to make a comparison between the base year and current
year‟s determinants of consumption. It was also assumed that the base year‟s household
characteristics were initial endowments and the current year‟s characteristics were current
endowments of rural households.
The study constructed regression models as defined and used by Dercon (2006), and Isik-
Dikmelik (2006). The model for estimation is as follows:
where, the dependent variable, is consumption (logarithm) of rural households;
is the intercept of the regression line; and is the explanatory variables which
influence household consumption. The last components of the model represent the error
terms. In the above equation, and are called the parameters, also known as regression
coefficients.
This study extended the above model by separating household economic and non-economic
characteristics (endowments). Thus, the model can be rewritten as follows:
The components and are the independent (explanatory) variables
that represent household economic and non-economic characteristics respectively. Similarly,
and are the coefficients of economic and non-economic variables
respectively.
3.5.2 Determinants of Household consumption Growth
The study estimated the determinants of growth in consumption of rural households. It used
OLS to estimate semi-log models as specified by Isik-Dikmelik (2006) for identifying
determinants of the consumption-growth. It considered household characteristics for period
1 (base year) as initial endowments and for period 2 (current year) as current endowments of
rural households. The dependent variable is the change in log of consumption that implies
growth in consumption. The model specification is as follows:
where is the difference between log consumption of current year and log
consumption of base year; is the matrix of household characteristics for period 1 (base
year) or initial endowments (household size and type; household head‟s age, gender and
education; land etc.), is the matrix of household characteristics for period 2 (current
year) or current endowments, is the matrix of changes in endowments (change in shares
of income from different sources), and represents the error terms. This specification
Talukder and Chile, International Journal of Applied Economics, March 2013, 10(1), 39-63 51
allows the study to examine the relationship between endowments and the change in welfare
or growth in consumption of rural households.
4. Result Discussion and Analysis
4.1 Change in Prices of Rice and Household Income
Agricultural trade liberalisation contributed to the increase in productivity of rice, resulting
in higher volumes of rice production during 1985-86 to 2005. Since the government put a
ban on rice exports, the increased volume of rice production also increased the supply of rice
in the domestic market, leading to a decrease in rice prices. An estimate using data from
HHES-1985-86 and HHIES-2005 indicates that both producer and consumer prices of rice
decreased during this period. The producer price declined by a total of 22.78 percent with an
average of 1.14 percent per year and the consumer price decreased by 13.95 percent with an
average of 0.70 percent per year over the same period as shown in Table 2. A decrease in the
producer price implies a decline in welfare (income) of rice farmers whereas a decrease in
consumer price suggests an increase in the welfare (income) of rice consumers. The
magnitude of decrease in producer price is much greater than the decrease in the consumer
price, indicating that rice traders or intermediaries between producers and consumers gained
largely from this liberalisation process.
A disproportionate decrease in producer and consumer prices of rice affected the income
distribution and welfare of rural households in accordance with their involvement with the
rice market. The change in welfare of rural households was reflected in their income, which
is analysed in the following sections.
4.2 Descriptive Statistics of Data
Table 3 presents the descriptive statistics of household consumptions. As in the case of
household income, the standard deviations of household consumption were large for all
groups of rural households, suggesting a large dispersion of data from the mean indicating
large variations in consumption of each group and across groups of rural households.
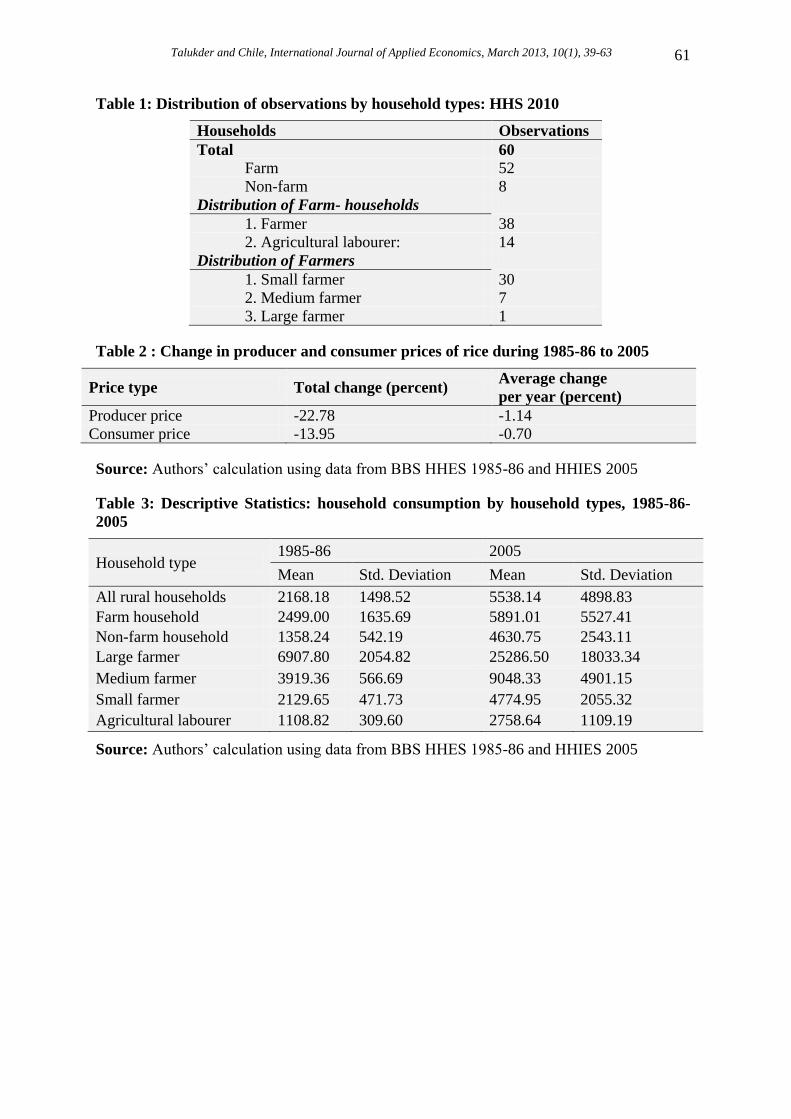
The patterns of household consumption as shown in Table 4 suggest that the distribution of
consumption by food and non-food shares remained very similar over the period between
1985-86 and 2005. In 1985-86 and 2005, the mean food consumption for all deciles of rural
households was 68 and 63 percent respectively; and the mean non-food consumption for all
deciles was 32 and 37 percent of total consumption respectively in the same years. The
shares of food and non-food consumption for households belonging to the bottom nine
deciles – from Decile 1 to Decile 9 – were very close to average consumption of food and
non-food items for all rural households in both 1985-86 and 2005. Compared to other deciles
of households, it is clear that in 1985-86 and 2005 the households of Decile 10 had a much
lower average share of food consumption with 59 and 46 percent and a much higher average
share of non-food consumption with 41 and 54 percent respectively. These data suggest that
households in Decile 1 to Decile 9 are relatively poor and need to spend a larger share of
their income on food than non-food consumption. On the other hand, households in Decile
10 are relatively rich households in rural communities and they spend a smaller proportion
of their income on food consumption compared to their non-food consumption expenditure.
This analysis supported the argument that households included in the top decile of rural
communities belonged to the highest income group and were distinctly different in terms of
income and consumption from households of other deciles.
Talukder and Chile, International Journal of Applied Economics, March 2013, 10(1), 39-63 52
Rice is the single major component of food consumption for all groups of rural households.
The average share of rice consumption in 1985-86 and 2005 were 45 and 44 percent of total
food consumption respectively. Similarly, the share of other food consumption was 55 and
56 percent in 1985-86 and 2005 respectively. It is evident that the shares of rice and other
food consumption were fairly distributed around their respective mean values, suggesting
that the distribution of food consumption for all deciles of rural households was normal and
followed a similar trend during 1985-86 to 2005. As we moved from Decile 1 to Decile 10,
the share of rice consumption slowly decreased and the share of other food consumption
slowly increased. This is a clear indication that poor households spent a larger share of their
food expenditure on rice than that of rich households.
4.3 Determinants of Household Consumption
The determinants of household consumption were analysed based on household
characteristics. An OLS regression model was applied in specifying consumption
determinants. This model allowed both economic and non-economic characteristics of
households to interact simultaneously for determining household consumption in 2010. The
study considered household size, household head‟s literacy, household land area, rice price
and some dummy variables – non-farm household, rice mostly bought in peak season, access
to desired market, and environmental impact as explanatory variables in this model.
However, household size and household head‟s literacy were found not statistically
significant, thereby excluded from the model. Similarly, the study used an environmental
dummy variable to investigate as to whether environmental impacts from agricultural trade
liberalisation influenced consumption of rural households. However, this variable also was
not statistically significant, thereby excluded from this model.
As shown in Table 5, the positive determinants of household consumption were household
land area and two dummy variables – non-farm household and access to most desired market
to buy rice in 2010. Amongst the positive determinants, non-farm household dummy was the
largest contributor to household consumption with a regression coefficient of 0.505 followed
by household land area (0.489) and access to desired market to buy rice (0.129). Conversely,
the negative determinants were rice price and two dummy variables – net buyer and rice
mostly bought on peak season in the same year. Amongst the negative determinates, net
buyer dummy variable had the largest negative influence on consumption with a regression
coefficient of 0.293 followed by rice price (0.244) and rice mostly bought on peak season
(0.186).
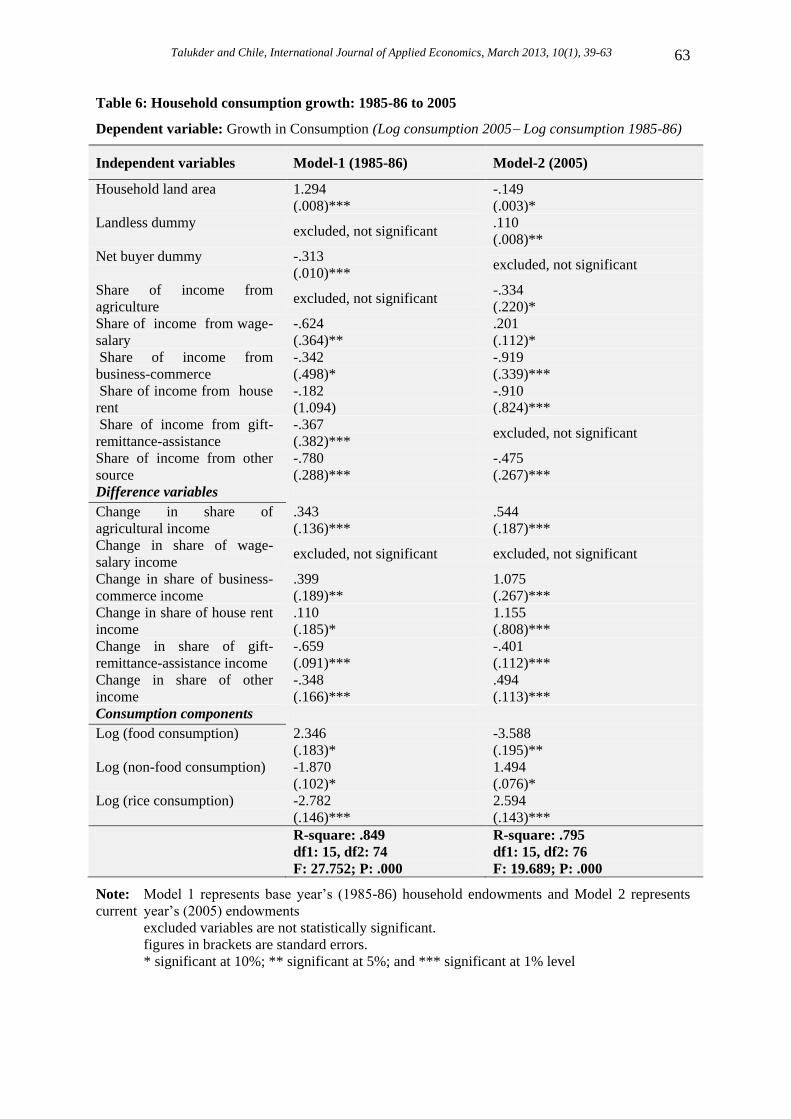
4.5 Determinants of Household Consumption Growth and Welfare
All groups of rural households experienced considerable growth in consumption during
1985-86 and 2005. Two separate regression models were carried out to identify the
determinants and sources of household consumption growth. Both models – Model 1 and
Model 2 – included economic and non-economic characteristics of rural households,
difference variables (changes in the shares of income from different sources), and three
major components of household consumption (food, non-food, and rice). Model 1
considered the base year‟s (1985-86) data – initial endowments of households. Similarly,
Model 2 considered the current year‟s (2005) data – current endowments of households.
Difference-variables were changes in shares of household income by sources. They captured
the changes in household endowments during 1985-86 to 2005. The results of these models
were presented in Table 6.
Talukder and Chile, International Journal of Applied Economics, March 2013, 10(1), 39-63 53
Non-economic characteristics of household considered in the OLS models were household
size, and household head‟s age, gender and education. However, these explanatory variables
were not statistically significant, thereby excluded from both models. This evidence suggests
that household non-economic characteristics were not important in determining the growth
in consumption of rural household between 1985-86 and 2005.
In 1985-86, the positive determinants of growth in household consumption were household
land area, three difference variables (changes in shares of income from agriculture, business-
commerce, and house rent) and food consumption. Amongst these determinants, food
consumption was the largest contributor to the growth with a regression coefficient of 2.346
followed by household land area (1.294) and change in share of income from business-
commerce (0.399) in the same year. Conversely, the negative determinants were net buyer
dummy, share of income from five sources (wage-salary, business-commerce, house rent,
gift-remittance-assistance, and other sources), two change variables (changes in shares of
income from gift-remittance-assistance and other sources), and two consumption
components (non-food and rice consumption). Amongst the negative determinants, rice
consumption had the largest negative impact on growth with a regression coefficient of
2.782 followed by non-food consumption (1.870) and share of income from other sources
(0.780). Considering household characteristics, household land area was the sole positive
determinant of household consumption growth in 1985-86. Conversely, net seller dummy
and shares of income from five sources including wage-salary, business-commerce, house
rent, gift-remittance-assistance and other sources were the negative determinants of growth
in consumption in the same year. Amongst the difference variables, change in the shares of
income from agriculture, business-commerce and house rent had positive impact and
changes in shares of income from gift-remittance-assistance and other sources had negative
impact on household consumption growth. Amongst the three consumption components,
food consumption had positive impact and non-food consumption and rice consumption had
negative impact on growth. The excluded variables in Model 1 were landless dummy, share
of agricultural income and change in share of wage-salary income, which were not
statistically significant. It is evident from the above analysis that it was not rice
consumption, but farm household characteristics related to rice income such as land, and
change in share of agricultural income positively contributed to growth in household
consumption in 1985-86.
Similarly, in 2005, the positive determinants of growth in household consumption were
landless dummy, share of income from wage-salary, change in share of income from four
sources (agriculture, business-commerce, house rent and other sources) and two
consumption components (non-food and rice consumption). Amongst these determinants,
rice consumption was the largest contributor to the growth with a regression coefficient of
2.594 followed by non-food consumption (1.494) and change in share of house rent (1.155).
Conversely, the negative determinants of growth were household land area, share of income
from four sources (agriculture, businesscommerce, house rent, and other sources), change
in share of gift-remittance-assistance and food consumption in 2005. Amongst the negative
determinants, food consumption had the largest negative impact on growth in household
consumption with a regression coefficient of 3.588 followed by share of income from
businesscommence (0.919) and share of income from house rent (0.910) in the same
year. Amongst household characteristics, household landless dummy and share of income
from wage-salary were the positive determinants of growth in household consumption in
2005. Conversely, household land area and shares of income from four sources including
agriculture, business-commerce, house rent, and other sources were the negative
Talukder and Chile, International Journal of Applied Economics, March 2013, 10(1), 39-63 54
determinants of growth in the same year. Considering the difference variables, changes in
share of income from agriculture, business-commerce, house rent, and other sources had
positive impact and change in share of income from gift-remittance-assistance had negative
impact on growth in 2005. The excluded variable in Model 2 were net buyer dummy, share
of income from gift-remittance-assistance and change in share of wage-salary, which were
not statistically significant.
Considering both models, three difference variables – change in share of income from
agriculture, business-commerce, and house rent – had positive impact on growth in
household consumption in both 1985-86 and 2005. Conversely, shares of three sources of
income (business-commerce, house rent and other sources) and changes in share of gift-
remittance-assistance were the negative determinants of growth in both years. Although
household land area and food consumption were positive determinants in 1985-86, they were
negative determinants of growth in 2005. Similarly, share of income from wage-salary,
change in share of income from other sources, and two consumption components (non-food
and rice) were the positive determinants in 2005 but they were the negative determinants in
1985-86. Net buyer dummy and share of income from gift-remittance-assistant had negative
impact on consumption growth in 1985-86 but they were not statistically significant in 2005.
Similarly, landless dummy had positive impact and share of agricultural income had
negative impact on growth in 2005 but they were not statistically significant in 1985-86.
As discussed earlier, rice consumption was the largest positive contributor to growth in
household consumption followed by non-food consumption in 2005, suggesting that
agricultural trade liberalisation contributed to an increase in rice production and
consumption, leading to higher growth in household consumption. On the other hand, food
consumption had the largest negative impact on growth in consumption followed by share of
business-commerce income, implying that the non-food component, rather than the food
component as a whole, contributed to higher consumption growth. This analysis suggests
that as income grew, households were more likely to spend greater shares of income on non-
food consumption than on food consumption, which was evident in the post-liberalisation
era. This analysis supported the explanation in sub-section 7.3.2.1 that as we moved from
Decile 1 to Decile 10, food expenditure decreased and non-food expenditure increased.
The share of income from rice and changes in share of income from rice were considered in
both regression models but were not statistically significant, thereby excluded from the
models. Although the change in the share of agricultural income was a positive contributor
to consumption growth in both 1985-86 and 2005, neither the share of rice income nor the
change in the share of rice income was statistically significant. This analysis suggests that it
was not the rice income but income from other sources were responsible for the contribution
to growth in household consumption in both 1985-86 2005.
5. Conclusion
The above findings and analyses suggest that amongst three positive determinants of
household consumption – household land area and two dummy variables (non-farm
household and access-to-most-desired-market-to-buy-rice); non-farm household dummy was
the largest contributor to household consumption in 2010. Conversely, the negative
determinants were rice price and two dummy variables – net buyer and rice-mostly-bought-
on-peak-season in the same year. Amongst them, net buyer dummy variable was the largest
negative determinant of household consumption. Household‟s non-economic characteristics
were not statistically significant in determining growth in consumption. This evidence
Talukder and Chile, International Journal of Applied Economics, March 2013, 10(1), 39-63 55
suggests that household non-economic characteristics were not important in determining the
growth; rather economic characteristics contributed to the growth in household consumption
between 1985-86 and 2005. As rice consumption was the largest positive contributor to the
growth in household consumption in 2005, the study argues that agricultural trade
liberalisation contributed to an increase in rice production and consumption, leading to
higher growth in household consumption in the post-liberalisation era.
The study considered the share of income from rice and changes in share of income from
rice in both regression models and found not statistically significant, thereby excluded them
from the models. Although the change in the share of agricultural income was a positive
contributor to consumption growth in both 1985-86 and 2005, neither the share of rice
income nor the change in the share of rice income was statistically significant. This analysis
suggests that it was not the rice income but income from other sources were responsible for
the contribution to the growth in household consumption in both 1985-86 2005. The study
suggests that while agricultural trade liberalisation positively impacted on rice production,
resulting from technological transformation and leading to a substantial decrease in both
producer and consumer prices of rice, farm households were not benefited much from rice
income in determining consumption growth (welfare). This might be attributed to a greater
decrease in the producer price than that in the consumer price.
This study argues that some farmers may shift from rice to other agricultural or non-farm
activities, thus jeopardising the country‟s food security and self-sufficiency efforts in food-
grain production. Therefore, it is crucial to formulate government policies to support farm
households in the form of income transfer such as tax reduction and production subsidy in
order to avoid food security and macroeconomic instability as a result of high food prices
due to a shortage of rice production. The government should avoid a high food price shock
that could adversely affect the performance of economic growth, price stability and
unemployment – the three main objectives of government policies.
Endnotes
Dayal Talukder, Lecturer, ICL Business School, Auckland, New Zealand; Email:
Love Chile, Associate Professor, Institute of Public Policy, Auckland University of
Technology, Auckland, New Zealand; Email: [email protected].
References
Acharya, S. 2011. "Making Unilateral Trade Liberalisation Beneficial to The Poor," Socio-
Economic Planning Sciences, 45, 60-71.
Ahmed, I. 1978. "Unemployment and Underemployment in Bangladesh Agriculture," World
Development, 6, 1281-1296.
Ahmed, N., Z. Bakht, P. Dorosh, and Q. Shahabuddin. 2007. Distortion to Agricultural
Incentives in Bangladesh. Agricultural Distortion Working Paper No 32, Washington DC: the
World Bank.
Talukder and Chile, International Journal of Applied Economics, March 2013, 10(1), 39-63 56
Ahmed, S. and Z. Sattar. 2004. Trade Liberalization, Growth and Poverty Reduction: The
Case of Bangladesh. World Bank Policy Research Working Paper 34204, Washington DC:
The World Bank.
Alam, M. J., J. Buysse, I. A. Begum, E. J. Wailes, et al. 2011. "The Welfare Impact of
Policy Interventions in the Foodgrain Markets in Bangladesh," Journal of Economic Policy
Reform, 14, 215-225.
Alauddin, M. and J. Quiggin. 2008. "Agricultural Intensification, Irrigation and the
Environment in South Asia: Issues and Policy Options," Ecological Economics, 65, 111-124.
Allenby, G. M., T.S. Shively, S. Yang, and M. J. Garratt. 2004. "A Choice Model for
Packaged Goods: Dealing with Discrete Quantities and Quantity Discounts," Marketing
Science, 23, 95-108.
Anderson, K. 2004. Agricultural Trade Reform and Poverty Reduction in Developing
Countries. World Bank Policy Research Working Paper 3396, Washington DC: The World
Bank.
Banerjee, A. and A. Newman. 2004. Inequality, Growth and Trade Policy. mimeo: MIT.
Bartlett-II, J. E., M. E. Bartlett, and T. G. Reio-Jr. 2008. "Analysis of Nonresponse Bias
in Research for Business Education," Delta PiEpsilon Journal, 1, 45-58.
BBS. 1988. Household Expenditure Surveys 1985-86. Dhaka: Bangladesh Bureau of
Statistics.
BBS. 2007a. Agricultural Sample Survey of Bangladesh - 2005: Zila Series, Comilla. Dhaka:
Bangladesh Bureau of Statistics (BBS), Government of Bangladesh.
BBS. 2007b. Report of the Household Income and Expenditure Survey 2005. Dhaka:
Bangladesh Bureau of Statistics, Government of Bangladesh.
BBS. 2009. Preliminary Report on Agriculture Census 2008. Dhaka: Bangladesh Bureau of
Statistics (BBS), Government of Bangladesh.
Briones, R. M. 2006. "Employment Generation for the Rural Poor in Asia: Perspectives,
Patterns, and Policies," Asian Development Review, 23, 87-116.
Byerlee, D., X. Diao, and C. Jackson. 2005. Agriculture, Rural Development, and Pro-poor
Growth: Country Experience in the Post-Reform Era. Agricultural and Rural Development
Discussion Paper 21, Washington DC: the World Bank.
Chang, R., L. Kaltani, and N. Loayza. 2005. Openness can be Good for Growth: The Role
of Policy Complementarities. NBER Working Paper 11787, Cambridge: National Bureau of
Economic Research.
Chang, R., L. Kaltani, and N. Loayza. 2009. "Openness can be Good for Growth: The Role
of Policy Complementarities," Journal of Development Economics, 90, 33-49.
Conceição, P. and R. Bandura. 2008. Measuring Subjective Wellbeing: A Summary Review
of the Literature. New York: United Nations Development Programme (UNDP).
Deaton, A. 1989. "Rice Price and Income Distribution in Thailand: A Non-parametric
Analysis," The Economic Journal, 99, 1-37.
Deaton, A. 1997. The analysis of household surveys: a microeconometric approach to
development policy. Washington DC: the World Bank.
Talukder and Chile, International Journal of Applied Economics, March 2013, 10(1), 39-63 57
Dercon, S. 2006. "Economic Reform, Growth and the Poor: Evidence from Rural Ethiopia,"
Journal of Development Economics, 81, 1-24.
Dorosh, P. and Q. Shahabuddin. 2002. Rice Price Stabilization on Bangladesh: An
Analysis of Policy Options. MSSD Discussion Paper No. 46, Markets and Structural Studies
Division, International Food Policy Research Institute.
Faroque, M., M. Kashem, and S. Bilkis. 2013. "Sustainable Agriculture: A Challenge in
Bangladesh," International Journal of Agricultural Research, Innovation and Technology, 1,
1-8.
Gabre-Madhin, E., C. B. Barrett, and P. Dorosh. 2002. Technological Change and Price
Effects in Agriculture: Conceptual and Comparative Perspectives. Washington DC:
International Food Policy Research Institute (IFPRI)
Hoque, M. M. and Z. Yusop. 2010. "Impacts of Trade Liberalisation on Aggregate Import
in Bangladesh: An ARDL Bounds Test Approach," Journal of Asian Economics, 21, 37-52.
Hossain, M. 2004. Poverty Alleviation through Agriculture and Rural Development in
Bangladesh. CPD Occasional Paper Series 39, Dhaka: Center for Policy Dialogue.
Hossain, M. 2009. The Impact of Shallow Tubewells and Boro Rice on Food Security in
Bangladesh. IFPRI Discussion Paper 00917, International Food Policy Research Institute
(IFPRI).
Hossain, M. and U. K. Deb. 2003. Trade Liberalization and the Crop Sector in Bangladesh.
CPD Occasional Paper Series 23, Dhaka: Center for Policy Dialogue.
Hossain, M. I. and W. Verbeke. 2010. "Evaluation of Rice Markets Integration in
Bangladesh," The Lahore Journal of Economics, 15, 77-96.
Isik-Dikmelik, A. 2006. Trade Reforms and Welfare: An Ex-Post Decomposition of Income
in Vietnam. World Bank Policy Research Working Paper 4049, Washington DC: the World
Bank.
Islam, M. J., and S. M. A. Habib. 2007. International Financial Institutions in Bangladesh:
Implications of Selected Policies for Agriculture Sector and Rural Livelihood. Dhaka:
Development Research Network.
Karfakis, P., J. Velazco, E. Moreno, and K. Covarrubias. 2011. Impact of Increasing
Prices of Agricultural Commodities on Poverty. ESA Working Paper No. 11-14, Agricultural
Development Economics Division, Food and Agriculture Organization of the United Nations.
Keleman, A. 2010. "Institutional Support and in Situ Conservation in Mexico: Biases
Against Small-scale Maize Farmers in Post-NAFTA Agricultural Policy," Agriculture and
Human Values, 27, 13-28.
Klytchnikova, I. and N. Diop. 2006. Trade Reforms, Farms Productivity, and Poverty in
Bangladesh. World Bank Policy Research Working Paper 3980, Washington DC: the World
Bank.
Krugman, P. R. and M. Obstfeld. 2006. International Economics: Theory and Policy. New
York: Addison-Welsley.
Landry, C. E. and K. E. McConnell. 2007. "Hedonic Onsight Cost Model of Recreation
Demand," Land Economics, 83, 253-267.
Lee, E. and M. Vivarelli. 2006. The Social Impact of Globalisation in the Developing
Countries. CSGR Working Paper No 199/06.
Talukder and Chile, International Journal of Applied Economics, March 2013, 10(1), 39-63 58
McCulloch, N., L. A. Winters., and X. Cirera. 2003. Trade Liberalization and Poverty: A
handbook. London: Centre for Economic Policy Research.
Mendola, M. 2007. "Agricultural Technology Adoption and Poverty Reduction: A
Propensity-Score Matching Analysis for Rural Bangladesh," Food Policy, 32, 372-393.
Ministry of Finance. 2010. Bangladesh Economic Review 2010. Dhaka: Ministry of
Finance, the Government of Bangladesh.
Ministry of Finance. 2012. Bangladesh Economic Review 2012. Dhaka: Ministry of
Finance, the Government of Bangladesh.
Moazzem, K. G., N. Ahmed, S. N. Manzur, and M. I. Chowdhury. 2012. Framework for
the Proposed Comprehensive Trade Policy for Bangladesh. CPD Working Paper 99, Dhaka:
Centre for Policy Dialogue (CPD).
Montalbano, P. 2011. "Trade Openness and Developing Countries' Vulnerability: Concepts,
Misconceptions and Directions for Research," World Development, 33, 1489-1502.
Mujeri, M. 2002. Globalization-Poverty Links in Bangladesh: Some Broad Observations. In
R. Sobhan (Ed.), Changes and Challenges: A Review of Bangladesh's Development 2001.
Dhaka: Center for Policy Dialogue/University Press Ltd.
Mujeri, M. and B. Khondker. 2002. Poverty Implications of Trade Liberalization in
Bangladesh: A General Equilibrium Approach. Dhaka: Bangladesh Institute of Development
Studies.
OECD. 2010. Transformation of Food Production and Distribution Systems. Organisation
for Economic Co-operation and Development (OECD), Trade and Agricultural Directorate
Committee for Agriculture Working Paper: TAD/CA/APM/WP(2010)10/FINAL.
Panagariya, A. 2004. "Miracles and Debacles: In Defence of Trade Openness," World
Economy, 27, 1149-1171.
Rahman, M. 2000. Turning the Full Circle: Rationale and Mechanics of Rice Exports from
Bangladesh. FMRSP Working Paper No. 4, Food Management & Research Support Project -
Bangladesh, International Food Policy Research Institute
Rahman, T. 2008. Political Economy of Trade Liberalisation in Bangladesh: Impact of
Trade Liberalisation on Bangladesh Agriculture. Jaipur: CUTS International.
Rakotoarisoa, M. A. 2011. "The impact of Agricultural Policy Distortions on the
Productivity Gap: Evidence from Rice Production," Food Policy, 36, 147-157.
Ravallion, M. 1990. "Rural Welfare Effects of Food Price Changes under Induced Wage
Responses: Theory and Evidence from Bangladesh," Oxford Economis Papers, New Series,
42, 574-585.
Salim, R. and A. Hossain. 2006. "Market Deregulation, Trade Liberalization and Productive
Efficiency in Bangladesh Agriculture: An Empirical analysis," Applied Economics, 38, 2567-
2580.
Stiglitz, J. E. and A. Charlton. 2007. Fair Trade for All: How Trade can Promote
Development. New York: Oxford University Press.
Stone, S. F. and B. Shepherd. 2011. Dynamic Gains from Trade: The Role of Intermediate
Inputs and Equipment Imports. OECD Trade Policy Working Paper No. 110.
Strengmann-Kuhn, W. 2000. Theoretical Definition and Empirical Measurement of
Welfare and Poverty: A Microeconomic Approach. Paper presented in the 26th General
Talukder and Chile, International Journal of Applied Economics, March 2013, 10(1), 39-63 59
Conference of International Association for Research in Income and Wealth, 27 August - 2
September 2000, Cracow, Poland.
Sugimoto, Y. and M. Nakagawa. 2011. "Endogenous Trade Policy: Political Struggle in the
Growth Process," Structural Change and Economic Dynamics, 22, 12-29.
Wagle, U. R. 2007. "Poverty in Kathmandu: What do Subjective and Objective Economic
Welfare Concepts Suggest?" Journal of Economic Inequality, 5, 73-95.
World Bank. 2002. Poverty in Bangladesh: Building on Progress. Economic Management
Sector Unit Report, Washington DC: the World Bank.
World Bank. 2006. Bangladeh: Country Environmental Analysis. Bangladesh Development
Series Paper No. 12, The World Bank Country Office, Dhaka: the World Bank.
World Bank. 2008. World Development Report 2008: Agriculture for Development.
Washington DC: the World Bank.
World Bank. 2011a. World Development Indicators 2011. Washington DC: the World Bank.
World Bank. 2011b. World Development Report 2011. Washington DC: the World Bank.
Yu, B. and S. Fan. 2011. "Rice Production Response in Cambodia," Agricultural
Economics, 42, 437-450.
Zhang, W.-B. 2008. International Trade Theory: Capital, Knowledge, Economic Structure,
Money, and Prices over Time. Springer-Verlag Berlin Heidelberg.
Talukder and Chile, International Journal of Applied Economics, March 2013, 10(1), 39-63 60
Tables and Figures
Figure 1: Research Model: agricultural trade liberalisation and household welfare
Source: Authors‟ drawing
Talukder and Chile, International Journal of Applied Economics, March 2013, 10(1), 39-63 61
Table 1: Distribution of observations by household types: HHS 2010
Households Observations
Total 60
Farm 52
Non-farm 8
Distribution of Farm- households
1. Farmer 38
2. Agricultural labourer: 14
Distribution of Farmers
1. Small farmer 30
2. Medium farmer 7
3. Large farmer 1
Table 2 : Change in producer and consumer prices of rice during 1985-86 to 2005
Price type Total change (percent) Average change
per year (percent)
Producer price -22.78 -1.14
Consumer price -13.95 -0.70
Source: Authors‟ calculation using data from BBS HHES 1985-86 and HHIES 2005
Table 3: Descriptive Statistics: household consumption by household types, 1985-86-
2005
Household type 1985-86 2005
Mean Std. Deviation Mean Std. Deviation
All rural households 2168.18 1498.52 5538.14 4898.83
Farm household 2499.00 1635.69 5891.01 5527.41
Non-farm household 1358.24 542.19 4630.75 2543.11
Large farmer 6907.80 2054.82 25286.50 18033.34
Medium farmer 3919.36 566.69 9048.33 4901.15
Small farmer 2129.65 471.73 4774.95 2055.32
Agricultural labourer 1108.82 309.60 2758.64 1109.19
Source: Authors‟ calculation using data from BBS HHES 1985-86 and HHIES 2005
Talukder and Chile, International Journal of Applied Economics, March 2013, 10(1), 39-63 62
Table 4: Patterns of household consumption expenditure by deciles: 1985-86 to 2005
All consumption Food consumption
Deciles Food Non-food Rice Other food
1985-
86
200
5
1985-
86
200
5
1985-
86
200
5
1985-
86
200
5
Decile 1 68 68 32 32 54 52 46 48
Decile 2 70 68 30 32 52 51 48 49
Decile 3 70 67 30 33 50 48 50 52
Decile 4 70 67 30 33 47 47 53 53
Decile 5 70 66 30 34 46 45 54 55
Decile 6 70 65 30 35 43 43 57 57
Decile 7 68 64 32 36 43 42 57 58
Decile 8 67 61 33 39 41 39 59 61
Decile 9 65 57 35 43 39 36 61 64
Decile 10 59 46 41 54 32 37 68 63
All HH
(mean)* 68 63 32 37 45 44 55 56
Note: * all rural household (mean)
Source: Authors‟ calculation using data from BBS HHES 1985-86 and HHIES 2005
Table 5: Determinants (related to rice) of household consumption 2010
(Dependent variable: Logarithm of household consumption expenditure)
Independent variables Regression Coefficients
Household land area .489
(.026)***
Non-farm household dummy .505
(.137)***
Net buyer of rice dummy -.294
(.111)***
Rice mostly bought in peak season dummy -.186
(.115)**
Access to most desired market to buy rice dummy .130
(.107)*
Logarithm of rice price -.244
(.130)***
R-square: 0.788; df1: 6, df2: 53; F: 32.837, P-value: 0.000
Note: Calculated from data of Household Survey 2010 conducted by the author
Figures in brackets are standard errors; * significant at 10%; ** significant at 5%;
and *** significant at 1% level
Talukder and Chile, International Journal of Applied Economics, March 2013, 10(1), 39-63 63
Table 6: Household consumption growth: 1985-86 to 2005
Dependent variable: Growth in Consumption (Log consumption 2005 Log consumption 1985-86)
Independent variables Model-1 (1985-86) Model-2 (2005)
Household land area 1.294
(.008)***
-.149
(.003)*
Landless dummy excluded, not significant
.110
(.008)**
Net buyer dummy -.313
(.010)*** excluded, not significant
Share of income from
agriculture excluded, not significant
-.334
(.220)*
Share of income from wage-
salary
-.624
(.364)**
.201
(.112)*
Share of income from
business-commerce
-.342
(.498)*
-.919
(.339)***
Share of income from house
rent
-.182
(1.094)
-.910
(.824)***
Share of income from gift-
remittance-assistance
-.367
(.382)*** excluded, not significant
Share of income from other
source
-.780
(.288)***
-.475
(.267)***
Difference variables
Change in share of
agricultural income
.343
(.136)***
.544
(.187)***
Change in share of wage-
salary income excluded, not significant excluded, not significant
Change in share of business-
commerce income
.399
(.189)**
1.075
(.267)***
Change in share of house rent
income
.110
(.185)*
1.155
(.808)***
Change in share of gift-
remittance-assistance income
-.659
(.091)***
-.401
(.112)***
Change in share of other
income
-.348
(.166)***
.494
(.113)***
Consumption components
Log (food consumption) 2.346
(.183)*
-3.588
(.195)**
Log (non-food consumption) -1.870
(.102)*
1.494
(.076)*
Log (rice consumption) -2.782
(.146)***
2.594
(.143)***
R-square: .849
df1: 15, df2: 74
F: 27.752; P: .000
R-square: .795
df1: 15, df2: 76
F: 19.689; P: .000
Note: Model 1 represents base year‟s (1985-86) household endowments and Model 2 represents
current year‟s (2005) endowments
excluded variables are not statistically significant.
figures in brackets are standard errors.
* significant at 10%; ** significant at 5%; and *** significant at 1% level