determinants of foreign direct investment in developing ... · khondoker abdul mottaleb and...
TRANSCRIPT
ASARC Working Paper 2010/13
Determinants of Foreign Direct Investment in Developing Countries: A Comparative Analysis
Khondoker Abdul Mottaleba Kaliappa Kalirajanb
Abstract By bridging the gap between domestic savings and investment and bringing the latest technology and
management know-how from developed countries, foreign direct investment (FDI) can play an
important role in achieving rapid economic growth in developing countries. The fact is that
developing countries have not been considered as favorable destinations for FDI, as FDI mostly goes
to developed countries. Moreover, among the developing countries, a few countries, such as China,
India, Nigeria and Sudan are the major FDI recipient countries. The rest of the developing countries
are simply fighting for the scraps. Using panel data from 68 low-income and lower-middle income
developing countries, this paper strives to identify the factors that determine FDI inflow to the
developing countries. Based on a comparative discussion focusing on why some countries are
successful in attracting FDI while others are not, the paper demonstrates that countries with larger
GDP and high GDP growth rate, higher proportion of international trade and with more business
friendly environment are more successful in attracting FDI.
Key words: FDI, developing country, low income country, lower middle income country JEL classification: F21 F23 O40
a. Post-Doctoral Research Fellow, National Graduate Institute for Policy Studies, Roppongi 7-22-1, Minato-ku, Tokyo, Japan, Email: [email protected]
b. Corresponding author: Kaliappa Kalirajan, Professor, Crawford School of Economics and Government, Crawford Building, The Australian National University, Canberra ACT 0200, Email: [email protected]
Khondoker Abdul Mottaleb and Kaliappa Kalirajan
2 ASARC WP 2010/13
Determinants of Foreign Direct Investment in Developing Countries: A Comparative Analysis
It is widely recognized that foreign direct investment (FDI) produces economic benefits to
the recipient countries by providing capital, foreign exchange, technology and by enhancing
competition and access to foreign markets (e.g., World Bank, 1999; Crespo and Fontura,
2007; Romer, 1993). Thus developing countries, where investment demand is higher
compared to their domestic savings rate, may be able to invest in their priority sectors and
thus achieve faster economic growth by importing capital from abroad in the form of FDI.
Perhaps the benefits of FDI are not unknown to the developing countries, as most of the
developing countries are competing with each other to attract FDI by liberalizing their policy
regimes and offering various incentive packages, such as tax rebate, trade liberalization,
establishment of special economic zones and incentive packages to the foreign investors. For
example, during 1997, a total of 76 countries made 151 changes in the FDI related policies of
which, 89 percent changes were made to create FDI friendly environment (UNCTAD, 1998).
With a few exceptions, however, most of the developing countries are not very successful in
attracting FDI. Thus, the question arises as to what determines the inflow of FDI?
Athukorala (2009) in a recent paper published in the Margin, The Journal of Applied
Economic Research, asserts that issue related to the determinants of FDI is multidimensional,
because different types of motives work behind the decision of investment in foreign
countries by the multinational corporations. For example, some multinational corporations
seek large domestic market (market seeking FDI) and some of them seek the supply of
natural resources (resource seeking FDI). On the other hand, some multinational corporations
simply want to relocate their plants to reduce their production cost and to link to the global
market more strongly (efficiency seeking FDI). Thus, candidates for being the determinants
of FDI might be multiple. In fact, the literature on FDI has been thickening day by day to
identify the determinants of FDI (e.g., Nunnenkamp and Spatz, 2002; Bandera and White,
1968; Schmitz and Bieri, 1972; Root and Ahmed, 1979; Torrisi, 1985; Schneider and Frey,
1985; Petrochilas, 1989; Wheeler and Mody, 1992; Jun and Singh, 1996). Although there is
consensus on a few economic variables as the major determinants of FDI, such as the size of
GDP and its growth, regarding the other socio-economic variables, such as the role of
business environment in attracting FDI is still unexplored or sometime it was wrongly

Determinants of Foreign Direct Investment in Developing Countries
ASARC WP 2010/13 3
predicted. As a result, empirical findings on the determinants of FDI are quite chaotic and
misleading sometimes. This necessitates undertaking more and more empirical study with
well defined variables and new data sets to clearly understand the determinants of FDI.
In this context, the objective of this paper is to investigate the underlying factors that affect
the inflow of FDI to the developing countries, using panel data covering the period from 2005
to 2007 from 68 developing countries from Asia, Africa and Latin America.
The rest of the paper is organized as follows. Section 2 presents trends of FDI inflow in the
world and to the sample developing countries. Section 3 advances three tesTable hypotheses
in finding the determinants of FDI inflow to developing countries and also includes materials
and method section. Model specification and hypotheses testing are carried out in Section 4
followed by the summary of the findings and policy implications in Section 5.
2.0 Trends of FDI Inflow 2.1 Developing Countries are not the Major Recipients of FDI A trend analysis of FDI inflow reveals that it is not the developing countries rather the
developed countries are the preferred destination of FDI. Table 1 shows that in 2007 total
inflow of FDI in the world was US$ 1833324 million, of which only 27.3 percent went to the
developing countries and the rest went to the developed countries (UNCTAD, 2009).
Moreover, since 1997, developing countries’ share in FDI has been reducing. As the last
column of Table 1 shows, during the sample period, the developing countries’ share in FDI
has been gradually declining. In 1997, the overall share of the developing countries in FDI
was 40 percent, which has reduced to 27 percent in 2007. In absolute term, however, the total
inflow of FDI has witnessed a significant increase to the developing countries. The Table also
shows that there is a one-to-one relationship between the trends of FDI inflow in the world
and to the developed countries, as both the world FDI inflow and FDI inflow towards
developed countries fluctuate in a similar pattern. For example, FDI inflow in the world and
to developed countries hiked in 1999 and then started to decline in the subsequent years. But
after 2002, the inflow of FDI in the world, as well as to the developed countries again started
to increase. On the other hand, Table 1 shows that the trend of FDI inflow to the developing
countries was almost constant and uncorrelated with the world’s FDI inflow until 2003. After
2003, a constant increase (in absoluter term) in the inflow towards the developing nations can
be observed.

Khondoker Abdul Mottaleb and Kaliappa Kalirajan
4 ASARC WP 2010/13
Table 1: Trends of FDI Inflow (in Billion US dollar) during 1997 to 2005
Year World Developed world Developing world Share of the developing world in % 1997 481.91 269.65 193.22 40.09 1999 1079.08 824.64 229.29 21.25 2001 823.83 589.38 209.43 25.42 2003 632.59 442.16 166.34 26.29 2005 958.69 611.28 316.44 33.01 2007 1833.32 1247.64 499.75 27.25
Sources: UNCTAD. World Investment Reports, 2003, 2005, 2009. 2.2 Asian Developing Countries are favored by the Foreign Investors Table 1 depicts the fact that developing countries are absolutely lagging behind in attracting
FDI compared to the developed countries. Importantly, the performance of developing
countries in attracting FDI is highly heterogeneous. Asian developing countries are more
successful in attracting FDI compared to the developing countries in Africa and Latin
America. Figure 1 depicts the fact. Figure 1 shows that from 1997 to 2003 both the trend and
volume of FDI inflow to the Asian as well as Latin American developing countries was
almost the same. From 2003, however, FDI inflow to the Asian developing countries’
increased dramatically compared to Latin America. African developing countries, on the
other hand, have been always less favored by the foreign investors during the entire sample
period compared to Asian and Latin American developing countries.
Figure 1: Trends of FDI Inflow in Developing Countries in Asia, Africa and Latin America
0
50000
100000
150000
200000
250000
300000
350000
1997 1999 2001 2003 2005 2007
AsiaAfricaLatin America
Sources: UNCTAD. World Investment Reports, 2003, 2005, 2009.

Determinants of Foreign Direct Investment in Developing Countries
ASARC WP 2010/13 5
2.3 Lower Middle Income Countries are Highly Favored by the Foreign Investors Across the Continents
Figure1 reveals that developing countries in Asia are more successful in attracting FDI
compared to Latin American and African developing countries. Interestingly, in every
continent, only the lower-middle income countries with per capita GNI ranges from US$ 755
to US$ 2995 have been the major FDI recipient countries. Table 2 presents this uneven
pattern of FDI inflow to the developing countries.
The Table presents the sample top and the least FDI recipient countries in Asia, Africa and
Latin America in 2007. In Asia, China was the largest and Nepal was the least FDI recipient
countries in 2007. China alone received 4.56 percent of world’s FDI, 28 percent of total FDI
went to Asia and Oceania region and 16.71 percent of total FDI to all developing countries in
2007. On the other hand, Nepal, which is also an Asian country, was the least FDI receiving
country in 2007. Nepal received only US$ 6 million FDI in 2007. In Africa, Nigeria was the
top FDI recipient country in 2007. It received nearly 24 percent of FDI that went to Africa
and 2.5 percent of total FDI that went to the entire developing countries in 2007. The least
FDI recipient country in Africa in 2007 was Comoros, which received only US$ 1 of FDI. In
Latin America El Salvador was the top FDI recipient in 2007, which received 1.21 percent of
total FDI that went to Latin America in 2007. The least FDI recipient in Latin America in
2007 was Haiti, which received only US$ 75 of FDI.
Table 2: Major FDI Receiving Countries across the Continents
Sample top and lowest two FDI receiving countries by region
FDI inflow million US$
% Share in the world
% of total inflow to all developing countries % Share in the Region
Asia %Share in Asia
China 83521 4.56 16.71 26.06 Nepal 6.0 0.0003 0.001 0.002 Africa % Share in Africa Nigeria 12454 0.68 2.49 23.51 Comoros 1.0 0.00 0.000 0.002 Latin America % Share in Latin America El Salvador 1526 0.08 0.31 1.21 Haiti 75.0 0.004 0.015 0.06
Sources: UNCTAD. World Investment Report 2009.
Important finding is that all of the top FDI receiving countries across the continents are the
lower-middle income countries and the entire least FDI recipient countries across the
continents are the low-income countries.
Khondoker Abdul Mottaleb and Kaliappa Kalirajan
6 ASARC WP 2010/13
3.0 Theoretical Background, Hypotheses and Model Specification
Figure-1 and Table 2 clearly show that Asian countries compared to African and Latin
American countries and lower-middle income countries compared to low income countries,
are the major recipient of FDI. The question arises as to why Asian countries and lower-
middle income countries tend to be successful in attracting FDI? What are the major factors
that determine the inflow of FDI?
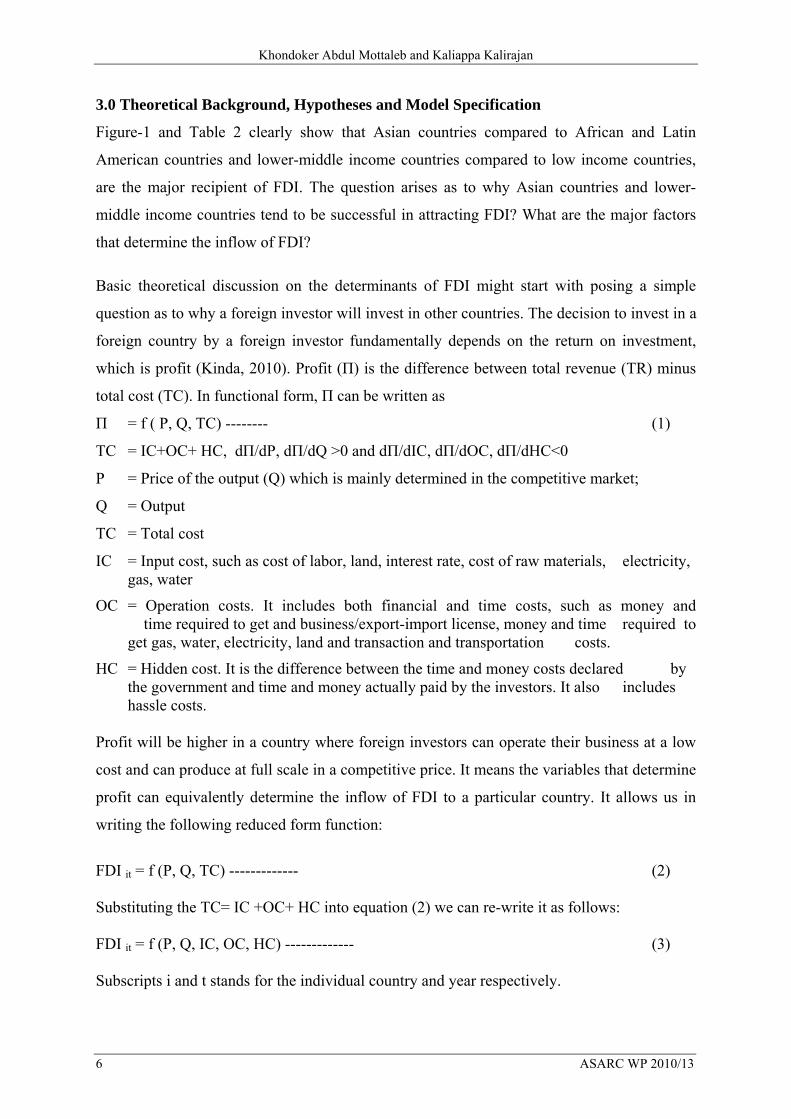
Basic theoretical discussion on the determinants of FDI might start with posing a simple
question as to why a foreign investor will invest in other countries. The decision to invest in a
foreign country by a foreign investor fundamentally depends on the return on investment,
which is profit (Kinda, 2010). Profit (Π) is the difference between total revenue (TR) minus
total cost (TC). In functional form, Π can be written as
Π = f ( P, Q, TC) -------- (1)
TC = IC+OC+ HC, dΠ/dP, dΠ/dQ >0 and dΠ/dIC, dΠ/dOC, dΠ/dHC<0
P = Price of the output (Q) which is mainly determined in the competitive market;
Q = Output
TC = Total cost
IC = Input cost, such as cost of labor, land, interest rate, cost of raw materials, electricity, gas, water
OC = Operation costs. It includes both financial and time costs, such as money and time required to get and business/export-import license, money and time required to get gas, water, electricity, land and transaction and transportation costs.
HC = Hidden cost. It is the difference between the time and money costs declared by the government and time and money actually paid by the investors. It also includes hassle costs.
Profit will be higher in a country where foreign investors can operate their business at a low
cost and can produce at full scale in a competitive price. It means the variables that determine
profit can equivalently determine the inflow of FDI to a particular country. It allows us in
writing the following reduced form function:
FDI it = f (P, Q, TC) ------------- (2) Substituting the TC= IC +OC+ HC into equation (2) we can re-write it as follows: FDI it = f (P, Q, IC, OC, HC) ------------- (3) Subscripts i and t stands for the individual country and year respectively.

Determinants of Foreign Direct Investment in Developing Countries
ASARC WP 2010/13 7
The reduced form version of the FDI function in equation (3) clearly shows the factors that
influence the inflow of FDI to the host countries. According to equation (3) foreign investors
will prefer to invest in countries where they can produce large amount of production at a
lower cost. Based on equation (3), we develop three hypotheses to highlight the factors that
affect the inflow of FDI to host countries and thus to answer the question why Asian
countries and lower middle income countries tend to be successful in attracting FDI.
The size of the economy and its growth rate might critically affect the inflow of FDI to a
particular country. Large and fast growing economy can offer economies of scale and also
can reduce the transportation and product marketing cost as products will be mostly sold in
the host economy. In fact, UNCTAD (1998, 2000) classifies a group of foreign investors who
mainly invest to foreign countries to serve the domestic market. This market seeking foreign
investors thus prefer to invest in countries with large domestic market and in countries which
are growing at a faster rate. It is however, difficult to imagine that market seeking foreign
investors will invest in foreign countries completely to serve the host economies. Rather it
might be case that foreign investors might also export a portion of their product to other
countries as well besides selling in the host economy. It means a country with small domestic
market, but well-linked and open to the global market through international trade can also
provide scale economies similar to the countries with large domestic market, to the foreign
investors. Thus, openness to global market might significantly determine the inflow of FDI.
Probably, due to openness, a few small economies, such as Hong Kong and Singapore
receive substantial amount of FDI (e.g., UNCTAD, 2009). Thus, it is reasonable to postulate
the following hypothesis:
H1: Countries with large GDP and higher GDP growth rate and more open to the global market through international trade are more likely to be successful in attracting FDI compared to others. Foreign investors will prefer to invest in the countries where input cost, operation costs and
hidden costs are low, because it will ensure higher profit. Countries with abundant cheap and
skilled labor, electricity and energy and countries with improved infrastructure, such as road,
port facilities, telephone and internet might significantly and negatively affect the cost of
doing business. Thus the availability of cheap and skilled labor, electricity and energy and
infrastructure thus can significantly affect the inflow of FDI by attracting cost cutting and
efficiency seeking foreign (e.g., UNCTAD, 1998; Kinda, 2010).
Khondoker Abdul Mottaleb and Kaliappa Kalirajan
8 ASARC WP 2010/13
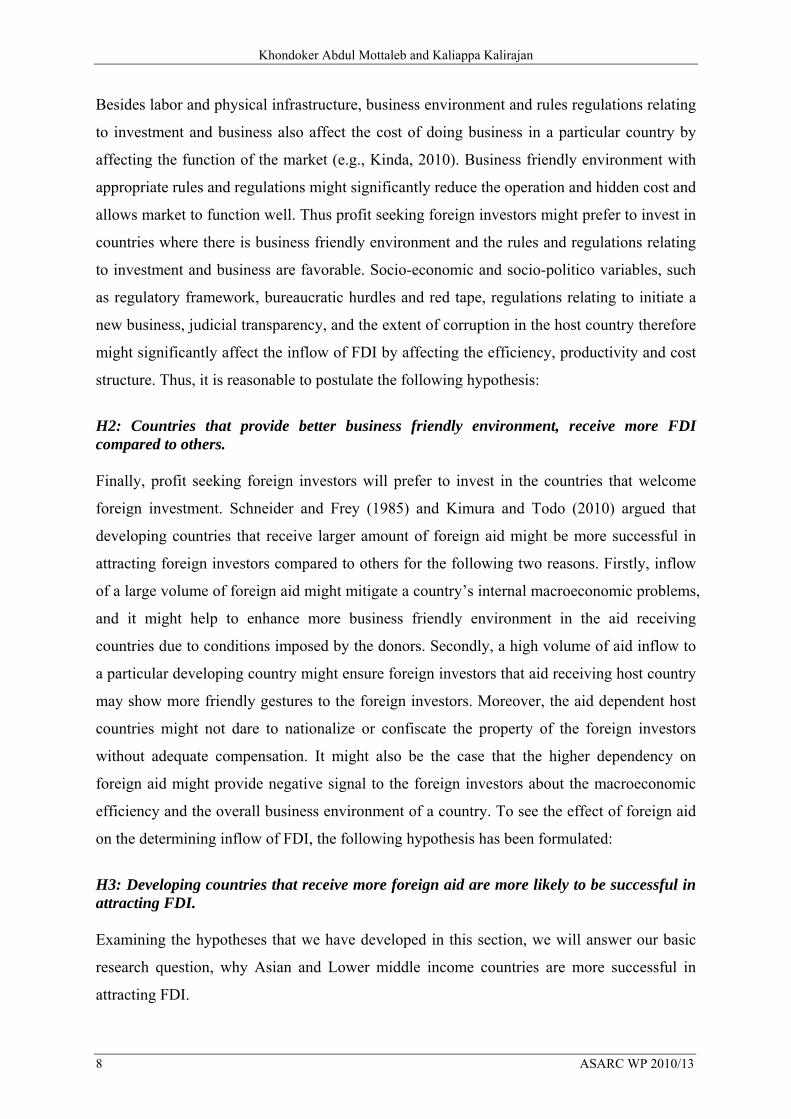
Besides labor and physical infrastructure, business environment and rules regulations relating
to investment and business also affect the cost of doing business in a particular country by
affecting the function of the market (e.g., Kinda, 2010). Business friendly environment with
appropriate rules and regulations might significantly reduce the operation and hidden cost and
allows market to function well. Thus profit seeking foreign investors might prefer to invest in
countries where there is business friendly environment and the rules and regulations relating
to investment and business are favorable. Socio-economic and socio-politico variables, such
as regulatory framework, bureaucratic hurdles and red tape, regulations relating to initiate a
new business, judicial transparency, and the extent of corruption in the host country therefore
might significantly affect the inflow of FDI by affecting the efficiency, productivity and cost
structure. Thus, it is reasonable to postulate the following hypothesis:
H2: Countries that provide better business friendly environment, receive more FDI compared to others. Finally, profit seeking foreign investors will prefer to invest in the countries that welcome
foreign investment. Schneider and Frey (1985) and Kimura and Todo (2010) argued that
developing countries that receive larger amount of foreign aid might be more successful in
attracting foreign investors compared to others for the following two reasons. Firstly, inflow
of a large volume of foreign aid might mitigate a country’s internal macroeconomic problems,
and it might help to enhance more business friendly environment in the aid receiving
countries due to conditions imposed by the donors. Secondly, a high volume of aid inflow to
a particular developing country might ensure foreign investors that aid receiving host country
may show more friendly gestures to the foreign investors. Moreover, the aid dependent host
countries might not dare to nationalize or confiscate the property of the foreign investors
without adequate compensation. It might also be the case that the higher dependency on
foreign aid might provide negative signal to the foreign investors about the macroeconomic
efficiency and the overall business environment of a country. To see the effect of foreign aid
on the determining inflow of FDI, the following hypothesis has been formulated:
H3: Developing countries that receive more foreign aid are more likely to be successful in attracting FDI. Examining the hypotheses that we have developed in this section, we will answer our basic
research question, why Asian and Lower middle income countries are more successful in
attracting FDI.
Determinants of Foreign Direct Investment in Developing Countries
ASARC WP 2010/13 9
3.1 Materials and Method This study is based on the information collected from 68 developing countries in year 2005,
2006 and 2007. Out of 68 sample developing countries, a total of 31 are the low income and
37 are the lower-middle income countries. Furthermore, out of 68 sample countries, 37
countries are from Africa, eight countries are from Latin America and the rests are from Asia.
Among the sample 37 lower middle countries, 18 are from Asia, 12 are from Africa and 7 are
from Latin America. On the other hand among the sample 31 low income countries, seven are
from Asia, 23 are from Africa and one from Latin America, which is Haiti.
The data on FDI inflow in 2005, 2006 and 2007 have been compiled form the World
Investment Report 2009 by UNCTAD (2009). All other data have been complied from the
World Development Indicators, 2009 by World Bank (2009).
To capture the effect of the size of the host economy and its growth potential on FDI inflow,
we include GDP measured at current US dollar and the annual GDP growth rate in our
empirical model. We also consider trade to capture the effect of host economy’s openness
and linkage with the global market. Trade is calculated as the sum of exports and imports of
goods and services measured as a share of gross domestic product (GDP). To capture the role
of foreign aid on FDI inflow, we consider foreign aid inflow into host economy as possible
determinants of FDI. Aid is measured as percentage of gross national income (GNI) that
includes both official development assistance (ODA) and official aid. The ratios are
computed using values in U.S. dollars converted at official exchange rates. To see the effect
of the labor quality on FDI inflow, we also consider the variable industrial value added
measured as percentage of GDP and the growth rate of industrial value added to GDP.
Industrial value added comprises value added in mining, manufacturing (also reported as a
separate subgroup), construction, electricity, water, and gas and measured as a share of GDP.
To capture the effect the host economy’s resources and infrastructure on FDI inflow, we
consider the availability of labor and the number of internet and telephone user s(both fixed
and mobile phone user) per 100 people as possible determinants. The variable total labor
force comprises all economically active people both employed and unemployed who are 15
years or older. Internet users per 100 people are the people with access to the worldwide
network and mobile and fixed-line subscribers per 100 people are those who are connected
with either fixed or mobile phone.
Khondoker Abdul Mottaleb and Kaliappa Kalirajan
10 ASARC WP 2010/13
To capture the effect of host economy’s business environment, regulatory framework and
macroeconomic stability on FDI inflow, we consider days required to start a business, time
required to prepare and pay tax and inflation as possible influential variables. Days required
to start a business is the number of calendar days needed to complete the procedures to
legally operate a business. Time required to prepare and pay taxes is the time, in hours per
year, to prepare, file, and pay (or withhold) three major types of taxes: the corporate income
tax, the value added or sales tax, and labor taxes. Inflation is measured as the annual growth
rate of the GDP implicit deflator shows the rate of price change in the economy as a whole.
Days required starting a business, time required preparing and pay taxes and the rate of
inflation in a host economy can critically shape the cost structure, business and macro-
economic environment and thus the efficiency in doing business in the host economy. The
lesser is the bureaucratic hurdles and complexity, the lower will be the days required to start a
business and to pay taxes. On the other hand, the lower is the time to start a business and to
pay taxes, the lower will be cost of doing business and thus the higher will be the profit. Thus,
days required to start and business and to pay taxes, which present the economic environment
and regulatory framework of the host economy can significantly affect FDI inflow. Inflation
rate, on the other hand, provides signal of health status of the host economy. Controlled and
moderate inflation works as an indicator of the good health of the overall economy and vice
versa. The rate of inflation thus might significantly affect the inflow of FDI.
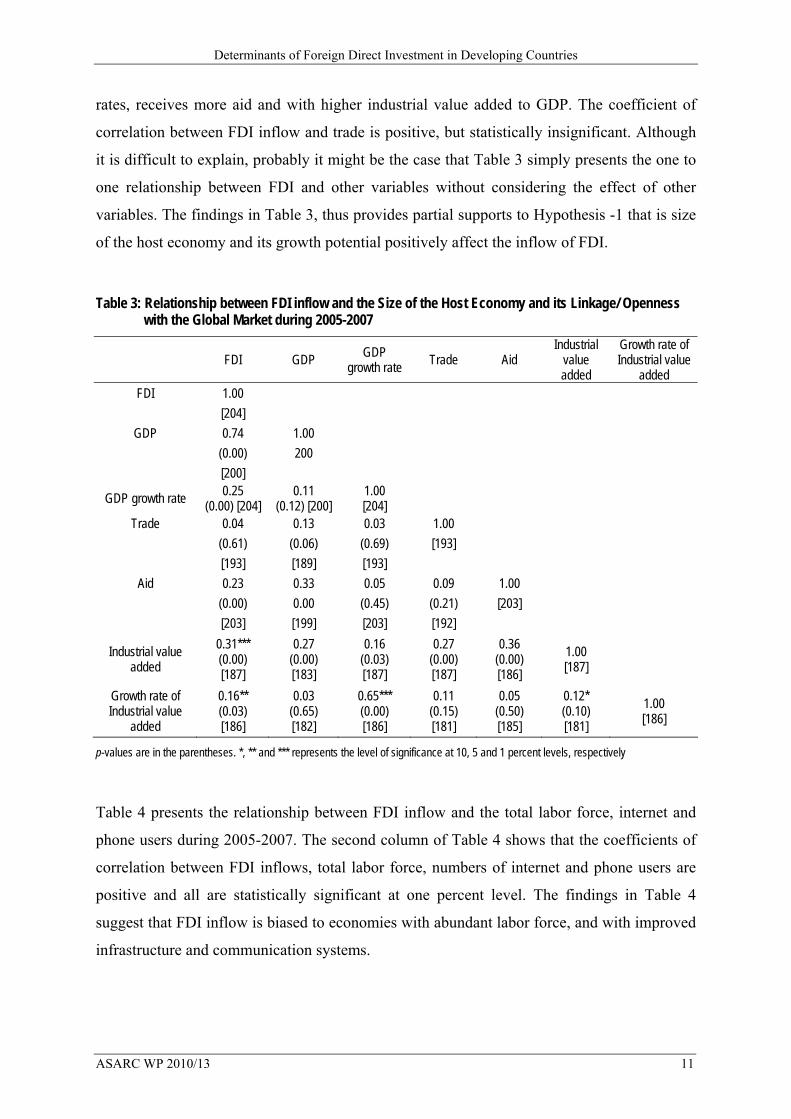
In the next few Tables we present the relationship among average FDI inflow to the sample
countries during 2005–2007 and the possible influential variables. Table 3 presents the
coefficient of correlation between the inflow of FDI to the sample countries and GDP, GDP
growth rate, trade aid industrial value added and the growth rate of industrial value added
during 2005–2007. The p-values of the corresponding correlation coefficients and the number
of observations for each variable are also presented in the Table. The Table also presents
coefficient correlations among the variables. The second column of Table 3 presents the
coefficient of correlations and the corresponding p-values between FDI and variables under
consideration. According to column 2 of Table 3, the relationship between FDI inflow and
GDP, GDP growth rate, trade, aid, industrial value added and its growth rate is positive and
all coefficients are highly statistically significant except but trade. For example, the
coefficient of correlation between FDI inflow and GDP is +0.74 and it is statistically
significant at one percent level. The finding shows that FDI inflow is biased to the economies
with large GDP. Similarly, FDI inflow is also biased to the economies with high GDP growth
Determinants of Foreign Direct Investment in Developing Countries
ASARC WP 2010/13 11
rates, receives more aid and with higher industrial value added to GDP. The coefficient of
correlation between FDI inflow and trade is positive, but statistically insignificant. Although
it is difficult to explain, probably it might be the case that Table 3 simply presents the one to
one relationship between FDI and other variables without considering the effect of other
variables. The findings in Table 3, thus provides partial supports to Hypothesis -1 that is size
of the host economy and its growth potential positively affect the inflow of FDI.
Table 3: Relationship between FDI inflow and the Size of the Host Economy and its Linkage/ Openness
with the Global Market during 2005-2007
FDI GDP GDP growth rate Trade Aid
Industrial value added
Growth rate of Industrial value
added FDI 1.00
[204] GDP 0.74 1.00
(0.00) 200 [200]
GDP growth rate 0.25 (0.00) [204]
0.11 (0.12) [200]
1.00 [204]
Trade 0.04 0.13 0.03 1.00 (0.61) (0.06) (0.69) [193] [193] [189] [193]
Aid 0.23 0.33 0.05 0.09 1.00 (0.00) 0.00 (0.45) (0.21) [203] [203] [199] [203] [192]
Industrial value added
0.31*** (0.00) [187]
0.27 (0.00) [183]
0.16 (0.03) [187]
0.27 (0.00) [187]
0.36 (0.00) [186]
1.00 [187]
Growth rate of Industrial value
added
0.16** (0.03) [186]
0.03 (0.65) [182]
0.65*** (0.00) [186]
0.11 (0.15) [181]
0.05 (0.50) [185]
0.12* (0.10) [181]
1.00 [186]
p-values are in the parentheses. *, ** and *** represents the level of significance at 10, 5 and 1 percent levels, respectively
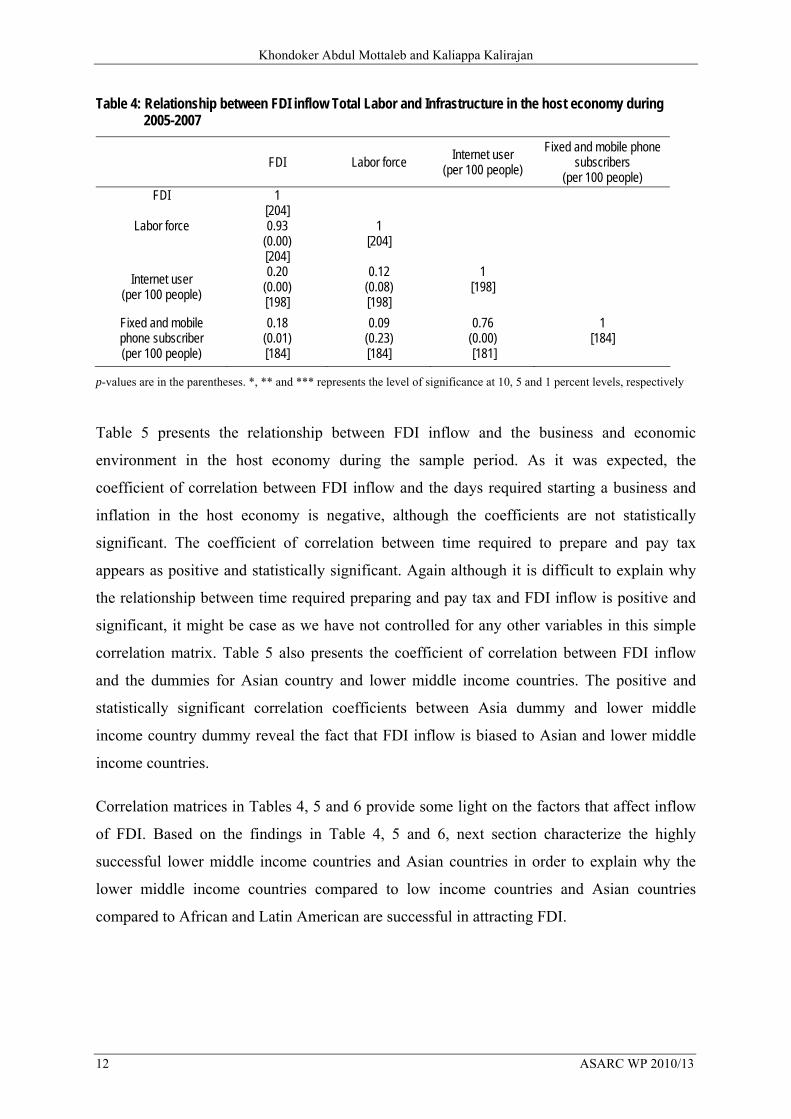
Table 4 presents the relationship between FDI inflow and the total labor force, internet and
phone users during 2005-2007. The second column of Table 4 shows that the coefficients of
correlation between FDI inflows, total labor force, numbers of internet and phone users are
positive and all are statistically significant at one percent level. The findings in Table 4
suggest that FDI inflow is biased to economies with abundant labor force, and with improved
infrastructure and communication systems.
Khondoker Abdul Mottaleb and Kaliappa Kalirajan
12 ASARC WP 2010/13
Table 4: Relationship between FDI inflow Total Labor and Infrastructure in the host economy during 2005-2007
FDI Labor force Internet user (per 100 people)
Fixed and mobile phone subscribers
(per 100 people) FDI
1
[204] Labor force
0.93 (0.00) [204]
1 [204]
Internet user (per 100 people)
0.20 (0.00) [198]
0.12 (0.08) [198]
1 [198]
Fixed and mobile phone subscriber (per 100 people)
0.18 (0.01) [184]
0.09 (0.23) [184]
0.76 (0.00) [181]
1 [184]
p-values are in the parentheses. *, ** and *** represents the level of significance at 10, 5 and 1 percent levels, respectively
Table 5 presents the relationship between FDI inflow and the business and economic
environment in the host economy during the sample period. As it was expected, the
coefficient of correlation between FDI inflow and the days required starting a business and
inflation in the host economy is negative, although the coefficients are not statistically
significant. The coefficient of correlation between time required to prepare and pay tax
appears as positive and statistically significant. Again although it is difficult to explain why
the relationship between time required preparing and pay tax and FDI inflow is positive and
significant, it might be case as we have not controlled for any other variables in this simple
correlation matrix. Table 5 also presents the coefficient of correlation between FDI inflow
and the dummies for Asian country and lower middle income countries. The positive and
statistically significant correlation coefficients between Asia dummy and lower middle
income country dummy reveal the fact that FDI inflow is biased to Asian and lower middle
income countries.
Correlation matrices in Tables 4, 5 and 6 provide some light on the factors that affect inflow
of FDI. Based on the findings in Table 4, 5 and 6, next section characterize the highly
successful lower middle income countries and Asian countries in order to explain why the
lower middle income countries compared to low income countries and Asian countries
compared to African and Latin American are successful in attracting FDI.

Determinants of Foreign Direct Investment in Developing Countries
ASARC WP 2010/13 13
Table 5: Relationship between FDI inflow and the Business and Economic Environment in the Host Economy during 2005-2007
FDI Days required
to start a business
Time to prepare and
pay tax Inflation Asian
countries Lower middle
income countries
FDI 1.00 [204]
Days required to start a business
-0.04 (0.56) [204]
1.00 204
Time to prepare and pay tax
0.37 (0.00) [192]
0.03 (0.71) 192
1.00 192
Inflation -0.06 0.07 0.01 1.00 (0.36) (0.34) (0.86) 204 [204] 204 192
Asian country
0.18 (0.01) [204]
-0.03 (0.64) [204]
-0.09 (0.23) 192
0.03 (0.67) 204
1.00 204
Lower middle income countries
0.14 (0.05) [204]
-0.12 (0.08) [204]
0.05 (0.48) 192
-0.09 (0.19) 204
0.27 (0.00) 204
1.00 204
p-values are in the parentheses. *, ** and *** represents the level of significance at 10, 5 and 1 percent levels, respectively
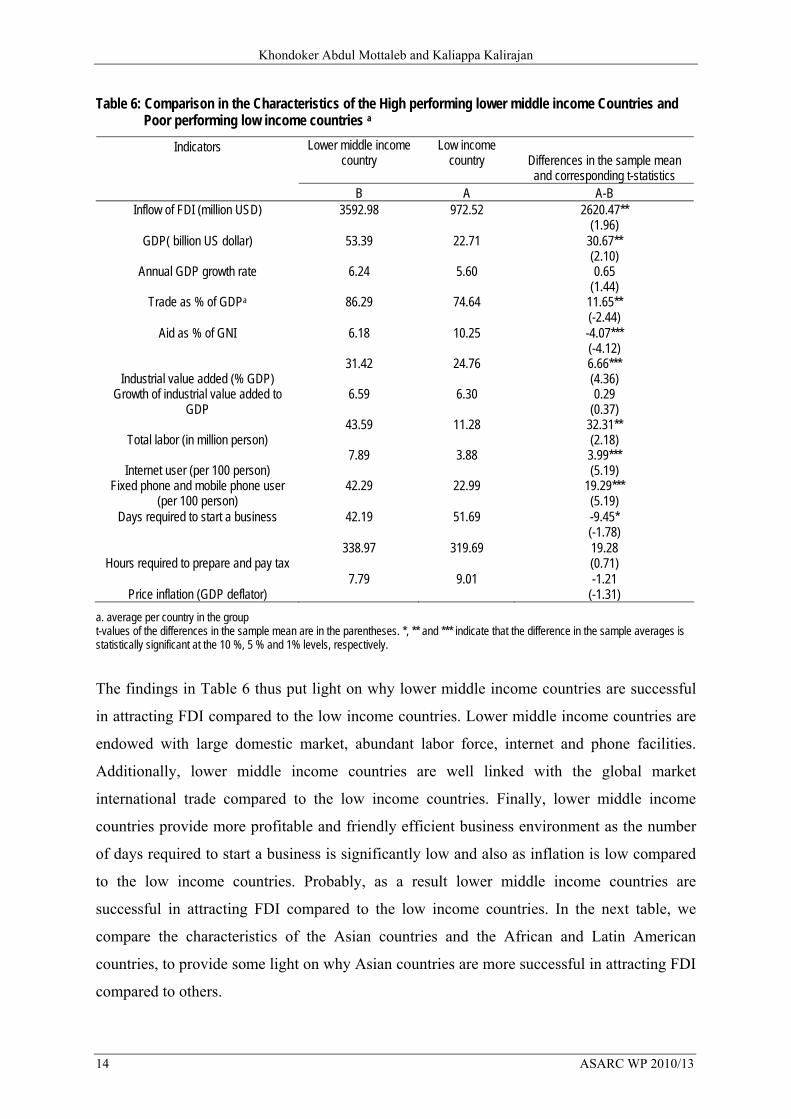
Table 6 presents a comparison in the characteristics of the lower middle income countries and low income countries. The Table shows that average FDI inflow to a low income country during the sample period was only USD 972.52 million, whereas average inflow of FDI to a lower middle income country was USD 3592.98 million during the same period. It means, on average a lower middle country received USD 2620.47 million of FDI more compared to a low income country and the difference is statistically significant at five percent level. Table 6 also shows that the average size of GDP of a low income country is USD 22.71 billon whereas the average GDP size of a lower middle income country is USD 53.39 billion. It means, on average, the GDP size of a lower middle income country is USD 30.67 billion larger compared to a low income country, and the difference is statistically significant at five percent level.
The table also shows that on average, the proportion of trade, industrial value added, total labor force, internet and phone users are significantly large in the case of lower middle income countries compared to the low income countries. Importantly, in the lower middle income countries, average days required to start business and average price inflation are lower compared to the low income countries. For example, on average it requires only 42 days to start a new business in a lower middle income country, whereas in a low income country the average days required to start a new business is more 51 days and the difference is statistically significant at 10 percent level.
Khondoker Abdul Mottaleb and Kaliappa Kalirajan
14 ASARC WP 2010/13
Table 6: Comparison in the Characteristics of the High performing lower middle income Countries and Poor performing low income countries a
Lower middle income country
Low income country
Differences in the sample mean and corresponding t-statistics
Indicators B A A-B
Inflow of FDI (million USD)
3592.98
972.52
2620.47** (1.96)
GDP( billion US dollar)
53.39
22.71
30.67** (2.10)
Annual GDP growth rate
6.24
5.60
0.65 (1.44)
Trade as % of GDPa
86.29
74.64
11.65** (-2.44)
Aid as % of GNI
6.18
10.25
-4.07*** (-4.12)
Industrial value added (% GDP) 31.42
24.76
6.66*** (4.36)
Growth of industrial value added to GDP
6.59
6.30
0.29 (0.37)
Total labor (in million person) 43.59
11.28
32.31** (2.18)
Internet user (per 100 person) 7.89
3.88
3.99*** (5.19)
Fixed phone and mobile phone user (per 100 person)
42.29
22.99
19.29*** (5.19)
Days required to start a business
42.19
51.69
-9.45* (-1.78)
Hours required to prepare and pay tax 338.97
319.69
19.28 (0.71)
Price inflation (GDP deflator) 7.79
9.01
-1.21
(-1.31) a. average per country in the group t-values of the differences in the sample mean are in the parentheses. *, ** and *** indicate that the difference in the sample averages is statistically significant at the 10 %, 5 % and 1% levels, respectively.
The findings in Table 6 thus put light on why lower middle income countries are successful
in attracting FDI compared to the low income countries. Lower middle income countries are
endowed with large domestic market, abundant labor force, internet and phone facilities.
Additionally, lower middle income countries are well linked with the global market
international trade compared to the low income countries. Finally, lower middle income
countries provide more profitable and friendly efficient business environment as the number
of days required to start a business is significantly low and also as inflation is low compared
to the low income countries. Probably, as a result lower middle income countries are
successful in attracting FDI compared to the low income countries. In the next table, we
compare the characteristics of the Asian countries and the African and Latin American
countries, to provide some light on why Asian countries are more successful in attracting FDI
compared to others.

Determinants of Foreign Direct Investment in Developing Countries
ASARC WP 2010/13 15
Table 7 presents the differences in the characteristics of the sample Asian and African and Latin American countries. It is already mentioned that Asian countries are highly successful in attracting FDI compared to others. The Table shows on average an Asian country receives USD 4607.45 million FDI during the sample period, whereas on average an African or Latin American country receives only USD 1114.00 million FDI during the sample period. It means, on average an Asian country received USD 3493.45 million FDI more than an African and Latin American country and the difference is statistically significant at five percent level. In the next subsequent rows Table 7 depicts the fact that Asian countries are characterized by large domestic market with high GDP growth rate and well linked with the global market through international trade, endowed with abundant labor force, internet and telephone facilities compared to African and Latin American countries. Asian countries also offer efficient and profitable business environment as is evidenced by the lower days required to start a business and pay tax and low rate of inflation, compared to African and Latin American countries. Probably, as a result Asian countries are successful in attracting FDI compared to African and Latin American countries.
Table 7: A Comparison in the Characteristics of the high Performing Asian and Poor Performing African and Latin American Countries b
Asian countries African and Latin American countries
Differences in the sample mean and corresponding t-statistics Indicators
C D C-D
Inflow of FDI (million USD) 4607.45
1114.00
3493.45** (2.46)
GDP( billion US dollar) 60.71
22.24
33.48** (2.20)
Annual GDP growth rate 7.53
5.03
2.51*** (5.79)
Trade as % of GDPa 87.51
77.09
10.42** (2.11)
Aid as % of GNI 6.67
8.83
-2.16** (-2.05)
Industrial value added (% GDP) 30.19
27.29
2.89* (1.76)
Growth of industrial value added to GDP 8.74 5.02 3.72*** (4.92)
Total labor (in million person) 61.57
9.84
51.73*** (3.43)
Internet user (per 100 person) 7.44
5.23
2.21*** (2.63)
Fixed phone and mobile phone user (per 100 person)
30.62
37.48
6.48* (1.69)
Days required to start a business 44.89
47.47
-2.58 (-0.46)
Hours required to prepare and pay tax 308.76
342.63
-33.87 (-1.21)
Price inflation (GDP deflator) 8.61
8.19
-0.41 (-0.43)
b. average per country in the group t-values of the differences in the sample mean are in the parentheses. *, ** and *** indicate that the difference in the sample averages is statistically significant at the 10 %, 5 % and 1% levels, respectively
Khondoker Abdul Mottaleb and Kaliappa Kalirajan
16 ASARC WP 2010/13
4.0 Model Specification and Estimation 4.1 Model Specification Findings in Table 3 to 7 provide strong supports to Hypotheses that we developed in the
previous section that countries with large domestic market, well linked with the global market
through international trade, high GDP growth rate, and offer profitable and business friendly
environment to the foreign investors, tend to be successful in attracting FDI. To rigorously
assess the effects GDP size and growth, trade and other variable in determining the inflow of
FDI, it is necessary to control for the effects of the other variables. This section is devoted to
develop an empirical model to identify the factors that affect the inflow of FDI to developing
countries. To confront all of the hypotheses econometrically; the following model will be
estimated:
FDIit = λ0 + λ1Xit+λ2F it+λ3Z it+ ΣθiY it +λ4Vi++λ5U i+ζit---------------- (4) Where FDI indicates inflow of foreign direct investment in country i at year t, Xit is a matrix
including the economic characteristics of the host economy, such as GDP and its growth rate,
trade, aid, industrial value added and its growth rate of country i at year t. Fit is matrix of
variables that includes labor endowment and physical infrastructure, such as total labor force,
numbers of internet and phone users in host country i at time t. Z it is a matrix of variables that
presents the business environment in the host economy. The matrix includes days required to
start a business, hours required to prepare and pay tax and inflation measured by GDP
deflator in host economy i at time t. Yit includes three year dummies to control for year
specific effects (if any) and Vi and U i are the time invariant fixed-effect at income level and
location level of the host country. ζ is the error term with white-noise properties and λ0 is a
scalar parameter λ1------λ5 are the parameters of interest.
Application of simple pooled OLS estimation method might provide biased estimators,
because of the unobserved heterogeneity (if any) in the sample countries. Therefore,
appropriate estimation technique (either fixed or random effect estimator) will be used to
estimate equation (4). Importantly, FDI determinants could vary across income groups and
continents (e.g., Kinda, 2010) and thus the estimated functions might suffer from the problem
of parameter heterogeneity. To avoid the problem of parameter heterogeneity in the estimated
functions we estimate equation (4) separately for lower middle income, low income countries
and for Asian and African and Latin American countries. Finally, to check the robustness of

Determinants of Foreign Direct Investment in Developing Countries
ASARC WP 2010/13 17
the findings, we perform sensitivity analyses by excluding additional insignificant control
variables step by step from the estimated models.
Table 8, 9. 10, 11 and 12 presents the estimated regression equations that explain the inflow
of FDI to the lower middle income countries, low income countries, Asian countries, and
African and Latin American countries and for the all sample developing countries. We
estimate regression equation (4) separately for low income and lower middle income
countries and for Asian and African and Latin American countries separately with the same
explanatory variables. Inclusion of the same explanatory variables allows us to compare both
size of the coefficient and their level of significance across estimated equations. Random
Effect Generalized Least Square estimation process with clustered standard error corrected at
the country level has been applied to estimate equation (4) as the Hausman test suggests so.
Finally, we also estimate equation (4) after pooling the data across countries and income
groups as Chow-test suggests so.
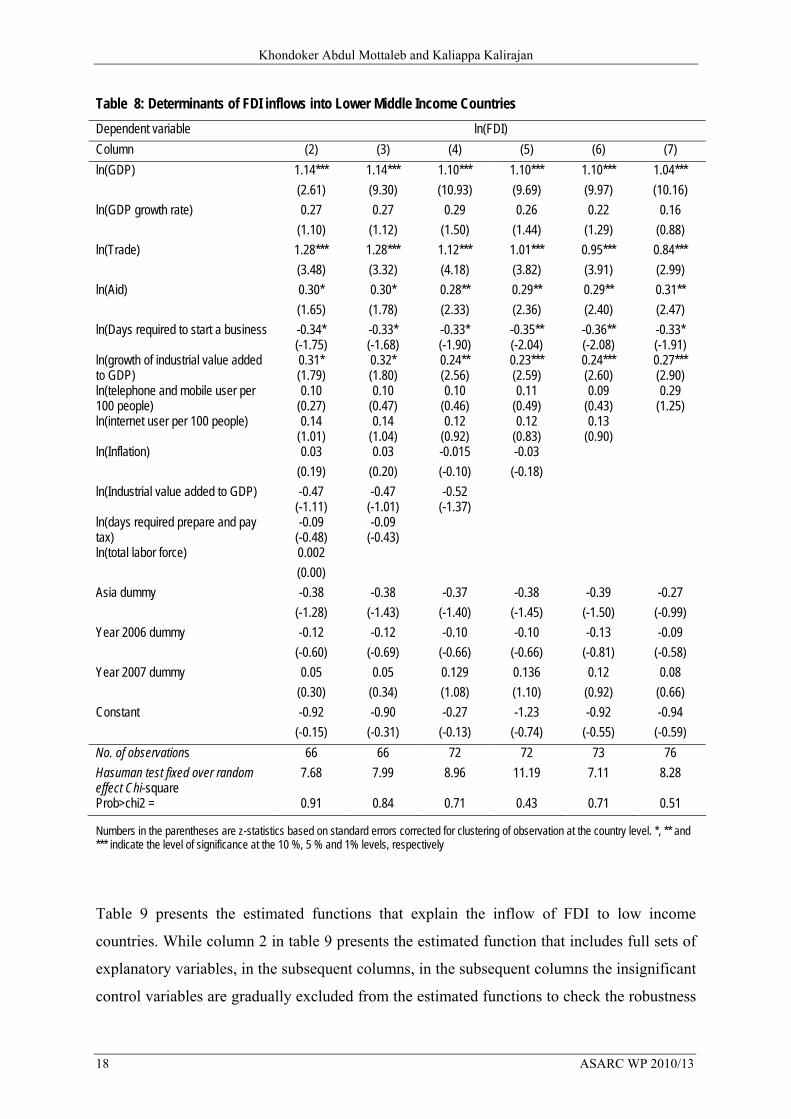
4.2 Estimation Results Table 8 presents the estimated functions explaining inflow of FDI to lower middle income
countries. While column 2 in table 8 presents the estimated function that includes full sets of
explanatory variables, in the subsequent columns, we gradually exclude insignificant control
variables from the estimated functions to check the robustness of the findings. It shows that
the size of the GDP, trade, aid and the growth rate of industrial value added positively and
significantly affect the inflow of FDI to lower middle income countries and the finding is
robust. It supports the theory that market seeking and horizontal FDI are attracted by the size
of the host economy, its growth potential and openness to the global market. Column 7 of
table 8 shows that a one percent increase in GDP size on average increases the inflow of FDI
to a lower middle income country by 1.04 percent, and a one percent increase in trade
increases FDI inflow by 0.84 percent. Importantly, the coefficient of the variable days
required to start a business is negative and statistically significant at 10 percent level.
According to column 7 in table 8, a one percent increase in the days required to start a
business in a host economy (for any reason), reduces inflow of FDI by 0.33 percent. The
finding supports the widely recognized view that in general FDI is affected by the investment
environment of the host economy (e.g., Kinda, 2010). Thus, countries with unfavorable
business environment and with stringent rules and regulation, such as low income countries
and African countries in general, are less successful in attracting FDI.
Khondoker Abdul Mottaleb and Kaliappa Kalirajan
18 ASARC WP 2010/13
Table 8: Determinants of FDI inflows into Lower Middle Income Countries Dependent variable ln(FDI) Column (2) (3) (4) (5) (6) (7) ln(GDP) 1.14*** 1.14*** 1.10*** 1.10*** 1.10*** 1.04*** (2.61) (9.30) (10.93) (9.69) (9.97) (10.16) ln(GDP growth rate) 0.27 0.27 0.29 0.26 0.22 0.16 (1.10) (1.12) (1.50) (1.44) (1.29) (0.88) ln(Trade) 1.28*** 1.28*** 1.12*** 1.01*** 0.95*** 0.84*** (3.48) (3.32) (4.18) (3.82) (3.91) (2.99) ln(Aid) 0.30* 0.30* 0.28** 0.29** 0.29** 0.31** (1.65) (1.78) (2.33) (2.36) (2.40) (2.47) ln(Days required to start a business -0.34*
(-1.75) -0.33* (-1.68)
-0.33* (-1.90)
-0.35** (-2.04)
-0.36** (-2.08)
-0.33* (-1.91)
ln(growth of industrial value added to GDP)
0.31* (1.79)
0.32* (1.80)
0.24** (2.56)
0.23*** (2.59)
0.24*** (2.60)
0.27*** (2.90)
ln(telephone and mobile user per 100 people)
0.10 (0.27)
0.10 (0.47)
0.10 (0.46)
0.11 (0.49)
0.09 (0.43)
0.29 (1.25)
ln(internet user per 100 people) 0.14 (1.01)
0.14 (1.04)
0.12 (0.92)
0.12 (0.83)
0.13 (0.90)
ln(Inflation) 0.03 0.03 -0.015 -0.03 (0.19) (0.20) (-0.10) (-0.18) ln(Industrial value added to GDP) -0.47
(-1.11) -0.47
(-1.01) -0.52
(-1.37)
ln(days required prepare and pay tax)
-0.09 (-0.48)
-0.09 (-0.43)
ln(total labor force) 0.002 (0.00) Asia dummy -0.38 -0.38 -0.37 -0.38 -0.39 -0.27 (-1.28) (-1.43) (-1.40) (-1.45) (-1.50) (-0.99) Year 2006 dummy -0.12 -0.12 -0.10 -0.10 -0.13 -0.09 (-0.60) (-0.69) (-0.66) (-0.66) (-0.81) (-0.58) Year 2007 dummy 0.05 0.05 0.129 0.136 0.12 0.08 (0.30) (0.34) (1.08) (1.10) (0.92) (0.66) Constant -0.92 -0.90 -0.27 -1.23 -0.92 -0.94 (-0.15) (-0.31) (-0.13) (-0.74) (-0.55) (-0.59) No. of observations 66 66 72 72 73 76 Hasuman test fixed over random effect Chi-square
7.68 7.99 8.96 11.19 7.11 8.28
Prob>chi2 = 0.91 0.84 0.71 0.43 0.71 0.51
Numbers in the parentheses are z-statistics based on standard errors corrected for clustering of observation at the country level. *, ** and *** indicate the level of significance at the 10 %, 5 % and 1% levels, respectively
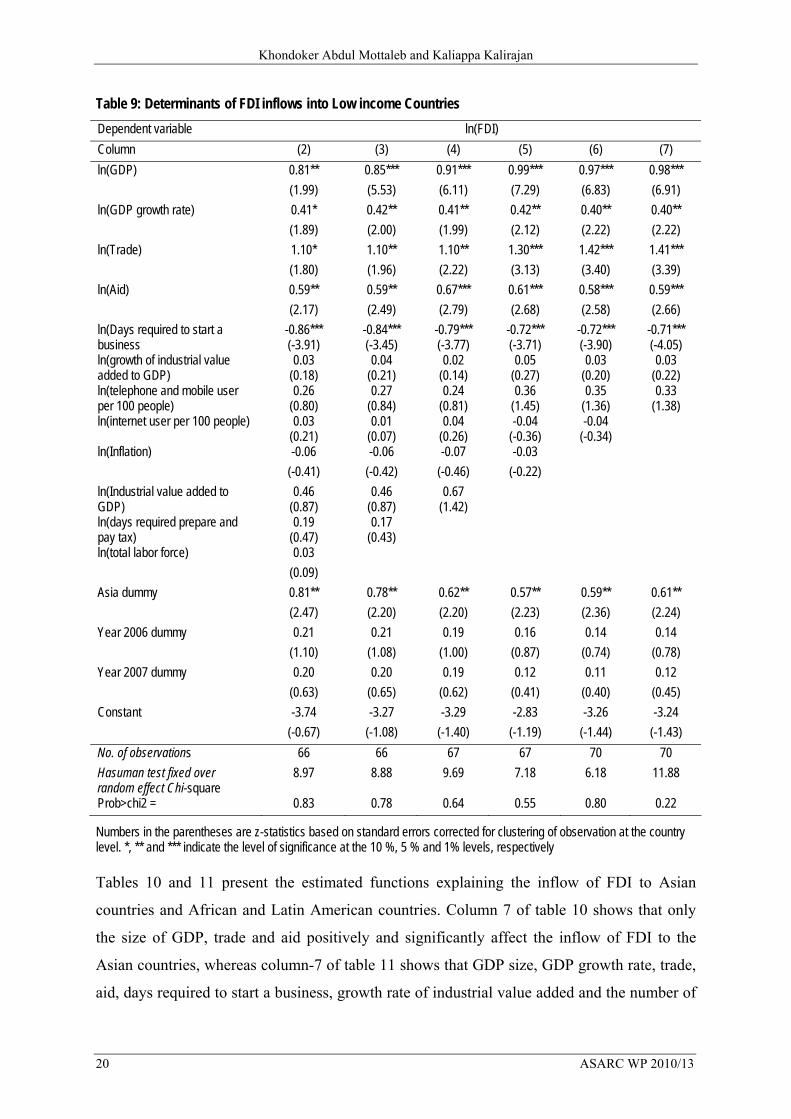
Table 9 presents the estimated functions that explain the inflow of FDI to low income
countries. While column 2 in table 9 presents the estimated function that includes full sets of
explanatory variables, in the subsequent columns, in the subsequent columns the insignificant
control variables are gradually excluded from the estimated functions to check the robustness

Determinants of Foreign Direct Investment in Developing Countries
ASARC WP 2010/13 19
of the findings. Qualitatively, the findings in table 9 that presents the estimated functions
explaining inflow of FDI to developing countries are the same to the findings in table 8. It
shows that the coefficients of the variables GDP, trade, aid and days required to start a
business are significant across the estimated functions both in table 8 and in table 9. For
example, the last column of table 9 shows that on average, a one percent increase in the GDP
size increases the inflow of FDI to a low country by 0.98 percent, and a one percent increase
in trade increases FDI inflow by 1.41 percent. Additionally, table 9 shows that GDP growth
rate has significant positive influence on the inflow of FDI to low income countries, which is
insignificant in the case of lower middle income countries. The findings is plausible in the
sense that low income countries are mostly tend to have small domestic economy compared
to the lower middle income countries. Foreign investors thus, besides considering the size of
the economy also give more priority to the growth potentials of the economy in the case of
low income countries.
Important noticeable differences in the findings between colum-7 of table 8 and 9 are that
both size and the significance level of coefficients of trade, aid and the days required to start a
business in the case of the function explaining inflow of FDI to low income countries are
high compared to the estimated functions explaining FDI inflow to lower middle income
countries. It means low income countries can also attract substantial amount of FDI by
adopting more outward oriented trade regime and by improving business environment
compared to the lower middle income countries. Among other variables, the dummy for
Asian countries is positive and significant in all of the estimated functions explaining inflow
of FDI to low income countries in table 9. It means, even among the low income countries,
Asian countries are highly preferred by the foreign investors probably because of their
average large size and more openness to the global market through international trade.
Khondoker Abdul Mottaleb and Kaliappa Kalirajan
20 ASARC WP 2010/13
Table 9: Determinants of FDI inflows into Low income Countries Dependent variable ln(FDI) Column (2) (3) (4) (5) (6) (7) ln(GDP) 0.81** 0.85*** 0.91*** 0.99*** 0.97*** 0.98*** (1.99) (5.53) (6.11) (7.29) (6.83) (6.91) ln(GDP growth rate) 0.41* 0.42** 0.41** 0.42** 0.40** 0.40** (1.89) (2.00) (1.99) (2.12) (2.22) (2.22) ln(Trade) 1.10* 1.10** 1.10** 1.30*** 1.42*** 1.41*** (1.80) (1.96) (2.22) (3.13) (3.40) (3.39) ln(Aid) 0.59** 0.59** 0.67*** 0.61*** 0.58*** 0.59*** (2.17) (2.49) (2.79) (2.68) (2.58) (2.66) ln(Days required to start a business
-0.86*** (-3.91)
-0.84*** (-3.45)
-0.79*** (-3.77)
-0.72*** (-3.71)
-0.72*** (-3.90)
-0.71*** (-4.05)
ln(growth of industrial value added to GDP)
0.03 (0.18)
0.04 (0.21)
0.02 (0.14)
0.05 (0.27)
0.03 (0.20)
0.03 (0.22)
ln(telephone and mobile user per 100 people)
0.26 (0.80)
0.27 (0.84)
0.24 (0.81)
0.36 (1.45)
0.35 (1.36)
0.33 (1.38)
ln(internet user per 100 people) 0.03 (0.21)
0.01 (0.07)
0.04 (0.26)
-0.04 (-0.36)
-0.04 (-0.34)
ln(Inflation) -0.06 -0.06 -0.07 -0.03 (-0.41) (-0.42) (-0.46) (-0.22) ln(Industrial value added to GDP)
0.46 (0.87)
0.46 (0.87)
0.67 (1.42)
ln(days required prepare and pay tax)
0.19 (0.47)
0.17 (0.43)
ln(total labor force) 0.03 (0.09) Asia dummy 0.81** 0.78** 0.62** 0.57** 0.59** 0.61** (2.47) (2.20) (2.20) (2.23) (2.36) (2.24) Year 2006 dummy 0.21 0.21 0.19 0.16 0.14 0.14 (1.10) (1.08) (1.00) (0.87) (0.74) (0.78) Year 2007 dummy 0.20 0.20 0.19 0.12 0.11 0.12 (0.63) (0.65) (0.62) (0.41) (0.40) (0.45) Constant -3.74 -3.27 -3.29 -2.83 -3.26 -3.24 (-0.67) (-1.08) (-1.40) (-1.19) (-1.44) (-1.43) No. of observations 66 66 67 67 70 70 Hasuman test fixed over random effect Chi-square
8.97 8.88 9.69 7.18 6.18 11.88
Prob>chi2 = 0.83 0.78 0.64 0.55 0.80 0.22
Numbers in the parentheses are z-statistics based on standard errors corrected for clustering of observation at the country level. *, ** and *** indicate the level of significance at the 10 %, 5 % and 1% levels, respectively Tables 10 and 11 present the estimated functions explaining the inflow of FDI to Asian
countries and African and Latin American countries. Column 7 of table 10 shows that only
the size of GDP, trade and aid positively and significantly affect the inflow of FDI to the
Asian countries, whereas column-7 of table 11 shows that GDP size, GDP growth rate, trade,
aid, days required to start a business, growth rate of industrial value added and the number of

Determinants of Foreign Direct Investment in Developing Countries
ASARC WP 2010/13 21
telephone and mobile phone users per 100 people significantly affect inflow of FDI to
African and Latin American Countries. Importantly, the size and the level of significance of
the variables trade and aid are different across the continents. Column 7 in Table 10 and 11
shows that the role of foreign aid in attracting FDI is high in the case of Asian countries
compared to African and Latin American countries, where the role of trade in attracting FDI
is high in the case of African and Latin American countries compared to Asian countries.
Table 10: Determinants of FDI inflows into Asian Countries
Dependent variable Ln(FDI) Column (2) (3) (4) (5) (6) (7)
ln(GDP) 1.72*** (3.76)
1.58*** (10.08)
1.28*** (8.49)
1.23*** (8.47)
1.25*** (8.72)
1.22*** (8.55)
ln(GDP growth rate) 0.01 (0.03)
0.04 (0.14)
0.14 (0.39)
0.15 (0.44)
0.20 (0.63)
0.13 (0.40)
ln(Trade) 2.17*** (3.77)
2.10*** (4.04)
1.31*** (3.05)
1.19*** (2.85)
1.12*** (2.77)
0.99** (2.29)
ln(Aid) 0.81*** (3.92)
0.79*** (4.22)
0.52** (2.51)
0.51** (2.36)
0.54*** (2.62)
0.56*** (2.75)
ln(Days required to start a business -0.27 (-1.07)
-0.26 (-1.05)
-0.35 (-1.37)
-0.38 (-1.38)
-0.38 (-1.39)
-0.36 (-1.45)
ln(growth of industrial value added to GDP)
0.34* (1.68)
0.33 (1.48)
0.26 (1.11)
0.21 (0.94)
0.17 (0.67)
0.21 (0.94)
ln(telephone and mobile user per 100 people)
-0.19 (-0.49)
-0.13 (-0.41)
0.09 (0.28)
0.05 (0.17)
0.08 (0.26)
0.29 (0.98)
ln(internet user per 100 people) 0.19* (1.69)
0.22** (2.32)
0.09 (0.77)
0.11 (0.94)
0.13 (1.07)
ln(Inflation) 0.16 (1.12)
0.13 (1.00)
0.19 (1.39)
0.16 (1.24)
ln(Industrial value added to GDP) -0.80** (-2.33)
-0.76** (-2.13)
-0.41 (-1.26)
ln(days required prepare and pay tax) 0.40 (1.28)
0.36 (1.40)
ln(total labor force) -0.12 (-0.36)
Lower middle income country dummy 0.12 (0.32)
0.10 (0.28)
-0.08 (-0.19)
-0.19 (-0.50)
-0.22 (-0.59)
-0.06 (-0.17)
Year 2006 dummy 0.14 (0.53)
0.12 (0.51)
0.07 (0.34)
0.08 (0.35)
0.08 (0.38)
0.12 (0.52)
Year 2007 dummy 0.42 (1.63)
0.38 (1.58)
0.30 (1.35)
0.31 (1.42)
0.30 (1.47)
0.26 (1.36)
Constant -6.26 (-1.28)
-4.28 (-1.33)
-2.22 (-1.23)
-2.10 (-1.12)
-2.38 (-1.01)
-4.40 (-1.13)
No. of observations 52 52 55 55 55 57 Hasuman test fixed over random effect Chi-square 8.17 8.98 8.18 8.75 4.53 4.46
Prob>chi2 = 0.88 0.77 0.77 0.65 0.92 0.88
Numbers in the parentheses are z-statistics based on standard errors corrected for clustering of observation at the country level. *, ** and *** indicate the level of significance at the 10%, 5% and 1% levels, respectively

Khondoker Abdul Mottaleb and Kaliappa Kalirajan
22 ASARC WP 2010/13
Table 11: Determinants of FDI inflows into African and Latin American Countries Dependent variable ln(FDI) Column (2) (3) (4) (5) (6) (7) Ln(GDP) 0.77*** 0.84*** 0.89*** 0.94*** 0.90*** 0.90*** (2.58) (5.96) (6.43) (7.48) (6.77) (6.85) Ln(GDP growth rate) 0.37** 0.37** 0.35** 0.37** 0.34** 0.32** (2.18) (2.23) (2.30) (2.50) (2.34) (2.33) Ln(Trade) 1.04** 1.05** 1.16*** 1.25*** 1.19*** 1.20*** (2.44) (2.47) (2.99) (3.36) (3.41) (3.34) Ln(Aid) 0.25* 0.26** 0.30** 0.29** 0.31** 0.30** (1.73) (1.97) (2.25) (2.21) (2.33) (2.27) Ln(Days required to start a business -0.53***
(-3.12) -0.52*** (-3.04)
-0.52*** (-3.02)
-0.50*** (-3.00)
-0.56*** (-3.67)
-0.56*** (-3.69)
Ln(growth of industrial value added to GDP)
0.09 (0.70)
0.09 (0.73)
0.12 (1.61)
0.12* (1.70)
0.12* (1.72)
0.12* (1.75)
Ln(telephone and mobile user per 100 people)
0.33 (0.98)
0.31 (1.07)
0.25 (0.99)
0.31 (1.41)
0.31 (1.44)
0.32* (1.77)
Ln(internet user per 100 people) -0.02 (-0.11)
-0.03 (-0.18)
-0.001 (-0.01)
-0.03 (-0.22)
0.02 (0.13)
Ln(Inflation) -0.20 -0.19 -0.18 -0.15 (-1.52) (-1.52) (-1.63) (-1.29) Ln(Industrial value added to GDP) 0.24
(0.38) 0.24
(0.38) 0.43
(0.88)
Ln(days required prepare and pay tax)
0.08 (0.29)
0.09 (0.32)
Ln(total labor force) 0.06 (0.21) Lower middle income country dummy 0.80***
(3.11) 0.78*** (2.98)
0.62** (2.51)
0.66*** (2.66)
0.74*** (3.12)
0.73*** (3.18)
Year 2006 dummy 0.04 0.05 0.04 0.02 -0.03 -0.02 (0.27) (0.32) (0.26) (0.16) (-0.20) (-0.18) Year 2007 dummy 0.09 0.10 0.08 0.05 -0.02 -0.04 (0.29) (0.37) (0.34) (0.20) (-0.10) (-0.19) Constant -3.18 -2.33 -2.90 -2.34 -2.09 -2.12 (-0.70) (-0.94) (-1.31) (-1.10) (-1.05) (-1.07) No. of observations 80 80 84 84 88 89 Hasuman test fixed over random effect Chi-square
7.96 7.77 8.78 5.30 6.27 5.60
Prob>chi2 = 0.89 0.89 0.72 0.92 0.79 0.78
Numbers in the parentheses are z-statistics based on standard errors corrected for clustering of observation at the country level. *, ** and *** indicate the level of significance at the 10 %, 5 % and 1% levels, respectively
A comparison in the determinants of FDI inflow to Asian countries and African and Latin
American countries reveal the fact that while days required starting a business is significant
and negative in determining FDI inflow to African and Latin American countries, the variable
is negative but insignificant in determining FDI inflow to Asian countries. Additionally, the
number of telephone users is positive and statistically significant at 10 percent level in the
case of estimated function explaining the inflow of FDI to African and Latin American
countries, while the variable is positive but insignificant in the case of estimated functions
explaining inflow of FDI to Asian countries. The findings in Table 11 thus reinvigorate the

Determinants of Foreign Direct Investment in Developing Countries
ASARC WP 2010/13 23
role of business environment and infrastructure for the African and Latin American countries
in attracting FDI.
Table 12 presents estimated functions explaining FDI inflow to all of the sample developing
countries. The data across continents and income groups are pooled in the model as Chow-
test suggests so. Similar to the previous findings, the estimated function explaining the inflow
of FDI to sample developing countries suggest that GDP size and its growth rate, trade, aid,
days required to start a business, growth rate of industrial value added and number telephone
users significantly affect the inflow of FDI to developing countries. Column 7 in Table 12
shows that one percent increase in GDP growth rate increases FDI inflow to a developing
country on average by 0.29 percent and a one day decrease in the days required starting a
business increases FDI inflow to a developing country on average by 0.39 percent. It is
important to mention here is that the coefficient of GDP ranges between 1.01 at the lowest
and 1.10 at the highest across the estimated function explaining inflow of FDI to developing
countries and the level of significance is the same. Similarly, the absolute size of the
coefficient and the significance levels of the variables trade, aid and days required to start a
new business are almost similar across the estimated functions explaining inflow of FDI to
developing countries. Most importantly, the size of the coefficient and the level of significant
of the variable days required to start a business is the same across the estimated functions in
Table 12. Thus, the findings are robust across the estimated equations explaining inflow of
FDI to developing countries. The findings that GDP and its growth rate positively affect the inflow of FDI to developing
countries supports the findings by Nunnenkamp and Spatz (2002), Torrisi (1985), Schneider
and Frey (1985), and Jun and Singh (1996). Similar to the findings of Daude and Stein
(2007) and Disdier and Mayer (2004), our study also confirms the fact that the business
environment in the developing countries the proxy of which was the days required to start a
business, significantly affect the inflow of FDI to developing countries. Importantly, our
study clearly shows that foreign aid significantly and positively affects inflow of FDI to
developing countries and the finding is robust. The finding supports the finding of Kimura
and Todo (2010) who using disaggregated data show that Japanese aid enhances FDI inflow
to the aid receiving countries.

Khondoker Abdul Mottaleb and Kaliappa Kalirajan
24 ASARC WP 2010/13
Table 12: Determinants of FDI inflows into Developing Countries Dependent variable ln(FDI) Column (2) (3) (4) (5) (6) (7)
1.01*** 1.05*** 1.10*** 1.05*** 1.04*** 1.04*** ln(GDP) (3.78) (10.17) (11.53) (12.31) (11.62) (11.36) 0.36*** 0.35*** 0.35*** 0.35*** 0.31*** 0.29** ln(GDP growth rate) (2.66) (2.72) (2.79) (2.83) (2.58) (2.45) 1.10*** 1.11*** 1.11*** 1.10*** 1.10*** 1.07*** ln(Trade) (3.76) (3.78) (4.60) (4.41) (4.54) (4.27) 0.34*** 0.34*** 0.35*** 0.35*** 0.35*** 0.36*** ln(Aid) (2.80) (3.01) (3.43) (3.45) (3.40) (3.39)
ln(Days required to start a business -0.39*** (-3.28)
-0.38*** (-3.15)
-0.39*** (-3.28)
-0.39*** (-3.30)
-0.39*** (-3.36)
-0.39*** (-3.43)
ln(growth of industrial value added to GDP)
0.18 (1.54)
0.18 (1.55)
0.16** (2.00)
0.16** (2.07)
0.16** (2.05)
0.17** (2.15)
ln(telephone and mobile user per 100 people)
0.31 (1.41)
0.30 (1.57)
0.28 (1.54)
0.27* (1.64)
0.26 (1.55)
0.28** (1.97)
ln(internet user per 100 people) -0.02 (-0.16)
-0.03 (-0.23)
-0.02 (-0.17)
-0.02 (-0.15)
-0.002 (-0.03)
ln(Inflation) -0.06 -0.06 -0.06 -0.07 (-0.57) (-0.57) (-0.63) (-0.68) ln(Industrial value added to GDP) -0.02
(-0.07) -0.03
(-0.10) -0.07
(-0.23)
ln(days required prepare and pay tax) -0.14 (-0.71)
-0.13 (-0.68)
ln(total labor force) 0.04 (0.16) Asia dummy 0.03 0.03 0.03 0.03 0.03 0.05 (0.12) (0.14) (0.16) (0.16) (0.14) (0.27) Lower middle income country dummy 0.40*
(1.74) 0.39* (1.68)
0.35 (1.59)
0.34 (1.56)
0.38* (1.73)
0.38* (1.84)
Year 2006 dummy 0.08 0.08 0.07 0.08 0.05 0.06 (0.55) (0.63) (0.60) (0.63) (0.43) (0.56) Year 2007 dummy 0.11 0.12 0.14 0.15 0.13 0.11 (0.57) (0.70) (0.96) (1.02) (0.92) (0.83) Constant -2.28 -1.77 -2.31 -2.39 -2.46* -2.43* (-0.63) (-0.90) (-1.49) (-1.62) (-1.71) (-1.69) No. of observations 132 132 139 139 143 146 Chow test for structural difference between low income and lower middle income countries (15, 115)
2.08
Chow test Asia Vs Africa (15 , 115) 1.98 Hasuman test fixed over random effect Chi Prob>chi2 =
8.52 0.86
8.39 0.82
8.12 0.89
6.31 0.85
6.84 0.74
5.53 0.79
Numbers in the parentheses are z-statistics based on standard errors corrected for clustering of observation at the country level. *, ** and *** indicate the level of significance at the 10 %, 5 % and 1% levels, respectively
It is important to mention here is that the variables, such as inflation, industrial value added,
hours required preparing and pay tax and total labor and are found insignificant across the
estimated functions explaining inflow of FDI to developing countries. One of such reasons
might be the high multicollinerity among the variables. For example, the coefficient of
correlation between GDP growth rate and growth rate of industrial value added is +0.65 and
Determinants of Foreign Direct Investment in Developing Countries
ASARC WP 2010/13 25
it is statistically significant. A few earlier studies however argued that only the availability of
cheap labor night not be the essential factor in attracting FDI, rather the business is the
environment are more important in attracting FDI (Kinda, 2010).
5.0 Conclusion and Policy Implication By bridging the gap between domestic savings and investment and by enhancing knowledge
spillover, FDI can play important role in industrial advancement and economic growth in the
developing countries. Although most of the developing countries have been taking measures
to attract FDI, such as by offering incentive packages and liberalizing the trade regimes, only
a few, mostly lower middle income countries and Asian countries with large domestic market
are successful in attracting FDI. In this study, we tried to find out the influential factors that
determine the FDI inflow to the low income and lower middle income countries and Asian
and African and Latin American countries. To find out the influential factors, firstly we
examine the simple correlation coefficient between FDI inflow and the seemingly influential
variables and secondly, we compare the characteristics between lower middle income
countries and low income countries and Asian and African and Latin American countries. We
found that in general lower middle income countries and Asian countries are highly
successful in attracting FDI compared to low income and African and Latin American
countries. Our findings show that most of the lower middle income countries and Asian
countries, besides their large domes market, highly linked with the global market through
international trade and offer more business friendly environment to the investors. Finally, in
the estimated empirical model it is also found that besides GDP size and its growth rate,
linkage with the global market through international trade, relationship with the major donor
countries in the form of foreign aid and business friendly environment measured by the days
required to start a business are the most important and significant factors in determining FDI
inflow to the developing countries. Interestingly, our finding reinvigorates the positive role of
foreign aid to developing countries in attracting FDI. The findings are robust across the
countries and income groups. Thus, the paper concludes that small developing countries
across the globe can attract substantial amount of FDI just by adopting more outward oriented
trade policy and by providing more business friendly environment to the foreign investors.

Khondoker Abdul Mottaleb and Kaliappa Kalirajan
26 ASARC WP 2010/13
Reference Athukorala, Prema-Chandra, 2009. “Trends and Patters of Foreign Direct Investment in Asia: A
Comparative Perspective.” Margin-The Journal of Applied Economic Research. Vol. 3, No. 4: 365-408.
Bandera, V.N. and, J.T. White, 1968. “US Direct Investment and Domestic Markets in Europe.” Economia Internationale. Vol., 21:117-233.
Crespo, Nuno and Maria Paula Fontoura, 2007. “Determinant Factors of FDI Spillovers- What do We Really Know?” World Development, Vol. 35, No. 3: 410-425.
Daude, C. and Stein, E. 2007. “The quality of Institutions and Foreign Direct Investment.” Economics and Politics. Vol. 51, No.2: 379-400.
Disdier, A. C. and Mayer, T. 2004. “How difference is the Eastern Europe? Structure and Determinants of Location Choice by French Firms in Easter and Western Europe.” Journal of Comparative Economics. Vol., 32, No. 2: 280-296.
Jun, Kwang W. and Harinder Sing, 1996. “The Determinants of Foreign Direct Investment in Developing Countries.” Transnational Corporations, Vol. 5, No.2: 67-105.
Kimura, Hidemi and Todo, Yasuyuki. 2010. “Is Foreign Aid a Vanguard of Foreign Direct Investment? A Gravity-Equation Approach”. World Development. Vol. 38, No. 4: 482-497.
Kinda, Tidiane. 2010. “Investment Climate and FDI in Developing Countries: Firm Level Evidence”. World Development. Vol. 38, No. 4: 498-513
Korbin, S. J., 1978. “ When Does Political Instability Result in Increased Investment Risk?” The Columbia Journal of World Business. Vol. 13: 113-122.
Lim, Ewe-Ghee, 2001. “Determinants of and the Relation Between Foreign Direct Investment and Growth: A Summary of Recent Literature.” Washington D.C., IMF Working Paper No. 175.
Lucas, Robert E.B., 1993. “ On the determinants of direct foreign investment : evidence from east and southeast Asia.” World Development. Vol., 21, No. 3: 391-406
Nunnenkamp, Peter and Julius Spatz, 2002. “Determinants of FDI in Developing Countries: has globalization changed the rules of the game?” Transnational Corporations. Vol. 11, No. 2: 1-34.
Petrochilas, G.A., 1989. Foreign Direct Investment and Development Process. Aldershot: Avebury.
Romer, P, 1993. “Idea Gaps and Object Gaps in Economic Development.” Journal of Monetary Economics.” Vol. 32, No. 3: 543-573.
Root, F. R. and A. A. Ahmed, 1979. “Empirical Determinants of Manufacturing Direct Foreign Investment in Developing Countries.” Economic Development and Cultural Change. Vol. 27: 751-767.
Schmitz, A. and J. Bieri, 1972. “EEC Tariff and US Direct Investment.” European Economic Review. Vol. 3: 259-270.
Schneider, Friedrich and Bruno S. Frey, 1985. “Economic and political determinants of foreign direct investment.” World Development. Vol. 13, No. 2: 161-175.
Torrisi, C.R.,1985. “The Determinants of Direct Investment in a Small LDC.” Journal of Economic Development. Vol. 10: 29-45.
Transparency International, 2009. Transparency International the Annual Corruption Perception Index (On-line: Retrieved on February 10, 2010). Available : http://www.transparency.org/policy_research/surveys_indices/cpi/2009.
Tsai, Pan-Long,1994. “Determinants of foreign direct investment and its impact on economics growth.” Journal of Economic Development. Vol., 19, No. 1:137- 163.
Determinants of Foreign Direct Investment in Developing Countries
ASARC WP 2010/13 27
UNCTAD, 1998. World Investment Report 1998: Trends and Determinants Overview. New York: United Nations.
UNCTAD, 2000. World Investment Report 2000: Cross-Border Mergers and Acquisitions. New York: United Nations Centre on Transnational Corporations.
UNCTAD, 2003. World Investment Report 2003: FDI Policies for Development, National and International Perspective. New York: United Nations.
UNCTAD, 2005. World Investment Report 2007: Transnational Corporations and The Internationalization of R&D. New York: United Nations.
UNCTAD, 2009. World Investment Report 2009: Transnational Corporations, Agricultural Production and Development. New York: United Nations Centre on Transnational Corporations.
Wheeler, David. and Ashoka Mody, 1992. “International Investment Location Decisions, the case of US Firms.” Journal of International Economics. Vol. 33, No. 1 & 2, Pp. 57-76.
World Bank, 1999. Foreign Direct Investment in Bangladesh: Issues of Long-run Sustainability. World Bank, Bangladesh Country Office, Dhaka, Bangladesh
World Bank, 2007. The World Development Indicators 2010, CD-ROM Version. The World Bank, Washington D.C.