determinants of commercialization of smallholder tomato and … · 2016-07-26 · technology, and...
TRANSCRIPT

____________________________________________________________________________________________
*Corresponding author: Email: [email protected];
American Journal of Experimental Agriculture3(3): 606-630, 2013
SCIENCEDOMAIN internationalwww.sciencedomain.org
Determinants of Commercialization ofSmallholder Tomato and Pineapple Farms in
Ghana
Samuel Asuming-Brempong1*, John K. Anarfi2, Samuel Arthur3
and Seth Asante4
1Department of Agricultural Economics and Agribusiness, University of Ghana, Legon,Accra.
2Regional Institute of Population Studies, University of Ghana.3Institute of Professional Studies (IPS), Legon, Accra.
4Department of Agricultural Economics and Agribusiness, University of Ghana. Accra.
Authors’ contributions
This work was carried out through collaboration among all authors. Each author made asignificant contribution to the final document. All authors read and approved the final
manuscript.
Received 22nd December 2012Accepted 5th April 2013
Published 15th May 2013
ABSTRACT
Smallholder commercialisation may be broadly defined as the situation where farmers ofsmall individual and family farms have greater engagement with markets, either for inputs,outputs, or both. A key premise of commercialization as a development strategy is thatmarkets provide increased incomes to households who are able to maximize the returns toland and labor through market opportunities, using earned income for householdconsumption in ways that are more efficient than subsistence production. This studyassesses the characteristics of smallholder farmers in Ghana using tomato and pineappleproduction as a case study; analyses the relationship between commercialization andsmallholder land holdings; assesses the determinants of commercialization of smallholderagriculture, as well as the benefits or otherwise of smallholder farmers fromcommercialization; and discusses how commercialization affects household food securityamong smallholder farmers. Descriptive statistics, correlations and regression analysis areused to describe the characteristics of smallholder farmers and determine the key factors
Research Article

American Journal of Experimental Agriculture, 3(3): 606-630, 2013
607
that influence household decision to undertake commercialization among both tomato andpineapple farmers. Based on the study, it was found that 96.3 percent of the respondentsin the study communities are farmers; and they fall between the ages of 15 and 59 years(91%), which indicates that they are relatively young. The key determinants ofcommercialization among tomato farmers are land productivity and labour productivity.Similarly, the main determinants of commercialization among pineapple smallholderfarmers are land productivity and savings. The study recommends that both public andprivate agencies work should together to facilitate the move of smallholder farmers frommainly subsistence to commercialization because it comes with several benefits, includinghigher household incomes, and improvements in household food security.
Keywords: Smallholder farmer; commercialization; determinants; productivity; income.
1. INTRODUCTION
A large literature exists on commercialisation — broadly defined as having greaterengagement with markets, either for inputs, outputs, or both — of small, family farms. A keypremise of commercialization as a development strategy is that markets provide increasedincomes to households who are able to maximize the returns to land and labor throughmarket opportunities, using earned income for household consumption in ways that are moreefficient than subsistence production [1,2]. Research has shown that smallholder farmerscomprise 85% of the farming population worldwide. The Ministry of Food and Agriculture(MoFA) in Ghana estimates that about 80 percent of the country’s agricultural output comesfrom smallholder farmers. In Kenya for instance, 75 percent of national food needs and rawmaterials are provided by smallholder farmers, yet only 30 percent of them have access tocredit facilities and other services to help them increase productivity. Evidence fromelsewhere in sub-Saharan Africa indicates the key role of cash crops in driving processes ofagricultural intensification and productivity growth through the development of credit facilitiesand input/output markets [3,4,5]. [6] show the importance of institutional arrangements insuch market development and the consequences of cash crop development for non-cashcrop productivity gains.
The term ‘smallholder’ usually has embedded in it the connotation of limited land availability.Others sketch a broader view of ‘resource-poor’ farmers, such as those with limited capital(including animals), fragmented holdings, and limited access to inputs. [7] note that thenumber of animals per farmer or household may be a misleading definition, indicating thatresource-poor livestock keepers are a very diverse group. Ghana’s Poverty and SocialImpact Analysis (PSIA) done in 2004 implicitly makes a similar argument for Ghanaianfarmers, stressing that different resource and risk conditions better define smallholders thana simple measure of landholdings. The PSIA identifies eight major types of risks faced bysmallholders in Ghana, including production risks, credit risks, income risks, labour andhealth risks, nutritional risks, price risks, vulnerability to unethical trading practices, andemployment risks [8]. Others have similarly noted that two farmers with the same farm size,but one producing a high-value crop for the market while the other produces a staple forhome consumption, cannot be meaningfully compared [6].
In more conceptualized terms, however, defining smallholders tend not to be a simpleexercise. While quantitatively precise definitions are elusive, in looking across a variety ofworking definitions for Ghana and elsewhere several key themes may be noted, amongthem are size holding, wealth, market orientation and levels of vulnerability to risk. In

American Journal of Experimental Agriculture, 3(3): 606-630, 2013
608
general, land holding is perhaps the most direct and easily introduced indicator of whosmallholders are. The Ministry of Food and Agriculture [9] maintains that agriculture ispredominantly on a smallholder basis in Ghana, and about 90% of farm holdings are lessthan 2 hectares in size.
2. PROBLEM STATEMENT AND OBJECTIVES
Ghana has an agrarian economy, and the agricultural sector is predominantly rain-fed. As aresult, agricultural production activities have generally been tied to the rainfall patterns fromyear to year. Irrigated agriculture continues to be used in a rather limited way in Ghana. In2009 for example, it was estimated that the total area under irrigation was about 29,804hectares, representing about 0.2% of the total land area; while the area under inland waterswas approximately 1.1 million hectares representing 8% of the land area. Furthermore,fertilizer usage in Ghana averaged about 34,000 mt per annum for the decade, and this wasone of the lowest in Africa. It was also estimated in the 2000/2001 crop year that fertilizeruse was only about 8 kg/ha in Ghana (which has since not changed much), compared to 99kg/ha in Latin American countries, 109 kg/ha in South Asian countries, and 149 kg/ha in Eastand South East Asian countries. Because fertilizer use among farmers in Ghana is ratherminimal, coupled with the low fertility nature of most soils in the country, agriculturalproductivity is generally low. Estimates indicate that among the major crops including cocoa,maize and cassava, average yields are about 30 to 50 percent of achievable yields [9,10].
The agricultural sector in Ghana is made up of five sub-sectors, namely: (1) cocoa (13%), (2)all other crops beside cocoa (64%), (3) livestock (including poultry) (7%), (4) fisheries (5%),and (5) forestry and logging (11%). Most food crop farms are intercropped, and mixedfarming is commonly practiced by smallholders. Mono cropping is mostly associated withcommercial farms. There are some large-scale farms and plantations especially for oil palm,rubber and coconut; and to a lesser extent, maize, rice and pineapples. The traditional slashand burn continue to be predominant, particularly across the southern forest belt where treesand stumps hinder mechanization. The low yields for most crops make it such that food cropfarmers remain among the poorest groups in Ghana. The adoption of improved technologiesamong farmers is still low in Ghana and at different levels across the different sub-sectors,except in the case of commercial farms (including non-traditional export crops).
During the last decade in particular, government efforts to improve the agricultural sector hasfocused primarily on agricultural modernization, which is perceived as a “process oftransforming traditional agriculture into a commercially oriented one” Such a transformationinvolves the use of new technologies and practices that maximise the productivity of bothland and labour, and is environmentally friendly. The agricultural modernization process alsohas implications for the knowledge base of the agents involved, the level of availabletechnology, and the level of infrastructure development as well as the state of serviceinstitutions [8]. Thus, modernizing agriculture in Ghana seems to also suggest the promotionof commercial agriculture particularly among smallholder farmers who tend to be moresubsistence oriented.
In considering the commercialization of smallholder agriculture in Ghana, certain keyquestions become relevant. For example, (a) Under what conditions may small farms becommercialised? (b) To what extent does commercialisation benefit smallholdinghouseholds, and does it improve or worsen food security for the household? (c) What is therelationship between commercialisation and the size of land holdings of smallholder farmers,and does commercialization raise risks in the markets for these farmers? The objective of

American Journal of Experimental Agriculture, 3(3): 606-630, 2013
609
this paper is to address the foregoing questions, among others. In particular, the paperdescribes the characteristics of smallholder farmers using tomato and pineapple productionas a case study; analyses the relationship between commercialization and smallholder landholdings; assesses the determinants of commercialization of smallholder agriculture, as wellas the benefits or otherwise of smallholder farmers from commercialization; and discusseshow commercialization affects household food security among smallholder farmers.
3. STUDY AREAS AND DATA SOURCES
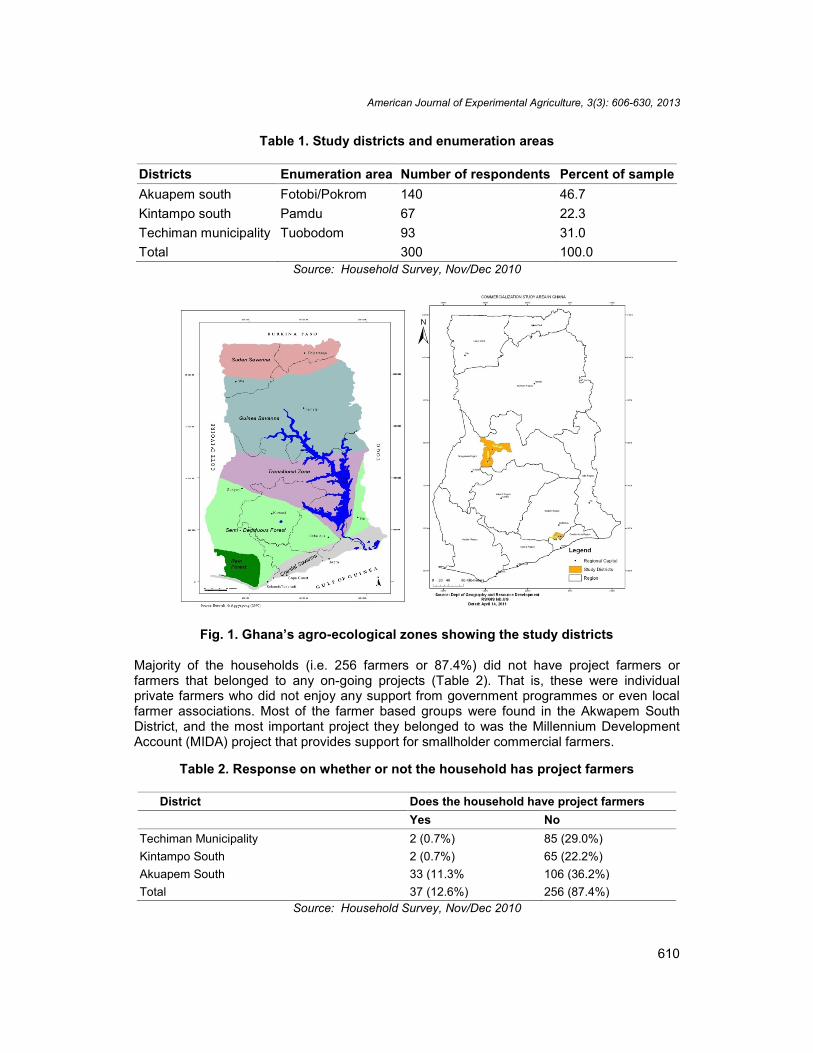
Ghana is located in the middle of the West African sub-region and covers an area of 238,540km2 with a tropical humid climate. The south has a double maxima rainfall (May-June andSeptember-October) whereas the north has a single long rainy season (June-August). Thedry, dusty, Harmattan winds occur from January to March. Agriculture in Ghana largelyfollows the country’s ecological and climatic patterns. The country has three broad ecologicalzones, which are the forest, forest-savannah transition, and the savannah zones [9,10].These broad categories are further sub-divided into the coastal savannah, rainforest, semi-deciduous forest, forest-savannah transition, Guinea savannah and Sudan savannah (Fig.1). The forest zone, comprising the tropical high rain forest and semi-deciduous forest,covers about one-third of the country (8.2 million hectares), and supports about two-thirds ofthe country’s population [11]. Most of the economic activities of the country are also locatedhere, including activities associated with cocoa, minerals, oil palm, rubber, and timber. Thenorthern savannah zone covers about 66% (15.7 million hectares) of the country’s total area.Industrial crops such as cotton and sheanuts, along with food crops such as rice, maize,sorghum, millet and yam are important in the zone. The forest-savannah transition (a blendof the forest and savannah) lies in-between the two zones, and noted for cereals, particularlymaize, as well as root and tuber crop production [10].
The study sample consisted of 300 farmers randomly selected from the study areas. In all,three districts were involved in the study, namely: Techiman Municipality and KintampoSouth District in the Brong Ahafo Region (160 respondents), which fall within the transitionalzone; and Akuapem South District in the Eastern Region (140 respondents), which also fallwithin the coastal savannah-forest fringes (Fig. 2 and Table 1). Among the 160 respondents,116 grew tomatoes in addition to other crops, and 44 do not; while among the 140respondents, 52 cultivated pineapple and 88 do not. These districts fall under threetraditional authorities as well, namely Akwapm South, Nkoranza and Techiman Traditionalareas, respectively; and the enumeration areas were Fotobi, Pokrom, Pamdu andTuobodom, which are major producing centers for tomato (Pamdu and Tuobodom) andpineapple (Fotobi and Pokrom).
American Journal of Experimental Agriculture, 3(3): 606-630, 2013
610
Table 1. Study districts and enumeration areas
Districts Enumeration area Number of respondents Percent of sampleAkuapem south Fotobi/Pokrom 140 46.7Kintampo south Pamdu 67 22.3Techiman municipality Tuobodom 93 31.0Total 300 100.0
Source: Household Survey, Nov/Dec 2010
Fig. 1. Ghana’s agro-ecological zones showing the study districts
Majority of the households (i.e. 256 farmers or 87.4%) did not have project farmers orfarmers that belonged to any on-going projects (Table 2). That is, these were individualprivate farmers who did not enjoy any support from government programmes or even localfarmer associations. Most of the farmer based groups were found in the Akwapem SouthDistrict, and the most important project they belonged to was the Millennium DevelopmentAccount (MIDA) project that provides support for smallholder commercial farmers.
Table 2. Response on whether or not the household has project farmers
District Does the household have project farmersYes No
Techiman Municipality 2 (0.7%) 85 (29.0%)Kintampo South 2 (0.7%) 65 (22.2%)Akuapem South 33 (11.3% 106 (36.2%)Total 37 (12.6%) 256 (87.4%)
Source: Household Survey, Nov/Dec 2010

American Journal of Experimental Agriculture, 3(3): 606-630, 2013
611
In Tuobodom, some of the farmers indicated that they belong to just one farmer basedcooperative which is Tuobodom Tomato Growers Association. In Pamdu two farmer basedgroups were found – Pamdu Tomato Growers Association and Cashew GrowersAssociation. Farmers in Fotobi and Pokrom however had more farmer based groups. InFotobi there were Fotobi Cooperative, Apesika Cooperative, Ghana Agricultural WorkersUnion (GAWU) and Pineapple Growers Association. In Pokrom, eight farmer based groupswere identified. These were Unity Animal Farm, Pokrom Youth in Agriculture, NsabaCooperative, Adonten Cooperative, Adonten Pineapple Growers Association, New PatrioticPineapple Farmers Association, Kwasikrom Apramso Cooperative, DVG Cooperative andPatriotic Cooperative.
The importance of probing into the existence of agricultural projects (either government ornon-government) in the study areas was to establish whether commercialization ofsmallholder farms had been driven largely by such projects and the support they provide.Based on the Focus Group Discussions (FGDs) and Key Informant (KI) interviews, whichwere conducted in all study communities in the three districts, it was realized that the movetowards commercialization had been driven by different facilitating factors for tomato andpineapple production. Whereas commercialization of tomato production has been drivenmore by tradition (i.e. the crop has traditionally been produced there) and the relativeprofitability of the crop in the study districts, the commercialization of pineapple productionhas been greatly influenced by projects, especially when MoFA declared the Akwapim SouthDistrict a pineapple zone several years earlier. This partially explains why there were only afew farmer associations in Pamdu and Tuobodom but several in Fotobi and Pokrom.
The study used both qualitative and quantitative primary data, which were augmented withrelevant secondary data. In all the districts covered by this study, primary data collectionfollowed a multi-stage sampling design. The first stage consisted of a purposive selection ofdistricts noted for tomato and pineapple production respectively, and also reasonablyaccessible. The second and third stages consisted of a random selection in each case of thecommunities and households within each community to ensure that each household in thecommunities had an equal chance of being selected. Household interviews using structuredquestionnaires were then conducted. In addition, focus group discussions (FGDs) wereconducted in each community with about 8 to 10 people in each group, and both males andfemales well represented. Also, Key Informant (KI) interviews were done with opinionleaders in each community. Relevant secondary data were obtained from the GhanaStatistical Service (GSS) and MoFA at the national/regional and district offices.
4. METHOD OF ANALYSIS
Data analysis used statistical and econometric approaches. Descriptive statistics includingmeans, standard deviation, correlations and scatter plots, among others, were employed toshow the demographic characteristics of the study communities, both in terms of the totalsample as well as for tomato and pineapple sub-samples. Regression analysis was used todetermine the key factors that influence household decision to undertake commercializationamong both tomato and pineapple farmers. Furthermore, correlation analyses were done toshow the relationship between commercialization index (computed as the ratio of the valueof output sold to total estimated value of farm production) and the value of farm sales as wellas land size, and food security and key related variables such as age and education, amongothers.

American Journal of Experimental Agriculture, 3(3): 606-630, 2013
612
5. RESULTS AND DISCUSSION
5.1 Demographic Characteristics
The data is presented first as a total sample of 300 respondents (Table 3) to show theirdemographic characteristics. The respondents were mostly males forming 91.7%, mostlywithin the age of 15 to 59 years (91%). An overwhelming number of the Household headswho were married fell into the category of monogamy (74%). The singles among therespondents were just 10%. One significant finding from the data is the large number ofrespondents that can both read and write. They formed 71% of the total sample. However,the levels of education were mostly around first cycle with JCE/BECE qualification. Asexpected, 96.3% of the respondents were farmers. It should be noted that farmers in thestudy districts grow tomato and pineapple which are mainly grown for cash, and in additionseveral food crops both for cash and subsistence. Besides livestock which farmers in thestudy districts keep, the major other crops grown by tomato farmers in the two districtsinclude maize, cassava, yam, cocoyam, groundnuts and vegetables. In the Akwapim Southdistrict, pineapple farmers also grow mainly maize, cassava, plantain and vegetables, andsome tree crops such as citrus and oil palm.
A closer look at the data revealed that the farm incomes reported by some respondents wereeither too low or too high (annual farm incomes ranged between a low GH₵12 to a highGH₵100,000). These outliers were therefore identified and removed from the data beforefurther analysis were done to avoid the bias that such outliers could introduce into theanalysis.
5.2 Descriptive Statistics of the Total Sample
5.2.1 Commercialization index
Table 4 shows the descriptive statistics for the whole sample. An index of commercializationwas computed for the entire sample. This measures the ratio of output sold in the 2010growing seasons evaluated at their market prices to the value of the output harvestedwhether sold or not sold. The average commercialization index was 0.64 with standarddeviation of 0.17, implying that in general farm households sold more than 50 percent oftheir output.
5.2.2 Farm income
Overall, the estimated average income of the respondents from all economic activities wasabout 636 dollars with standard deviation of 679 dollars. The income was estimated usingthe farm and non-farm incomes in the 2010 farming season, and were estimated for all thefarmers involved in the study.

American Journal of Experimental Agriculture, 3(3): 606-630, 2013
613
Table 3. Demographic characteristics of the household heads
Gender TechimanMunicipality
KintampoSouth
AkwapemSouth
Total
Male 88(29.3) 60(20) 127(42.3) 275(91.7)Female 5(1.7) 7(2.3) 13(4.3) 25(8.3)Total 93(31.0) 67(22.3) 140(46.6) 300(100)Age15-59 Years 87(29) 62(20.7) 124(41.3) 273(91.0)>60 Years 6(2) 5(1.7) 16(5.3) 27(9.0)Total 93(31) 67(22.4) 140(46.6) 300(100)Marital StatusMarried – monogamous 69(23.0) 43(14.3) 110(36.7) 222(74.0)Married polygamous 3(1.0) 1(0.3) 3(1.0) 7(2.3)Single 8(2.7) 15(5.0) 7(2.3) 30(10.0)Divorce 8(2.7) 6(2.0) 10(3.3) 24(8.0)Widow 1(0.3) 0 7(2.4) 8(2.7)Widower 0 0 1(0.3) 1(0.3)Separated 4(1.3) 2(0.7) 2(0.7) 8(2.7)Total 93(31.0) 67(22.3) 140(46.7) 300(100)Literacy StatusCan read and write 68(22.6) 47(15.7) 98(32.7) 213(71.0)Can read only 8(2.7) 4(1.3) 9(3.0) 21(7.0)Cannot read or write 17(5.7) 16(5.3) 33(11.0) 66(22.0)Total 93(31.0) 67(22.3) 140(46.7) 300(100)Educational StatusPost Grad Diploma 0 1(0.3) 0 1(0.3)Univ. Diploma/Degree 3(1.0) 3(1.0) 1(0.3) 7(2.3)Non Univ. Diploma 4(1.3) 2(0.7) 4(1.3) 10(3.3)MSCE/WASSCE 27(9.0) 15(5.0) 43(14.3) 85(28.3)JCE/BECE 34(11.3) 31(10.3) 45(15.0) 110(36.7)PSLC 2(0.7) 0 6(2.0) 8(2.7)None 23(7.7) 15(5.0) 41(13.7) 79(26.3)Total 93(31.0) 67(23.3) 140(46.7) 300(100)Main Occupation in the last 6monthsFarming 88(29.4) 63(21.0) 138(46.0) 289(96.4)Salaried Employee 1(0.3) 3(1.0) 0 4(1.3)Family Business, Self-Employed 3(1.0) 0 4(1.3)Non-Worker 0 0 1(0.3) 1(0.3)Other 1(0.3) 0 1(0.3) 2(0.7)Total 93(31) 66(22) 140(46.7) 300(100)
NB: Percentages in parenthesisSource: Household Survey, Nov/Dec 2010
5.2.3 Land size (ha)
This was computed using food crop farms in the sample (except outliers) which includedtomatoes and pineapple and other crops. It was realized that among the entire populationthe average land size was 1.41 hectares with standard deviation of 1.51.

American Journal of Experimental Agriculture, 3(3): 606-630, 2013
614
5.2.4 Value of crop production (US$)
The entire crop produced for the 2010 season was valued at the average market prices inthe local currency (Ghana Cedis), and using the nominal exchange rate of the Cedi to theDollar (i.e. GHC1.45 to US$1.00 in 2010). The average value of crop production sales was$488 with standard deviation of $579.
5.2.5 Salaried job (e.g. police, school, teacher, etc)
Some of the respondents were both partly farmers and partly working in a salaried job. In thetotal population, these were only 22 (i.e. 1.6%), and the average income they earned fromthese salaried jobs was $1,500 with a standard deviation of $1,327.
Table 4. Descriptive statistics of the total sample
Mean SD Median NIndex: value of output sold/ total est. value of farmproduction
0.64 0.17 0.67 288
Farm [crop, livestock] income (US$) 575.77 657.61 331.03 288Non-farm income (US$) 218.58 261.26 137.93 79Total income (US$) 635.73 679.39 388.11 288Land size (ha) 1.41 1.51 0.81 288Value production of crops, US$ 487.74 579.41 248.28 288Gender household head 0.92 0.28 1.00 288Size of household [no persons in household] 4.16 2.14 4.00 288Education: years schooling of household head 10.03 4.99 9.00 288 years of schooling of wife or head if female-
headed11.43 7.99 9.00 21
Salaried Job (e.g. police, school teacher, etc.)[Yes/No]
1499.75 1326.84 1292.76 22
Business [Yes/No] 735.97 899.90 206.55 92Land productivity, value of crop in US$/ha 533.20 861.19 219.67 288Labour productivity, value of crop in US$/ labourdays
39.75 192.60 5.17 263
Irrigated land accessed (i.e both pump and handirrigation) ha
1.18 0.74 1.21 29
5.2.6 Business
This is made up of the proportion of respondents who owned their own enterprises or whohave operated any non-agricultural income-generating enterprise that produces goods orservices (including those who owned a shop or operated a trading business). The value ofthe average income from these sources was $735.97 with a wide dispersion (i.e.899.90standard deviation), and there were 92 such respondents in the whole sample (Table 4).
5.2.7 Land productivity (output of crop per ha in value terms, i.e. US$/ha)
This measures the productivity of the land as the ratio of output per hectare, and valued atthe average market price of the product. The average land productivity value of crops

American Journal of Experimental Agriculture, 3(3): 606-630, 2013
615
($533.20) had a high standard deviation (i.e. $861.19/ha) which showed that the outputlevels were widely dispersed (Table 4).
5.2.8 Labour productivity (value of crop per labour Day, i.e. US$/man day)
This measures the ratio of value of output in US dollars and total number of days of labour.The results show that the value of the average output was $39.75/ man day with a standarddeviation of $192.60/man day (Table 4).
5.2.9 Irrigated land used by farmers (ha)
This refers to the amount of land that was under formal irrigation during the crop season.The study showed that no land in all the study communities was under formal irrigation.However, hand irrigation and pump irrigation are both practiced in both communities byfarmers who have their lands near sources of water and are also able to afford the irrigationpump and other equipment. Information from the FGDs and KI interviews revealed thatduring certain periods of the year, some farmers convey water to their tomato and pineapplefarms by head loads and trucks and store in large tanks and other containers for irrigation.
5.3 Descriptive Statistics Based on the Two Study Regions
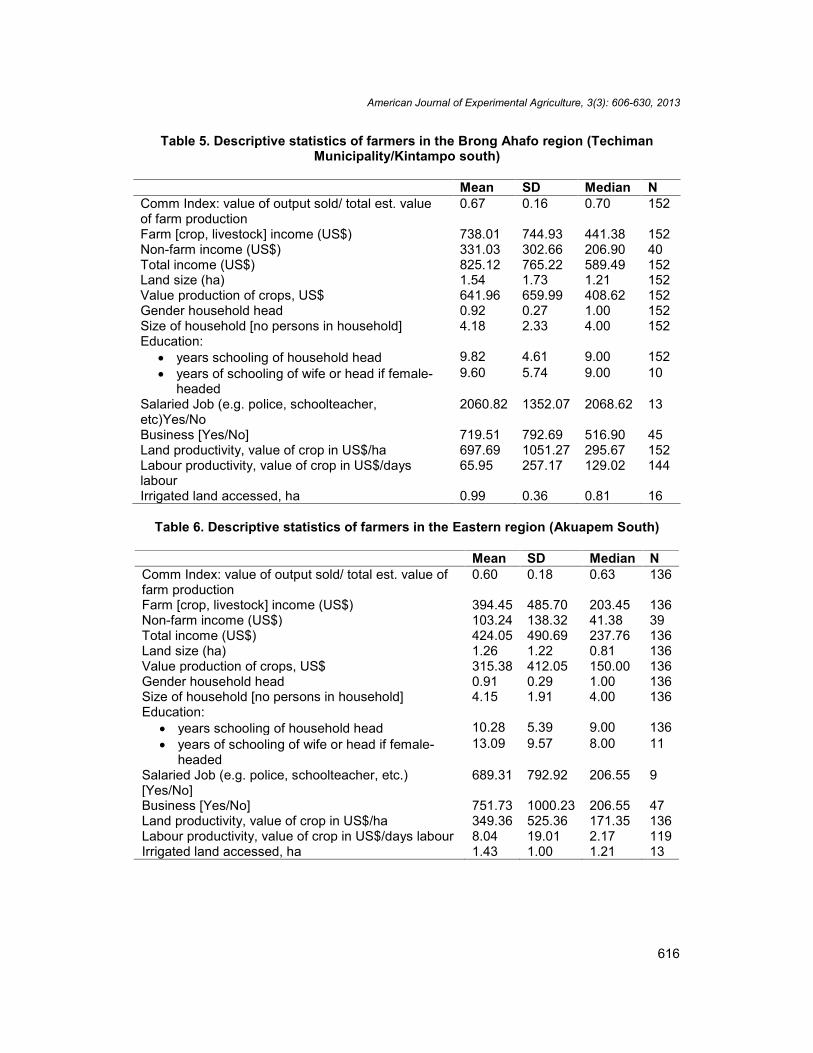
Tables 5 and 6 show the descriptive statistics for Brong Ahafo Region and Eastern Regionrespectively. Comparing the values between the two regions, it was observed that the meanvalues are higher among Brong-Ahafo farmers than Eastern region farmers. However, interms of education, the average number of years in school by the Eastern region farmers ishigher than the years of schooling of farmers in Brong-Ahafo region. The large standarddeviation among the pineapple growers shows that the mean values are not evenly orclosely dispersed among farmers.
Between the tomato growers and non-tomato growers the mean values were higher incommercialization index, total income, value of sales of crops, salary, business, labour andland productivity among tomato growers. However, the average land size used by nontomato growers was higher (i.e. 1.87 ha) as compared to 1.44 ha of tomato growers (Tables7 and 8).
American Journal of Experimental Agriculture, 3(3): 606-630, 2013
616
Table 5. Descriptive statistics of farmers in the Brong Ahafo region (TechimanMunicipality/Kintampo south)
Mean SD Median NComm Index: value of output sold/ total est. valueof farm production
0.67 0.16 0.70 152
Farm [crop, livestock] income (US$) 738.01 744.93 441.38 152Non-farm income (US$) 331.03 302.66 206.90 40Total income (US$) 825.12 765.22 589.49 152Land size (ha) 1.54 1.73 1.21 152Value production of crops, US$ 641.96 659.99 408.62 152Gender household head 0.92 0.27 1.00 152Size of household [no persons in household] 4.18 2.33 4.00 152Education: years schooling of household head 9.82 4.61 9.00 152 years of schooling of wife or head if female-
headed9.60 5.74 9.00 10
Salaried Job (e.g. police, schoolteacher,etc)Yes/No
2060.82 1352.07 2068.62 13
Business [Yes/No] 719.51 792.69 516.90 45Land productivity, value of crop in US$/ha 697.69 1051.27 295.67 152Labour productivity, value of crop in US$/dayslabour
65.95 257.17 129.02 144
Irrigated land accessed, ha 0.99 0.36 0.81 16
Table 6. Descriptive statistics of farmers in the Eastern region (Akuapem South)
Mean SD Median NComm Index: value of output sold/ total est. value offarm production
0.60 0.18 0.63 136
Farm [crop, livestock] income (US$) 394.45 485.70 203.45 136Non-farm income (US$) 103.24 138.32 41.38 39Total income (US$) 424.05 490.69 237.76 136Land size (ha) 1.26 1.22 0.81 136Value production of crops, US$ 315.38 412.05 150.00 136Gender household head 0.91 0.29 1.00 136Size of household [no persons in household] 4.15 1.91 4.00 136Education: years schooling of household head 10.28 5.39 9.00 136 years of schooling of wife or head if female-
headed13.09 9.57 8.00 11
Salaried Job (e.g. police, schoolteacher, etc.)[Yes/No]
689.31 792.92 206.55 9
Business [Yes/No] 751.73 1000.23 206.55 47Land productivity, value of crop in US$/ha 349.36 525.36 171.35 136Labour productivity, value of crop in US$/days labour 8.04 19.01 2.17 119Irrigated land accessed, ha 1.43 1.00 1.21 13

American Journal of Experimental Agriculture, 3(3): 606-630, 2013
617
Table 7. Descriptive statistics of farmers in Brong Ahafo region (Tomato Growers)
Mean SD Median NIndex: value of output sold/ total est. value of farmproduction
0.68 0.16 0.71 116
Farm [crop, livestock] income (US$) 829.46 771.65 568.62 116Non-farm income (US$) 299.67 277.01 186.21 31Total income (US$) 909.54 795.88 634.49 116Land size (ha) 1.44 1.61 1.21 116Value production of crops, US$ 732.29 698.74 444.83 116Gender household head 0.94 0.24 1.00 116Size of household [no persons in household] 3.96 2.22 4.00 116Education: years schooling of household head 10.01 4.49 9.00 116 years of schooling of wife or head if female-
headed11.33 6.74 9.00 6
Salaried Job (e.g. police, schoolteacher, etc.)[Yes/No]
2248.89 1365.94 2068.62 9
Business [Yes/No] 778.75 802.70 516.90 34Land productivity, value of crop in US$/ha 824.01 1154.82 471.43 116Labour productivity, value of crop in US$/dayslabour
78.22 290.03 10.67 111
Irrigated land accessed, ha 1.01 0.38 1.01 14
Table 8. Descriptive statistics of farmers in Brong Ahafo region (non tomato growers)
Mean SD Median NIndex: value of output sold/ total est. value of farmproduction
0.64 0.14 0.63 36
Farm [crop, livestock] income (US$) 443.35 566.23 281.55 36Non-farm income (US$) 439.08 376.62 310.34 9Total income (US$) 553.12 587.60 362.24 36Land size (ha) 1.87 2.05 1.21 36Value production of crops, US$ 350.88 401.09 186.56 36Gender household head 0.86 0.35 1.00 36Size of household [no persons in household] 4.89 2.55 5.00 36Education: years schooling of household head 9.22 4.99 9.00 36 years of schooling of wife or head if female-
headed7.00 2.83 8.00 4
Salaried Job (e.g. police, schoolteacher, etc.)[Yes/No]
1637.68 1411.42 1292.76 4
Business [Yes/No] 536.43 767.92 206.55 11Land productivity, value of crop in US$/ha 290.65 403.54 137.44 36Labour productivity, value of crop in US$/dayslabour
24.67 64.18 4.27 33
Irrigated land accessed, ha 0.81 0.00 0.81 2
In the Eastern region, between the pineapple growers and non pineapple growers the meanvalues were higher in the commercialization index, total income, land size, value of sales of

American Journal of Experimental Agriculture, 3(3): 606-630, 2013
618
crops, salary, business, labour and land productivity among pineapple growers. However,there was no female household head cultivating pineapple but majority of the femalehousehold heads are cultivating other crops (Tables 9 and 10).
Table 9. Descriptive statistics of farmers in Eastern region (pineapple growers)
Mean SD Median NIndex: value of output sold/ total est. value of farmproduction
0.63 0.18 0.64 52
Farm [crop, livestock] income (US$) 632.53 551.31 486.21 52Non-farm income (US$) 111.11 171.76 41.38 18Total income (US$) 670.99 554.65 517.24 52Land size (ha) 1.45 1.28 1.21 52Value production of crops, US$ 571.55 488.84 434.48 52Gender household head 0.98 0.14 1.00 52Size of household [no persons in household] 4.12 1.62 4.00 52Education: years schooling of household head 10.40 4.58 9.00 52 years of schooling of wife or head if female-
headed- - - -
Salaried Job (e.g. police, schoolteacher, etc.) Yes/No 749.66 891.40 361.73 4Business [Yes/No] 874.31 1099.69 206.55 22Land productivity, value of crop in US$/ha 565.42 546.97 330.63 52Labour productivity, value of crop in US$/days labour 14.52 28.11 5.00 45Irrigated land accessed, ha 1.45 1.04 1.21 12
Table 10. Descriptive statistics of farmers in Eastern region (non-pineapple growers)
Mean SD Median NIndex: value of output sold/ total est. value of farmproduction
0.59 0.17 0.63 84
Farm [crop, livestock] income (US$) 247.07 373.42 103.45 84Non-farm income (US$) 96.49 105.69 48.28 21Total income (US$) 271.19 375.16 115.52 84Land size (ha) 1.15 0.81 1.18 84Value production of crops, US$ 156.81 250.52 76.55 84Gender household head 0.87 0.34 1.00 84Size of household [no persons in household] 4.17 2.08 4.00 84Education: years schooling of household head 10.20 5.87 9.00 84 years of schooling of wife or head if female-
headed13.09 9.57 8.00 11
Salaried Job (e.g. police, schoolteacher, etc.) Yes/No 641.03 809.28 206.55 5Business [Yes/No] 643.86 912.97 643.86 25Land productivity, value of crop in US$/ha 215.60 466.63 103.44 84Labour productivity, value of crop in US$/days labour 4.10 8.15 1.33 74Irrigated land accessed, ha 1.21 - 1.21 1

American Journal of Experimental Agriculture, 3(3): 606-630, 2013
619
5.4 Correlation Analysis of Key Variables
In order to demonstrate the relationship between commercialization and the value of farmsales as well as land holdings by farmers, correlation analysis and related scatter plots weredone for each region. [The respective scatter diagrams are available upon request].
The correlation between the value of farm sales and land size in the Brong-Ahafo region issignificant and positively related (r=0.217). In the Brong-Ahafo region, total labour use ispositively related to value of sales which conforms to the sign expected but not significant,whiles fertilizer use is negatively related (did not conform to sign expected) to value of saleand also not significant (Table 11).
The relationship between the value of farm sales in the Eastern region was positive forfertilizer use, land size and total labour use, which was the only significant variable with r =0.228 (Table 12).
The correlation between commercialization index and land size as well as fertizer use in theBrong-Ahafo region were not significant and negatively related which did not conform toexpectation. Also, farm income and total labour use are positively related tocommercialization but only farm income is significant (Table 13).
In the Eastern Region, the correlation between commercialization index and farm income,land size, fertilizer use and total labour use are positively related but not significant (Table14).
Table 11. Correlation for Brong-Ahafo region
Value ofsales ($)
Fertilizeruse(US$)
Total labouruse, days
Land size(ha)
Value of sales ($) Pearson Corr 1N 152
Fertilizer use(US$) Pearson Corr -.035 1Sig. (2-tailed) .699N 127 127
Total labour use, days Pearson Corr .146 .236** 1Sig. (2-tailed) .081 .009N 144 123 144
Land size (ha) Pearson Corr .217** .005 .241** 1Sig. (2-tailed) .007 .951 .004N 152 127 144 152
**. Correlation is significant at the 0.01 level (2-tailed).a. regions = Brong-Ahafo

American Journal of Experimental Agriculture, 3(3): 606-630, 2013
620
Table 12. Correlation for Eastern region
Value ofsales ($)
Fertilizeruse(US$)
Total labouruse, days
Land size(ha)
Value of sales ($) Pearson Corr 1N 136
Fertilizer use(US$) Pearson Corr .193 1Sig. (2-tailed) .102N 73 73
Total labour use, days Pearson Corr .228* -.084 1Sig. (2-tailed) .013 .502N 119 67 119
Land size (ha) Pearson Corr .101 .006 .164 1Sig. (2-tailed) .240 .959 .075N 136 73 119 136
*. Correlation is significant at the 0.05 level (2-tailed).a. regions = Eastern
Fig. 2 and Fig. 3 present the commercialization status of both tomato producing andpineapple producing households, as well as the cash incomes realized by smallholderhouseholds in the study communities. The data suggest that the adoption ofcommercialization by households, as well as earning cash income from commercializationwere higher among tomato producers. For example, among the tomato farmers averagecash income increased with farm size while in the case of pineapple farmers, farmers whocultivated plots larger than 4 hectares seem not to enjoy higher incomes probably becauseof greater challenges in managing larger farms and uncertainty on the part of farmers withmarketing their produce.
Table 13. Correlation for tomato farmers in Brong Ahafo region
commercializationindex
Farmincome(US$)
Landsize (ha)
Fertilizeruse(US$)
Totallabouruse, days
commercializationindex
Pearson Corr 1N 152
Farm income (US$) Pearson Corr .420** 1Sig. (2-tailed) .000N 152 152
Land size (ha) Pearson Corr -.067 .181* 1Sig. (2-tailed) .412 .025N 152 152 152
Fertilizer use(US$) Pearson Corr -.145 -.067 .005 1Sig. (2-tailed) .103 .452 .951N 127 127 127 127
Total labour use,days
Pearson Corr .083 .104 .241** .236** 1Sig. (2-tailed) .324 .216 .004 .009N 144 144 144 123 144**. Correlation is significant at the 0.01 level (2-tailed).*. Correlation is significant at the 0.05 level (2-tailed).
a. regions = Brong-Ahafo

American Journal of Experimental Agriculture, 3(3): 606-630, 2013
621
Table 14. Correlation for pineapple farmers in Eastern region
commercializationindex
Farmincome(US$)
Landsize(ha)
Fertilizeruse(US$)
Totallabouruse, days
commercializationindex
Pearson Corr 1N 136
Farm income (US$) Pearson Corr .036 1Sig. (2-tailed) .679N 136 136
Land size (ha) Pearson Corr .135 .057 1Sig. (2-tailed) .117 .510N 136 136 136
Fertilizer use(US$) Pearson Corr .085 .271* .006 1Sig. (2-tailed) .477 .020 .959N 73 73 73 73
Total labour use,days
Pearson Corr .025 .269** .164 -.084 1Sig. (2-tailed) .789 .003 .075 .502N 119 119 119 67 119
*. Correlation is significant at the 0.05 level (2-tailed).**. Correlation is significant at the 0.01 level (2-tailed).
a. regions = Eastern
Fig. 2. Commercialization status of sample farm households
Fig. 3. Household cash income per land size (Cedis/Ha)

American Journal of Experimental Agriculture, 3(3): 606-630, 2013
622
5.4 Determinants of Commercialization – Regression Results
In order to establish the determinants of smallholder commercialization of tomato andpineapple farming in the communities studied, a regression analysis was conducted in eachcase. The value of tomatoes or pineapples sold is used in this analysis as a proxy for theextent of commercialization by smallholder farmers.
The regression results for sampled tomato growers in the Brong Ahafo region with value oftomatoes sold in dollars as the dependent variable is presented in Table 15. About 68percent of the total variations in the value of sales of tomatoes sold is explained by landproductivity (value of crop in US$/ha) and labour productivity (value of crops in US$/labourdays). A one percent change in land productivity and labour productivity results in a 0.70 and0.15 percent increase in the value of tomato sales respectively.
Table 15. Regression Result for Tomato Farmers (with value of tomatoes sold)
Dependent Variable: log (Value of Tomatoes Sold)Method: Least SquaresSample (adjusted): 1 115Included observations: 109 after adjustmentsVariable Coefficient Std. Error t-Statistic Prob.Log (Land productivity) 0.701898 0.067779 10.35561 0.0000***Log (Labour productivity) 0.145125 0.047187 3.075519 0.0027***Log (Education) -0.090421 0.193790 -0.466593 0.6418Log (Fertilizer use (US$)) 0.282787 0.281445 1.004769 0.3174Log (Access to credit) 0.121443 0.213331 0.569270 0.5704Log (Savings(US$)) -0.000240 0.030344 -0.007898 0.9937Log (Age) 0.122964 0.795604 0.154555 0.8775C 0.140590 1.370020 0.102619 0.9185R-squared 0.696915 Mean dependent var 2.625353Adjusted R-squared 0.675910 S.D. dependent var 0.542686S.E. of regression 0.308946 Akaike info criterion 0.559259Sum squared resid 9.640185 Schwarz criterion 0.756789Log likelihood -22.47959 F-statistic 33.17719Durbin-Watson stat 1.862716 Prob(F-statistic) 0.000000
***represent significance at 1%
The Durbin-Watson statistics (DW) value of 1.86 indicates that there is no auto-correlation(Table 15). While d can assume values between 0 and 4, values around 2 indicate no auto-correlation. As a rule of thumb values of 1.5 < d < 2.5 show that there is no auto-correlationin the data.
The variance inflation factor (VIF) method was used in measuring the level of collinearitybetween regressors in the regression result for tomato growers with value of tomato sold.There are two forms of the variance inflation factor (centered and uncentered). The centeredVIF is the ratio of the variance from a coefficient estimate from an equation with only thatregressors and a constant. From the centered variance inflation factor, multicollinearity is lowsince the VIF values is less than 5.

American Journal of Experimental Agriculture, 3(3): 606-630, 2013
623
Variance Inflation FactorsCoefficient Uncentered Centered
Variable Variance VIF VIFLog (Land productivity) 0.004521 36.49457 1.581015Log (Labour productivity) 0.003031 5.920260 1.681420Log (Education) 0.034475 38.59631 1.019487Log (Fertilizer use (US$)) 0.104721 204.0012 1.197015Log (Access to credit) 0.042719 1.703427 1.047061Log (Savings(US$)) 0.000884 1.516366 1.111897Log (Age) 0.434262 1379.843 1.046298C 1.350264 1541.989 NA
Endogeneity TestDependent Variable: log (Value of Tomatoes Sold)Method: Least SquaresSample (adjusted): 1 115Included observations: 109 after adjustmentsVariable Coefficient Std. Error t-Statistic Prob.Log (Land productivity) 0.701898 0.066758 10.51407 0.0000Log (Labour productivity) 0.145125 0.045780 3.170049 0.0020Log (Education) -0.090421 0.193415 -0.467498 0.6412Log (Fertilizer use (US$)) 0.282787 0.281153 1.005811 0.3169Log (Access to credit) 0.121443 0.211215 0.574975 0.5666Log (Savings(US$)) -0.000240 0.029916 -0.008011 0.9936Log (Age) 0.122964 0.785856 0.156472 0.8760Residual 0.569662 0.419156 1.359070 0.1772C 0.140590 1.329849 0.105718 0.9160R-squared 0.707383 Mean dependent var 2.625353Adjusted R-squared 0.683974 S.D. dependent var 0.542686S.E. of regression 0.305078 Akaike info criterion 0.542458Sum squared resid 9.307229 Schwarz criterion 0.764680Log likelihood -20.56397 F-statistic 30.21802Durbin-Watson stat 1.823847 Prob(F-statistic) 0.000000
*** and ** represent significance at 1% and 5% respectively
The “augmented regression approach” was used to control for endogeneity of thedeterminants of smallholder tomato commercialization in the model. The “augmentedregression approach” involves two stages, at the first stage; exogenous variables thatexplain tomato commercialization are regressed on the index of tomato commercialization.The residuals for the model are retrieved from the model. In the second stage, the residualsare used as instrument together with the determinants as exogenous variables using thevalue of tomato sold as the dependent variable. Since the coefficient on the residual isstatistically different from zero we conclude that ordinary least square is consistent inestimation.
The probability of the observed R-squared value in the output from the whiteheteroskedasticity test (0.20) for tomato growers represents that it will be incorrect if the nullhypothesis of no heteroskedasticity is rejected.

American Journal of Experimental Agriculture, 3(3): 606-630, 2013
624
White Heteroskedasticity Test:F-statistic 1.292150 Probability 0.180046Obs*R-squared 39.50890 Probability 0.201925
In the case of pineapple producers, Table 16 represents the regression results for sampledpineapple growers in the Eastern Region with value of pineapples sold in dollars as thedependent variable. About 70 percent of the total variations in the value of sales of pineapplegrowers is explained by land productivity (value of crop in US$/ha) and savings. The value ofpineapples sold is expected to increase by 0.16 percent and 0.77 percent when there is aone percent change in land productivity and savings respectively. The Durbin-Watsonstatistics indicates that there is no autocorrelation since the value of 1.82 lies between thevalues of 1.5 < d < 2.5 which shows that there is no auto-correlation in the data.
The variance inflation factor (VIF) method was used in measuring the level of collinearitybetween regressors in the regression result for pineapple growers. From the centeredvariance inflation factor, multicollinearity is low since the VIF values is less than 5.
Similar to the tomato model, endogeneity was controlled through the “augmented regressionapproach” for the determinants of smallholder pineapple commercialization. Two stages areinvolved in the “augmented regression approach”. The first stage; exogenous variables thatexplain pineapple commercialization are regressed on the index of pineapplecommercialization. The residuals for the model are retrieved from the model. In the secondstage, the residuals are used as instrument together with the determinants as exogenousvariables using the value of pineapple sold as the dependent variable. Since the coefficienton the residual is statistically different from zero, we conclude that ordinary least square isconsistent in estimation.
Table 16. Regression result for pineapple growers (with value of pineapples sold)
Dependent Variable: log (Value of Pineapples Sold)Method: Least SquaresSample (adjusted): 1 50Included observations: 42 after adjustmentsVariable Coefficient Std. Error t-Statistic Prob.Log (Land productivity) 0.154739 0.061907 2.499528 0.0174**Log (Labour productivity) 0.052692 0.038800 1.358057 0.1834Log (Education) 0.013717 0.108604 0.126306 0.9002Log (Fertilizer use (US$)) -0.187803 0.156564 -1.199533 0.2386Log (Access to credit) 0.073388 0.154098 0.476240 0.6369Log (Savings(US$)) 0.765317 0.080477 9.509744 0.0000***Log (Age) 0.687346 0.977424 0.703222 0.4867C -0.757166 1.596338 -0.474314 0.6383R-squared 0.720308 Mean dependent var 2.632211Adjusted R-squared 0.703901 S.D. dependent var 0.379277S.E. of regression 0.117575 Akaike info criterion -1.273831Sum squared resid 0.470015 Schwarz criterion -0.942846Log likelihood 34.75044 F-statistic 56.09177Durbin-Watson stat 1.818087 Prob(F-statistic) 0.000000
*** and ** represent significance at 1% and 5% respectively

American Journal of Experimental Agriculture, 3(3): 606-630, 2013
625
Variance inflation factorsCoefficient Uncentered Centered
Variable variance VIF VIFLog (Land productivity) 0.003833 77.91111 2.277891Log (Labour productivity) 0.001505 3.800888 1.637486Log (Education) 0.011795 36.76531 1.079381Log (Fertilizer use (US$)) 0.024512 120.4495 1.188020Log (Access to credit) 0.023746 1.712275 1.263822Log (Savings(US$)) 0.006477 142.8683 2.806818Log (Age) 0.955358 7917.279 1.136472C 2.548294 7742.229 NA
Endogeneity test
Dependent Variable: VSMethod: Least SquaresSample (adjusted): 1 50Included observations: 42 after adjustmentsVariable Coefficient Std. Error t-Statistic Prob.Log (Land productivity) 0.154739 0.060953 2.538668 0.0160Log (Labour productivity) 0.052692 0.038201 1.379322 0.1771Log (Education) 0.013717 0.106930 0.128284 0.8987Log (Fertilizer use (US$)) -0.187803 0.154150 -1.218316 0.2317Log (Access to credit) 0.073388 0.151722 0.483697 0.6318Log (Savings(US$)) 0.765317 0.079236 9.658656 0.0000Log (Age) 0.687346 0.962355 0.714233 0.4801Residual 0.180814 0.125579 1.439840 0.1593C -0.757166 1.571726 -0.481741 0.6332R-squared 0.725018 Mean dependent var 2.632211Adjusted R-squared 0.706841 S.D. dependent var 0.379277S.E. of regression 0.115763 Akaike info criterion -1.287140Sum squared resid 0.442233 Schwarz criterion -0.914782Log likelihood 36.02993 F-statistic 50.88856Durbin-Watson stat 1.619181 Prob(F-statistic) 0.000000
The probability of the observed R-squared value in the output from the whiteheteroskedasticity test (0.22) for pineapple growers represents that it will be incorrect if thenull hypothesis of no heteroskedasticity is rejected.
White heteroskedasticity testF-statistic 1.407365 Probability 0.218434Obs*R-squared 15.45734 Probability 0.217373
5.5 Relation between Commercialization and Food Security
5.5.1 Commercialization and the area under food crops
Using the area under food crops as a proxy for food security of the household, a correlationanalysis was conducted to investigate the relationship between commercialization and foodsecurity. A low correlation value of 0.039 (Table 17) indicates that there is a positive

American Journal of Experimental Agriculture, 3(3): 606-630, 2013
626
relationship between commercialization index (CI) and area under food crops which is notsignificant. This means that commercialization and area under food crops are independent.
5.5.2 Commercialization and food production per adult equivalent
The adult equivalent was measured as the number of adults in a household, using a calorie-based scale from the 10th Edition of the National Research Council’s Recommended DietaryAllowances (Washington D.C.: National Academy Press, 1989), Ghana. Measuringhousehold size in equivalent adults recognises, for example, that the consumptionrequirements of babies or young children are less than those of adults (Appendix I). Thescale is based on age and gender specific calorie requirements (Ghana Statistical Service,2007). The relationship between commercialization and food production per adult equivalentis negative, and the correlation value is -0.129 and significant (the value of 0.029 is less than0.05 (Table 17).
5.5.3 Commercialization and food consumption scores
Based on the calorie-based scale (Appendix I), the calorie intake of sampled householdsrange between 0.74 to 8.49 on the equivalent scale as shown in Table 18. There is apositive relationship between commercialization and food consumption score per household(Table 17) but not significant (r = 0.031, p = 0.605).
Table 17. Correlation analysis of commercialization with key variables
Commerc-ialization
Foodproduction/adultequivalent
Foodconsumptionscores
Area underfood crops
Commercialization PearsonCorrelation
1
Sig. (2-tailed)N 288
Foodproduction/adultequivalent
PearsonCorrelation
-.129* 1
Sig. (2-tailed) .029N 288 288
FoodconsumptionScores
PearsonCorrelation
.031 -.092 1
Sig. (2-tailed) .605 .118N 288 288 288
Area underfood crops
PearsonCorrelation
.039 -.082 .035 1
Sig. (2-tailed) .506 .167 .559N 288 288 288 288
*. Correlation is significant at the 0.05 level (2-tailed).
Table 18. Summary Statistics of Commercialization and Food Consumption Scores
N Minimum Maximum Mean Std. DeviationFood consumption scores 288 0.74 8.49 2.32 1.29Valid N (listwise) 288

American Journal of Experimental Agriculture, 3(3): 606-630, 2013
627
Further analysis of the survey data shows that most farmers producing tomato or pineappleon commercial basis are self-sufficient in food and therefore food secure throughout the year(Figs. 4 and 5). For example, 77% of tomato farmers indicated they are food self-sufficientwhile 62% of pineapple farmers indicated the same. This suggests that commercializationhas not negatively affected the food security status of smallholder farmers.
Fig. 4. Status of food self-sufficiency among tomato farmers
Fig. 5. Status of food self-sufficiency among pineapple farmers
6. CONCLUSIONS AND RECOMMENDATIONS
The paper focuses on the determinants of small holder commercialization of tomato andpineapple production in Ghana. It describes the characteristics of smallholder tomato andpineapple farmers in the study communities; analyses the relationship between
Lessadequate,23.3, 23%
Lessadequate,38.5, 39%
American Journal of Experimental Agriculture, 3(3): 606-630, 2013
627
Further analysis of the survey data shows that most farmers producing tomato or pineappleon commercial basis are self-sufficient in food and therefore food secure throughout the year(Figs. 4 and 5). For example, 77% of tomato farmers indicated they are food self-sufficientwhile 62% of pineapple farmers indicated the same. This suggests that commercializationhas not negatively affected the food security status of smallholder farmers.
Fig. 4. Status of food self-sufficiency among tomato farmers
Fig. 5. Status of food self-sufficiency among pineapple farmers
6. CONCLUSIONS AND RECOMMENDATIONS
The paper focuses on the determinants of small holder commercialization of tomato andpineapple production in Ghana. It describes the characteristics of smallholder tomato andpineapple farmers in the study communities; analyses the relationship between
Justadequate,76.7, 77%
Lessadequate,23.3, 23%
just adequateless adequate
Justadequate61.5, 62%
just adequateless adequate
American Journal of Experimental Agriculture, 3(3): 606-630, 2013
627
Further analysis of the survey data shows that most farmers producing tomato or pineappleon commercial basis are self-sufficient in food and therefore food secure throughout the year(Figs. 4 and 5). For example, 77% of tomato farmers indicated they are food self-sufficientwhile 62% of pineapple farmers indicated the same. This suggests that commercializationhas not negatively affected the food security status of smallholder farmers.
Fig. 4. Status of food self-sufficiency among tomato farmers
Fig. 5. Status of food self-sufficiency among pineapple farmers
6. CONCLUSIONS AND RECOMMENDATIONS
The paper focuses on the determinants of small holder commercialization of tomato andpineapple production in Ghana. It describes the characteristics of smallholder tomato andpineapple farmers in the study communities; analyses the relationship between
Justadequate,76.7, 77%
just adequateless adequate
Justadequate61.5, 62%
just adequateless adequate

American Journal of Experimental Agriculture, 3(3): 606-630, 2013
628
commercialization and smallholder land holdings; assesses the determinants ofcommercialization of smallholder agriculture, as well as the benefits or otherwise ofsmallholder farmers from commercialization; and discusses how commercialization affectshousehold food security among smallholder farmers. A structured questionnaire was used tocollect primary data from the study communities, and descriptive statistics, correlations aswell as regression analysis employed to analyse the data.
As expected, 96.3% of the respondents in the study communities were farmers; and they fellbetween the ages of 15 and 59 years (91%), which indicates that they were relatively young.The key determinants of commercialization among tomato farmers are land productivity andlabour productivity. On the other hand, the main determinants of commercialization amongpineapple smallholder farmers are land productivity and savings the study also finds that ingeneral commercialization and area under food crops as well as food consumption per adultequivalent are positively related, but negatively related to food production per adultequivalent. Moreover, most smallholders reported being food secure throughout the yearwith commercialization, which shows that commercialization is beneficial to them.
The study recommends that both public and private agencies should work together tofacilitate the move of smallholder farmers from mainly subsistence to commercializationbecause it comes with several benefits, including higher household incomes, andimprovements in household food security. This can be achieved partly through both publicand private investments in land and labour productivity, as well as improvements in postharvest activities such as processing that will help stabilize commodity prices and thus theincome of farmers. Moreover, there should be the targeting of specific commodities such astomato and pineapple to promote into commercialization because of the high potentials suchcommodities provide the farmer to increase their incomes and general welfare.
ACKNOWLEDGEMENT
This study was done under the Commercialization Theme of Future Agricultures Consortium(FAC) with financial support from the Department for International Development (DFID), UK.
COMPETING INTERESTS
Authors have declared that no competing interests exist.
REFERENCES
1. Timmer CP. Farmers and Markets: The Political Economy of New Paradigms,American Journal of Agricultural Economics. 1997;79:621-627.
2. Pingali P. From Subsistence to Commercial Production Systems: The Transformationof Asian Agriculture. American Journal of Agric. Economics. 1997;79:628-634.
3. von Braun J, Kennedy E, editors. Agricultural Commercialization, EconomicDevelopment, and Nutrition, the Johns Hopkins Press Ltd. Maryland; 1994.
4. Dorward A; Kydd J, Poulton C, editors. Smallholder Cash Crop Production underMarket Liberalization. Oxon; New York, NY: CAB International; 1998.
5. Shepherd AW, Farolfi S. Export Crop Liberalization: A Review. FAO AgriculturalServices Bulletin 000, ROME; 1999.
American Journal of Experimental Agriculture, 3(3): 606-630, 2013
629
6. Govereh, J, Jayne TS, James N. Smallholder Commercialization, Interlinked Marketsand Food Crop Productivity: Cross-Country Evidence in Eastern and Southern Africa.Department of Agricultural Economics & Department of Economics, Michigan StateUniversity (MSU); 1999.
7. Chipeta S, Hoydahl E, Krog J. Livestock Services and the Poor. A Global Initiative –Collecting, Coordinating and Disseminating Experiences. Draft Report, Danida, IFADand The World Bank; 2003.
8. Asuming-Brempong S, Al-Hassan R, Sarpong DB, Kwadzo GT-M, Akoena SKK,Sakyi-Dawson O, Mensah-Bonsu A, Amegashie DPK, Egyir IS, Ashley S. Poverty andSocial Impact Analysis (PSIA) Study of Ghana: Economic Transformation of theAgricultural Sector. Technical Report submitted to the National Development PlanningCommission (NDPC)/ Ministry of Food and Agriculture (MoFA), and DFID, Accra,Ghana; 2004.
9. MOFA. Agriculture in Ghana: Facts and Figures. Annual Report compiled by theStatistics, Research and Information Directorate (SRID), Ministry of Food andAgriculture (MOFA) as part of MOFA’s Policy Planning Monitoring and Evaluation.Accra, Ghana; 2009.
10. Ministry of Food and Agriculture (MoFA). “Agriculture in Ghana: Facts and Figures”,PPMED, Accra; 2006.
11. World Bank. Ghana Forest Resource Management Project (Staff Appraisal Report).Western Africa Division, World Bank, Washington D.C.; 1988.
12. Chamberlin J. Defining smallholder agriculture in Ghana Published date: InternationalFood Policy Research Institute, Washington, DC 20006-1002 USA; 2007.
13. Eaton C, Shepherd AW. Contract Farming: Partnership for Growth. Rome: Food andAgriculture Organization. Agricultural Services Bulletin. 2001;145.
14. Gabriel E, Nalukenge I, (DRAFT): Contract Farming, Smallholders andCommercialization of Agriculture in Uganda: The Case of Sorghum, Sunflower, andRice Contract Farming Schemes. Kampala, Uganda.
15. Glover, DJ. Increasing the Benefits to Smallholders from Contract Farming: Problemsfor Farmers' Organizations and Policy Makers. World Development. 1987;15(4):441-448..
16. Jayne TS, Takashi Y, Michael TW, David T, Rui B, Chapoto A, Zulu B. Smallholderincome and land distribution in Africa: implications for poverty reduction strategies.Food Policy. 2003;28:253–275.
17. Key N, Runsten D. Contract Farming, Smallholders, and Rural Development in LatinAmerica: The Organization of Agroprocessing Firms and the Scale of OutgrowerProduction. World Development.1999;27(2):381-401.
18. Masakure O, Henson S. Why do Small-scale Producers Choose to Produce underContract? Lessons from Nontraditional Vegetable Exports from Zimbabwe. WorldDevelopment. 2005;33(10):1721-1733.
19. Porter G, Howard KP. Comparing Contracts: An Evaluation of Contract FarmingSchemes in Africa. World Development. 1997;25(2):227-238.

American Journal of Experimental Agriculture, 3(3): 606-630, 2013
630
APPENDIX
Appendix I: Recommended Energy Intakes
Category Age (years) Average energyallowance per day (kcal)
EquivalenceScale
Infants 0 – 0.50.5 – 1.0
650850
0.220.29
Children 1 – 34 – 67 – 10
130018002000
0.450.620.69
Males 11 -1415 -1819 – 2525 – 5051+
25003000290029002300
0.861.031.001.000.79
Females 11 -1415 -1819 – 2525 – 5051+
22002200220022001900
0.760.760.760.760.66
Source: Recommended Dietary Allowances, 10th edition, (Washington D.C.: National Academy Press,1989).
_________________________________________________________________________© 2013 Asuming-Brempong et al.; This is an Open Access article distributed under the terms of the CreativeCommons Attribution License (http://creativecommons.org/licenses/by/3.0), which permits unrestricted use,distribution, and reproduction in any medium, provided the original work is properly cited.
Peer-review history:The peer review history for this paper can be accessed here:
http://www.sciencedomain.org/review-history.php?iid=229&id=2&aid=1384