determinants of commercial bank interest margins and...
TRANSCRIPT
THE WORLD BANK ECONOMIC REVIEW, VOL. 13, NO. 2: 379-408
Determinants of Commercial Bank Interest Marginsand Profitability: Some International Evidence
Ash Demirgiic,-Kunt and Harry Huizinga
Using bank-level data for 80 countries in the years 1988-9S, this article shows thatdifferences in interest margins and bank profitability reflect a variety of determinants:bank characteristics, macroeconomic conditions, explicit and implicit bank taxation,deposit insurance regulation, overall financial structure, and underlying legal and insti-tutional indicators. A larger ratio of bank assets to gross domestic product and a lowermarket concentration ratio lead to lower margins and profits, controlling for differencesin bank activity, leverage, and the macroeconomic environment. Foreign banks havehigher margins and profits than domestic banks in developing countries, while the op-posite holds in industrial countries. Also, there is evidence that the corporate tax burdenis fully passed onto bank customers, while higher reserve requirements are not, espe-cially in developing countries.
As financial intermediaries, banks play a crucial role in the operation of mosteconomies. Recent research, as surveyed by Levine (1997), shows that the effi-cacy of financial intermediation can affect economic growth. Crucially, financialintermediation affects the net return to savings and the gross return to invest-ment. The spread between these two returns mirrors bank interest margins, inaddition to transaction costs and taxes borne directly by savers and investors.Thus bank interest spreads could be interpreted as an indicator of the efficiencyof the banking system. In this article we investigate how bank interest spreads areaffected by taxation, the structure of the financial system, and financial regula-tions, such as deposit insurance.
A comprehensive review of the determinants of interest spreads is offered byHanson and Rocha (1986), who summarize the role that implicit and explicittaxes play in raising spreads and discuss some of the determinants of bank costsand profits, such as inflation, scale economies, and market structure. Using ag-gregate interest data for 29 countries in the years 1975-83, the authors find apositive correlation between interest margins and inflation.
Recently, several studies have examined the impact of international differ-ences in bank regulation using cross-country data. Analyzing interest rates in 13Organisation for Economic Co-operation and Development (OECD) countries in
Ash Demirgiic.-Kunt is with the Development Research Group at the World Bank, and Harry Huizingais with the Department of Economics, Tilburg University, and the Centre for Economic Policy Research inLondon. The authors gratefully acknowledge comments by three anonymous referees. They also thankAnqing Shi for excellent research assistance and Paulina Sintim-Aboagye for help with the manuscript.
© 1999 The International Bank for Reconstruction and Development/THE WORLD BANK
379
Pub
lic D
iscl
osur
e A
utho
rized
Pub
lic D
iscl
osur
e A
utho
rized
Pub
lic D
iscl
osur
e A
utho
rized
Pub
lic D
iscl
osur
e A
utho
rized
Pub
lic D
iscl
osur
e A
utho
rized
Pub
lic D
iscl
osur
e A
utho
rized
Pub
lic D
iscl
osur
e A
utho
rized
Pub
lic D
iscl
osur
e A
utho
rized

380 THE WORLD BANK ECONOMIC REVIEW, VOL 13, NO. 2
the years 1985-90, Bartholdy, Boyle, and Stover (1997) find that the existence ofexplicit deposit insurance lowers the deposit interest rate by 25 basis points.Barth, Nolle, and Rice (1997) use 1993 data from 19 industrial countries tofurther examine the impact of banking powers on bank return on equity, con-trolling for several bank and market characteristics. They find that variations inbanking powers, bank concentration, and the existence of explicit deposit insur-ance do not significantly affect the return on bank equity.
In this article we extend the existing literature in several ways. First, we usebank-level data for 80 industrial and developing countries in 1988-95 to providesummary statistics on the size and decomposition of bank interest margins andprofitability. Second, we use regression analysis to examine the underlying deter-minants of interest spreads and bank profitability. This empirical work enablesus to infer the extent of taxation and regulation on bank customers and on banksthemselves.
Apart from covering many banks in many countries, this study is unique in itscoverage of the determinants of interest margins and profitability. These determi-nants include a comprehensive set of bank characteristics (such as size, leverage,type of business, foreign or domestic ownership), macroeconomic indicators, taxa-tion and regulatory variables, financial structure variables, and legal and institu-tional indexes. Among these, the ownership variable, the tax variables, some of thefinancial structure variables, and the legal and institutional indicators have notbeen included in any previous study in this area. To check whether some of thesedeterminants affect banking differently in developing and industrial countries, weinteract these variables with the country's gross domestic product (GDP) per capita.
I. BANK INTEREST SPREADS AND PROFITABILITY
We can measure the efficiency of bank intermediation using both ex ante andex post spreads. The ex ante spread is the difference between the contractualrates charged on loans and rates paid on deposits. The ex post spread is thedifference between banks' actual interest revenues and their actual interest ex-penses. The ex post spread differs from the ex ante spread by the amount of loandefaults. The ex post spread is a more useful measure because it controls for thefact that banks with high-yield, risky credits are likely to face more defaults. Anadditional problem with using the ex ante spread is that data are generally avail-able at the aggregate industry level and are put together from a variety of sources.Thus they are not completely consistent. For these reasons we focus on ex postinterest spreads in this article. There is, however, a problem with ex post spreads,in that the interest income and loan loss reserving associated with a particularloan tend to materialize in different time periods.
As a measure of what we call bank "efficiency," we consider the accountingvalue of a bank's net interest income divided by total assets (TA), or the netinterest margin {NIM). Bank "profitability" is a bank's before-tax profits {BTP)divided by total assets. Profitability could also be measured by the return on

Demirgiif-Kunt and Huizinga 381
equity as opposed to the return on assets. It is well known that, ceteris paribus, abank with a higher equity ratio will have a higher return on assets and a lowerreturn on equity than a bank with a lower equity ratio. The problem in somedeveloping countries is that banks operate with extremely low equity capital,often supported by implicit state guarantees, which inflates their return on eq-uity. Using unadjusted returns on equity may then be more distortionary thanusing returns on assets. Ideally, we should use risk-adjusted returns on equity,but since these are not available, we analyze returns on assets after controllingfor the banks' equity ratio. We do this by entering the equity ratio as an indepen-dent variable in the profit regression. Thus, by straightforward accounting,
BTA = ATP^ TX_( ' TA ~ TA+TA
where ATP is after-tax profits. From the bank's income statement, before-taxprofits divided by total assets further satisfies the following accounting identity:
n\ BTA KJTAA^NI1 OV LLP
TA TA TA TA
where Nil is noninterest income, OV is overhead, and LLP is loan loss provi-sioning. NII/TA reflects the fact that many banks also engage in nonlending ac-tivities, such as investment banking and brokerage services, OV/TA accounts forthe bank's entire overhead associated with all of its activities, and LLP FT A mea-sures actual provisioning for bad debts.
Although the net interest margin can be interpreted as a rough index of bankefficiency, this does not mean that its reduction always signals improved effi-ciency. A reduction in the net interest margin can, for example, reflect a reduc-tion in bank taxation or, alternatively, a higher loan default rate. In the firstinstance the reduction in the net interest margin may reflect the improved func-tioning of the banking system, while in the second case the opposite may be true.Also, variation in an accounting ratio, such as the net interest margin, may reflectdifferences in net interest income (the numerator) or differences in, say, nonlendingassets (a component of the denominator).
In the data set the accounting data are organized so as to be comparable inter-nationally. However, differences in accounting conventions regarding the valua-tion of assets, loan loss provisioning, hidden reserves, and so on may remain.Vittas (1991) reviews the pitfalls in interpreting bank operating ratios. Account-ing data also tend to reflect economic realities with a long lag so that they are notable to flag pending banking crises, such as those that have recently occurred inSoutheast Asia.
This article focuses on accounting measures of income and profitability asinvestors equalize (risk-adjusted) financial returns on bank stocks in the absenceof prohibitive barriers. Gorton and Rosen (1995) and Schranz (1993) also focus
382 THE WORLD BANK ECONOMIC REVIEW, VOL 13, NO. 2
on accounting measures of profitability when examining managerial entrench-ment and bank takeovers.
The above accounting identity (equation 2) suggests a useful decomposition ofthe realized interest spread—the net interest margin—into its constituent parts:noninterest income, overhead, taxes, loan loss provisions, and after-tax bankprofits. Hanson and Rocha (1986) take this approach, with some modifications.As a first step to analyzing the data, in section HI we provide an accountingbreakdown of the net interest margin for individual countries and for selectedaggregates. Although it may be misleading to compare accounting ratios withoutcontrolling for differences in the macroeconomic environment in which banksoperate and the differences in their business, product mix, and leverage, thesebreakdowns are still a useful initial indicator of differences across countries.
Next, controlling for bank characteristics and the macroeconomic environ-ment, we provide an economic analysis of the determinants of the interest andprofitability variables—the net interest margin and before-tax profits divided bytotal assets. This empirical work offers insights into how bank customers andbanks themselves are affected by these variables. The net interest margin regres-sions tell us how the spread determinants affect the combined welfare of deposi-tors and lenders. The relationship between the interest spread and a bank's cor-porate taxes, for instance, reveals the extent to which a bank is able to shift itstax bill forward to its depositors and lenders.
Generally, taxes and other variables can affect interest rates as well as thevolume of loans and deposits. In the short term the major effects may comethrough pricing changes, in which case the net interest margin and before-taxprofits as a share of total assets immediately reveal easily interpreted welfareconsequences for banks and their customers. With market imperfections in theform of credit rationing or imperfect competition in credit markets, changes inquantities generally have first-order welfare implications independent of changesin prices. We do not, however, evaluate changes in quantities in this article. Lastly,the before-tax profit regressions show how spread determinants affect bankshareholders.
The regression analysis starts from the following equation:
(3) lijt = ct0 + a, Biit + pVX,, + y,T, + 8,0, + e*
where lijt is the dependent variable (either the NIM or BTP/TA) for bank i incountry / at time t, Bijt are characteristics of bank i in country / at time f, X,-, arecharacteristics of country / at time f, T, and C, are time and country dummyvariables, and £y, is a white-noise error term. We estimate several specificationsof equation 2 including different bank and country variables.
n. DATA
In this study we use income statement and balance sheet data of commercialbanks from the BankScope database provided by IBCA. IBCA'S coverage is compre-
Demirgtif-Kunt and Huizinga 383
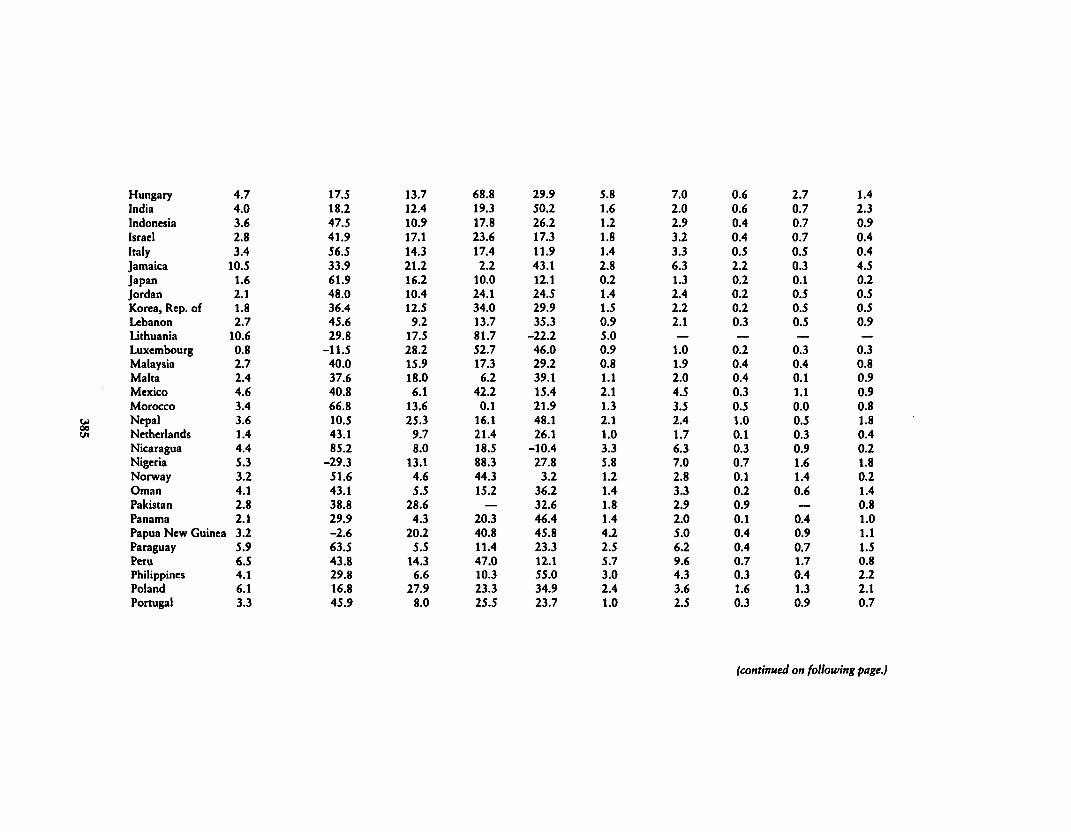
hensive in most countries, accounting for 90 percent of all bank assets. We beginwith all commercial banks worldwide, with the exception of France, Germany,and the United States, for which we include only several hundred commercial bankslisted as "large." To ensure reasonable coverage for individual countries, we in-clude only countries with at least three banks for a given year. We end up with adata set that includes 80 countries during the years 1988-95, with about 7,900individual commercial bank observations. This data set includes all OECD coun-tries, as well as many developing countries and transition economies (table 1).
Several countries, such as Luxembourg, the Netherlands, and Egypt, have anet interest margin close to 1 percent (column 2 of table 1). This is the low end ofthe distribution. Egypt's low net interest margin can be explained by a predomi-nance of low-interest directed credits by the large state banking sector. Gener-ally, developing countries, and especially Latin American countries, such as Ar-gentina, Brazil, Costa Rica, Ecuador, and Jamaica, have relatively large spreads.This is also true for certain Eastern European countries, such as Lithuania andRomania.
Columns 3-6 in table 1 break down the net interest income into its four com-ponents: overhead minus noninterest income, taxes, loan loss provisioning, andnet profits. Taxes as a share of net interest income (column 4) reflect the explicittaxes that banks pay (mostly corporate income taxes). Banks also face implicittaxation because of reserve and liquidity requirements and other restrictions onlending that come through directed or subsidized credit policies. These indirectforms of taxation directly lower the net interest income rather than the tax vari-able. Nonetheless, the tax variable indicates that there is considerable interna-tional variation in the explicit taxation of commercial banks. Several countries inEastern Europe impose high explicit taxes on banking. (For example, taxes as apercentage of net interest income are only 17.5 in Lithuania and 13.7 in Hungarycompared with 26.2 in Romania, 83.3 in Russia, and 23.2 in the Czech Repub-lic.) The lowest share of taxes in net interest income is 0 for Qatar, where there isno significant taxation of banking. For some countries, such as Norway, Swe-den, and Costa Rica, low tax shares reflect the tax deductibility of bad debts,which are plentiful.
Loan loss provisioning as a share of net interest income is a direct measure ofdifferences in credit quality across countries (column 5). It also reflects differ-ences in provisioning regulations. This variable is high for some Eastern Euro-pean countries. It is also high for some industrial countries, such as France andthe Nordic countries. The fourth component of net interest income is net profits(column 6). As a residual, net profits as a share of net interest income reflect theextent to which the net interest margin translates into net-of-tax profitability.
The remaining columns in table 1 tabulate the various accounting ratios (rela-tive to total assets) in the accounting identity (equation 2). Noninterest income asa share of total assets reveals the importance of fee-based services for banks indifferent countries (column 7). Banks in Eastern Europe—for example, those inEstonia, Hungary, and Russia—seem to rely heavily on fee-based operations.
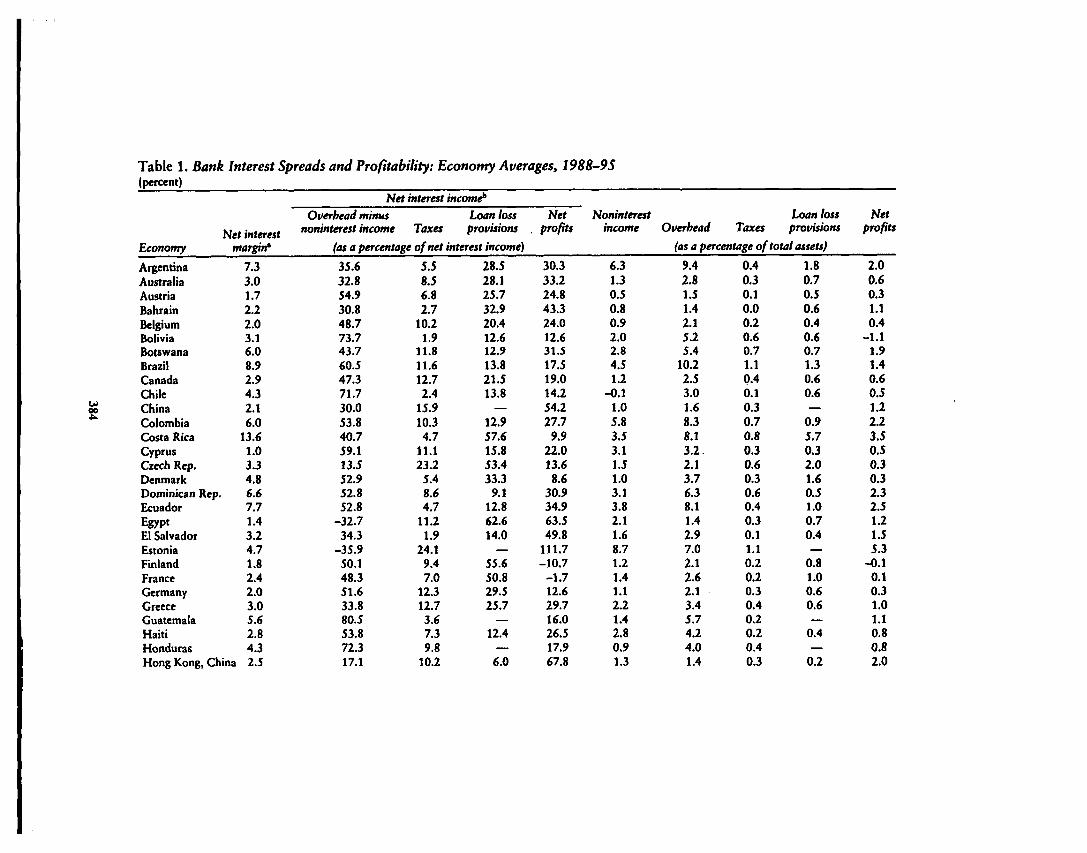
Table 1. Bank Interest Spreads and Profitability: Economy Averages, 1988-95(percent)
2
Economy
ArgentinaAustraliaAustriaBahrainBelgiumBoliviaBotswanaBrazilCanadaChileChinaColombiaCosta RicaCyprusCzech Rep.Denmark
Net interestmargin*
7.33.01.72.22.03.16.08.92.94.32.16.0
13.61.03.34.8
Dominican Rep. 6.6EcuadorEgyptEl SalvadorEstoniaFinlandFranceGermanyGreeceGuatemalaHaitiHonduras
7.71.43.24.71.82.42.03.05.62.84.3
Hong Kong, China 2.5
J
Overhead minus
Net interest income*
noninterest income TaxesLoan lossprovisions
(as a percentage of net interest income)
35.632.854.930.848.773.743.760.547.371.730.053.840.759.113.552.952.852.8
-32.734.3
-35.950.148.351.633.880.553.872.317.1
5.58.56.82.7
10.21.9
11.811.612.72.4
15.910.34.7
11.123.2
5.48.64.7
11.21.9
24.19.47.0
12.312.73.67.39.8
10.2
28.528.125.732.920.412.612.913.821.513.8
—12.957.615.853.433.3
9.112.862.614.0
—55.650.829.525.7
12.4—
6.0
Net. profits
30.333.224.843.324.012.631.517.519.014.254.227.7
9.922.013.68.6
30.934.963.549.8
111.7-10.7
-1.712.629.716.026.517.967.8
Noninterestincome
6.31.30.50.80.92.02.84.51.2
-0.11.05.83.53.11.51.03.13.82.11.68.71.21.41.12.21.42.80.91.3
Overhead TaxesLoan lossprovisions
(as a percentage of total assets)
9.42.81.51.42.15.25.4
10.22.53.01.68.38.13.2.2.13.76.38.11.42.97.02.12.62.13.45.74.24.01.4
0.40.30.10.00.20.60.71.10.40.10.30.70.80.30.60.30.60.40.30.11.10.20.20.30.40.20.20.40.3
1.80.70.50.60.40.60.71.30.60.6—
0.95.70.32.01.60.51.00.70.4—
0.81.00.60.6
0.4—
0.2
Netprofits
2.00.60.31.10.4
-1.11.91.40.60.51.22.23.50.50.30.32.32.51.21.55.3
-0.10.10.31.01.10.80.82.0
00VI
HungaryIndiaIndonesiaIsraelItalyJamaicaJapanJordanKorea, Rep. ofLebanonLithuaniaLuxembourgMalaysiaMaltaMexicoMoroccoNepalNetherlandsNicaraguaNigeriaNorwayOmanPakistanPanamaPapua New GuineaParaguayPeruPhilippinesPolandPortugal
4.74.03.62.83.4
10.51.62.11.82.7
10.60.82.72.44.63.43.61.44.45.33.24.12.82.13.25.96.54.16.13.3
17.518.247.541.956.533.961.948.036.445.629.8
-11.540.037.640.866.810.543.185.2
-29.351.643.138.829.9-2.663.543.829.816.845.9
13.712.410.917.114.321.216.210.412.5
9.217.528.215.918.06.1
13.625.3
9.78.0
13.14.65.5
28.64.3
20.25.5
14.36.6
27.98.0
68.819.317.823.617.42.2
10.024.134.013.781.752.717.3
6.242.2
0.116.121.418.588.344.315.2
20.340.811.447.010.323.325.5
29.950.226.217.311.943.112.124.529.935.3
-22.246.029.239.115.421.948.126.1
-10.427.8
3.236.232.646.445.823.312.155.034.923.7
5.81.61.21.81.42.80.21.41.50.95.00.90.81.12.11.32.11.03.35.81.21.41.81.44.22.55.73.02.41.0
7.02.02.93.23.36.31.32.42.22.1
1.01.92.04.53.52.41.76.37.02.83.32.92.05.06.29.64.33.62.5
0.60.60.40.40.52.20.20.20.20.3_
0.20.40.40.30.51.00.10.30.70.10.20.90.10.40.40.70.31.60.3
2.70.70.70.70.50.30.10.50.50.5_
0.30.40.11.10.00.50.30.91.61.40.6_
0.40.90.71.70.41.30.9
1.42.30.90.40.44.50.20.50.50.9_
0.30.80.90.90.81.80.40.21.80.21.40.81.01.11.50.82.22.10.7
(continued on following page.)
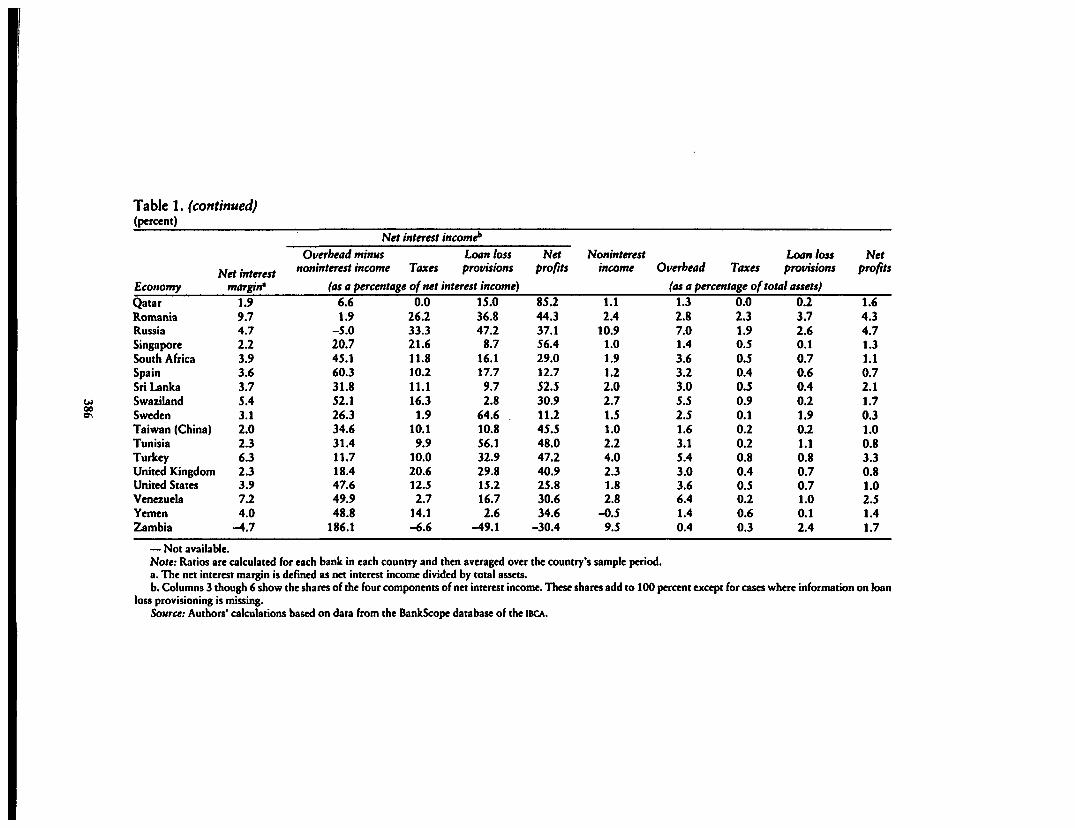
Table 1. (continued)(percent)
W00
EconomyQatarRomaniaRussiaSingaporeSouth AfricaSpainSri LankaSwazilandSwedenTaiwan (China)TunisiaTurkeyUnited KingdomUnited StatesVenezuelaYemenZambia
Net interestmargin*
1.99.74.72.23.93.63.75.43.12.02.36.32.33.97.24.0
-4.7
Overhead minmNet interest income*t
noninterest income TaxesLoan lossprovisions
(as a percentage of net interest income)6.61.9
-5.020.745.160.331.852.126.334.631.411.718.447.649.948.8
186.1
0.026.233.321.611.810.211.116.3
1.910.19.9
10.020.612.52.7
14.1-6.6
15.036.847.2
8.716.117.79.72.8
64.610.856.132.929.815.216.72.6
-49.1
Netprofits
85.244.337.156.429.012.752.530.911.245.548.047.240.925.830.634.6
-30.4
Noninterestincome
1.12.4
10.91.01.91.22.02.71.51.02.24.02.31.82.8
-0.59.5
Overhead TaxesLoan lossprovisions
(as a percentage of total assets)1.32.87.01.43.63.23.05.52.51.63.15.43.03.66.41.40.4
0.02.31.90.50.50.40.50.90.10.20.20.80.40.50.20.60.3
0.23.72.60.10.70.60.40.21.90.21.10.80.70.71.00.12.4
Netprofits
1.64.34.71.31.10.72.11.70.31.00.83.30.81.02.51.41.7
— Not available.Note: Ratios are calculated for each bank in each country and then averaged over the country's sample period.a. The net interest margin is defined as net interest income divided by total assets.b. Columns 3 though 6 show the shares of the four components of net interest income. These shares add to 100 percent except for cases where information on loan
loss provisioning is missing.Source: Authors' calculations based on data from the BankScope database of the IBCA.
Demirguf-Kunt and Huizmga 387
This is also the case in some Latin American countries, such as Argentina, Brazil,Colombia, and Peru, and in a few African countries, such as Nigeria andZambia.
Overhead as a share of total assets reveals variations in operating costs acrossbanking systems (column 8). This variable reflects variations in employment andin wage levels. Despite high wages, overhead as a share of total assets appears tobe lowest at around 1 percent for high-income countries, such as Japan and Lux-embourg. It is notably high at 3.6 percent for the United States, perhaps reflect-ing the proliferation of banks and bank branches because of banking restrictions.
Jamaica, Lithuania, and Romania stand out with high tax-to-asset ratios ofaround 2 percent (column 9). Loan loss provisioning, proxied by loan loss provi-sioning as a share of total assets, is equally high in Eastern Europe and in somedeveloping countries (column 10). Finally, net profits divided by total assets alsotend to be relatively high in developing countries (column 11).
Table 2 presents statistics on interest spreads and profitability for selectedaggregates. The first breakdown is by ownership; a bank is said to be foreign-owned if 50 percent or more of its shares are owned by foreign residents. There isonly a small difference in the net interest margin for domestic banks (3.7 percent)and foreign banks (2.9 percent). This small difference, however, masks the factthat foreign banks tend to achieve higher interest margins in developing coun-tries and lower interest margins in industrial countries.1 This may reflect the factthat foreign banks are less subject to credit allocation rules and have technicaladvantages (in developing countries), but also have distinct informational disad-vantages relative to domestic banks (everywhere).
Foreign banks pay somewhat lower taxes than domestic banks (column 4).This gap may reflect differences in the tax rules governing domestic and foreignbanks, as well as the ability of foreign banks to shift profits internationally tominimize their global tax bill. Foreign banks also have relatively low provision-ing, as indicated by loan loss provisioning as a share of total assets, which isconsistent with the view that foreign banks generally do not engage in retailbanking operations.
The next breakdown is by bank size. For countries with at least 20 banks,large banks are defined as the 10 largest banks according to the value of theirassets. Large banks tend to have lower margins and profits and smaller overheads.They also pay relatively low direct taxes and have lower loan loss provisioning.
Table 2 also considers bank groupings by national income levels and loca-tion.2 Breaking down the data into four income levels, we see that the net interestmargin is highest for countries in the middle-income groups. Banks operating inmiddle-income countries also have the highest values for overhead, taxes, andloan loss provisioning as shares of total assets. Net profits as a share of total
1. See Claessens, Demirguc.-Kunt, and Huizinga (1997) for more detailed information on the averagespreads of domestic and foreign banks for different groupings of countries by income. That article alsoconsiders how entry by foreign banks affects the interest spreads and operating costs of domestic banks.
2. For country groupings by income, see World Bank (1996).
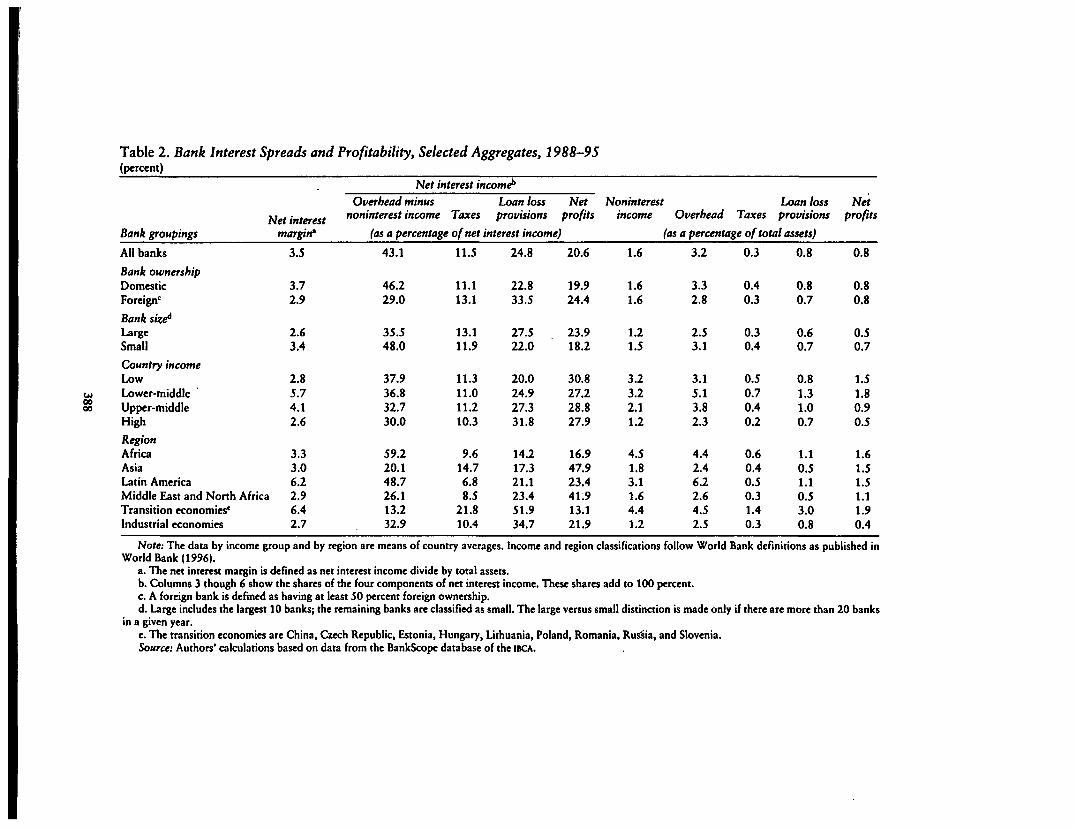
Table 2. Bank Interest Spreads and Profitability, Selected Aggregates, 1988-95(percent)
GO00
Bank groupings
All banks
Bank ownershipDomesticForeign'
Bank size6
LargeSmall
Country incomeLowLower-middleUpper-middleHigh
RegionAfricaAsiaLatin AmericaMiddle East and NorthTransition economies'Industrial economies
Net interestmargin*
3.5
3.72.9
2.63.4
2.85.74.12.6
3.33.06.2
Africa 2.96.42.7
Net interest income*
Overhead minusnoninterest income Taxes
Loan lossprovisions
Netprofits
(as a percentage of net interest income)
43.1
46.229.0
35.548.0
37.936.832.730.0
59.220.148.726.113.232.9
11.5
11.113.1
13.111.9
11.311.011.210.3
9.614.76.88.5
21.810.4
24.8
22.833.5
27.522.0
20.024.927.331.8
14.217.321.123.451.934.7
20.6
19.924.4
23.918.2
30.827.228.827.9
16.947.923.441:913.121.9
Noninterestincome
i
1.6
1.61.6
1.21.5
3.23.22.11.2
4.51.83.11.64.41.2
Overhead TaxesLoan lossprovisions
(as a percentage of total assets)
3.2
3.32.8
2.53.1
3.15.13.82.3
4.42.46.22.64.52.5
0.3
0.40.3
0.30.4
0.50.70.40.2
0.60.40.50.31.40.3
0.8
0.80.7
0.60.7
0.81.31.00.7
1.10.51.10.53.00.8
Netprofits
0.8
0.80.8
0.50.7
1.51.80.90.5
1.61.51.51.11.90.4
Note: The data by income group and by region are means of country averages. Income and region classifications follow World Bank definitions as published inWorld Bank (1996).
a. The net interest margin is defined as net interest income divide by total assets.b. Columns 3 though 6 show the shares of the four components of net interest income. These shares add to 100 percent.c. A foreign bank is defined as having at least 50 percent foreign ownership.d. Large includes the largest 10 banks; the remaining banks are classified as small. The large versus small distinction is made only if there are more than 20 banks
in a given year.e. The transition economies are China, Czech Republic, Estonia, Hungary, Lithuania, Poland, Romania, Russia, and Slovenia.Source: Authors' calculations based on data from the BankScope database of the IBCA.
Demtrgiif-Kunt and Huizmga 389
assets tends to be highest for banks operating in lower-income countries. Banksoperating in higher-income countries, instead, achieve the lowest net interestmargins, and they face the lowest values of overhead, taxes, loan loss provision-ing, and net profits as shares of total assets.
The breakdown by region reveals that the net interest margin is highest forbanks operating in the transition economies at 6.4 percent and is also high inLatin America at 6.2 percent. It is lowest for banks operating in industrial coun-tries at 2.7 percent. The transition economies further stand out with high valuesof overhead, taxes, loan loss provisioning, and net profits as shares of total as-sets. Banks operating in industrial countries have the lowest ratio of net profits tototal assets at 0.4 percent, probably because of the high level of competition inbanking services.
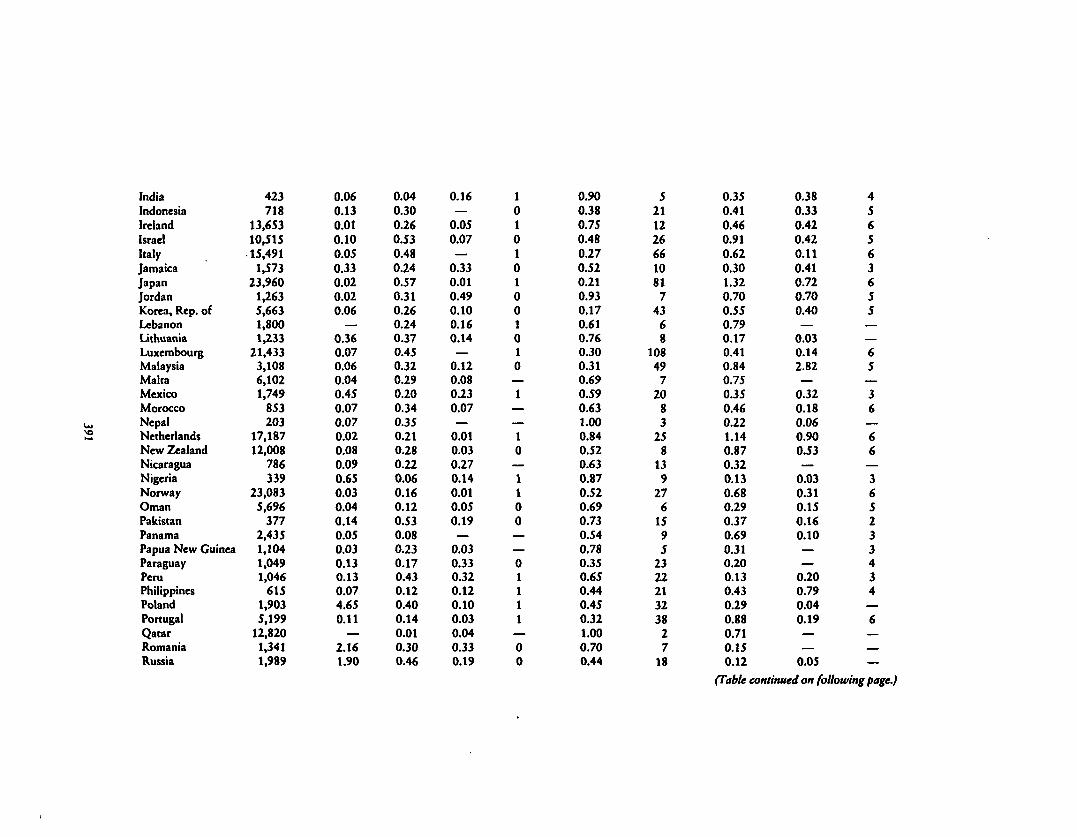
Table 3 provides information on some of the macroeconomic and institutionalvariables used in the regression analysis. The data are for 1995 or the most recentyear available. The tax rate is computed on a bank-by-bank basis as taxes paiddivided by before-tax profits. The figure reported in the table is the average forall banks in the country in 1995. Reserves divided by deposits are the bankingsystem's aggregate central bank reserves divided by aggregate banking systemdeposits. Actual reserve holdings reflect required and excess reserves. Reservesare generally remunerated at less-than-market rates, and therefore actual reservesmay be a reasonable proxy for required reserves, as averaged over the differentdeposit categories. For several developing countries—Botswana, Costa Rica,Greece, and Jordan—the reserve ratio is above 40 percent, indicating substantialfinancial repression. In contrast, this ratio is low in Belgium, France, and Luxem-bourg at 0.01.
The deposit insurance variable is a dummy variable that takes on a value of 1if there is an explicit deposit insurance scheme (with defined insurance premiaand insurance coverage) and a value of 0 otherwise. Even if there is an explicitdeposit insurance scheme, however, the ex post insurance coverage may prove tobe higher than the de jure coverage, if the deposit insurance agency chooses toguarantee all depositors. With a value of 0 there is no explicit deposit insurance,even if the authorities offer some type of implicit insurance.
Next, table 3 presents some indicators of the structure of financial markets.The concentration variable is defined as the ratio of the assets of the three largestbanks to the assets of the total banking sector. As is well known, the concentra-tion of the U.S. banking market is low, at 16 percent, compared with values ofabout 50 percent for France and Germany. Note, however, that the U.S. figuremay understate the concentration ratio in individual banking markets, which areprotected from outside competition by interstate banking and branching restric-tions. The number of banks in the table reflects the number of banks in the dataset with complete information. The ratio of bank assets to GDP is defined as thetotal assets of the deposit-money banks divided by GDP. This ratio reflects thebanking sector's overall level of development. The ratio of stock market capitali-zation to GDP measures the extent of stock market development. Developing coun-
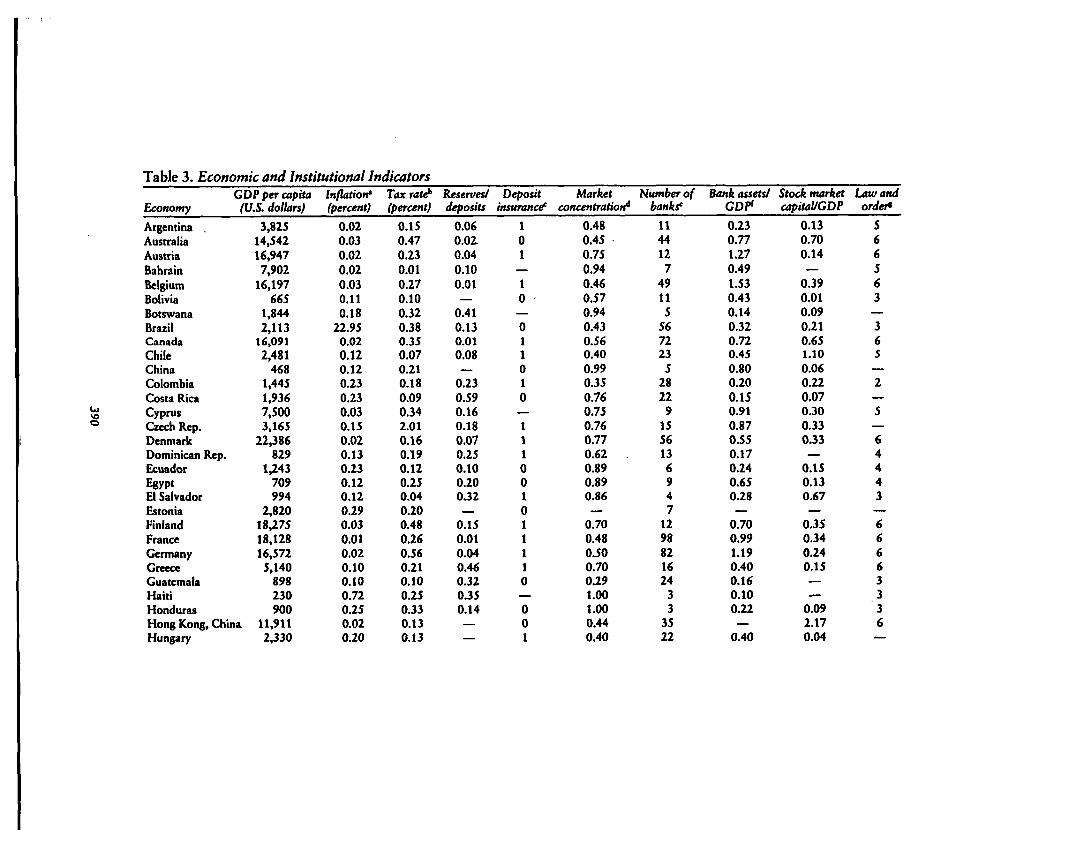
Table 3. Economic and Institutional Indicators
Economy
Argentina .AustraliaAustriaBahrainBelgiumBoliviaBotswanaBrazilCanadaChileChinaColombiaCosta RicaCyprusCzech Rep.Denmark
GDP per capita(U.S. dollars)
3,82514,54216,9477,902
16,197665
1,8442,113
16,0912,481
4681,4451,9367,5003,165
22,386Dominican Rep. 829EcuadorEgyptEl SalvadorEstoniaFinlandFranceGermanyGreeceGuatemalaHaitiHonduras
1,243709994
2,82018,27518,12816,5725,140
898230900
Hong Kong, China 11,911Hungary 2,330
Inflation'(percent)
0.020.030.020.020.030.110.18
22.950.020.120.120.230.230.030.150.020.130.230.120.120.290.030.010.020.100.100.720.250.020.20
Taxrattf'(percent)
0.150.470.230.010.270.100.320.380.350.070.210.180.090.342.010.160.190.120.250.040.200.480.260.560.210.100.250.330.130.13
Reserves/deposits
0.060.010.040.100.01
0.410.130.010.08
0.230.590.160.180.070.250.100.200.32_
0.150.010.040.460.320.350.14——
Depositinsurance'
101
—10—011010—111001011110
001
Marketconcentration*
0.480.450.750.940.460.570.940.430.560.400.990.350.760.750.760.770.620.890.890.86
0.700.480.500.700.291.001.000.440.40
Number ofbanks'
114412
749115
567223
52822
91556136947
1298821624
33
3522
Bank assets!GDP1
0.230.771.270.491.530.430.140.320.720.450.800.200.150.910.870.550.170.240.650.28—
0.700.991.190.400.160.100.22—
0.40
Stock marketcapital/GDP
0.130.700.14—
0.390.010.090.210.651.100.060.220.070.300.330.33—
0.150.130.67—
0.350.340.240.15——
0.092.170.04
Law andorder*
566563
—365
—2—5—64443—66663336
—
IndiaIndonesiaIrelandIsraelItalyJamaicaJapanJordanKorea, Rep. ofLebanonLithuaniaLuxembourgMalaysiaMaltaMexicoMoroccoNepalNetherlandsNew ZealandNicaraguaNigeriaNorwayOmanPakistanPanamaPapua New GuineaParaguayPeruPhilippinesPolandPortugalQatarRomaniaRussia
423718
13,65310,51515,491
1,57323,960
1,2635,6631,8001,233
21,4333,1086,1021,749
853203
17,18712,008
786339
23,0835,696
3772,4351,1041,0491,046
6151,9035,199
12,8201,3411,989
0.060.130.010.100.050.330.020.020.06
—0.360.070.060.040.450.070.070.020.080.090.650.030.040.140.050.030.130.130.074.650.11
—2.161.90
0.040.300.260.530.480.240.570.310.260.240.370.450.320.290.200.340.350.210.280.220.060.160.120.530.080.230.170.430.120.400.140.010.300.46
0.16—
0.050.07—
0.330.010.490.100.160.14—
0.120.080.230.07—
0.010.030.270.140.010.050.19—
0.030.330.320.120.100.030.040.330.19
1010101001010—1
—10
—1100——01111
—00
0.900.380.750.480.270.520.210.930.170.610.760.300.310.690.590.631.000.840.520.630.870.520.690.730.540.780.350.650.440.450.321.000.700.44
5211226661081
74368
10849
720
83
258
139
276
1595
2322213238
27
18
0.350.410.460.910.620.301.320.700.550.790.170.410.840.750.350.460.221.140.870.320.130.680.290.370.690.310.200.130.430.290.880.710.150.12
0.380.330.420.420.110.410.720.700.40—
0.030.142.82—
0.320.180.060.900.53—
0.030.310.150.160.10
—0.200.790.040.19—
0.05
456563655
65
36
66
365233434
6
(Table continued on following page.)
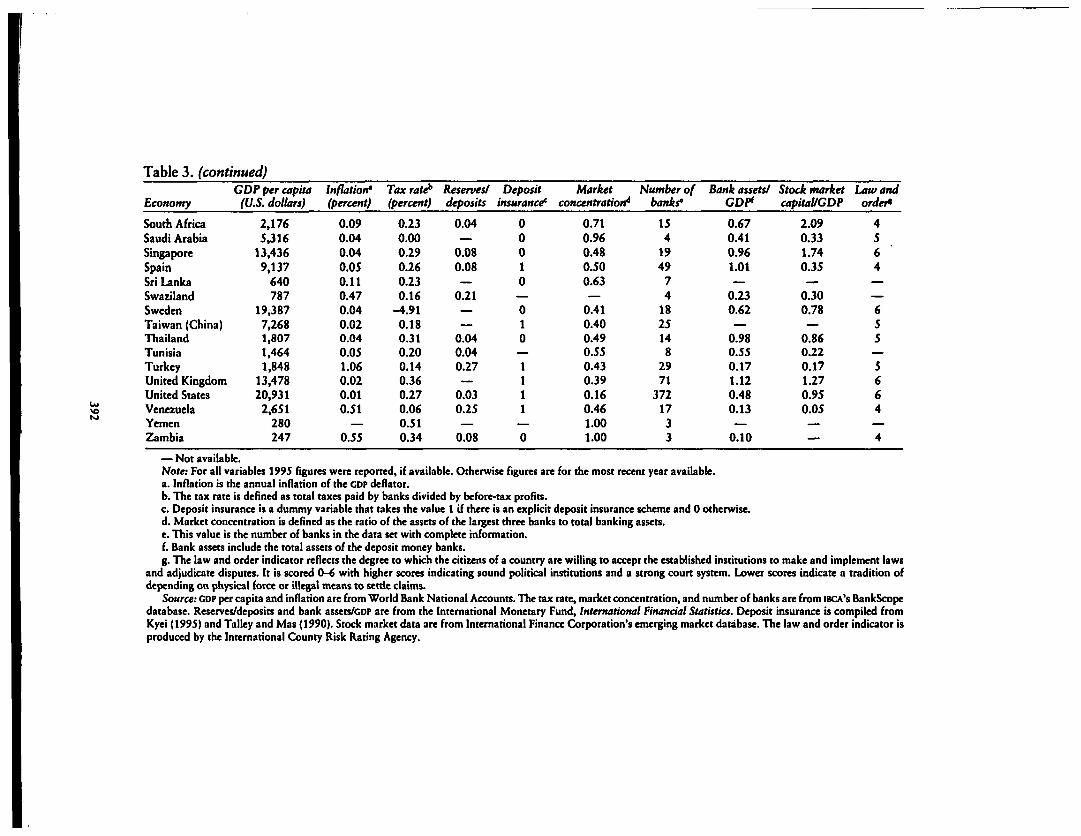
Table 3. (continued)
u>
Economy
South AfricaSaudi ArabiaSingaporeSpainSri LankaSwazilandSwedenTaiwan (China)ThailandTunisiaTurkeyUnited KingdomUnited StatesVenezuelaYemenZambia
GDP per capita(U.S. dollars)
2,1765,316
13,4369,137
640787
19,3877,2681,8071,4641,848
13,47820,9312,651
280247
Inflation*(percent)
0.090.040.040.050.110.470.040.020.040.051.060.020.010.51
0.55
Tax rate*(percent)
0.230.000.290.260.230.16
-4.910.180.310.200.140.360.270.060.510.34
Reserves!deposits
0.04
0.080.08
0.21——
0.040.040.27—
0.030.25
0.08
Depositinsurance*
00010
010—1111
0
Marketconcentration*
0.710.960.480.500.63—
0.410.400.490.550.430.390.160.461.001.00
Number ofbanks'
154
1949
74
1825148
2971
3721733
Bank assets/GDP1
0.670.410.961.01—
0.230.62—
0.980.550.171.120.480.13
0.10
Stock marketcapital/GDP
2.090.331.740.35—
0.300.78—
0.860.220.171.270.950.05
—
Law andorder*
4564——655
—5664
4
— Not available.Note: For all variables 1995 figures were reported, if available. Otherwise figures are for the most recent year available.a. Inflation is the annual inflation of the GDP deflator.b. The tax rate is defined as total taxes paid by banks divided by before-tax profits.c. Deposit insurance is a dummy variable that takes the value 1 if there is an explicit deposit insurance scheme and 0 otherwise.d. Market concentration is defined as the ratio of the assets of the largest three banks to total banking assets.e. This value is the number of banks in the data set with complete information.f. Bank assets include the total assets of the deposit money banks.g. The law and order indicator reflects the degree to which the citizens of a country are willing to accept the established institutions to make and implement laws
and adjudicate disputes. It is scored 0-6 with higher scores indicating sound political institutions and a strong court system. Lower scores indicate a tradition ofdepending on physical force or illegal means to settle claims.
Source: GDP per capita and inflation are from World Bank National Accounts. The tax rate, market concentration, and number of banks are from IBCA'S BankScopedatabase. Reserves/deposits and bank assets/GDP are from the International Monetary Fund, International Financial Statistics. Deposit insurance is compiled fromKyei (1995) and Talley and Mas (1990). Stock market data are from International Finance Corporation's emerging market database. The law and order indicator isproduced by the International County Risk Rating Agency.
Demirgiif-Kunt and Huizinga 393
tries tend to have lower bank-to-GDP and capitalization-to-GDP ratios, with somenotable exceptions. Malaysia, South Africa, and Thailand, for instance, haverelatively high ratios for both variables.
The final column in the table provides an index of law and order, which is oneof the institutional variables used in the regression analysis. This variable is scaledfrom 0 to 6, with higher scores indicating sound political institutions and a strongcourt system. Lower scores reflect a tradition in which physical force or illegalmeans are used to settle claims. The table shows considerable variation amongcountries in the sample.
HI. EMPIRICAL RESULTS
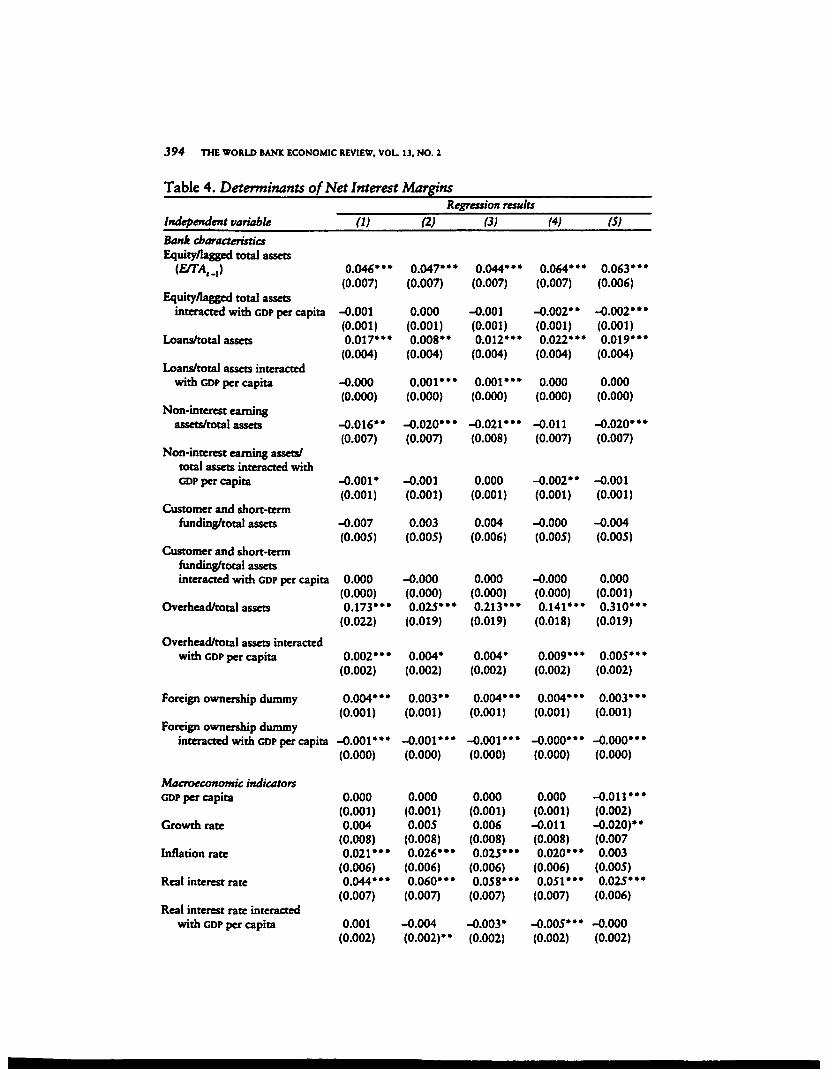
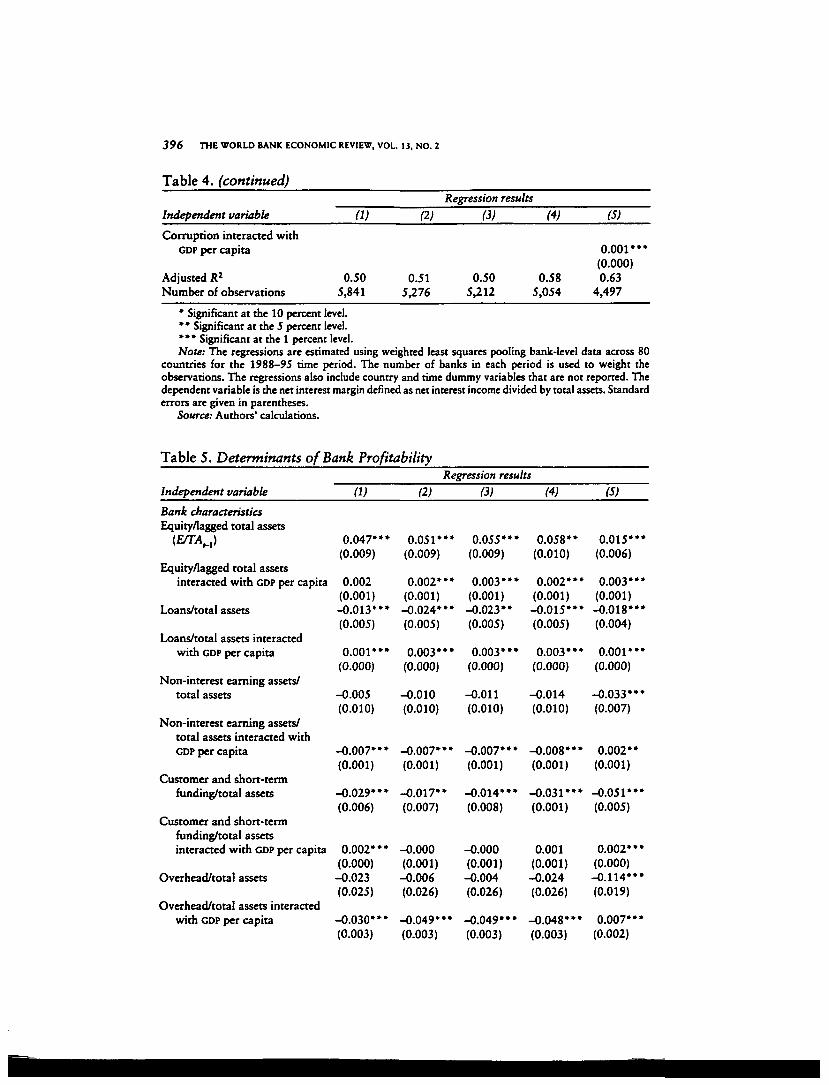
Tables 4 and 5 report the results of regressions of the net interest margin andbefore-tax profits as a share of total assets, respectively. Measuring profitabilityusing the return on equity (as opposed to using the return on assets and control-ling for equity ratios as we do here) does not lead to significantly different resultsand thus is not reported. All regressions include country and year fixed effects.The tables report several specifications, the basic one including a set of bank andmacroeconomic indicators as regressors. These are important control variablesto which we subsequently add the taxation variables, the deposit insurance in-dex, the financial structure variables, and the legal and institutional indicators.We drop some variables from these two regressions because we want to ensurethat banks from a reasonable number of countries are included. The estimationtechnique is weighted least squares, with the weight being the inverse of the num-ber of banks for the country in a given year. This weighting corrects for the factthat the number of banks varies considerably across countries.
Bank Characteristics and Macroeconomic Indicators
The first bank characteristic is the book value of equity divided by total assetslagged one period (E/TAM). We lag total assets by one period to correct for thefact that profits, if not paid out in dividends, have a contemporaneous impact onbank equity. Buser, Chen, and Kane (1981) examine the theoretical relationshipbetween bank profitability and bank capitalization. They find that banks gener-ally have an interior optimal capitalization ratio in the presence of deposit insur-ance. Banks with a high franchise value, reflecting costly bank entry, have incen-tives to remain well-capitalized and to engage in prudent lending behavior (seeCaprio and Summers 1993 and Stiglitz and Uy 1996). Berger (1995b) providesempirical evidence that U.S. banks show a positive relationship between bankprofitability and capitalization, although the evidence is not conclusive. The au-thor notes that well-capitalized firms face lower expected bankruptcy costs forthemselves and their customers, thereby reducing their cost of funding.
The basic specification (column 1 in tables 4 and 5) confirms that there is apositive relationship between E/TA^ and net interest income and bank profitabil-ity. In the regressions this variable is also interacted with GDP per capita (measured
394 THE WORLD BANK ECONOMIC REVIEW, VOL. 13. NO. 2
Table 4. Determinants of Net Interest Margins
Independent variable
Bank characteristicsEquity/lagged total assets
(ETA,.,)
Equity/lagged total assetsinteracted with GDP per capita
Loans/total assets
Loans/total assets interactedwith GDP per capita
Non-interest earningassets/total assets
Non-interest earning assets/total assets interacted withGDP per capita
Customer and short-termfunding/total assets
Customer and short-termfunding/total assetsinteracted with GDP per capita
Overhead/total assets
Overhead/total assets interactedwith GDP per capita
Foreign ownership dummy
Foreign ownership dummyinteracted with GDP per capita
Macroeconotnic indicatorsGDP per capita
Growth rate
Inflation rate
Real interest rate
Real interest rate interactedwith GDP per capita
(1)
0.046* • •(0.007)
-0.001(0.001)0.017*"
(0.004)
-0.000(0.000)
- 0 . 0 1 6 "(0.007)
-0.001*(0.001)
-0.007(0.005)
0.000(0.000)0 .173"*
(0.022)
0.002* **(0.002)
0.004* **(0.001)
- 0 . 0 0 1 " *(0.000)
0.000(0.001)0.004
(0.008)0.021 **•
(0.006)0.044"*
(0.007)
0.001(0.002)
Regression results
(2)
0.047* **(0.007)
0.000(0.001)0 .008"
(0.004)
0.001 ***(0.000)
-0.020* »*(0.007)
-0.001(0.001)
0.003(0.005)
-0.000(0.000)0.025*"
(0.019)
0.004*(0.002)
0 .003"(0.001)
- 0 . 0 0 1 * "(0.000)
0.000(0.001)0.005
(0.008)0.026* **
(0.006)0.060* **
(0.007)
-0.004(0.002)"
(3)
0.044* **(0.007)
-0.001(0.001)0.012* **
(0.004)
0.001* **(0.000)
-0.021 **»(0.008)
0.000(0.001)
0.004(0.006)
0.000(0.000)0.213*"
(0.019)
0.004*(0.002)
0.004* **(0.001)
-0.001* **(0.000)
0.000(0.001)0.006
(0.008)0.025* **
(0.006)0.058*"
(0.007)
-0.003*(0.002)
(4)
0.064* **(0.007)
-0.002* *(0.001)0.022*"
(0.004)
0.000(0.000)
-0.011(0.007)
- 0 . 0 0 2 "(0.001)
-0.000(0.005)
-0.000(0.000)0.141*"
(0.018)
0.009* **(0.002)
0.004* *»(0.001)
-0.000* **(0.000)
0.000(0.001)-0.011(0.008)0.020* **
(0.006)0.051*"
(0.007)
-O.005*"(0.002)
(5)
0.063"*(0.006)
-0.002* **(0.001)0.019"*
(0.004)
0.000(0.000)
-0.020* **(0.007)
-0.001(0.001)
-0.004(0.005)
0.000(0.001)0.310"*
(0.019)
0.005*"(0.002)
0.003* **(0.001)
-0.000* **(0.000)
- 0 . 0 1 1 * "(0.002)-0.020)* *(0.0070.003
(0.005)0.025* **
(0.006)
-0.000(0.002)
Demirgiic-Kunt and Huizmga 395
Table 4. (continued)
Independent variable
TaxationReserves
Reserves interacted with GDPper capita
Tax rate
Tax rate interacted with GDPper capita
Deposit insuranceDeposit insurance dummy
Financial structureBank assets/GDP
(VRegression results
(2)
-0.076***(0.015)
0.011"*(0.003)0.016"*
(0.002)
-0.001 • • •(0.000)
(3)
-0 .076*"(0.015)
0.011*"(0.003)0.015"*
(0.002)
-0.001* »*(0.000)
-0.009***(0.003)
(4)
-0.024*(0.016)
0.009***(0.003)0.017*"
(0.002)
-0.001 ***(0.000)
-0.024* »
(S)
-0 .104*"(0.016)
0.004(0.004)0.017*"
(0.002)
- 0 . 0 0 1 * "(0.000)
Bank assets/GDP interacted withGDP per capita
Stock market capitalization/GDP
Stock market capitalization/GDPinteracted with GDP per capita
Stock market capitalization/bank assets
Stock market capitalization/bank assetsinteracted with GDP per capita
Number of banks
Market concentration
Total assets (U.S. dollars)
Legal and institutional indicatorsContract enforcement dummy
Contract enforcement dummyinteracted with GDP per capita
Law and order index
Law and order index interacted withGDP per capita
Corruption
(0.010)
0.001*(0.001)0.016*"
(0.005)
-0.002***(0.001)-0.013** *(0.003)
0.001**(0.001)
-0.001(0.015)0.004
(0.005)0.003* *»
(0.000)
-0.042*"(0.007)
0.003*"(0.001)-0.003* **(0.001)
-O.000*"(0.000)-0.009* **(0.001)
(Table continued on following page.)
396 THE WORLD BANK ECONOMIC REVIEW, VOL. 13, NO. 2
Table 4. (continued)Regression results
Independent variable
Corruption interacted withGDP per capita
Adjusted R2
Number of observations
(V
0.505,841
(2)
0.515,276
(3)
0.505,212
(4)
0.585,054
(5)
0.001 »**(0.000)0.63
4,497
* Significant at the 10 percent level.** Significant at the 5 percent level.*** Significant at the 1 percent level.Note: The regressions are estimated using weighted least squares pooling bank-level data across 80
countries for the 1988-95 time period. The number of banks in each period is used to weight theobservations. The regressions abo include country and time dummy variables that are not reported. Thedependent variable is the net interest margin defined as net interest income divided by total assets. Standarderrors are given in parentheses.
Source: Authors' calculations.
Table 5. Determinants of Bank Profitability
Independent variable
Bank characteristicsEquity/lagged total assets
Equity/lagged total assetsinteracted with GDP per capita
Loans/total assets
Loans/total assets interactedwith GDP per capita
Non-interest earning assets/total assets
Non-interest earning assets/total assets interacted withGDP per capita
Customer and short-termfunding/total assets
Customer and short-termfunding/total assetsinteracted with GDP per capita
Overhead/total assets
Overhead/total assets interactedwith GDP per capita
(1)
0.047* **(0.009)
0.002(0.001)-0.013***(0.005)
0 .001*"(0.000)
-0.005(0.010)
-O.007*"(0.001)
-0.029* **(0.006)
0.002* *»(0.000)-0.023(0.025)
-0.030***(0.003)
Regression results
(2)
0.051"*(0.009)
0.002* *»(0.001)-0.024* **(0.005)
0.003***(0.000)
-0.010(0.010)
-0.007***(0.001)
-0.017**(0.007)
-0.000(0.001)-0.006(0.026)
-0.049* »*(0.003)
(3)
0.055* **(0.009)
0.003***(0.001)-0.023**(0.005)
0.003* *»(0.000)
-0.011(0.010)
-0.007* **(0.001)
-0.014*"(0.008)
-0.000(0.001)-0.004(0.026)
-0.049* **(0.003)
(4)
0.058**(0.010)
0.002* **(0.001)-0.015***(0.005)
0.003* **(0.000)
-0.014(0.010)
-0.008***(0.001)
-0.031"*(0.001)
0.001(0.001)-0.024(0.026)
-0.048***(0.003)
(S)
0.015*"(0.006)
0.003* **(0.001)-0.018*"(0.004)
0.001* **(0.000)
-0.033* **(0.007)
0.002* *(0.001)
-0.051***(0.005)
0.002*"(0.000)-0.114*"(0.019)
0.007* **(0.002)
Demhguc-Kunt and Huizmga 397
Table 5. (continued)Regression results
Independent variable (1) (3) (4) (S)
Foreign ownership dummy 0.005*" 0.006*" 0.006*" 0.006*" 0.006*"(0.001) (0.001) (0.001) (0.001) (0.001)
Foreign ownership dummyinteracted with GDP per capita -0.001*** -0 .001"* - 0 . 0 0 1 * " -0 .001*" 0.000*»'
(0.000) (0.000) (0.000) (0.000) (0.000)
Macroeconomic indicatorsGDP per capita
Growth rate
Inflation rate
Real interest rate
Real interest rate interactedwith GDP per capita
TaxationReserves
Reserves interacted with GDPper capita
Tax rate
Tax rate interacted with GDPper capita
Deposit insuranceDeposit insurance dummy
Financial structureBank assets/GDP
Bank assets/GDP interacted withGDP per capita
Stock market capitalization/GDP
Stock market capitalization/GDP interacted withGDP per capita
Stock market capitalization/bank assets
0.008* *•(0.001)0.002
(0.010)0.011
(0.008)0.023"*
(0.009)
-0.000(0.002)
0.008*"(0.001)-0.006(0.011)0.015*
(0.008)0.029* **
(0.010)
-0.001(0.002)
-0 .126*"(0.021)
0.029* **(0.004)0.022"*
(0.003)
-0.000(0.000)
0.008*"(0.001)-0.007(0.011)0.014*
(0.008)0.029*"
(0.010)
-0.001(0.002)
-0 .129"*(0.021)
0.031"*(0.004)0.022***
(0.003)
-0.000* *(0.000)
-0.005(0.004)
0.007*(0.002)-0.019(0.011)0.009
(0.008)0.023*1
(0.009)
-0.000(0.002)
0.000(0.002)0.004
(0.007)0.011*
(0.005)0.026* **
(0.006)
-0.003 **(0.002)
-O.106"* -0 .091"*(0.023) (0.016)
0.032*" 0.005*"(0.004) (0.004)0.021*** 0.017***
(0.003) (0.002)
-0.003" 0.000*"(0.000) (0.000)
-0.028*(0.014)
0.002*(0.001)0.010
(0.007)
0.000(0.001)-0.001(0.001)
(Table continued on following page.)
398 THE WORLD BANK ECONOMIC REVIEW, VOL. 13, NO. 2
Table 5.
Indicator
(continued)
(1) (2)
Regression results
(3) (4) (S)
Stock market capitalization/bankassets interacted with GDP percapita
Number of banks
Market concentration
Total assets (U.S. dollars)
Legal and institutional indicatorsContract enforcement dummy
Contract enforcement dummyinteracted with GDP per capita
Law and order index
Law and order index interacted withGDP per capita
Corruption
Corruption interacted withGDP per capita
Adjusted R2 0.21 0.27 0.27Number of observations 5,841 5,276 5,212
-0.001(0.001)0.000
(0.000)0.010*
(0.007)0.000
(0.000)
0.315,054
-0.022"(0.007)
0 . 0 0 1 "(0.001)
-0.000(0.001)
-0.000*(0.000)
-0.002*(0.001)
-0.000(0.000)0.35
4,497
* Significant at the 10 percent level.*• Significant at the 5 percent level.*** Significant at the 1 percent level.Note: The regression is estimated using weighted least squares pooling bank-level data across 80 countries
for the 1988-95 time period. The number of banks in each period is used to weight the observations. Theregressions also include country and time dummy variables that are not reported. The dependent variableis before-tax profits divided by total assets. Standard errors are given in parentheses.
Source: Authors' calculations.
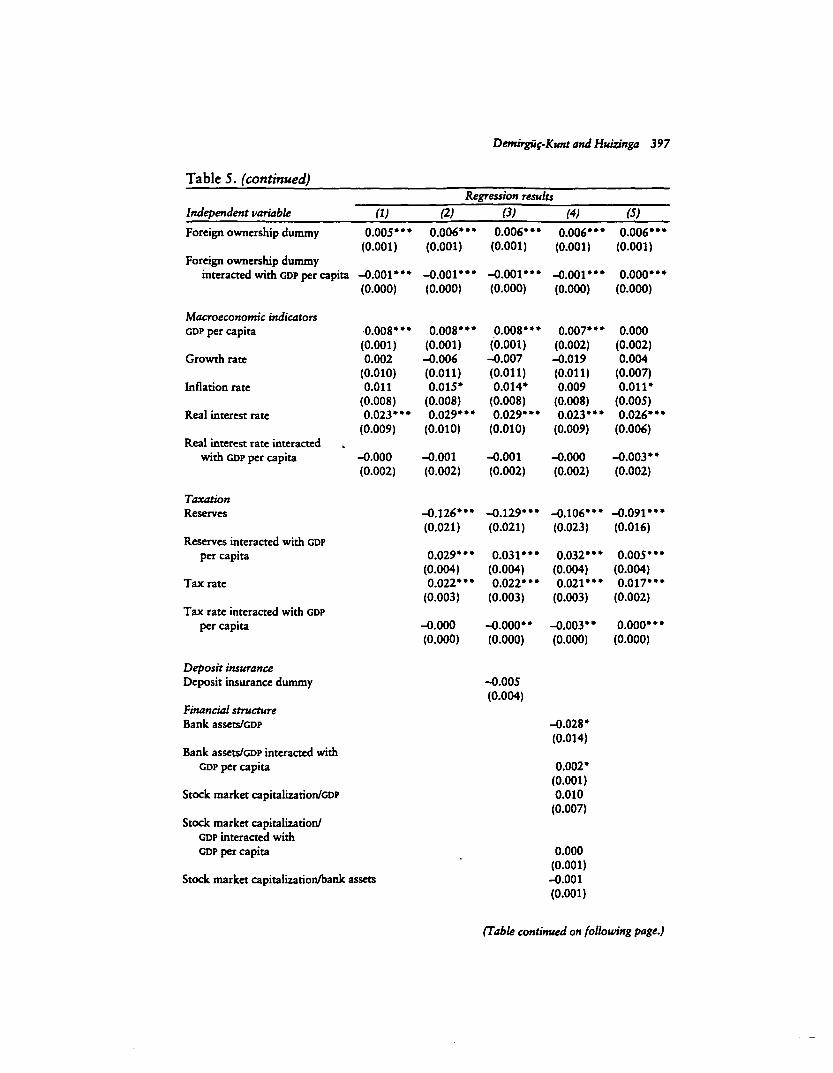
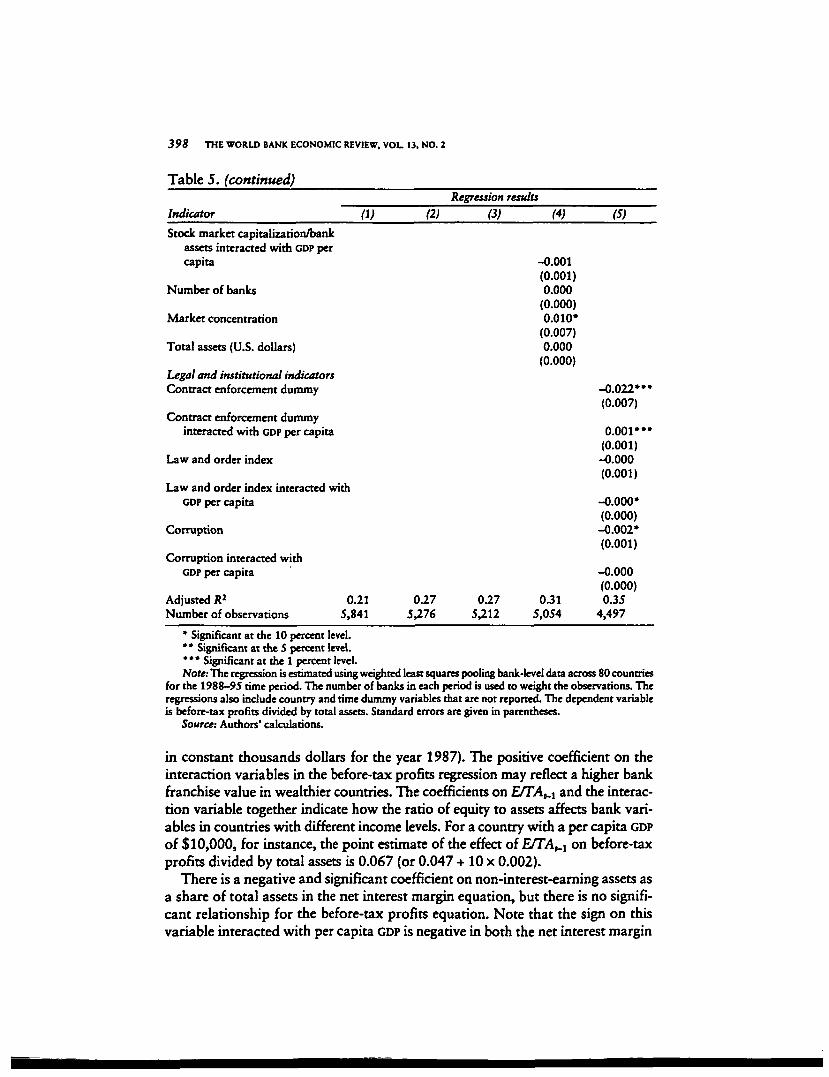
in constant thousands dollars for the year 1987). The positive coefficient on theinteraction variables in the before-tax profits regression may reflect a higher bankfranchise value in wealthier countries. The coefficients on £/TAM and the interac-tion variable together indicate how the ratio of equity to assets affects bank vari-ables in countries with different income levels. For a country with a per capita GDPof $10,000, for instance, the point estimate of the effect of £/TAr_, on before-taxprofits divided by total assets is 0.067 (or 0.047 + 10 x 0.002).
There is a negative and significant coefficient on non-interest-earning assets asa share of total assets in the net interest margin equation, but there is no signifi-cant relationship for the before-tax profits equation. Note that the sign on thisvariable interacted with per capita GDP is negative in both the net interest margin
Demirguf-Kunt and Huizmga 399
and the before-tax profits specifications. Apparently, the presence of non-interestearning assets depresses net interest income and profitability more in wealthiercountries than in poorer countries. By contrast, the sign on loans divided by totalassets is positive in the net interest margin equation and negative in the before-tax profits equation. However, the coefficient of this variable interacted with GDPin the profits equation is positive, indicating that at higher income levels banklending activities tend to be more profitable.
On the liability side, customer and short-term funding consists of demanddeposits, savings deposits, and time deposits. On average, this type of customerfunding may carry a low interest cost, but it is costly in terms of the requiredbranching network. This liability category does not significantly affect the netinterest variable, although there is evidence that it lowers bank profitability.
Differences in overhead may also capture differences in bank business andproduct mix, as well as variation in the range and quality of services. The ratio ofoverhead to total assets has an estimated coefficient of 0.173 in the net interestmargin regression, which suggests that about a sixth of a bank's overhead cost ispassed on to its depositors and lenders. The interaction of overhead with percapita GDP also enters with a positive coefficient, indicating that a larger share ofoverhead is passed onto financial customers in wealthier countries. This mayreflect more competitive conditions in banking markets in industrial than in de-veloping countries. In the before-tax profits regression the interaction of over-head with per capita GDP enters negatively, indicating that higher overheads eatinto bank profits.
The foreign ownership variable equals 1 if at least 50 percent of the bank'sstock is in foreign hands and equals 0 otherwise. In both tables 4 and 5 thisvariable has a positive coefficient, while its interaction with per capita GDP has anegative coefficient. These results suggest that foreign banks realize relativelyhigh net interest margins and profitability in relatively poor countries. It may bethat foreign banks are frequently exempt from unfavorable domestic bankingregulations and apply superior banking techniques. Note, however, that the pointestimate of the effect of foreign ownership for a wealthy country with a percapita GDP of $20,000 is negative in the net interest margin equation at -0.016(that is, 0.004 - 20 x 0.001) and in the profitability equation at -0.015 (that is,0.005 - 20 x 0.001). Foreign banks' technological and efficiency advantages incountries may be insignificant because, while there, they face informational dis-advantages. This could explain why foreign banks in industrial countries arerelatively unprofitable on average.
Turning to the macroeconomic indicators, we see, first, that per capita GDP hasno significant impact on the realized net interest margin, although it enters theprofitability equation with a positive coefficient. Per capita GDP is a general indexof economic development, and it thus reflects differences in banking technology,the mix of banking opportunities, and any aspects of banking regulations omit-ted from the regression. Growth, defined as the growth rate of real per capitaGDP, is insignificant in both regressions. The percentage change in the GDP defla-
400 THE WORLD BANK ECONOMIC REVIEW, VOL. 13, NO. 2
tor, or inflation, is estimated to increase the net interest margin and bank profit-ability. However, the significance of the coefficients in the profitability regres-sions is low, possibly because banks obtain higher earnings from float or becausethere are delays in crediting customer accounts in an inflationary environment.With inflation, bank costs also tend to rise. A larger number of transactions maylead to higher labor costs and, as shown by Hanson and Rocha (1986:40), resultin a higher ratio of bank branches per capita. On net, however, the regressionresults suggest that the impact of inflation on profitability, although not verysignificant, is positive throughout.
We constructed the real interest rate using the short-term government debtyield and, if that measure was not available, other short-term market rates. Thereal interest rate enters the net interest margin and before-tax profits regressionspositively, although this variable interacted with per capita GDP has a signifi-cantly negative coefficient in the ne t interest margin equation. Thus there issome evidence that increases in the real interest rate do not raise spreads as muchin industrial countries, perhaps because their deposit rates are not tied down bydeposit rate ceilings.
Taxation Variables
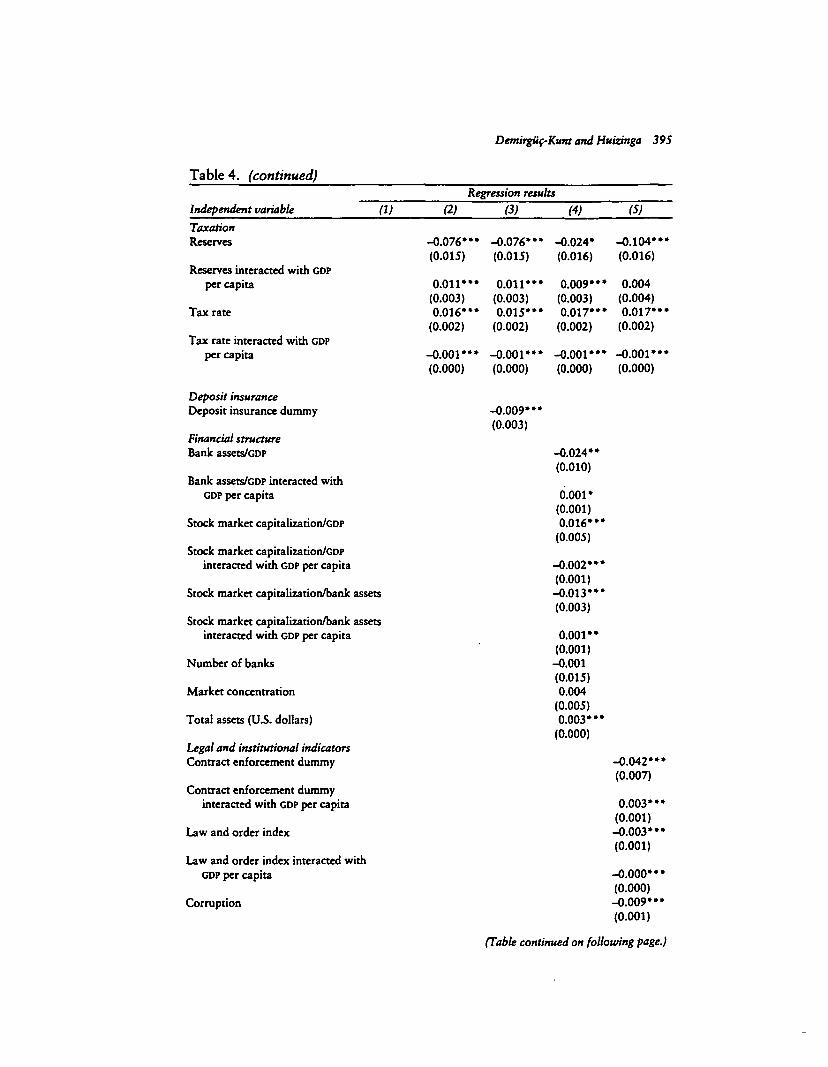
Banks are subject to direct taxation through the corporate income tax andother taxes, and they are subject to indirect taxation through reserve require-ments. Reserve requirements are an implicit tax on banks if, as is usual, officialreserves are remunerated at less-than-market rates. The corporate income taxand the reserve tax differ in important respects. First, the corporate income tax,in principle at least, can be targeted at pure profit. To the extent that it is a profittax, the corporate income tax is relatively nondistorting. In practice, however, itmay not be a pure profit tax if complete expensing of costs is not allowed.
The reserve tax, by its very nature, is proportional to the volume of deposittaking and is therefore a distorting tax. From a welfare perspective the corporateincome tax thus appears to be superior to the reserve tax. A second importantdifference is that the severity of the reserve tax depends on the opportunity costof holding reserves. This may depend on financial market conditions as much ason any tax code. Related to this second condition, reserve requirements are alsoan instrument of monetary policy.
As far as we know, there has been no other empirical research on the effect ofthe corporate income tax on the banking sector. Several studies have consideredthe impact of reserve requirements on bank profitability. Some, in particular,have examined how Federal Reserve membership affeaed the profitability ofU.S. commercial banks in the 1970s (see Rose and Rose 1979 and Gilbert andRasche 1980). Federal Reserve membership subjected banks to generally higherreserve requirements. Most of the studies in this area support the notion thatnonmember banks were more profitable than member banks (with similar char-acteristics) because nonmember banks held relatively little cash. Competitionamong member and nonmember banks in the same market appears to have pre-
DemirgUf-Kunt and Huizinga 401
vented member banks from passing their higher reserve costs onto their custom-ers. In related work Kolari, Mahajan, and Saunders (1988) study the impact ofannounced changes in reserve requirements on bank stock prices using an eventstudy methodology. Huizinga (1996) and Eijffinger, Huizinga, and Lemmen (1998)examine how nonresident withholding taxes affect interest rates, while Fabozziand Thurston (1986) examine how differences in reserve requirements are pricedinto money-market instruments.
Because detailed information on the reserve regulation of all countries in oursample is not available, we use a proxy to capture bank reserves. We constructthis variable in the regressions as the product of the banking system's ratio ofaggregate reserves to deposits (as in table 3) and the individual bank's ratio ofshort-term funding to total assets. Customer and short-term funding, consistingof demand deposits, savings deposits, and time deposits, here proxy for reservabledeposits. The reserves variable is thus an approximation of actual bank reservesthat reflects differences in systemwide reserve requirement rules.
In tables 4 and 5 the reserves variable enters the regressions negatively. Thecoefficients in the net interest margin equations show two effects: less-than-market remuneration and the impact on banks' lending and deposit rates. Thefirst effect is expected to be negative because underremunerated reserves lower abank's net interest income and profitability. The second effect could be eitherzero, in which case the bank bears the full cost of higher reserves, or positive, inwhich case the cost of reserves is passed onto bank customers in the form ofhigher interest margins. In table 5 we see that the reserves variable negativelyaffects bank profitability. This suggests that the second, or pass-through, effect iseither nonexistent or too small to offset the first, or direct, effect. Abstractingfrom any pass-through, the coefficient on the reserves variable in either regres-sion can also be interpreted as a bank's opportunity cost of holding reserves. Thereserves variable interacted with per capita GDP enters both regressions positively,which may reflect the fact that the opportunity cost of holding reserves is higherin wealthier countries.
We capture the explicit taxes that banks pay with the variable tax rate, whichis measured by a bank's tax bill divided by its pretax profits. This variable has asignificantly positive impact on interest margins and profitability. The tax rateinteracted with per capita GDP is negative and significant in both regressions.These results suggest that both the net interest margin and profitability increasewith tax rates, but less so in richer countries. Thus the corporate income tax ispassed through to bank customers to some degree.
To calculate the extent of this pass-through, we use the estimated coefficients onthe tax rate variable and its interaction with per capita GDP. Let the pass-throughbe defined as the increase in before-tax profits following a one-unit increase in thecorporate tax bill, or dBTP/dTX. Next, note that (3BTP/<h)/TA = (J, where x is thetax rate, TA is total assets, and p" is estimated at 0.022 - (0.0004) x (per capitaGDP). Further, dTXfdx = (dBTP/dx) + BTP, as TX = T x BTP. It now follows thatdBTP/dTX = p7[Px + (BTP/TA)]. We can evaluate this expression using mean val-
402 THE WORLD BANK ECONOMIC REVIEW, VOL 13, NO. 2
ues of T, BTP/TA, and per capita GDP separately for countries in four differentincome groups (low, lower-middle, upper-middle, and high), where per capita GDPis die international average for 1995. The calculations suggest that the pass-throughcoefficient, dBTP/BTX, equals 1.01,0.72,1.00, and 1.21 for countries in the fourincome groups, respectively. For low-income countries in 1995 BTP/TA and T havemean values of 0.016 and 0.225 for all banks, while the average GDP per capita is$426. The calculations reflect the fact that in high-income countries the mean valueof BTP/TA is lower, while the value of t changes little.
Essentially, these results suggest that the corporate income tax completely passesthrough to bank cutomers. Thus there is no support for the notion that the cor-porate income tax is a nondistorting tax on bank profits. Generally, it is a source-based tax on domestically employed capital resources. A complete pass-throughof this tax is consistent with the assumption that international investors demanda net-of-tax return on capital invested in a particular country independent of thecountry's source-based taxes.
Deposit Insurance
Several studies have examined the impact of deposit insurance using interna-tional data. Demirguc.-Kunt and Detragiache (1997) find that the existence ofexplicit deposit insurance is positively associated with the probability of bankingcrises. Barth, Nolle, and Rice (1997), however, find that deposit insurance has nosignificant impact on banks' return on equity for a sample of 142 banks in 1993.Bartholdy, Boyle, and Stover (1997) estimate that deposit insurance lowers thedeposit rate by 25 basis points, using aggregate deposit interest rate data for 13OECD countries during 1985-90. These authors discuss why deposit insurancehas a theoretically ambiguous effect on interest margins. On the one hand, thedeposit rate for insured deposits should decrease given the insurance protection.On the other hand, mispriced deposit insurance provides banks with an incentiveto engage in more risky lending strategies to increase the contingent pay-outfrom the deposit insurance agency.
Brewer and Mondschean (1994) offer empirical support for the notion thatdeposit insurance creates incentives for banks to acquire risky assets by examin-ing the junk bond holdings of U.S. banks, while Demirgiic-Kunt and Huizinga(1993) argue that deposit insurance was an important determinant of bank stockprices during the international debt crisis of the 1980s. This moral hazard prob-lem and the associated risks can lead bank creditors to demand a higher interestrate. Also, for a given level of risk, deposit insurance may lead banks to lendmoney more cheaply than they otherwise would, depressing net interest marginsand profitability. Even banks that do not engage in risky lending strategies them-selves may experience a downward effect on interest margins because of bankcompetition.
The deposit insurance variable equals 1 if the country has an explicit depositinsurance regime. For some countries this variable changes with time, reflectingchanges in the regime during the sample period. The results suggest that deposit

DemirgSf-Kunt and Huizinga 403
insurance lowers net interest margins. Deposit insurance may also influence mar-gins and profits through its effect on financial structure—it encourages new entryand enables small banks to operate. However, when we include financial struc-ture variables in the regression, the results do not change. The impact on bankprofits is negative, but it is not significant, possibly because of the offsettingimpact of mispriced subsidies in actual deposit insurance schemes. These resultssuggest that explicit deposit insurance regimes do not produce higher bank prof-itability and margins, perhaps because of design and implementation problems.
Financial Structure Variables
In the regressions reported in column 4 of tables 4 and 5 we include two sets offinancial structure variables. The first set comprises the market concentrationratio, the number of banks, and total bank assets as indicators of market struc-ture and scale effects. Various authors, such as Gilbert (1984), Berger (1995a),and Goldberg and Rai (1996), have pointed out that such variables may proxyfor market power as well as for differences in bank efficiency. We do not attempthere to distinguish between the corresponding market power and efficient struc-ture hypotheses.
The second set consists of financial structure variables that measure the im-portance of bank and stock market finance relative to GDP and to each other.Reasons why these variables matter may also hinge on market power arguments.A high ratio of bank credit to GDP, for instance, may reflect a high demand forbanking services fueling competition among banks. Or these variables may re-flect the complementarity of or substitutability between bank and stock marketfinance. The Miller-Modigliani theorem states that debt and equity finance arepurely substitutes in the absence of taxes and bankruptcy costs. In practice, how-ever, debt and equity finance may also be complementary, as modeled in Boydand Smith (1996). Demirgiic,-Kunt and Maksimovic (1996) provide empiricalevidence that an ability to attract equity capital may also enhance firms' borrow-ing capacity, especially in developing countries' financial markets. In this settingeasier equity finance may increase rather than decrease the demand for debt fi-nance, reflecting that these sources of finance are complements.
Turning to the first set of market concentration and scale variables, we seethat the bank concentration ratio has a significant and positive impact on bankprofitability, while bank size, as proxied by total assets, has a significant andpositive impact on interest margins. The number of banks has no significantimpact on either interest margins or profits.
The second set of financial structure variables affects bank margins more sig-nificantly than bank profits. This may indicate that these variables have a greaterimpact on banks' loan and deposit customers than on other clients. The ratio ofbank assets to GDP has a significantly negative impact on margins and profits,perhaps reflecting more intense interbank competition in well-developed finan-cial systems. This effect is smaller in richer countries that already have relativelydeveloped banking sectors. The ratio of stock market capitalization to GDP enters
404 THE WORLD BANK ECONOMIC REVIEW, VOL. 13, NO. 2
the net interest margin equation positively, which suggests that a larger stockmarket per se enables banks to obtain higher interest margins, supporting thecomplementarity hypothesis between debt and equity financing discussed above.As stock markets develop, better availability of information increases the poten-tial pool of borrowers, making it easier for banks to identify and monitor them.This raises the volume of business for banks, making higher margins possible. Inthe regression the ratio of stock market capitalization to banking assets entersthe interest margin equation negatively. Thus it may be that a larger stock mar-ket relative to the banking sector lowers bank margins, reflecting substitutionpossibilities between debt and equity. For both stock market development indi-cators the interaction with per capita GDP enters the interest margin equationwith the opposite sign, suggesting that the impact of any stock market develop-ment on interest margins is muted in wealthier countries.
Legal and Institutional Indicators
The final regressions reported in tables 4 and 5 include a variety of legal andinstitutional variables (column 5). The contract enforcement dummy, rangingfrom 1 to 4, measures the degree to which contractual agreements are honoredand not subject to language and mentality differences. A higher value meansgreater contract enforcement. In both the net interest margin and before-tax profitsregressions, the contract enforcement variable has a negative and significant sign.Poor contract enforcement may prompt banks to require higher interest marginsand investors to require higher profitability to compensate for the additionalrisk. In both regressions the contract enforcement variable interacted with percapita GDP enters positively, suggesting a muted effect of this variable in wealthiercountries.
The law and order index, ranging from 0 to 6, captures how well the legalsystem works in adjudicating disputes. From table 4 we see that a higher value ofthis index is significantly associated with lower interest margins. The reason mayagain be that an effective legal system reduces the required risk premia on banklending. The interaction between the law and order index and per capita GDPenters the equation negatively, however.
Finally, the corruption index, ranging from 0 to 6, measures the degree ofgovernment corruption. A higher score indicates that government officials areless likely to take bribes. Table 4 indicates that a cleaner government is associ-ated with lower realized interest spreads, and this relationship is weaker inwealthier countries. Again, banks may require a lower risk premium on theirinvestments in countries that are relatively free of corruption. Overall, the regres-sions indicate that the underlying legal and institutional variables are importantin explaining cross-country variation in interest spreads and bank profitability.For two of the three variables the interaction with per capita GDP has a coefficientwith the opposite sign, suggesting that the effects of institutional differences aremuted in wealthier countries.

Demirgiif-Kunt and Huizinga 405
IV. CONCLUSIONS
Banking systems around the world differ widely in their size and operation.Across countries commercial banks have to deal with different macroeconomicenvironments, explicit and implicit tax policies, deposit insurance regimes, finan-cial market conditions, and legal and institutional realities. Using a comprehen-sive cross-country data set with bank-level data, this article analyzed how bankcharacteristics and the overall banking environment affect how banks functionas reflected in interest margins and bank profitability.
We can confirm some findings of earlier research: for instance, a positive relation-ship between capitalization and profitability and a negative relationship betweenreserves and profitability. But other important determinants of bank margins andprofitability, such as ownership, corporate taxation, financial structure, and the legaland institutional setting, have not been treated extensively in the literature.
Differences in the mix of bank activity also have an impact on spreads andprofitability. Our results show that banks with relatively high non-interestearning assets are less profitable. Banks that rely largely on deposits for theirfunding are also less profitable, because deposits apparently entail high branch-ing and other expenses. Similarly, variation in overhead and other operating costsis reflected in variation in bank interest margins, because banks pass on theiroperating costs to their depositors and lenders.
The international ownership of banks also has a significant impact on bankspreads and profitability. Foreign banks, specifically, realize higher interest mar-gins and higher profitability than domestic banks in developing countries. Thisfinding may reflect the fact that in developing countries a foreign bank's techno-logical edge is relatively strong, apparently strong enough to overcome any infor-mational disadvantage in lending or raising funds locally. Foreign banks, how-ever, are shown to be less profitable in industrial countries, where they may nothave a technological edge.
Macroeconomic factors also explain variation in interest margins. We foundthat inflation is associated with higher realized interest margins and higher prof-itability. Inflation entails higher costs—more transactions and generally moreextensive branch networks—and also higher income from bank float. The posi-tive relationship between inflation and bank profitability implies that bank in-come increases more with inflation than do bank costs. Further, high real interestrates are associated with higher interest margins and profitability, especially indeveloping countries. This may reflect the fact that in developing countries de-mand deposits frequently pay zero or below-market interest rates.
Regarding financial structure, banks in countries with more competitive bankingsectors—where banking assets constitute a larger portion of GDP—have smallermargins and are less profitable. The bank concentration ratio positively affectsbank profitability, and larger banks tend to have higher margins. A larger ratioof stock market capitalization to GDP increases bank margins, suggesting possible
406 THE WORLD BANK ECONOMIC REVIEW, VOL. 13, NO. 2
complementarity between debt and equity financing. A larger ratio, however, isnegatively related to margins, suggesting that relatively well-developed stockmarkets can substitute for bank finance.
Similarly, several institutional factors, such as indexes of credit rights, law andorder, and corruption, and differences in financial structure, have more pro-nounced effects on interest margins and bank profitability in developing than inindustrial countries. These results may reflect the relatively closed nature of bank-ing markets in developing countries. Coupled with earlier empirical evidence thata weak institutional environment makes banking crises more likely (Demirgiic-Kunt and Detragiache 1997), these results suggest that returns to improving un-derlying institutions are indeed high. Reserves also have a more pronounced im-pact on margins and profitability in developing than in industrial countries. Thisresult may simply reflect the relatively high opportunity cost of holding reservesin poorer and more inflationary countries.
The corporate income tax appears to be passed on fully to bank customers inboth developing and industrial countries. This finding is consistent with the no-tion that bank stock investors require net-of-company-tax returns independentof the level of company taxation. It also implies that the corporate income tax onbanks is likely to distort the underlying saving and investment decisions, withpossibly negative implications for economic growth. These considerations mustweigh heavily in considering the merits of the corporate income tax on banks aspart of the overall tax system.
However, we also found that official reserves depress bank profits. Primafacie, this suggests that reserve requirements are a better instrument with whichto tax bank profits than the corporate income tax. Note, however, that the im-plicit reserve tax in many countries is much more variable than the corporateincome tax. The level of banking investment and activity is therefore unlikely tobe adjusted to each change in the implicit reserve tax. Variability in the reservetax can thus go a long way toward explaining the responsiveness of bank profitsto this tax. These issues are pursued further in Demirgiic-Kunt and Huizinga(1997).
Policymakers have an interest in promoting banking sectors that are both stableand efficient. Stability clearly requires sufficient banking profitability, while eco-nomic efficiency requires banking spreads that are not too large. A prerequisiteto formulating effective banking policies is thus to understand the determinantsof bank profitability and interest margins.
Several other topics remain for further study. Countries worldwide differ con-siderably in the extent of foreign ownership of their banking systems. An inter-esting issue is how entry by foreign banks affects the operation of domestic bank-ing firms. In principle, foreign entry can affect pricing by domestic firms andforce them to reduce their operating costs and to remain competitive. Both ofthese effects determine whether the entry of foreign firms is welfare-improvingoverall. We address the impact of foreign entry in Claessens, Demirgiic.-Kunt,and Huizinga (1997).

Demirguf-Kunt and Huizinga 407
As a related issue, it would be interesting to consider what determines foreignbank entry. Foreign bank entry, and foreign direct investment generally, may bedriven by the different (worldwide) taxation of domestic and foreign firms ratherthan simply by countries' comparative advantage in providing financial services.
We have found some evidence that government regulations, such as the designof deposit insurance schemes, have an impact on bank margins. It would be in-teresting to analyze this issue further by taking into account differences in designfeatures. We intend to return to these issues in future work.
REFERENCES
The word "processed" describes informally reproduced works that may not be com-monly available through library systems.
Barth, James R., Daniel E. Nolle, and Tara N. Rice. 1997. "Commercial Banking Struc-ture, Regulation, and Performance: An International Comparison." Comptroller ofdie Currency Economics Working Paper 97-6. Comptroller of the Currency, Washing-ton, D.C. Processed.
Bartholdy, Jan, Glenn W. Boyle, and Roger D. Stover. 1997. "Deposit Insurance, BankRegulation, and Interest Rates: Some International Evidence." University of Otago,New Zealand. Processed.
Berger, Allen N. 1995a. "The Profit-Structure Relationship in Banking: Tests of Market-Power and Efficient Structure Hypotheses." Journal of Money, Credit, and Banking27(2):404-31.
. 1995b. "The Relationship between Capital and Earnings in Banking."JournalofMoney, Credit, and Banking 27(2):432-56.
Boyd, John, and Bruce Smith. 1996. "The Co-Evolution of the Real and Financial Sectorsin the Growth Process." The World Bank Economic Review 10(2):371-96.
Brewer, Elijah III, and Thomas H. Mondschean. 1994. "An Empirical Test of the Incen-tive Effects of Deposit Insurance." Journal of Money, Credit, and Banking 26(1):146-64.
Buser, Stephen A., Andrew H. Chen, and Edward J. Kane. 1981. "Federal Deposit Insur-ance, Regulatory Policy, and Optimal Bank Capital." Journal of Finance 35(l):51-60.
Caprio, Gerard, Jr., and Lawrence H. Summers. 1993. "Finance and Its Reform: BeyondLaissez-Faire." Policy Research Working Paper 1171. World Bank, Policy ResearchDepartment, Washington, D.C.
Claessens, Stijn, Ash Demirguc-Kunt, and Harry Huizinga. 1997. "How Does ForeignEntry Affect the Domestic Banking Market?" World Bank, Policy Research Depart-ment, Washington, D.C. Processed.
Demirgiic-Kunt, Ash, and Enrica Detragiache. 1997. "The Determinants of Banking Cri-ses: Evidence from Developed and Developing Countries." World Bank, Policy Re-search Department, Washington, D.C. Processed.
Demirgu^-Kunt, Ash, and Harry Huizinga. 1993. "Official Credits to Developing Coun-tries: Implicit Transfers to the Banks." Journal of Money, Credit, and Banking25(3):430-44.
. 1997. "The Taxation of Domestic and Foreign Banking." World Bank, PolicyResearch Department, Washington, D.C. Processed.

408 THE WORLD BANK ECONOMIC REVIEW, VOL. 13, NO. 2
Demirgiic-Kunt, Ash, and Vojislav Maksimovic. 1996. "Stock Market Development andFinancing Choices of Firms." The World Bank Economic Review 10(2):341-69.
Eijffinger, Sylvester, Harry Huizinga, and Jan Lemmen. 1998. "Short-Tenn and Long-Term Government Debt and Nonresident Interest Withholding Taxes." Journal ofPublic Economics 68(3):309-34.
Fabozzi, Frank J., and Thorn B. Thurston. 1986. "State Taxes and Reserve Requirementsas Major Determinants of Yield Spreads among Money Market Instruments." Journalof Financial and Quantitative Analysis 21(4):427-36.
Gilbert, R. Alton. 1984. "Bank Market Structure and Competition." Journal of Money,Credit, and Banking 16(4):617-60.
Gilbert, R. Alton, and Robert H. Rasche. 1980. "Federal Reserve Bank Membership:Effects on Bank Profits." Journal of Money, Credit, and Banking 12(3):448-61.
Goldberg, Lawrence G., and Anoop Rai. 1996. "The Structure-Performance Relation-ship for European Banking." Journal of Banking and Finance 20(4):745-71.
Gorton, Gary, and Richard Rosen. 1995. "Corporate Control, Portfolio Choice, and theDecline of Banking." Journal of Banking 50(5):1377-420.
Hanson, James A., and Roberto de Rezende Rocha. 1986. "High Interest Rates, Spreads,and the Cost of Intermediation: Two Studies." Industry and Finance Series 18. WorldBank, Industry Department, Washington, D.C.
Huizinga, Harry. 1996. "The Incidence of Interest Withholding Taxes: Evidence from theLDC Loan Market." Journal of Public Economics 59(3):435-51.
International Monetary Fund. Various years. International Financial Statistics. Washing-ton, D.C.
Kolari, James, Arvind Mahajan, and Edward M. Saunders. 1988. "The Effects of Changesin Reserve Requirements on Bank Stock Prices." Journal of Banking and Finance12(2):183-98.
Kyei, Alexander. 1995. "Deposit Protection Arrangements: A Comparative Study." IMFWorking Paper 95/134. International Monetary Fund, Washington, D.C.
Levine, Ross. 1997. "Financial Development and Economic Growth." Journal of Eco-nomic Literature 35(2):688-726.
Rose, John T., and Peter S. Rose. 1979. "The Burden of Federal Reserve System Member-ship: A Review of the Evidence." Journal of Banking and Finance 3(2):331-45.
Schranz, Mary S. 1993. "Takeovers Improve Firm Performance: Evidence from the Bank-ing Industry." Journal of Political Economy 101(2):299-326.
Stiglitz, Joseph E., and Marilou Uy. 1996. "Financial Markets, Public Policy, and the EastAsian Miracle." The World Bank Research Observer ll(2):249-76.
Talley, Sam, and Ignacio Mas. 1990. "Deposit Insurance in Developing Countries." WorldBank, Latin America and the Caribbean Regional Office, Washington, D.C.Processed.
Virtas, Dimitri. 1991. "Measuring Commercial Bank Efficiency, Use, and Misuse of BankOperating Ratios." Policy Research Working Paper 806. World Bank, Policy ResearchDepartment, Washington, D.C.
World Bank. 1996. World Development Report 1996: From Plan to Market. New York:Oxford University Press.