detecting cumulative effects on headwater streams in the routt national forest, colorado
TRANSCRIPT
JOURNAL OF THE AMERICAN WATER RESOURCES ASSOCIATIONVOL. 34, NO.5 AMERICANWATER RESOURCES ASSOCIATION OCTOBER 1998
DETECTING CUMULATWE EFFECTS ON HEAD WATERSTREAMS IN THE ROU11 NATIONAL FOREST, COLORADO1
Elizabeth S. Schnackenberg and Lee H. MacDonald2
ABSTRACT: This study evaluated the use of a modified pebblecount procedure (Bevenger and King, 1995) to detect cumulativewatershed effects on headwater streams in the Routt National For-est in northcentral Colorado. The 42 sample reaches were stratifiedby disturbance (reference or disturbed) and geologic terrane(granitic or mixed sedimentary-volcanic). Water surface slope was asignificant control on the number of fine particles in the referencereaches in both terranes, and the data from the disturbed reacheswere adjusted accordingly. The disturbed reaches in the graniticterrane generally had a higher percentage of fine particles, and theadjusted number of fine particles was significantly correlated withthe number of road crossings. Disturbed reaches in the sedimenta-ry-volcanic (s-v) terrane generally did not have significantly morefine particles, nor were the adjusted numbers of fine particles sig-nificantly correlated with any management index. The lack of sig-nificant trends in the s-v streams is probably due to differences inweathering between the two rock types, and the location of thesample reach relative to sedimentary outcrops. Two other proce-dures were also used to assess cumulative watershed effects, withthe Pfankuch channel stability rating yielding stronger and moreconsistent differences between the reference and the disturbedstreams than the Tarzwell substrate ratio. We conclude that it maybe difficult to define a standard reference condition, and that thenumber of road crossings is more strongly correlated with the num-ber of fine particles than equivalent clearcut area.(KEY TERMS: watershed managementiwildland hydrology; cumu-lative watershed effects; sedimentation; stream channels; bedmaterial particle size; forest management; roads.)
INTRODUCTION
The National Environmental Policy Act requiresfederal land managers to assess the impact on theenvironment of any proposed management activity(Thatcher, 1990). Although single actions can createan adverse environmental impact, the degradationof water resources is usually a result, of multiple
activities over time and space. In many forested areasa primary concern is the cumulative effect of manage-ment activities on the designated beneficial uses ofwater, particularly coldwater fisheries (e.g., MacDon-ald et al., 1991). Numerous methods have been devel-oped to quantify the cumulative watershed effect offorest management activities, and these include theequivalent clearcut area (USFS, 1974), equivalentroaded area (Cobourn, 1989), and computer modelssuch as HYSED (Silvey, 1981) and R1-WATSED(USFS, 1992). However, very few studies have directlytested these procedures with respect to water or sedi-ment yields, or related these indices to stream chan-nel condition, quality of aquatic habitat, or coldwaterfish production (Reid, 1993).
Cumulative watershed effects on the Routt Nation-al Forest (RNF) in northcentral Colorado result frommultiple land use activities including timber harvest,unpaved roads, grazing, and recreation. Timber har-vest has been shown to increase annual water yields(Bosch and Hewlett, 1982; Stednick, 1996), the size ofpeak flows (Bates and Henry, 1928; Troendle andKing, 1985), the rate of surface erosion (Everest etal., 1987), and the frequency of mass movements(Sidle et al., 1985; Swanson et al., 1987). Forest har-vest and the associated road network usually increasethe amount of sediment delivered to the streamchannel and basin-scale sediment yields (Everest etal., 1987; Reid, 1993). Literature reviews suggest thatroads may be the primary source of sediment ratherthan the forest harvest per se (Everest et al., 1987;Reid, 1993). The deposition of fine sediment is ofconcern because this can adversely affect macroinver-tebrates and fish by filling pools and interstitial
'Paper No. 97125 of the Journal of the American Water Resources Association. Discussions are open until June 1, 1999.2Respectively, Hydrologist, Routt National Forest, 925 Weiss Drive, Steamboat Springs, Colorado 80487-9317; and Associate Professor,
Department of Earth Resources, Colorado State University, Fort Collins, Colorado 80523 (E.MaillMacDonald: [email protected]).
JOURNAL OF THE AMERICAN WATER RESOURCES ASSOCIATION 1163 JAWRA

Schnackenberg and MacDonald
spaces, decreasing intergravel dissolved oxygen con-centrations, and inhibiting fry emergence (MacDonaldet al., 1991; Meehan, 1991; Weaver and Fraley, 1993;Waters, 1995).
The bed material particle-size distribution isbelieved to be one of the first channel characteristicsto change in response to management activities (Diet-rich et al., 1989; Madsen 1994). Wolrnan pebble counts(Wolman, 1954) are the most common technique toassess changes in the surface particle-size distribu-tion and thus evaluate management effects on aquatichabitat.
There are several limitations to the use of Wolmanpebble counts to assess cumulative watershed effects(CWEs). First, measurements are usually made at achannel cross-section or within a single habitat typesuch as a riffle or a pooi. This does not provide anintegrated, reach-scale assessment, even though thereach is often the primary unit of concern to landmanagers. Second, the statistical procedures used forcomparing pebble counts typically focus on a singlevalue, such as the D50 or D84. Thus a 100-unit pebblecount is reduced to a single metric, and the resultingdecrease in sample size greatly weakens the statisti-cal power of the analysis. Finally, recent studies haveshown that observer bias and measurement accuracycan limit the accuracy and precision of pebble counts(Marcus et al., 1995; WohI et al., 1996).
Bevenger and King (1995) addressed the first limi-tation by longitudinally sampling 150-300 particles atapproximately 1-rn intervals in a several hundredmeter reach. The second limitation was resolved byfocussing on the total number of particles with anintermediate diameter less than eight millimeters.Each measured particle is therefore treated as onesample and this greatly increases the sample size.Comparisons over time or between streams can beanalyzed by chi-squared contingency tables (Potyondyand Hardy, 1994; Bevenger and King, 1995; Schnack-enberg, 1996).
Bevenger and King's study showed that reachesdisturbed by forest management had significantlymore fine (< 8 mm) sediment than otherwise compa-rable reference reaches; the observed increase in finesediment was attributed to land use activities(Bevenger and King, 1995). A particle size of eightmillimeters was used because this is a break in phi(log 2) classes (Wolman, 1954) and is close to the 0.25-inch (6.35 mm) threshold considered detrimental tomany coldwater fish species (Chapman, 1988).
The primary goal of this study was to evaluate theuse of the Bevenger and King (henceforth referred toas B&K) pebble count procedure to assess cumulativewatershed effects in the Routt National Forest. How-ever, to accomplish this goal we had to address a
series of conceptual and methodological issues, andrelatively little additional effort was needed to collectdata using two other channel assessment procedures.Hence this study expanded into a more comprehen-sive attempt to detect CWEs and their potential caus-es. The specific objectives were to: (1) determine iflithology had a significant effect on the number offine particles in undisturbed ("reference") reaches;(2) determine if there was a significant autocorrela-tion between sampled particles (i.e., to verify thateach particle was an independent sample); (3) evalu-ate consistency between observers; (4) determine ifone or more local controls (water surface slope,drainage area, elevation, valley slope, or amount oflarge woody debris) significantly affected the amountof fine sediment in the reference reaches; (5) evaluatethe relationship between the number of fine particlesin the disturbed ("study") reaches and three indices offorest management; (6) compare the results of themodified pebble count to two other commonly-usedprocedures to assess stream channel condition(Pfankuch channel stability rating and Tarzwell sub-strate ratio); and (7) evaluate the relationshipbetween each of the three channel assessment proce-dures and the management indices. The ultimate goalis to develop and validate one or more procedures todetect the adverse cumulative effects of managementactivities on stream channel characteristics and, byinference, aquatic ecosystems.
STUDY AREA
The Routt National Forest (RNF) encompasses4,450 km2 in northcentral Colorado (Figure 1). Eleva-tions range from 1,970 to 3,690 meters. The continen-tal divide runs along the Park and Gore Ranges andeffectively bisects the RNF. Annual precipitationranges from 40 cm in the lower elevations to morethan 150 cm in the higher elevations of the ParkRange. The annual runoff hydrograph is dominatedby the seasonal snowmelt peak in late May or June.
The RNF has two dominant geologic terranes:(1) crystalline rocks (primarily granitic) in the Parkand Gore Ranges; and (2) sedimentary-volcanic rocksin the Elkhead, Flattop, and Rabbit Ears mountainranges. Within the latter category, the volcanics typi-cally occur on the peaks and high ridgetops, and theseare underlain by sedimentary rocks such as sand-stones, siltstones, and shales.
JAWRA 1164 JOURNAL OF THE AMERICAN WATER RESOURCES ASSOCIATION

Detecting Cumulative Effects on Headwater Streams in the Routt National Forest, Colorado
Figure 1. Map of the Routt National Forest and Major Mountain Ranges in Northcentral Colorado.The shaded area southeast of Kremmling is no longer being administered by the Routt National Forest.
METHODS
Forty-two reaches were sampled in the summer of1994. Reaches were stratified by land use and geolog-ic terrane (granitic or sedimentary-volcanic). We triedto focus on lower-gradient response reaches (Mont-gomery and Buffington, 1993, 1997), but the moun-tainous terrain meant that 20 of the 42 reaches had awater surface slope greater than two percent(WSLOPE in Table 1). The median bankfull widthwas only 4.5 m. If classified by Rosgen (1994), 14 per-cent of the reaches were type A, 31 percent type B, 38percent type C, and 17 percent type E.
In each 150-300 m reach 150 particles were sam-pled at approximately one-meter intervals whiletraversing diagonally upstream from bankfull tobankfull (Bevenger and King, 1995). Each particle
was selected by blindly placing a finger at the toe ofone's wader and picking up the first particle touched.The intermediate axis was measured with a ruler tothe nearest millimeter, and the percent of particlessmaller than eight millimeters was calculated foreach reach. To eliminate problems with observer bias,all of the data used in the primary analysis were col-lected by the same observer. However, we also evalu-ated observer variability by having two or morepeople independently sample the same reach. Forthese comparisons the sample size ranged from 50 to150 particles per observer, with a smaller sample sizeand correspondingly shorter reach being used in cold-er water.
Boxplots, summary statistics, and an F-test forequal variances were used to determine whetherbedrock lithology affected the number of fine (< 8 mm)
Wyoming
Areas in grey represent Routt National Forest boundaries. I
100I
JOURNAL OF THE AMERICAN WATER RESOURCES ASSOCIATION 11 65 JAWRA
Schnackenberg and MacDonald
Green Cr.Lower Harrison Cr.S. Fork Silver Cr.Middle Fork Mad Cr.Newcomb Cr.N. Fork Service Cr.Porcupine Cr.Service Cr.S. Fork Hog Park Cr.S. Fork Mad Cr.Upper Harrison Cr.W. Fork Encampment
Granitic Reference0.12 1.35.9 6.81.5 3.7
4.1 21 0 05.0 10 0 02.4 23 0 04.5 7 0 03.3 2 0 0.151.8 8 4 0.254.2 8 0 04.8 24 1.2 0.223.8 46 0 0
Granitic Studynla 5.3 0.5
1 33 0.731 21 0.96
60 6.4 1.412 43 1.968 4.6 3.37 21 08 2.3 0.164 29 0.611 2.8 2.90 4.2 2.0
47 11 1.3
Sedimentary-Volcanic Reference1.9 2.3 3 43.2 5.7 18 04.6 6.7 18 03.9 3.8 8 04.8 5.4 29 0
0.2400000
000
Sedimentary-Volcanic Study2.8 3.9 11 14 2.50.82 2.0 2 0 0.173.8 3.9 9 1.7 0.81.4 2.3 24 1 02.7 3.7 2 9.2 1.51.5 2.3 5 36 1.20.68 2.0 4 19 1.42.6 3.5 15 9.6 2.82.9 4.1 10 0.7 0.56
0 69 126 930 10 34 530 45 180 580 38 221 770 35 36 800 75 141 590 26 208 470.11 19 38 650.04 13 35 490 21 80 470 17 34 500 28 42 65
0.25 22 27 870 54 30 850 37 55 830 45 45 911.4 40 25 940 54 30 890 48 38 900 11 81 560.3 36 69 793.0 52 10 1071.8 78 7 910 44 27 61
JAWRA 1166 JOURNAL OF THE AMERICAN WATER RESOURCES ASSOCIATION
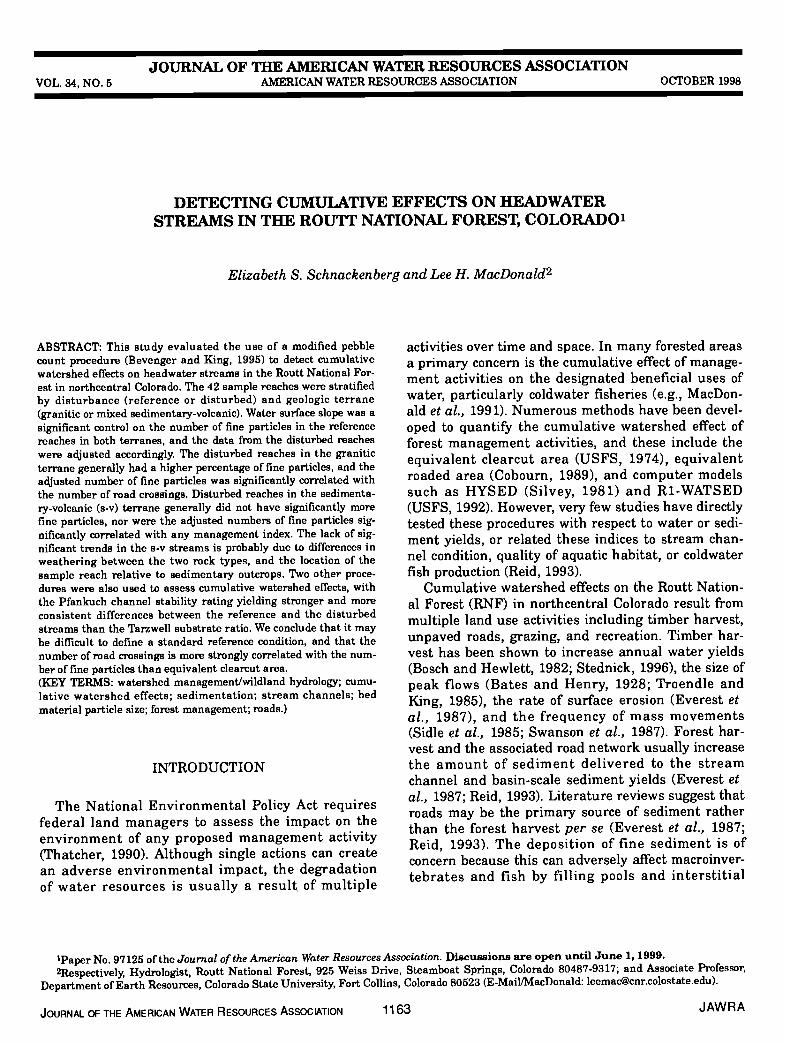
TABLE 1. Characteristics of Reference and Study Reaches in Granitic and Sedimentary-Volcanic Terranes.The five local control variables are elevation, drainage area (DAREA), water surface slope (WSLOPE), valley slope
(VSLOPE), and number of pieces of large woody debris per 300 m(LWD). Indices of management activity werethe equivalent clearcut area (ECA), number of road crossings per square kilometer (RDXING), and number ofroad segments within 60 m of a stream per square kilometer (RDTWO). Indices of stream channel conditionwere the number of particles less than eight millimeters (L8), Tarzwell substrate ratio (TSR), and Pfankuch
channel stability rating (PCSR). n/a indicates data were not available for that reach.
Elevation DAREA WSLOPE VSLOPEStream (meters) (hectares) (%) (%) LWD ECA RDXING RDTWO L8 TSR PCSR
3 013 1
4 0
0
0.160
1.4
0.690.591.51.11.83.73.62.7
2.80.51.14.81.76.00.762.61.82.20.606.7
4.20.973.79.02.26.72.52.82.43.01.2
11
271521453006264227762836293326972533284225942679
257629702945287928242970297027522848266726552230
252124612497278829943042249728482770
276424092606263625582776271524852788
21404380
533931
1500642506
26202760121031201400
103010601900363948159405
1660846533
1020611
8081080328
108017201490809493457
17603030966
11401840221014601220460
Elkhorn Cr.High Rock Cr.Rock Cr.Farnham Cr.Core Cr.French Cr.Red Dirt Cr.Damfino Cr.Line Cr.Upper Little Rock Cr.Lower Little Rock Cr.Burgess Cr.
S. Fork Little SnakeJohnson Cr.Lopez Cr.Lower Roaring ForkLower Trout Cr.Upper Trout Cr.Oliver Cr.
Upper Roaring ForkHorse Cr.
Corral Cr.First Cr.Grizzly Cr.King SolomonLower S. Fork SlaterWillow Cr.Snyder Cr.Mill Cr.N. Fork West Prong
0.441.81.32.5
2.0 8 03.1 33 03.4 14 010 n/a 0
0.24 37 27 770 32 24 770 43 20 910 17 58 690 17 33 760 35 16 950 36 17 820 44 27 890 39 37 89
0.59 41 29 n/a0.34 58 24 1231.3 33 26 900 46 32 1080.42 28 24 1050.35 35 57 820.35 79 18 1292.3 24 32 900 31 71 99

Detecting Cumulative Effects on Headwater Streams in the Routt National Forest, Colorado
particles in the reference reaches. Autocorrelationanalyses were run for 1 to 16 lags in each reach todetermine if each pebble was an independent sample.Samples from different observers were comparedusing chi-square contingency tables and Fisher'sexact two-tailed test (SAS, 1990).
Because this was an exploratory study rather thana monitoring project, five local controls were evaluat-ed for their effect on the particle-size distribution.The five local control variables were elevation,drainage area, valley slope, water surface slope, andnumber of pieces of large woody debris. Elevation,drainage area, and valley slope were determined fromU.S. Geological Survey 1:24,000 topographic maps.Water surface slope was surveyed in the field usingan engineers level and stadia rod. The number ofpieces of large woody debris was normalized to areach length of 300 meters. To be counted, a piece oflarge woody debris had to be longer than half thechannel width, thicker than five centimeters at thelarge end, and influence stream dynamics duringbankfull flow. Log jams were relatively rare and werecounted as a single piece of large woody debris.
Simple and stepwise regression (SAS, 1990) wereused to determine the effect of the five local controlson particle size in the reference reaches in each ter-rane. The regression model developed from the refer-ence reaches was then used to remove the effect ofsignificant local controls on the number of fine parti-cles in the study reaches. The resulting residualswere regressed against the three management indicesto evaluate the relative strength of the relationshipbetween the adjusted number of fine particles andeach management index (Helsel and Hirsch, 1992).We used this approach rather than pairwise compar-isons because the primary objective was to evaluatethe B&K methodology.
The two other indices used to evaluate streamchannel condition were the Tarzwell substrate ratio(TSR) and the Pfankuch channel stability rating(PCSR). The TSR is intended to be a dimensionlessindex of macroinvertebrate productivity (Tarzwell,1936, 1938), although the values were originallyderived from biomass data (J. Chanat, Colorado StateUniversity, personal communication, 1995). This pro-cedure ocularly classifies stream substrates accordingto the dominant particle size, presence of sand infill,and presence of aquatic plants (Ohlander, 1994). Eachsubstrate class is assigned a coefficient that quanti-fies the standing crop of macroinvertebrates relativeto a sand substrate. The TSR value for a reach isequal to the average o 100 samples taken at two-meter intervals along the thaiweg (Ohlander, 1994).
The PCSR was developed in the northern RockyMountains (Pfankuch, 1978) and is widely used in thewestern U.S. (Myers and Swanson, 1992). The PCSR
quantitatively assesses stream channel condition byevaluating 15 different attributes of the upper banks,lower banks, and channel bottom. The range of possi-ble values for each attribute varies according to anarbitrary weighting system, and the sum of theattribute values is the PCSR. Higher point totals rep-resent less stable channels, and fish biologists haveinterpreted high PCSR values as less productivereaches.
Three management indices were used to character-ize the amount of roads and forest harvest upstreamof each sample reach. The first index was the equiva-lent clearcut area (ECA), and this was originallydeveloped to predict the effect of roads and differenttypes of timber harvest on annual and monthly wateryields (USFS, 1974). Coefficients are used to convertthe area of each timber harvest, road, or certain otherground-disturbing activities into an equivalent num-ber of clearcut acres or ECAs (e.g., two acres of selec-tion cut harvested with tractors might be consideredjust under one ECA). This procedure and the analo-gous equivalent roaded area method have been widelyused by the U.S. Forest Service to evaluate water-shed-scale disturbance (e.g., Cobourn, 1989; McGurkand Fong, 1995). Hydrologic recovery curves havebeen explicitly incorporated, and this study assumeda linear 80-year recovery curve for timber harvest(Troendle and King, 1985).
The second management index was the number ofstream crossings by roads per square kilometer ofwatershed area (RDXING), while the third manage-ment index was the number of 400-m long road seg-ments within 60 m of a stream channel per squarekilometer of watershed area (RDTWO). Both of theseindices were selected because roads can generatemost of the sediment associated with forest manage-ment activities (e.g., Hafley, 1975; Megahan, 1984;Eaglin and Hubert, 1993; Waters, 1995). RDXINGand RDTWO were also relatively easy to obtain froma geographic information system that superimposedthe road network on the stream network as delineat-ed on USGS 1:24,000 topographic maps. The trans-portation layer included open and closed roads, butdid not include temporary roads or skid trails used inlogging operations.
For this study we defined reference reaches as hav-ing less than two percent ECA, and RDXING andRDTWO values of less than 0.25 per square kilome-ter. In a few cases sample reaches were located imme-diately downstream of roads and harvest units, andthese reaches were classified as study reaches eventhough the basin-scale disturbance indices were rela-tively low (Table 1). Conversely, two of the referencereaches had unexpectedly high management indices,but in each case the disturbance was primarily on theridges in the uppermost parts of the basin.
JOURNAL CF THE AMERICAN WATER RESOURCES ASSOCIATION 1167 JAWRA
Schnackenberg and MacDonald
T-tests were used to compare the mean TSR andPCSR values between the study and reference reach-es. Differences in the variance between study and ref-erence reaches were assessed by F-tests; if thevariance was significantly different, an unequal vari-ance t-test was used to evaluate the differencebetween means. Stepwise regression was used toassess whether the TSR and PCSR values could bepredicted from the three management indices.
Overall Analysis
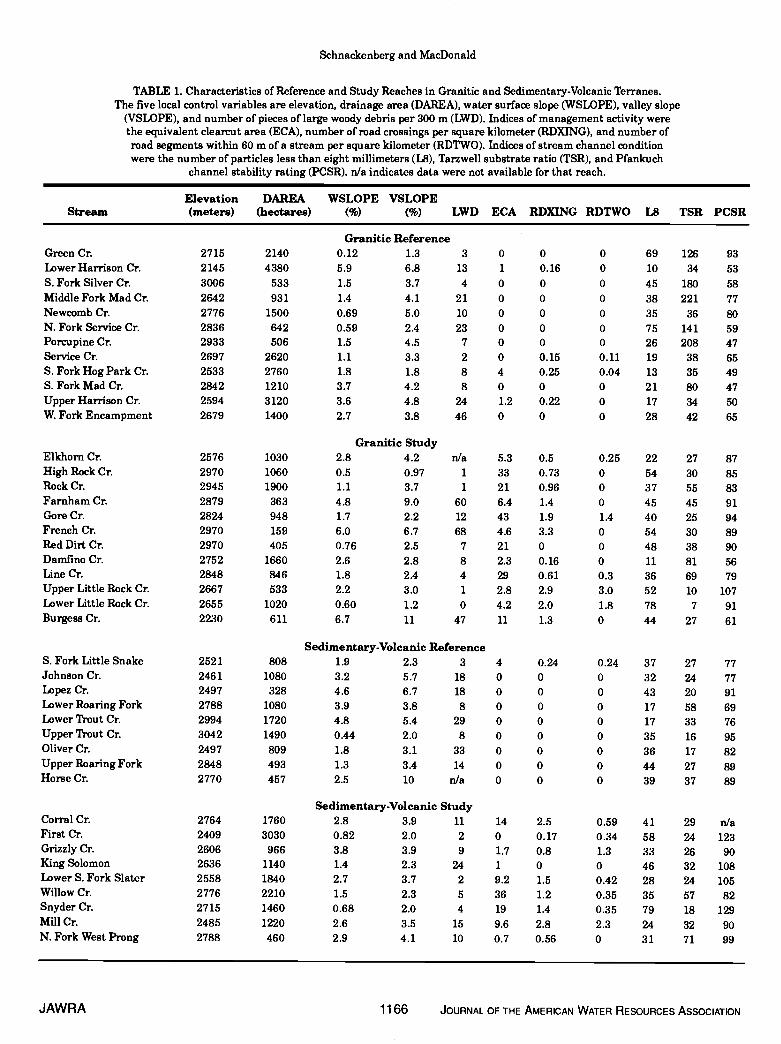
The granitic reference reaches generally had fewersmall particles and significantly (p = 0.04) more vari-ability than the sedimentary-volcanic reference reach-es (Figure 2). On this basis the two terranes wereseparated for all subsequent analyses.
Figure 2. Boxplots Comparing L8 Values for the Granitic andSedimentary-Volcanic Reference Reaches. The middle line
represents the median, while the top and bottom of thebox represent the 25th and 75th percentiles, respectively.
Whiskers show the 5th and 95th percentiles,and the solid circles indicate outliers
Correlation tables indicated that the number ofparticles less than 8 mm in diameter (L8) was veryhighly correlated (r> 0.9; p = 0.0001) with the num-ber of particles less than 4 and 10 mm, respectively(Table 2). Correlations between L8 and the number ofparticles less than 2 mm were not quite as strong
(r> 0.80) but were still highly significant. Hence theresults are quite robust with regard to the chosenbreakpoint in particle size, and subsequent analysesused just the L8 values.
L2 L4 L8 Lb
L2 rp-value
—
—
0.970.000 1
0.840.0001
0.930.000 1
IA rp-value
0.940.0001
—
—
0.910.0001
0.970.0001
L8 rp-value
0.850.0001
0.960.0001
—
—
0.970.0001
Lb rp-value
0.800.0001
0.930.0001
0.990.0001
—
—
The autocorrelation analysis indicated that therewas a significant autocorrelation (p < 0.05) in at leastone sample reach for 13 of the 16 lags tested (Table 3).Seven of the 42 sample reaches had a significant lag-one autocorrelation (highest R2 = 0.22), and five of thereaches were significantly correlated at lag 10 (high-est R2 = 0.22). These results suggest that samplestaken one meter apart may not be completely inde-pendent, and this would violate one of the keyassumptions underlying the use of chi-squared contin-gency tables. On the other hand, the 36 significantautocorrelations is only slightly greater than the 34autocorrelations that would be expected by chance(i.e., 16 lags times 42 reaches with a level of signifi-cance of 0.05). The mean R2 for the statistically signif-icant autocorrelations ranged from 0.08 for lags oneand ten to 0.04 for most of the other lags (Table 3).These low values, plus the fact that 95 percent of thelags were not significant, led us to conclude that auto-correlation can be a potential problem, but did notsignificantly affect the results of our study.
Twenty-two pairwise comparisons between elevendifferent pairs of observers found no significant differ-ences (p < 0.10) between observers (Table 4; Figure 3).While this suggests a lack of significant observer bias,the mean difference of 4.2% and the standard devia-tion of 2.9 percent suggests that observer variabilitycould cause up to a 10 percent shift in the number offine particles.
JAWRA 1168 JOURNAL OF THE AMERICAN WATER RESOURCES ASSOCIATION
RESULTS
TABLE 2. Correlation Coefficients (r) and p-Values for DifferentSize Classes in the Granitic Reaches (n = 24) in the Upper
Half of the Table and Sedimentary-Volcanic Reaches (n = 18)in the Lower Half of the Table. L2, IA, L8, and Lb refer to
the number of particles with an intermediate diametersmaller than 2, 4, 8, and 10 mm, respectively.
EE
V
a)U
Ca)
Ez
80
60
40
20
0
Granitic Sedimentary-volcanic

Detecting Cumulative Effects on Headwater Streams in the Routt National Forest, Colorado
TABLE 3. Number, Mean, and Maximum of Statistically Significant (p < 0.06) Autocorrelations for One to Sixteen Lags.Negative correlations were converted to absolute values to calculate the mean autocorrelation for each lag.
Lag 1 2 3 4 5 6 7 8 9 10 II 12 13 14 15 16 Total
Number of Significant 7 3 2 1 0 0 2 2 2 5 4 2 0 2 2 2 36Correlations
Mean Correlation 0.28 0.23 0.20 0.24 — — 0.23 0.22 0.19 0.28 0.23 0.20 — 0.24 0.21 0.20 0.24
Maximum Correlation 0.47 0.31 0.21 0.24 -. — 0.23 0.24 0.20 0.47 0.32 0.23 — 0.30 0.24 0.20 0.47
TABLE 4. Comparison of L8 Values Between Observers.
Number of Number NumberParticles of ofCounted Particles Particles
PercentDifferenceBetween
Stream (per observer) Observer #1 <8 mm Observer #2 <8 mm Observers P-Value
Uncompahgre Cr. 100 K. Wolff 21 T. Fratt 29 8.0 0.25
Uncompahgre Cr. 100 K. Wolff 21 J. Almy 25 4.0 0.62
Uncompahgre Cr. 100 T. Fratt 29 J. Almy 25 4.0 0.63
Upper South Fork Slater Cr. 100 L. Schnackenberg 15 5. Cowman 12 3.0 0.68
Upper Little Rock Cr. 150 L. Schnackenberg 53 S. Cowman 42 7.3 0.21
Lower Little Rock Cr. 150 L. Schnackenberg 81 5. Cowman 80 0.7 1.00
Mill Cr. 150 L. Schnackenberg 32 5. Cowman 21 7.3 0.13
Horse Cr. 150 L. Schnackenberg 42 K. Foster 52 6.7 0.26
Gore Cr. 148 L. Schnackenberg 42 S. Cowman 43 0.7 1.00
High Rock Cr. 100 L. Schnackenberg 28 S. Cowman 35 7.0 0.36
High Rock Cr. 100 L. Schnackenberg 28 L. MacDonald 36 8.0 0.29
High Rock Cr. 100 L. MacDonald 36 S. Cowman 35 1.0 1.00
Mule Cr. 150 L. Schnackenberg 96 S. Coulson 100 2.7 0.72
North Fork West Prong Cr. 50 L. Schnackenberg 11 5. Cowman 11 0.0 1.00
King Solomon Cr. 150 L. Schnackenberg 47 5. Cowman 59 8.0 0.18
First Cr. 150 L. Schnackenberg 60 S. Coulson 51 6.0 0.34
North Fork Elkhead Cr. 100 L. Schnackenberg 31 S. Cowman 32 1.0 1.00
North Fork ElkheadCr. 100 L. Schnackenberg 31 C. Clapsaddle 30 1.0 1.00
North Fork Elkhead Cr. 100 C. Clapsaddle 30 S. Cowman 32 2.0 0.88
Upper Trout Cr. 150 L. Schnackenberg 39 5. Coulson 50 7.3 0.21
Middle Fork Mad Cr. 150 L. Schnackenberg 39 L. Belton 33 4.0 0.50
Burgess Cr. 150 L. Schnackenberg 49 S. Coulson 46 2.0 0.80
Reaches in Granitic-Terrane
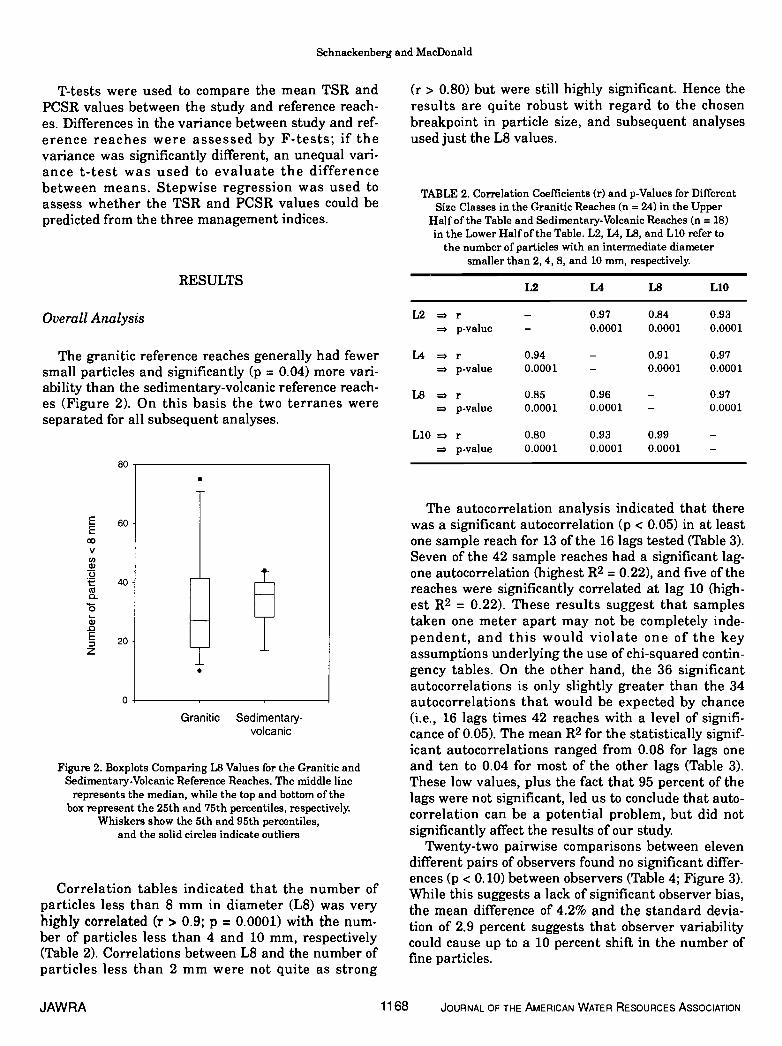
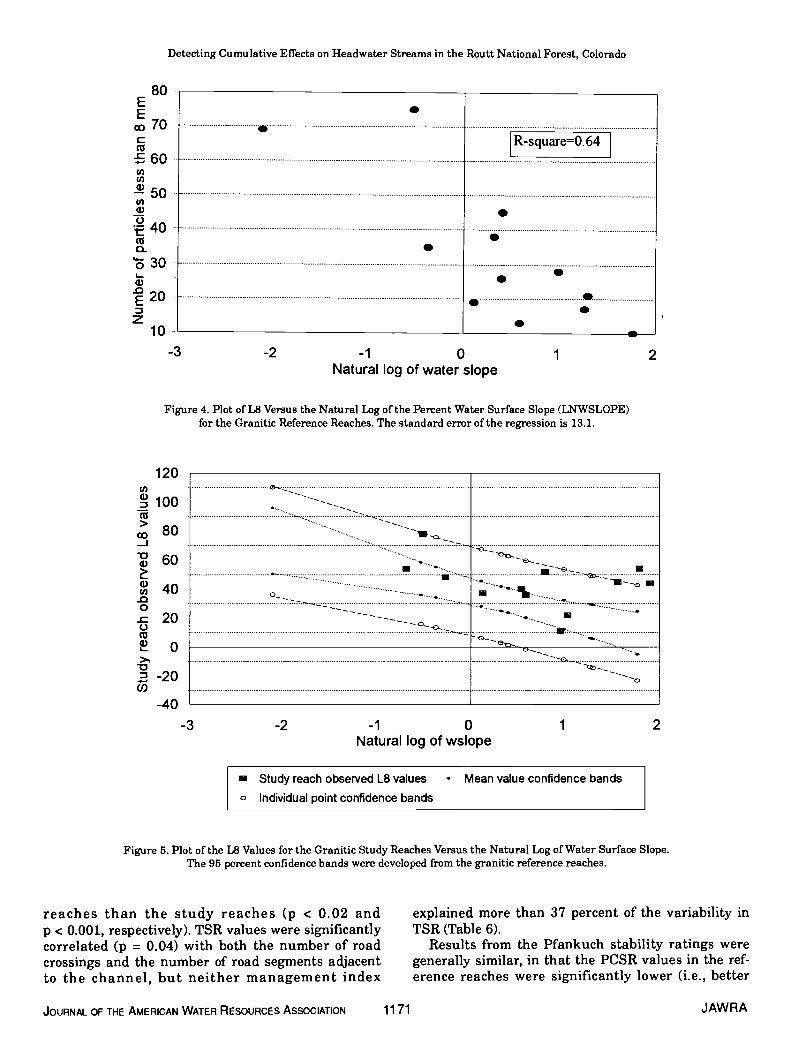
Stepwise regression showed that water surfaceslope was the only significant local control on L8 inthe granitic reference reaches. The significance of thecorrelation was strengthened by using the natural logof the water surface slope (LNWSLOPE) (Table 5; Fig-ure 4). The resulting regression model was:
Predicted L8 = 38.6 - 16.3 * LNWSLOPE
This had a R2 of 0.64 and a standard error of 3.8 per-cent.
Using the reference reach data, ninety-five percentconfidence bands were calcu'ated for both individualpoints and expected means. The L8 values for thestudy reaches were plotted on this graph (Figure 5),and all but one of the study reaches plot on or abovethe regression line. Six of the study reaches fell out-side the mean value confidence bands developed fromthe reference reach data, while four values plotted onor above the 95 percent confidence bands for individu-
(1)al points (Figure 5).
The effect of water surface slope on the L8 valuesin the study reaches was removed by applyingthe regression model developed from the reference
JOURNAL OF THE AMERICAN WATER RESOURCES AssociATioN 1169 JAWRA

J100
80
60
40
20
Schnackenberg and MacDonald
Observer 1: number of particles <8 mm
Figure 3. Comparison of L8 Values as Determined by TwoObservers in the Same Reach With a 1:1 Reference Line.
100
TABLE 5. Correlation Matrix for L8 and Local Controls for Granitic Reference Reaches in the Upper Halfof the Table, and Sedimentary-Volcanic Reference Reaches in the Lower Half of the Table.
The thp number in each box is the correlation coefficient, and the lower number is the p-value.Variable names are the same as in Table 1; LNWSLOPE is the natural log of the water surface slope.
L8 ELEV DAREA WSLOPE LNWSLOPE VSLOPE LWD
L8 —— 0.480.12
-0.540.07
-0.680.02
-0.800.002
-0.570.05
0.0010.999
ELEV -0.360.34
—— -0.890.000
-0.650.02
-0.390.21
-0.380.22
-0.170.59
DAREA -0.760.02
0.550.12
—— 0.600.04
0.300.35
0.320.31
-0.070.83
WSLOPE -0.500.17
-0.160.67
0.0690.86
—— 0.860.0004
0.710.009
0.230.47
LNWSLOPE N/A N/A N/A N/A -- 0.690.0 13
0.310.32
VSLOPE 0.090.81
-0.110.78
-0.370.33
0.490.18
N/A — — 0.140.67
LWD -0.130.76
-0.110.79
0.110.79
0.320.44
N/A 0.420.30
— —
reaches. Stepwise model selection indicated thatRDXING was the only management index significant-ly correlated with the adjusted (i.e., residual) L8 val-ues (R2 = 0.61) (Table 6; Figure 6). This relationshipsuggests that road crossings have a greater effect on
the bed material partic'e size than the area disturbedby timber harvest.
With regard to the other two channel assessmentprocedures, the Tarzwell substrate ratios were signifi-cantly higher and more variable in the reference
JAWRA 1170 JOURNAL OF THE AMERICAN WATER RESOURCES ASSOCIATION
0 20 40 60 80
Detecting Cumulative Effects on Headwater Streams in the Routt National Forest, Colorado
Figure 4. Plot of L8 Versus the Natural Log of the Percent Water Surface Slope (LNWSLOPE)for the Granitic Reference Reaches. The standard error of the regression is 13.1.
120U)Cu
Cu>co-J-Cu
2:CuU)00c 20U(UCu
>.,
-20(I)
-40
reaches than the study reaches (p < 0.02 andp < 0.001, respectively). TSR values were significantlycorrelated (p = 0.04) with both the number of roadcrossings and the number of road segments adjacentto the channel, but neither management index
explained more than 37 percent of the variability inTSR (Table 6).
Results from the Pfankuch stability ratings weregenerally similar, in that the PCSR values in the ref-erence reaches were significantly lower (i.e., better
JOURNAL CF THE AMERICAN WATER RESOURCES ASSOCIATION 1171 JAWRA
80E
c70
60U)U)
!50U)Cu
0CU0'4-0Cu.0Ez
10
.[R-square=O.64
S
S.. S
S S..-3 -2 -1 0
Natural log of water slopeI 2
-3 -2 -1 0 1 2Natural log of wslope
0
Study reach observed L8 values Mean value confidence bands
Individual point confidence bands
Figure 5. Plotof the L8 Values for the Granitic Study Reaches Versus the Natural Log of Water Surface Slope.The 95percent confidence bands were developed from the granitic reference reaches.

Schnackenberg and MacDonald
stream channel condition) than in the study reaches(p = 0.001). In contrast to the TSR, there was no sig-nificant difference in the variance between the refer-ence and study reaches. The PCSR values were alsosignificantly correlated with both RDTWO and RDX-ING, but again these management indices did notexplain more than 37 percent of the variability in thePCSR values (Table 6). Neither the TSR nor thePCSR values were significantly correlated with equiv-alent clearcut area (Table 6).
TABLE 6. Correlation Coefficients (r) and p-Values for theGranitic Study Reaches Between the Three AssessmentProcedures [L8 residuals (L8RES), TSR, and Pfankuchchannel stability rating) and the Three Management
Indices (ECA, RDXING, and RDTWO).
L8RES TSR PCSR
ECA rp-value
-0.380.23
0.100.74
0.100.75
RDX1NG rp-value
0.780.003
.0.60004
0.530.08
RDTWO rp-value
0.240.45
-0.6120.04
0.610.03
Reaches in the Sedimentary-Volcanic Terrane
Stepwise model selection chose both drainagearea (DAREA) and water surface slope (WSLOPE) as
U)Cu
-UU)a)I.-
-J
significant local controls on L8 in the reference reach-es in the s-v terrane (Table 5). However, the L8 valueswere only adjusted for WSLOPE because the refer-ence reaches had significantly smaller drainage areasthan the study reaches (p < 0.03). The resultingregression model was:
Predicted L8 = 42.4 - 3.36 * WSLOPE (2)
The relationship between WSLOPE and L8 was muchweaker than for the granitic reference reaches (R2 =0.25).
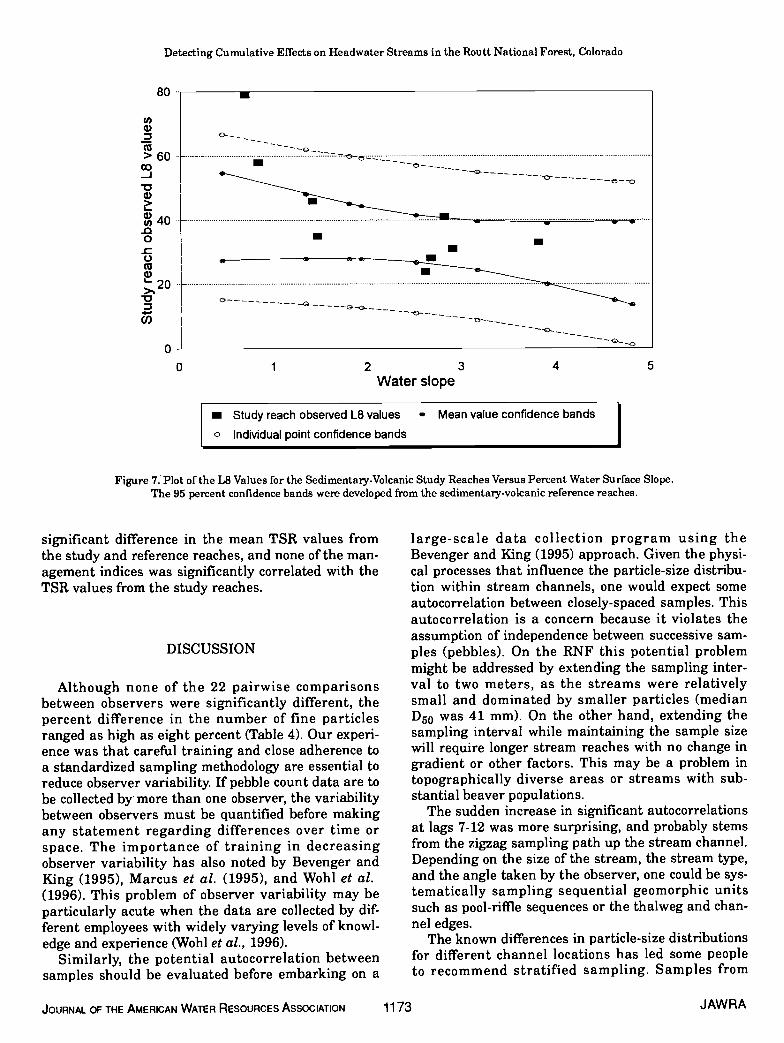
In contrast to the granitic study reaches, there wasless of a tendency for the study reaches in the s-v ter-rane to plot above the confidence bands developedfrom the reference reaches (Figure 7). Only three ofthe nine study reaches plotted on or above the 95 per-cent confidence band for mean values, while only onereach was above the 95 percent confidence band forindividual values. One reach (Mill Creek) plottedbelow the 95 percent confidence band for mean val-ues. Stepwise model selection indicated that none ofthe management indices was significantly correlatedwith the adjusted L8 values for the study reaches.
With regard to the other two channel assessmenttechniques, the mean PCSR in the study reacheswas significantly higher (p = 0.001) than the meanvalue in the reference reaches. The variance in thestudy reaches was also greater than in the referencereaches (p = 0.09). However, none of the managementindices was significantly correlated with thePCSR values from the study reaches. There was no
Figure 6. Plot of the Adjusted L8 Values for the Granitic Study Reaches Against theNumber of Road Crossings Per Square Kilometer of Watershed Area (RDXING).
JAWRA 1172 JOURNAL OF THE AMERICAN WATER RESOURCES AssociATioN
50
40
30
20
10
0
-10
-20
.R-square= 0.61
S
S.
S SS
S
0 0.5 1 1.5 2 2.5 3 3.5RDXING
Detecting Cumulative Effects on Headwater Stream8 in the Routt National Forest, Colorado
80
(I)a)
(U> 60co-j•01)
a)(0
0-c0
0 1 2 3 4 5
significant difference in the mean TSR values fromthe study and reference reaches, and none of the man-agement indices was significantly correlated with theTSR values from the study reaches.
DISCUSSION
Although none of the 22 pairwise comparisonsbetween observers were significantly different, thepercent difference in the number of fine particlesranged as high as eight percent (Table 4). Our experi-ence was that careful training and close adherence toa standardized sampling methodology are essential toreduce observer variability. If pebble count data are tobe collected by more than one observer, the variabilitybetween observers must be quantified before makingany statement regarding differences over time orspace. The importance of training in decreasingobserver variability has also noted by Bevenger andKing (1995), Marcus et al. (1995), and WohI et al.(1996). This problem of observer variability may beparticularly acute when the data are collected by dif-ferent employees with widely varying levels of knowl-edge and experience (Wohl et al., 1996).
Similarly, the potential autocorrelation betweensamples should be evaluated before embarking on a
large-scale data collection program using theBevenger and King (1995) approach. Given the physi-cal processes that influence the particle-size distribu-tion within stream channels, one would expect someautocorrelation between closely-spaced samples. Thisautocorrelation is a concern because it violates theassumption of independence between successive sam-ples (pebbles). On the RNF this potential problemmight be addressed by extending the sampling inter-val to two meters, as the streams were relativelysmall and dominated by smaller particles (medianD50 was 41 mm). On the other hand, extending thesampling interval while maintaining the sample sizewill require longer stream reaches with no change ingradient or other factors. This may be a problem intopographically diverse areas or streams with sub-stantial beaver populations.
The sudden increase in significant autocorrelationsat lags 7-12 was more surprising, and probably stemsfrom the zigzag sampling path up the stream channel.Depending on the size of the stream, the stream type,and the angle taken by the observer, one could be sys-tematically sampling sequential geomorphic unitssuch as pool-riffle sequences or the thaiweg and chan-nel edges.
The known differences in particle-size distributionsfor different channel locations has led some peopleto recommend stratified sampling. Samples from
Water slope
• Study reach observed LB values • Mean value confidence bands
o Individual point confidence bands
Figure 7. Plot of the L8 Values for the Sedimentary-Volcanic Study Reaches Versus Percent Water Surface Slope.The 95 percent confidence bands were developed from the sedimentary-volcanic reference reaches.
JOURNAL OF THE AMERICAN WATER RESOURCES ASSOCIATION 1173 JAWRA

Schnackenberg and MacDonald
different geomorphic units are then weighted by theproportion of the channel that falls in each of the dif-ferent units (Kondolf, 1997). This approach may workwell in those stream types with distinct geomorphicunits and low enough flows that each unit can be ade-quately sampled, but it implicitly assumes that onecan consistently identify distinct habitat units andaccurately estimate their respective areas in thereach under study. Both of these assumptions arequestionable (e.g., Pleus, 1995; Myers and Swanson,1997). In plane-bed or other streams where distincthabitat units are not easily identifiable, or in smallerstreams where one traverses a representative sampleof the different habitat units, the B&K method isprobably better suited to provide an estimate of thereach-scale particle-size distribution. In these situa-tions the autocorrelation issue is less of a problemthan might be suggested by a simple autocorrelationanalysis.
Another issue that typically complicates the detec-tion of CWEs is the inherent variability in relativelyundisturbed stream channels. Water surface slopeaccounted for almost two-thirds of the variability inL8 values in the granitic reference reaches. The selec-tion of water slope as a significant local control is con-sistent with our understanding of the energyavailable for entrainment and sediment transport(Knighton, 1984). The importance of water surfaceslope in determining channel characteristics — partic-ularly bed material particle size — was also document-ed in a study of nearly 100 reaches in northwesternMontana (Madsen, 1994).
A stepped classification of stream type (Mont-gomery and Buffington, 1993; Rosgen, 1994) will helpaccount for the effect of gradient, but this stratifica-tion is not the statistically most effective means toremove the effect of continuous variables such aswater surface slope. Failure to account for gradient orother local controls will make it extremely difficult todefine standard reference conditions. On the otherhand, it is not practical, and probably impossible, tosample enough reaches to quantify the effect of all theimportant local controls. Thus the combination ofmeasured and unmeasured local controls will alwayscreate a range of variability within reference reaches.
This study indicates that it may also be necessaryto stratuS' streams by bedrock lithology to reduce thevariation within reference reaches. A comparison ofthe granitic and s-v reference reaches showed that theTSR was significantly higher (p = 0.01) and the PCSRwas significantly lower (p = 0.001) in the granitic ref-erence reaches than in the s-v reference reaches. Thevariability in L8 and TSR was also significantlydifferent between the two sets of reference reaches.Although the granitic reference reaches did have
larger (p = 0.03) and more variable (p =0.01) drainageareas than the s-v reference reaches, this does notreadily explain the observed differences between thetwo sets of reference reaches. Thus geology can have asignificant effect on channel characteristics in undis-turbed reaches, and this effect will vary with thechannel assessment procedure being used.
Geology can also affect the channel response toanthropogenic disturbance. In the granitic terranethere were much stronger and more consistent rela-tionships between the stream channel characteristicsand the management indices. We believe that the lackof correlation in the s-v terrane between the threechannel assessment procedures (L8, TSR, and PCSR)and the three management indices, as well as thepoorer correlation between water slope and L8, islargely due to the location of the sample reaches rela-tive to volcanic outcrops. Field observations suggestthat reaches closer to volcanic outcrops had more vol-canic particles and lower amounts of fine sediment.Conversely, reaches located in or immediately down-stream of sedimentary outcrops had a finer substrate.For the sedimentary-volcanic reaches this geologiccontrol may have a greater effect on bed material par-ticle size than moderate levels of forest managementactivities. Failure to consider these differences inlithology and weathering could easily bias the resultsof comparisons between managed and unmanagedbasins (Rinne and Neary, 1996).
The observed difference in drainage area betweenthe reference and study reaches in the s-v terrane isanother complication in the identification of CWEs.One would normally expect a fining of the bed materi-al with increasing drainage area, and hence the studyreaches in the s-v terrane should have plotted evenhigher above the regression line in Figure 7. From apractical point of view, it is difficult to obtain com-pletely comparable pairs or sets of reference andstudy reaches, and this will always hinder the identi-fication of CWEs.
In terms of predicting and minimizing CWEs,equivalent clearcut area was not significantly corre-lated with any of the channel assessment procedures.On the other hand, the strong relationship betweenthe number of road crossings and the three channelassessment procedures is consistent with recent stud-ies that emphasize roads as the primary cause ofchanges in runoff and sediment production in forestedareas (Eaglin and Hubert, 1993; Madsen, 1994; Jonesand Grant, 1996). The much poorer correlation in thegranitic terrane between the adjusted L8 values andRDTWO may be due to the large variability in theeffects of nearby road segments on stream channels.Road crossings provide a direct input of sedimentfrom unpaved roads into the stream, while runoff
JAWRA 1174 JOURNAL OF THE AMERICAN WATER RESOURCES ASSOCIATION

Detecting Cumulative Effects on Headwater Streams in the Routt National Forest, Colorado
from road segments near the stream will usuallyinfiltrate downslope (Campbell and Stednick, 1983;Megahan, 1984).
The effect of timber harvest on a particular channelwill vary with the proximity to the stream, sideslopesteepness, and the amount of overland or channelizedflow. The lack of any significant correlations betweenECA and stream channel characteristics suggeststhat ECA is a poor surrogate for the changes in runoffand erosion that might then affect stream channelcharacteristics. A study in northern Idaho alsoshowed a poor correlation between ECA values andthe observed changes in flow due to forest harvest androad building (King, 1989).
One limitation inherent in all three managementindices is the problem of defining the amount of recov-ery over time. The ECA index explicitly includeshydrologic recovery, but the modeled reduction inECA values over time presumes successful regenera-tion. In reality, recovery rates will vary considerablywith site conditions. The effects of roads will also varyover time according to the rate of regrowth on cut andfill slopes, the amount of traffic, and the amount andtype of maintenance activities (Megahan, 1974; Reidand Dunne, 1984). Substantial revegetation on closedroads with adequate drainage may largely eliminatesoil erosion and the delivery of sediment to the streamchannels. On the other hand, a closed road with sur-face ruling and inadequate drainage may deliver asmuch sediment to the stream channel as a well-designed new road with frequent drainage onto vege-tated hillslopes.
Another problem in quantifying managementindices is the primary emphasis on timber harvestand roads. Other management activities — such asgrazing, campgrounds, water diversions, and skiresorts — affect runoff, erosion, and stream channelcondition, but these are rarely considered in mostCWE assessments. Much of the RNF was intensivelygrazed at the turn of the century, and although graz-ing rates have been reduced, the streams may still berecovering. Quantification of grazing effects is diffi-cult because of the confounding effects of wildlife anddifferences in the season, duration, and intensity ofgrazing within a basin.
Similarly, the Steamboat Springs ski area mayaffect water and sediment yields through forest clear-ing, snowmaking, soil compaction, and road and trailconstruction, and it is difficult to characterize theseeffects through a simple index such as ECA or num-ber of road crossings. The impact of the ski area issuggested by the fact that Burgess Creek, whichdrains most of the Steamboat Springs ski area, wasone of the two granitic study reaches with an adjustedL8 above the 95 percent confidence interval for indi-vidual reaches. A better quantification of these other
management impacts could strengthen the linkagebetween land-use activities and substrate changes,but it is unrealistic to expect that a single index canaccurately quantify changes in both runoff and sedi-ment production.
Regardless of the difficulties in quantifying man-agement impacts, the B&K procedure can be used todetect differences in the amount of fine sediment at areach scale. The inevitable presence of other sourcesof variability mean that this technique, like any otherchannel assessment procedure, is far from perfect,and this uncertainty must be recognized by land man-agers. The reach-scale approach of the B&K proce-dure is a useful scale for resource managers, and thefocus on bed material particle size does allow a directlink to coldwater fisheries.
With respect to the other two channel assessmentprocedures, the PCSR indicated significantly poorerchannel condition in the study reaches relative to thereference reaches in both terranes. In contrast, theTSR did not show a significant difference between thereference and study reaches in the s-v terrane, and inthe granitic terrane the differences between the refer-ence and study reaches were weaker and less consis-tent than for the PCSR. These results provide somesupport for the use of the PCSR relative to the TSR.
One limitation to the use of both TSR and PCSR isthat these have not been as directly linked to coldwa-ter fisheries as the composition of the bed material. Amore explicit evaluation of some of the specificattributes used in the PCSR procedure might providemore insight into stream channel response, and hencemore guidance for managers (Myers and Swanson,1992; MacDonald et al., 1997). Tracking individualattributes might also indicate which channel charac-teristics are more sensitive or responsive to particularmanagement activities, and provide a more directlinkage to specific designated beneficial uses.
It should also be noted that because this study wasconducted in one field season, we were not able toinvestigate the annual variability in L8 or the othertwo channel assessment procedures. Knowledge of theannual variability is essential if the pebble count orother procedures are to be used to monitor changes ina reach over time. We purposefully sampled a largernumber of streams in one field season to evaluate therelationship between stream channel condition andmanagement activities, and this design also allowedus to address the variation between streams. Assess-ing change over time could avoid the issues of localcontrols and consistency between reaches, but thisthen requires either that sampling take place priorto any management activity, or that one need onlyto identify trends rather than condition on an abso-lute scale. In most cases monitoring begins aftermanagement activities have been initiated, and a
JOURNAL OF THE AMERICAN WATER RESOURCES ASSOCIATION 1175 JAWRA

Schnackenberg and MacDonald
comparative approach means that consistencybetween reaches must be addressed. The other pointis that land management decisions can rarely be puton hold until a trend is clearly established, and thisalso forces managers into a comparative approach asfollowed here.
CONCLUSIONS
The modified pebble count technique (Bevengerand King, 1995) can, in some cases, identify signifi-cant differences in the amount of fine sediment on areach scale in the Routt National Forest. The reliabil-ity and sensitivity of this procedure will be increasedby an explicit evaluation of observer variability, theeffect of local controls (such as gradient and geologicterrane), and the interannual variability. Because allthe different sources of variation in bed material par-ticle size cannot be accounted for, the range of condi-tions in the reference reaches must be defined beforedetermining whether one or more study reaches havebeen adversely affected by management activities.Hence our ability to detect change can be improved byremoving some of the variability by stratification orstatistical analyses.
While the modified pebble count procedure pro-vides quantitative information regarding changes inthe bed material size, supplemental monitoring tech-niques are recommended to address other streamcharacteristics and improve reliability. The Pfankuchchannel stability rating addresses the upper andlower banks as well as the stability of the substrate,and this appears to provide more consistent resultsthan the Tarzwell substrate ratio.
ACKNOWLEDGMENTS
The Routt National Forest provided both logistical and financialsupport for this study, and without their support this study wouldnot have been possible. Rudy King, John Potyondy, Chuck Troendle,and Ellen Wohl all contributed their time and technical expertise.Rob Sampson graciously conducted additional analyses that deep-ened our understanding of the data, while Mark Taylor and RodChimner improved the final figures. Publication costs were sup-ported by the U.S. Environmental Protection Agency under Con.tract X825780-O1-o and the U.S. Forest Service, and we aregrateful for their support. We also appreciated the relatively rapidreview and the comments of the three anonymous reviewers.
LiTERATURE CITED
Bates, C. G. and A. J. Henry 1928. Forest and Streamfiow Experi-ment at Wagon Wheel Gap, Colorado. Monthly Weather ReviewSupp. No. 3, USDA Weather Bureau, Washington, D.C., 79 pp.
Bevenger, G. S. and R. M. King, 1995. A Pebble Count Procedurefor Assessing Watershed Cumulative Effects. USDA Forest Ser-vice Rocky Mountain Range and Experiment Station ResearchPaper RM-RP-319, Fort Collins, Colorado, 17 pp.
Bosch, J. M. and J. D. Hewlett, 1982. A Review of CatchmentExperiments to Determine the Effect of Vegetation Changes onWater Yield and Evapotranspiration. Journal of Hydrology 55:3-23.
Campbell, D. H. and J. D. Stednick, 1983. Transport of Road-derived Sediment as a Function of Slope Characteristics andTime. Report from the Department of Earth Resources, ColoradoState University, to the Rocky Mountain Forest and RangeExperiment Station, Fort Collins, Colorado, 46 pp.
Chapman, D. W., 1988. Critical Review of Variables Used to DefineEffects of Fines in Redds of Large Salmonids. Transactions ofthe American Fisheries Society 117: 1-21.
Cobourn, J. 1989. An Application of Cumulative Watershed Effects(CWE) Analysis on the Eldorado National Forest in California.In: Proceedings of the Symposium on Headwaters Hydrology,W. Woessner and D. F. Potts (Editors). American WaterResources Association, Bethesda, Maryland, pp. 449-460.
Dietrich, W. E., J. W. Kirchner, H. Ikeda, and F. Iseya, 1989. Sedi-ment Supply and the Development of the Coarse Surface Layerin Gravel-bedded Streams. Nature 340:215-217.
Eaglin, G. S. and W. A. Hubert, 1993. Effects of Logging and Roadson Substrate and Trout in Streams of the Medicine Bow Nation-al Forest, Wyoming. North American Fisheries Management13:844-846.
Everest, F. H., R. L. Beschta, J. C. Scrivener, K. V. Koski, J. R.Sedell, and C. J. Cederholm, 1987. Fine Sediment and SalmonidProduction: A Paradox. In: Streamside Management: Forestryand Fishery Interactions, E. 0. Salo and T. W. Cundy (Editors).Contrib. No. 57, Inst. Forest Resources, Univ. Washington, Seat.tle, Washington, pp. 98-142.
Hafley, W. L., 1975. Rural Roads as a Source of Sediment Pollution— A Case Study. Watershed Management, Irrigation andDrainage Division, ASAE, New York, New York, pp. 393-405.
Helsel, D. R. and R. M. Hirsch, 1992. Statistical Methods in WaterResources. Studies in Environmental Science 49. Elsevier Sci.ence Publishers, Amsterdam, The Netherlands, 522 pp.
Jones, J. A. and G. E. Grant, 1996. Peak Flow Responses toClearcutting and Roads in Small and Large Basins, WesternCascades, Oregon. Water Resources Research 32(4):959-974.
King, J. G., 1989. Streamfiow Responses to Road Building and Har-vesting: a Comparison with the Equivalent Clearcut Procedure.USDA Forest Service Research Paper INT-401, Ogden, Utah, 13pp.
Kondolf, G. M., 1997. Application of the Pebble Count: Notes onPurpose, Methods, and Variants. Journal of the American WaterResources Association 33(1):79-87.
Knighton, D. 1984. Fluvial Forms and Processes. Edward Arnold,London, England, 218 pp.
MacDonald, L. H., A. W. Smart, and R. C. Wissmar, 1991. Monitor-ing Guidelines to Evaluate the Effects of Forestry Activities onStreams in the Pacific Northwest and Alaska. Paper No. 9 10/9-91-001, Region 10, U.S. Environmental Protection Agency, Seat-tle, Washington, 166 pp.
MacDonald, L. H., E. E. WohI, and S. Madsen, 1997. Validation ofWater Yield Thresholds on the Kootenai National Forest. Finalreport submitted to the Kootenai National Forest, Libby, Mon-tana, 197 pp.
JAWRA 1176 JOURNAL OF THE AMERICAN WATER RESOURCES ASSOCIATION

Detecting Cumulative Effects on Headwater Streams in the Routt National Forest, Colorado
Madsen, S., 1994. Channel Response Associated with PredictedWater and Sediment Yield Increases in Northwest Montana.M.S. Thesis, Dept. of Earth Resources, Colorado StateUniversity, Fort Collins, Colorado, 230 pp.
Marcus, W. A., S. Ladd, J. Stock, and J. D. Stoughton, 1995. PebbleCounts and the Role of User-Dependent Bias in DocumentingSediment-Size Distributions. Water Resources Research31( 10):2625-2631.
McGurk, B. J. and D. R. Fong, 1995. Equivalent Roaded Area as aMeasure of Cumulative Effect of Logging. Environmental Man-agement 19(4):609-621.
Meehan, W. R. (Editor), 1991. Influence of Forest and RangelandManagement on Salmonid Fishes and Their Habitat. Amer.Fish. Soc. Spec. Publ. 19, Bethesda, Maryland, 751 pp.
Megahan, W. F., 1974. Erosion Over Time on Severely DisturbedGranitic Soils: A Model. USDA Forest Service Research PaperIN'r-156, Ogden, Utah, 14 pp.
Megahan, W. F., 1984. Road Effects and Impacts — Watershed. In:Proceedings, Forest Transportation Symposium, IntermountainForest and Range Experiment Station, Boise, Idaho, pp. 57-97.
Megahan, W. F., J. P. Potyondy, and K. A. Seyedbagheri, 1992. BestManagement Practices and Cumulative Effects from Sedimenta-tion in the South Fork Salmon River: An Idaho Case Study. In:Watershed Management, R.A. Naiman (Editor). Springer-Ver-lag, New York, New York, pp.401-414.
Montgomery, D. R. and J. M. Buffington, 1993. Channel Classifica-tion, Prediction of Channel Response and Assessment of Chan-nel Condition. Report TFW-SH1O-93-002, WashingtonDepartment of Natural Resources, Olympia, Washington, 84 pp.
Montgomery, D. R. and J. M. Buffington, 1997. Channel-ReachMorphology in Mountain Drainage Basins. GSA Bulletin 109(5):596-611.
Myers, T. J. and S. Swanson, 1992. Variations in Stream Stabilitywith Stream 'I'pe and Livestock Bank Damage in NorthernNevada. Water Resources Bulletin 28(4):743-754.
Myers, T. J. and S. Swanson 1997. Precision of Channel Width andPool Area Measurements. Water Resources Bulletin 33(3):647-659.
Ohiander, C. A., 1994. Clean Water and T.Walk Training. RockyMountain Region, USDA Forest Service, Lakewood, Colorado.
Pfankuch, D. J., 1978. Stream Reach Inventory and Channel Sta-bility Evaluation. USDA Forest Service Northern Region, Mis-soula, Montana, 26 pp.
Pleus, A. E., 1995. Variability Associated With Salmon HabitatIdentification and Water Surface Area Measurements. M.S. The-sis, Evergreen State College, 130 pp., plus app.
Potyondy, J. P. and T. Hardy, 1994. Use of Pebble Counts to Evalu-ate Fine Sediment Increase in Stream Channels. WaterResources Bulletin 30(3):509-520.
Reid, L. M., 1993. Research and Cumulative Watershed Effects.USDA Forest Service General Tech. Report PSW-GTR-141,Albany California, 118 pp.
Reid, L. M. and T. Dunne, 1984. Sediment Production from ForestRoad Surfaces. Water Resources Research 20(11):1753-1761.
Rinne, J. N. and D. G. Neary, 1996. Fine Sediment and Fish: Indi-cators of Natural and Man-induced Landscape Influences. Pro-ceedings of the Sixth Federal Interagency SedimentationConference, Interagency Advisory Committee on Water Data,Washington, D.C., pp. IX-1 to IX-8.
Rosgen, D. L., 1994. A Classification of Natural Rivers. Catena22(3):169-199.
SAS, 1990. Statistical Analysis Software. SAS Institute, Inc., Cary,North Carolina.
Schnackenberg, E. S., 1996. Monitoring Cumulative EffectsThrough Modified Pebble Counts. M.S. Thesis, Department ofEarth Resources, Colorado State University, Fort Collins, Col-orado, 156 pp.
Sidle, R. C., A. J. Pearce, and C. L. O'Loughlin, 1985. Hillslope Sta-bility and Land Use. Water Resources Monograph Series No. 11,American Geophysical Union, Washington, D.C., 140 pp.
Silvey, L., 1981. HYSED: A Water Resources Analysis Model forForest Land Use Planning. Rocky Mountain Region, USDA For-est Service, Lakewood, Colorado.
Stednick, J. D., 1996. Monitoring the Effect of Timber Harvest onAnnual Water Yields. Journal of Hydrology 176(1-4):79-95.
Swanson, F. J., L. E. Benda, S. H. Duncan, G. E. Grant, W. F. Mega-han, L. M. Reid, and R. R. Ziemer, 1987. Mass Failures andOther Processes of Sediment Production in Pacific NorthwestForest Landscapes. In: Streamside Management: Forestry andFishery Interactions, E.O. Salo and T.W. Cundy (Editors). Con-trib. No. 57, Inst. Forest Resources, Univ. Washington, Seattle,Washington, pp. 98-142.
Tarzwell, C. M., 1936. Experimental Evidence on the Value of TroutStream Improvement in Michigan. Transactions of the Ameri-can Fisheries Society 61:48-51.
Tarzwell, C. M., 1938. Factors Affecting Fish Food and Fish Produc-tion in Southwestern Streams. Transactions of the AmericanFisheries Society 67:246-255.
Thatcher, T. L., 1990. Understanding Interdependence in theNatural Environment: Some Thoughts on Cumulative ImpactAssessment Under the National Environmental Policy Act.Environmental Law 20(3):611-647.
Troendle, C. A. and R. M. King, 1985. Effect of Timber Harvest onthe Fool Creek Watershed, 30 Years Later. Water ResourcesResearch 21(12):1915-1922.
USFS, 1974. Forest Hydrology. Part II: Hydrologic Effects of Vege-tation Manipulation. USDA Forest Service, Missoula, Montana,229 pp.
USFS, 1992: R1-WATSED-PC Handbook. USDA Forest ServiceRegion 1, Missoula, Montana.
Waters, T. F., 1995. Sediment in Streams. American Fisheries Soci-ety Monograph 7, Bethesda, Maryland, 251 pp.
Weaver, T. M. and J. J. Fraley, 1993. A Method to Measure Emer-gence Success of Westslope Cutthroat Trout Fry from VaryingSubstrate Compositions in a Natural Stream Channel. NorthAmerican Journal of Fisheries Management 13:817-822.
Wohl, E. E., D. J. Anthony, S. W. Madsen, and D. M. Thompson,1996. A Comparison of Surface Sampling Methods for CoarseFluvial Sediments. Water Resources Research 32(1):3219-3226.
Wolman, M. G., 1954. A Method for Sampling Coarse River-BedMaterial. Transactions American Geophysical Union 35(6):951-956.
JOURNAL OF THE AMERICAN WATER RESOURCES ASSOCIATION 1177 JAWRA