detailed project report on biomass gasifier...
TRANSCRIPT

DETAILED PROJECT REPORT ON
BIOMASS GASIFIER REPLACING FURNACE OIL
(HOWRAH CLUSTER)
Bureau of Energy Efficiency
Prepared By
Reviewed By

REPLACING FURNACE OILWITH BIOMASS GASIFIER
FOR GALVANIZING
HOWRAH GALVANIZING
AND WIRE DRAWING CLUSTER

BEE, 2010
Detailed project report on replacing furnace oil with biomass Gasifier
for galvanizing
Galvanizing and Wire Drawing SME Cluster,
Howrah, West Bengal (India)
New Delhi: Bureau of Energy Efficiency;
Detail Project Report No.: HWR/WDG/GFF/06
For more information
Bureau of Energy Efficiency
Ministry of Power, Government of India
4th Floor, Sewa Bhawan, Sector - 1
R. K. Puram, New Delhi -110066
Ph: +91 11 26179699 Fax: 11 26178352
Email: [email protected]
WEB: www.bee-india.nic.in
Acknowledgement
We are sincerely thankful to the Bureau of Energy Efficiency, Ministry of Power, for giving us
the opportunity to implement the ‘BEE SME project in “Howrah Galvanizing and Wire Drawing
Cluster, Howrah,West Bengal”. We express our sincere gratitude to all concerned officials for
their support and guidance during the conduct of this exercise.
Dr. Ajay Mathur, Director General, BEE
Smt. Abha Shukla, Secretary, BEE
Shri Jitendra Sood, Energy Economist, BEE
Shri Pawan Kumar Tiwari, Advisor (SME), BEE
Shri Rajeev Yadav, Project Economist, BEE
Indian Institute of Social Welfare and Business Management(IISWBM) is also thankful to
District Industry Center(DIC), Howrah chamber of Commerce & Industry(HCCI), Bengal
National Chamber of commerce & Industry(BNCCI), Federation of Small & Medium
Industry(FOSMI) and West Bengal Renewable Energy Development Agency(WBREDA) for
their valuable inputs, co-operation, support and identification of the units for energy use and
technology audit studies and facilitating the implementation of BEE SME program in Howrah
Galvanizing and Wire Drawing Cluster.
We take this opportunity to express our appreciation for the excellent support provided by
Galvanizing and Wire Drawing Unit Owners, Local Service Providers, and Equipment
Suppliers for their active involvement and their valuable inputs in making the program
successful and in completion of the Detailed Project Report (DPR).
IISWBM is also thankful to all the SME owners, plant in charges and all workers of the SME
units for their support during the energy use and technology audit studies and in
implementation of the project objectives.
Indian Institute of Social Welfare and Business
Management Kolkata

Contents
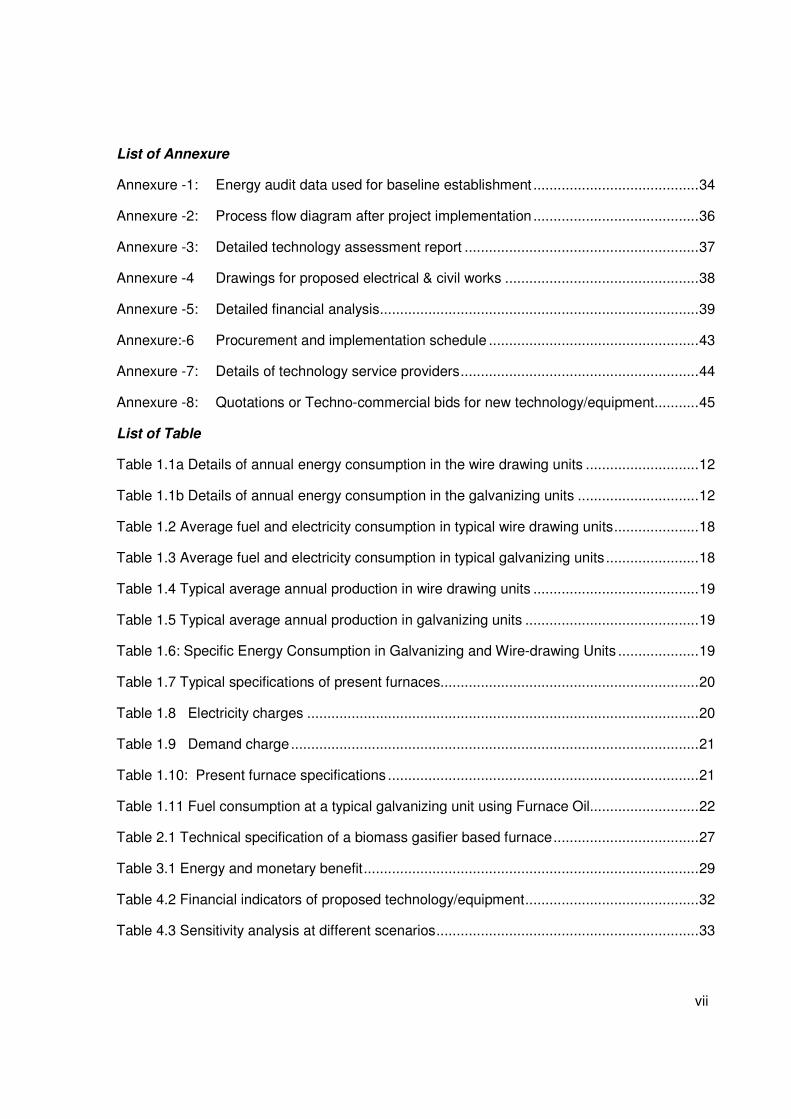
List of Annexure vii
List of Tables vii
List of Figures viii
List of Abbreviation viii
Executive summary ix
About BEE’S SME program xi
1. INTRODUCTION......................................................................................................... 12
1.1 Brief Introduction about cluster ................................................................................... 12
1.2 Energy performance in existing system ...................................................................... 17
1.2.1 Fuel consumption ........................................................................................................ 17
1.2.2 Average annual production ......................................................................................... 18
1.2.3 Specific energy consumption ...................................................................................... 19
1.3 Existing technology/equipment ................................................................................... 20
1.3.1 Description of existing technology ............................................................................... 20
1.3.2 Role in process ........................................................................................................... 21
1.4 Baseline establishment for existing technology ........................................................... 21
1.4.1 Design and operating parameters ............................................................................... 21
1.4.2 Operating efficiency analysis ....................................................................................... 22
1.5 Barriers in adoption of proposed equipment ............................................................... 22
1.5.1 Technological barrier ................................................................................................... 22
1.5.2 Financial barrier .......................................................................................................... 22
1.5.3 Skilled manpower ........................................................................................................ 23
2. PROPOSED EQUIPMENT FOR ENERGY EFFICENCY IMPROVEMENT ................. 24
2.1 Description of proposed equipment ............................................................................ 24
2.1.1 Details of proposed equipment .................................................................................... 24
2.1.2 Equipment/technology specification ............................................................................ 26

2.1.3 Integration with existing equipment ............................................................................. 27
2.1.4 Superiority over existing system .................................................................................. 27
2.1.5 Source of equipment ................................................................................................... 27
2.1.6 Availability of technology/equipment ........................................................................... 28
2.1.7 Service providers ........................................................................................................ 28
2.1.8 Terms and conditions in sales of equipment................................................................ 28
2.1.9 Process down time ...................................................................................................... 28
2.2 Life cycle assessment and risks analysis .................................................................... 28
2.3 Suitable unit for Implementation of proposed technology ............................................ 28
3.1 Technical benefit ........................................................................................................ 29
3.1.1 Fuel saving.................................................................................................................. 29
3.1.2 Electricity saving ......................................................................................................... 29
3.1.3 Improvement in product quality ................................................................................... 29
3.1.4 Increase in production ................................................................................................. 29
3.1.5 Reduction in raw material ............................................................................................ 29
3.1.6 Reduction in other losses ............................................................................................ 29
3.2 Monetary benefits ....................................................................................................... 29
3.3 Social benefits ............................................................................................................ 30
3.3.1 Improvement in working environment .......................................................................... 30
3.3.2 Improvement in workers skill ....................................................................................... 30
3.4 Environmental benefits ............................................................................................... 30
3.4.1 Reduction in effluent generation .................................................................................. 30
3.4.2 Reduction in GHG emission ........................................................................................ 30
4. INSTALLATION OF PROPOSED EQUIPMENT ......................................................... 31
4.1 Cost of project ............................................................................................................ 31
4.1.1 Equipment cost ........................................................................................................... 31
4.1.2 Erection, commissioning and other misc. cost ............................................................. 31

4.2 Arrangements of funds ............................................................................................... 31
4.2.1 Entrepreneur’s contribution ......................................................................................... 31
4.2.2 Loan amount. .............................................................................................................. 31
4.2.4 Terms & conditions of loan .......................................................................................... 32
4.3 Financial indicators ..................................................................................................... 32
4.3.1 Cash flow analysis ...................................................................................................... 32
4.3.2 Simple payback period ................................................................................................ 32
4.3.3 Net Present Value (NPV) ............................................................................................ 32
4.3.4 Internal rate of return (IRR) ......................................................................................... 32
4.3.5 Return on investment (ROI) ........................................................................................ 32
4.4 Sensitivity analysis...................................................................................................... 33
4.5 Procurement and implementation schedule ................................................................ 33
vii
List of Annexure
Annexure -1: Energy audit data used for baseline establishment ......................................... 34
Annexure -2: Process flow diagram after project implementation ......................................... 36
Annexure -3: Detailed technology assessment report .......................................................... 37
Annexure -4 Drawings for proposed electrical & civil works ................................................ 38
Annexure -5: Detailed financial analysis ............................................................................... 39
Annexure:-6 Procurement and implementation schedule .................................................... 43
Annexure -7: Details of technology service providers ........................................................... 44
Annexure -8: Quotations or Techno-commercial bids for new technology/equipment ........... 45
List of Table
Table 1.1a Details of annual energy consumption in the wire drawing units ............................ 12
Table 1.1b Details of annual energy consumption in the galvanizing units .............................. 12
Table 1.2 Average fuel and electricity consumption in typical wire drawing units ..................... 18
Table 1.3 Average fuel and electricity consumption in typical galvanizing units ....................... 18
Table 1.4 Typical average annual production in wire drawing units ......................................... 19
Table 1.5 Typical average annual production in galvanizing units ........................................... 19
Table 1.6: Specific Energy Consumption in Galvanizing and Wire-drawing Units .................... 19
Table 1.7 Typical specifications of present furnaces................................................................ 20
Table 1.8 Electricity charges ................................................................................................. 20
Table 1.9 Demand charge ..................................................................................................... 21
Table 1.10: Present furnace specifications ............................................................................. 21
Table 1.11 Fuel consumption at a typical galvanizing unit using Furnace Oil........................... 22
Table 2.1 Technical specification of a biomass gasifier based furnace .................................... 27
Table 3.1 Energy and monetary benefit ................................................................................... 29
Table 4.2 Financial indicators of proposed technology/equipment ........................................... 32
Table 4.3 Sensitivity analysis at different scenarios ................................................................. 33

viii
List of Figures
Figure 1.1: Product Wise Classification of Galvanizing Units ................................................... 13
Figure 1.2: Product Wise Classification of Wire-drawing Units ................................................ 14
Figure 1.3: Production Wise Classification of Galvanizing Units .............................................. 14
Figure 1.4: Production Wise Classification of Wire-drawing Units ............................................ 15
Figure 1.5 Process flow diagrams for a typical wire drawing unit ............................................. 16
Figure 2.1: Bio Mass gasifier ................................................................................................... 26
List of Abbreviation
BEE Bureau of Energy Efficiency
MoMSME Ministry of Micro Small and Medium Enterprises
DPR Detailed Project Report
GHG Green House Gases
CDM Clean Development Mechanism
DSCR Debt Service Coverage Ratio
NPV Net Present Value
IRR Internal Rate of Return
ROI Return on Investment
WHR Waste Heat Recovery
SIDBI Small Industrial Development Bank of India
MT Million Ton
FO Furnace Oil
NA Not Applicable
SHC Coal Semi Hard Coke Coal

ix
EXECUTIVE SUMMARY
Indian Institute of School Welfare and Business management (IISWBM), Kolkata is executing
BEE-SME program in the Galvanizing and Wire Drawing Cluster of Howrah, supported by
Bureau of Energy Efficiency (BEE) with an overall objective of improving the energy efficiency
in cluster units.
One of the identified sectors was Galvanizing and Wire-drawing clusters in Howrah district of
West Bengal. There are about 100 SMEs in Galvanizing and Wire-drawing sector of Howrah
Cluster comprising about 50% galvanizing units and 50% wire drawing units. The units are
constantly under threat of closure due to poor energy efficiency along with pollution issues
and variability in demand. Improvement in energy efficiency would largely ensure sustainable
growth of the sector, which needs a mechanism to identify technology and techniques for
improving energy efficiency in these highly unorganized and so far uncared for industrial
units.
Some of the galvanizing units in the cluster use semi hard coke (SHC) coal for their process of
galvanization. The furnaces are made in a very crude manner and are very inefficient, not
mention very polluting. These furnaces can be replaced with an arrangement to use producer
gas by gasifying bio-mass which would be much cleaner, not to mention having higher efficiency.
Installation of proposed technology i.e. use of producer gas generated by gasifier in place of
furnace oil fired would save about 1620000 litre furnace oil per year in a typical unit as well as
significant amount of GHG emission.
This DPR highlights the details of the study conducted for assessing the potential for installation
of biogas gasifier in place of furnace oil fired furnace for Galvenising, possible reduction in
energy/production cost and its monetary benefit, availability of the technologies/design, local
service providers, technical features and proposed equipment specifications, various barriers in
implementation, environmental aspects, estimated GHG reductions, capital cost, financial
analysis, sensitivity analysis for different scenarios and schedule of Project Implementation.
This bankable DPR also found eligible for subsidy scheme of MoMSME for “Technology and
Quality Upgradation Support to Micro, Small and Medium Enterprises” under “National
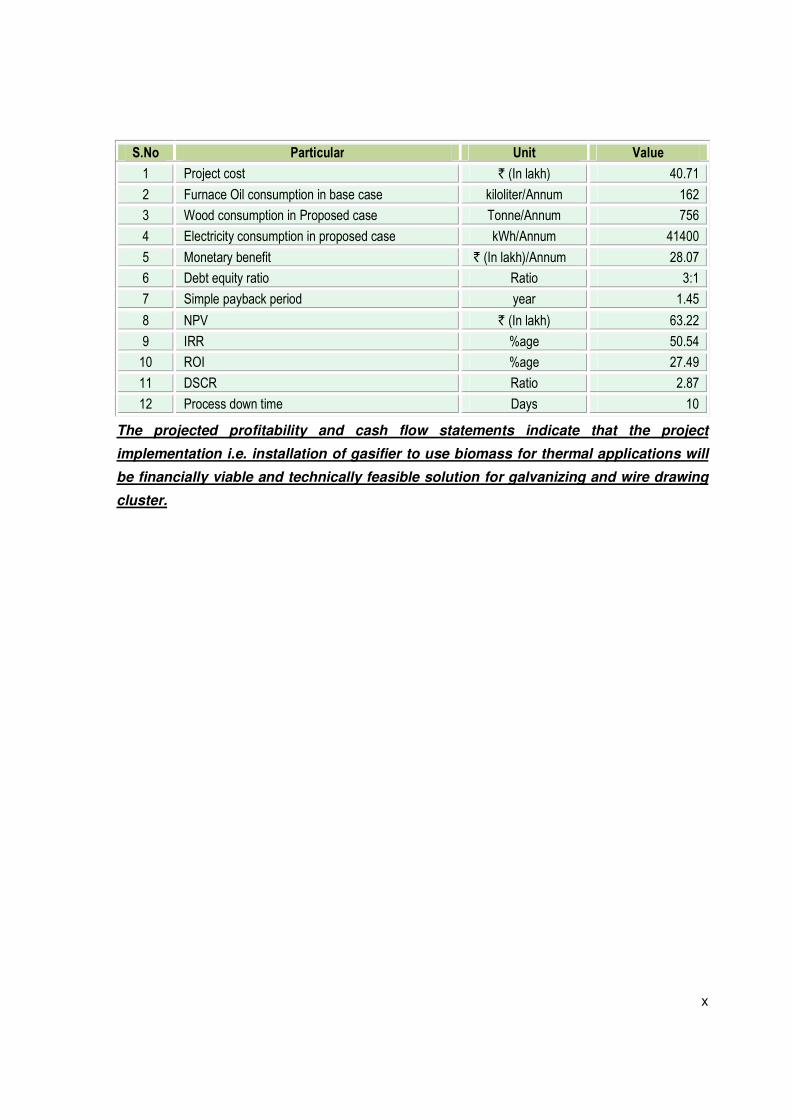
Manufacturing and Competitiveness Programme”. The key indicators of the DPR including the
Project cost, debt equity ratio, monetary benefit and other necessary parameters are given in
table:
x
S.No Particular Unit Value
1 Project cost ` (In lakh) 40.71
2 Furnace Oil consumption in base case kiloliter/Annum 162
3 Wood consumption in Proposed case Tonne/Annum 756
4 Electricity consumption in proposed case kWh/Annum 41400
5 Monetary benefit ` (In lakh)/Annum 28.07
6 Debt equity ratio Ratio 3:1
7 Simple payback period year 1.45
8 NPV ` (In lakh) 63.22
9 IRR %age 50.54
10 ROI %age 27.49
11 DSCR Ratio 2.87
12 Process down time Days 10
The projected profitability and cash flow statements indicate that the project
implementation i.e. installation of gasifier to use biomass for thermal applications will
be financially viable and technically feasible solution for galvanizing and wire drawing
cluster.

xi
ABOUT BEE’S SME PROGRAM
The Bureau of Energy Efficiency (BEE) is implementing a BEE-SME Programme to improve
the energy performance in 25 selected SMEs clusters. Howrah Galvanizing and Wire Drawing
Cluster is one of them. The SME Programme of BEE intends to enhance the awareness
about energy efficiency in each cluster by funding/subsidizing need based studies and giving
energy conservation recommendations. For addressing the specific problems of these SMEs
and enhancing energy efficiency in the clusters, BEE will be focusing on energy efficiency,
energy conservation and technology up-gradation through studies and pilot projects in these
SMEs clusters.
Major activities in the BEE -SME program are furnished below:
Activity 1: Energy use and technology audit
The energy use technology studies would provide information on technology status, best
operating practices, gaps in skills and knowledge on energy conservation opportunities,
energy saving potential and new energy efficient technologies, etc for each of the sub sector
in SMEs.
Activity 2: Capacity building of stake holders in cluster on energy efficiency
In most of the cases SME entrepreneurs are dependent on the locally available technologies,
service providers for various reasons. To address this issue BEE has also undertaken
capacity building of local service providers and entrepreneurs/ Managers of SMEs on energy
efficiency improvement in their units as well as clusters. The local service providers will be
trained in order to be able to provide the local services in setting up of energy efficiency
projects in the clusters
Activity 3: Implementation of energy efficiency measures
To implement the technology up-gradation project in the clusters, BEE has proposed to
prepare the technology based detailed project reports (DPRs) for a minimum of five
technologies in three capacities for each technology.
Activity 4: Facilitation of innovative financing mechanisms for implementation of
energy efficiency projects
The objective of this activity is to facilitate the uptake of energy efficiency measures through
innovative financing mechanisms without creating market distortion

Biomass Gasifier Replacing Furnace Oil
12
1. INTRODUCTION
1.1 Brief Introduction about cluster
The Galvanizing and Wire-drawing cluster in Howrah district of West Bengal is a very large
cluster. There are about 100 SMEs in the Howrah Cluster and comprising of about 50%
galvanizing units and 50% wire drawing units. The units are constantly under threat of closure
due to poor energy efficiency along with pollution issues and variability in demand.
Improvement in energy efficiency would largely ensure sustainable growth of the sector. It
needs a mechanism to identify technology and techniques for improving energy efficiency in
this highly unorganized and so far uncared for industrial units.
The major raw materials for the Galvanizing industry are zinc, ammonium chloride,
hydrochloric acid, and di-chromate powder. On the other hand, the raw materials used in
Wire-drawing units are MS / Copper / Aluminium Wires of gauges varying from 14 to 4 gauge
i.e. 1.6 to 5.1 mm dia., while Uni-Lab powder (of Predington Company based in Bombay) or
Grommet–44 is used for lubrication (eg.).
The main form of energy used by the cluster units are grid electricity, Furnace Oil, SHC coal,
LPG and Diesel oil. Major consumptions of energy are in the form of Furnace Oil and Diesel.
Details of total energy consumption at Howrah cluster are furnished in Table 1.1a and 1.1b:
Table 1.1a Details of annual energy consumption in the wire drawing units
Table 1.1b Details of annual energy consumption in the galvanizing units
Classification of Units
The Galvanizing and Wire Drawing units can be broadly classified on the basis of the
following criteria
S. No Type of Fuel Unit Value % contribution
1 Electricity GWh/year 2.24 76
2 Wood Ton/year 300 5
3 LPG Ton/year 70.5 19
S. No Type of Fuel Unit Value % contribution
1 Electricity MWh/year 867.3 13
2 Diesel kl/year 19.2 2
3 Furnace Oil kl/year 731.7 62.5
4 SHC coal Ton/year 1161 18.5
5 Wood Ton/year 600 4

Biomass Gasifier Replacing Furnace Oil
13
1) Product wise
2) Production capacity wise
Products Manufactured
The galvanizing units can be classified on the basis of products into 5 basis groups. Those
are
a) Units producing transmission tower structures
b) Units producing fastener items
c) Units producing angles and channels
d) Units working on scrap iron
e) Units producing wires
Figure 1.1: Product Wise Classification of Galvanizing Units
Similarly, the wire drawing units are mainly classified into the following categories on the
basis of products manufactured as units which produce
a) MS wire
b) Copper Wire
c) High carbon wire
d) Aluminum wire

Biomass Gasifier Replacing Furnace Oil
14
Figure 1.2: Product Wise Classification of Wire-drawing Units
Capacity wise production
In both Wiredrawing and Galvanizing units in Howrah, the production capacity has been found
to vary more than 10 folds. In the units where detailed audit has been performed, there are
Wire-drawing units producing as low as 241 Ton/year to as high as 3500 Ton/year. Similarly,
the production from Galvanizing units where audit was performed has been found to be within
the range of 890 to 7500 Ton per annum. Both the Galvanizing and the Wire Drawing units
have been classified on the basis of production into three categories, namely 1-500 TPA
(calling micro scale), 500-1000 TPA (Small scale) and above 1000 TPA (medium scale)
capacities.
The distribution of units of Galvanizing and Wire Drawing industries have been depicted in
figures 1.3 and 1.4 below:
Figure 1.3: Production Wise Classification of Galvanizing Units

Biomass Gasifier Replacing Furnace Oil
15
Figure 1.4: Production Wise Classification of Wire-drawing Units
Energy usages pattern
Average monthly electricity consumption in Wire Drawing unit ranges from 1 lakh to 2 lakh
kWh depending on the size of the unit. In thermal energy, solid fuel such as wood and
gaseous fuel like LPG are used in annealing furnaces in some of the units. The wood
consumption in a typical unit is about 25 Ton/month.
Average monthly electricity consumption in a galvanizing unit ranges from 0.3 lakh to 3 lakh
kWh depending on the size of the unit and type of operations performed. In thermal energy,
furnace oil is primarily used in the galvanizing furnaces since it is reasonably cheap. The use
of FO ranges from 0.5 to 4.5 lakh liters/yr. The use of diesel oil ranges from 1.3 to 19.2 kl/year
and is used in either drying the job or pre-heating flux solution. SHC coal is also used for the
purpose of drying the job and ranges from 1.5 to 8 lakh kg/year. Wood is used in some larger
units which have facilities for running processes other than galvanizing. It can typically use 6
lakh kg/yr of wood.
General production process for the wire drawing units
The wire about to be drawn is first put into an annealing furnace. The annealed wire is then
put into drums for coiling wires. Thereafter, the wire is put through dies of various sizes
interspersed by sets of coiler drums.
These drums are driven by electric motors that are of induction type. The chemical used for
lubricating the wire through the die is mainly wire-drawing powder (as it is commonly termed
in the wire-drawing industry). The finished products of MS Wires are stacked on a steeper
from where finished goods are dispatched to the end customers. The finished wire products
are mainly supplied to downstream industries such as galvanizes, electrical manufactures and
the local market.
General production process flow diagram for drawing wires is shown in Figure 1.5 below:

Biomass Gasifier Replacing Furnace Oil
16
Figure 1.5 Process flow diagrams for a typical wire drawing unit
ANNEALING
FURNACE
ANNEALED WIRE
WIRE
UNIT 1 UNIT 2
INPUT
MS WIRE
FINISHED
PRODUCT
INPUT
MS WIRE
FINISHED
PRODUCT
INPUT
MS WIRE
FINISHED
PRODUCT
UNIT 3
Biomass Gasifier Replacing Furnace Oil
17
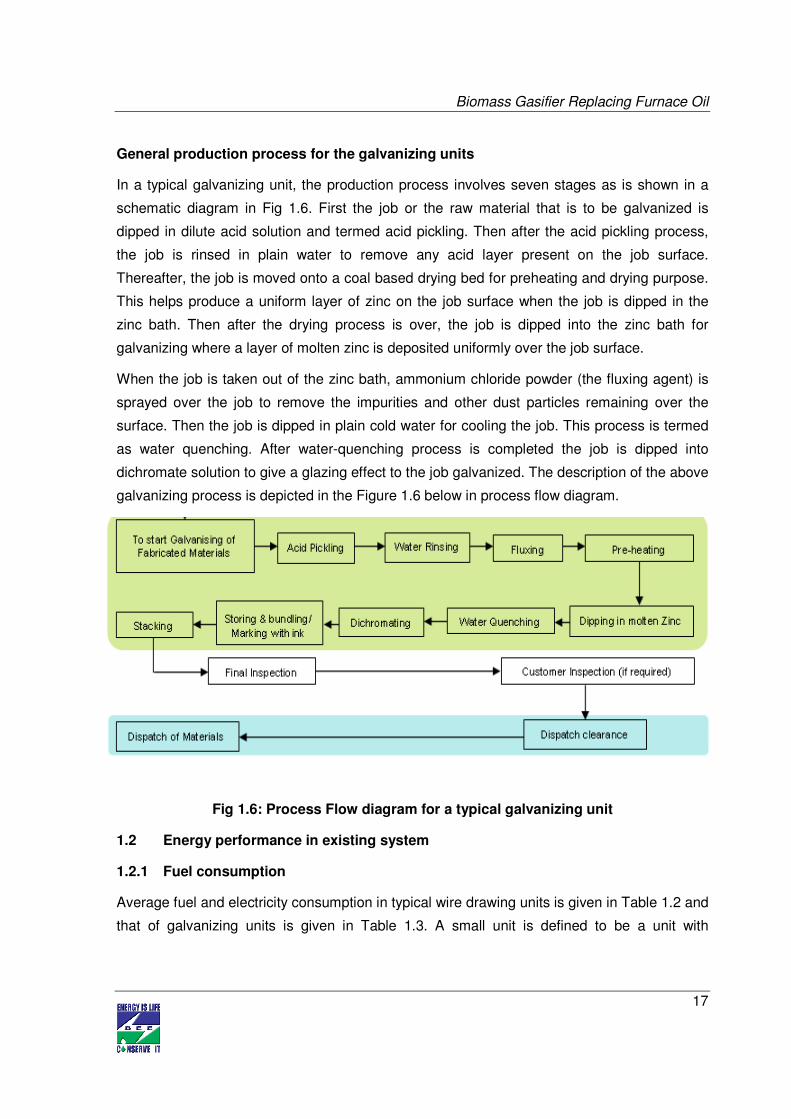
General production process for the galvanizing units
In a typical galvanizing unit, the production process involves seven stages as is shown in a
schematic diagram in Fig 1.6. First the job or the raw material that is to be galvanized is
dipped in dilute acid solution and termed acid pickling. Then after the acid pickling process,
the job is rinsed in plain water to remove any acid layer present on the job surface.
Thereafter, the job is moved onto a coal based drying bed for preheating and drying purpose.
This helps produce a uniform layer of zinc on the job surface when the job is dipped in the
zinc bath. Then after the drying process is over, the job is dipped into the zinc bath for
galvanizing where a layer of molten zinc is deposited uniformly over the job surface.
When the job is taken out of the zinc bath, ammonium chloride powder (the fluxing agent) is
sprayed over the job to remove the impurities and other dust particles remaining over the
surface. Then the job is dipped in plain cold water for cooling the job. This process is termed
as water quenching. After water-quenching process is completed the job is dipped into
dichromate solution to give a glazing effect to the job galvanized. The description of the above
galvanizing process is depicted in the Figure 1.6 below in process flow diagram.
Fig 1.6: Process Flow diagram for a typical galvanizing unit
1.2 Energy performance in existing system
1.2.1 Fuel consumption
Average fuel and electricity consumption in typical wire drawing units is given in Table 1.2 and
that of galvanizing units is given in Table 1.3. A small unit is defined to be a unit with

Biomass Gasifier Replacing Furnace Oil
18
production between 500 and 1000 TPA and medium to be greater than 1000 TPA. The micro
units are defined to have capacity less than 500 TPA.
Only the larger wire drawing industries have furnaces and also perform annealing. Among the
wire drawing units audited, only one which was also larger used wood for annealing. Further,
most of the wire drawing units produces MS wires.
Table 1.2 Average fuel and electricity consumption in typical wire drawing units
Table 1.3 Average fuel and electricity consumption in typical galvanizing units
Energy Small Medium
Scale of Unit Electricity Furnace Oil Diesel Oil
Electricity Furnace Oil Diesel Oil
SHC coal
Wood
(kWh/ yr) (l/yr) (l/yr) (kWh/ yr) (l/yr) (l/yr) (kg/yr) (kg/yr)
Transmission Tower Structure
NA NA NA 59346 85195 NA NA NA
Fasteners Item 107670 132000 19200 109883 112500 NA 21000 NA
Angle & Channel NA NA NA 35491 165000 NA 150000 NA
Wire NA NA NA 302013 165000 7040 NA 600000
1.2.2 Average annual production
Annual production in terms of TPA is taken in case of wire drawing units. The micro units are
defined to have production less than 500 TPA, small to be between 500 and 1000 TPA and
medium to have production higher than 1000 TPA.
Scale of Unit Micro Small Medium
Energy Electricity (kWh/ yr)
Electricity (kWh/ yr)
Electricity (kWh/ yr)
LPG (Ton/yr)
Wood (Ton/yr)
MS wire 101486 209216 266889 NA 300
Copper wire NA NA 295310 70.5 NA
High carbon wire NA NA 1088751 NAp NA
Aluminium wire NA NA 266889 NAp NA
Biomass Gasifier Replacing Furnace Oil
19
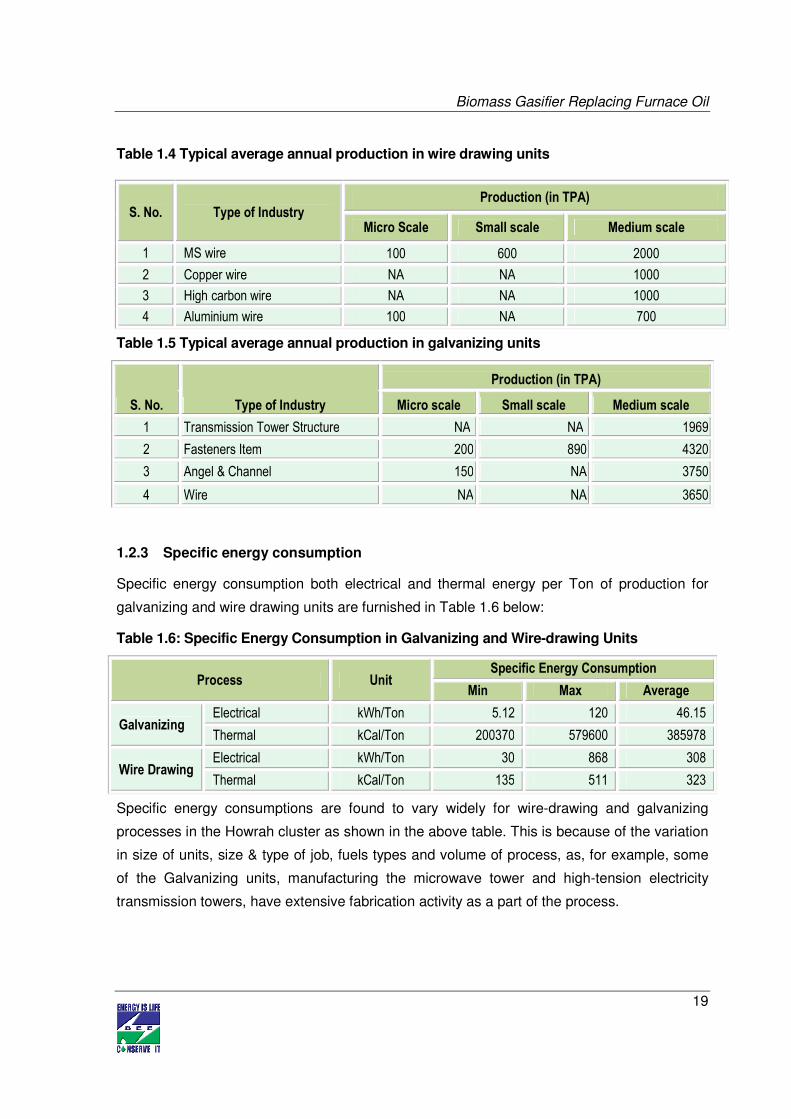
Table 1.4 Typical average annual production in wire drawing units
Table 1.5 Typical average annual production in galvanizing units
S. No. Type of Industry
Production (in TPA)
Micro scale Small scale Medium scale
1 Transmission Tower Structure NA NA 1969
2 Fasteners Item 200 890 4320
3 Angel & Channel 150 NA 3750
4 Wire NA NA 3650
1.2.3 Specific energy consumption
Specific energy consumption both electrical and thermal energy per Ton of production for
galvanizing and wire drawing units are furnished in Table 1.6 below:
Table 1.6: Specific Energy Consumption in Galvanizing and Wire-drawing Units
Process Unit Specific Energy Consumption
Min Max Average
Galvanizing Electrical kWh/Ton 5.12 120 46.15
Thermal kCal/Ton 200370 579600 385978
Wire Drawing Electrical kWh/Ton 30 868 308
Thermal kCal/Ton 135 511 323
Specific energy consumptions are found to vary widely for wire-drawing and galvanizing
processes in the Howrah cluster as shown in the above table. This is because of the variation
in size of units, size & type of job, fuels types and volume of process, as, for example, some
of the Galvanizing units, manufacturing the microwave tower and high-tension electricity
transmission towers, have extensive fabrication activity as a part of the process.
S. No. Type of Industry Production (in TPA)
Micro Scale Small scale Medium scale
1 MS wire 100 600 2000
2 Copper wire NA NA 1000
3 High carbon wire NA NA 1000
4 Aluminium wire 100 NA 700

Biomass Gasifier Replacing Furnace Oil
20
1.3 Existing technology/equipment
1.3.1 Description of existing technology
All the galvanizing units in the Howrah cluster have furnaces to melt zinc. If the furnaces use
biomass to fuel their production process instead of furnace oil, it can yield significant savings
to the unit.
Existing furnace specifications are shown in Table 1.7 below.
Table 1.7 Typical specifications of present furnaces
S. No. Parameter Detail
1 Manufacturer Local
2 Dimensions 6.8 m x 0.9 m x 0.9 m
3 Average FO consumption 90 l/hr
4 Temperature of zinc vat 490 deg C
5 Ambient temperature max 40 deg C
At Howrah, electricity connection is taken from the Calcutta Electric Supply Company Limited
at the following tariff rates
Energy charges
The cost of furnace oil in a typical unit is Rs. 32/litre.
Table 1.8 Electricity charges
S. No. Contract Demand, kWh Energy Charges, Rs./kWh
1 Upto 500 4.43
2 Next 1500 4.87
3 Next 1500 5.20
4 Above 3500 5.49

Biomass Gasifier Replacing Furnace Oil
21
Demand Charges
Table 1.9 Demand charge
Therefore, total electricity charges (including the maximum demand charges & other taxes) is
Rs. 5.6 per kWh.
1.3.2 Role in process
Furnaces heat up the vats in which zinc is melted. The job to be galvanized is dipped in the
molten zinc during the hot dip process. The typical temperature of the zinc vat is 500 deg C.
1.4 Baseline establishment for existing technology
1.4.1 Design and operating parameters
The typical galvanizing furnaces used at present in the units provide temperatures of 490 deg
C. These consume furnace oil at the rate of 90 litre per hour.
Table 1.10: Present furnace specifications
S. No. Parameter Detail
1 Manufacturer Local
2 Dimensions 6.8 m x 0.9 m x 0.9 m
3 Average FO consumption 90 l/hr
4 Temperature of zinc vat 490 deg C
5 Ambient temperature max 40 deg C
Furnace oil consumption in the galvanizing furnaces depend on the following parameters
a) Condition of the walls and insulation
b) Size of the job to be galvanized
c) Amount of excess air provided for combustion.
d) Amount of zinc to be heated
S. No. Billing Demand, KVA Demand Charges, Rs.KVA
1 For first 500 98
2 For next 500 139
3 For next 1500 208
4 Billing demand in Excess of 2500 237
5 Billing Demand Excess of contract demand 369

Biomass Gasifier Replacing Furnace Oil
22
Fuel requirement in the galvanizing plant depends on the production. Detail of fuel
consumption in a typical unit is given in Table 1.11 below:
Table 1.11 Fuel consumption at a typical galvanizing unit using Furnace Oil
1.4.2 Operating efficiency analysis
Operating efficiency for the furnace is found to be in the range of 17.16 %. The calculations
are shown in Annexure 1.
1.5 Barriers in adoption of proposed equipment
1.5.1 Technological barrier
In Howrah cluster, the technical understanding of the wire drawing process has been
excellent with several committed technical personnel having detailed know-how of the
processes involved. Some of them are visiting countries like China and European ones to find
the best possible technological solutions to the challenges in their units. Indeed there is
committed effort on the part of the management in such units to grasp alterations which may
give them benefits however with the caveat that the advantages be proven without any doubt.
Nobody wants to invest in an experimental scheme only to find later that the gains are too
little to warrant such investments. Hence finding the first person who is willing to implement a
change is still a challenge. While carrying out the audits and presenting the Energy audit
reports to the units, in the discussion with the plant owners & other personnel, many of them
agreed with many of the identified energy saving measures and technologies but they
demanded demonstration of the energy saving technologies in any plant and thereafter they
have readiness to follow.
1.5.2 Financial barrier
Discussions of financial issues with the units concluded that they are not scared of
investments. The larger units are confident of financing their own alterations while the smaller
units are certain to find good schemes from the banks to fund their respective efficiency
measures. However, the good part of the discussions was that more and more units are
taking energy conservation measures seriously and willing to go the distance. A mention
S. No. Energy Type Unit Value
1 Electricity kWh/yr 38410
2 Furnace Oil litre/yr 162000

Biomass Gasifier Replacing Furnace Oil
23
must be made of SIDBI whose schemes have attracted attention and can play a catalytic role
in the implementation of the measures.
1.5.3 Skilled manpower
Technical personnel in employed in the units are generally skilled workers but not engineers.
Thus the production process remains traditional. This is one of the main hindrances in
adopting newer technology. Specialized training among the workforce and local experts can
circumvent the problem significantly. Effective dissemination can enhance replication potential
in the various units. The gains obtained by one plant can inspire other units to follow suit.

Biomass Gasifier Replacing Furnace Oil
24
2. PROPOSED EQUIPMENT FOR ENERGY EFFICENCY IMPROVEMENT
2.1 Description of proposed equipment
2.1.1 Details of proposed equipment
Some of the galvanizing units use coal as fuel. These units could instead use wood or rice
straw in a biomass gasifier to generate producer gas which could then be brought to the
furnace and burnt. Such a process would also be very clean since it would not produce SOx
or NOx.
Process technology
The Gasification process technology is based on production of a highly combustible gas by
controlled reactions of Biomass viz. rice husk, wood, palm nut shell etc. with air and water
vapors.
In the Gasifier, the solid biomass fuel having moisture content not exceeding 20% and 25mm
size is fed from the top, while the air and steam is fed from the bottom, and moves upward
against the downward movement of the biomass fuel, and this process of gas generation is
called Updraft principle.
A number of chain chemical reactions are believed to take place in the gas generator from the
bottom to the top, a proper mixture of air water vapors pass through channel free compact
fuel bed ensuring the following reactions to take place.
Oxidation Zone
C + O2 = CO2 + Heat
Primary Reduction Zone
C + CO2 = 2CO ~ Heat
C + H2O = CO + H2 ~ Heat
C + 2H2O = CO2 + 2H2 ~ Heat
Secondary Reduction Zone
C + CO2 = 2CO ~ Heat
CO + H2O = CO2 + H2 ~ Heat
While the plant is under normal operation, following zones are believed to exist in the gasifier,
as shown in the cross sectional view below:

Biomass Gasifier Replacing Furnace Oil
25
Ash Zone: An exchange of heat takes place from hot ash to the entering air and water
vapour and thus the hot process air enters the oxidation zone and the cooled ash leaves the
system at the bottom to the water seal, generally maintained at about 600 m.m.w.g.
BIOMASS IN
OUT
Oxidation Zone: It is a thin zone having the highest temperature (9500C – 11000C) in the
Gasifier due to the exothermic reaction.
Primary Reduction Zone: The heat released by the oxidation zone below is cooled down
by the endothermic reactions in this zone with the formation of CO, H2 and CO2 by the
interaction of C present in the fuel with O2 and H2O present in the process air.
Secondary Reduction Zone: It reduces further the temperature of the gas coming out of the
zone below it due to the endothermic reactions with the production of CO by the interaction of
C with CO2 and simultaneous water gas reaction.
Distillation Zone: The heat of the up moving gas from the secondary reduction zone helps
the distillation of the volatile matters present in the fuel with the evolution of high volatile
GAS SPACE
DISTILLATION ZONE
SECONDARY ZONE
PRIMARY REDUCTION ZONE
OXIDATION ZONE
ASH ZONE
HOT GAS
AIR + STEAM
ASH OUT

Biomass Gasifier Replacing Furnace Oil
26
hydrocarbons which combine with the gas to enrich it in its calorific value and the temperature
of the gas goes down further.
Composition of Gas : Though for different biomass fuels, there may be little variation in gas
composition as well as the heating value, the gas composition and calorific value in general
are as follows :-
CO2 = 8 ~ 10%, O2 = Less than 1.0%, CO = 24 ~ 26%,
CH4 = 1.5 ~ 2%, N2 = 54 ~ 56%, H2 = 10 ~ 12%.
CV. (Gross) = 1200 ~ 1250 kCal/Normal cubic meter
Sp. Gravity = 0.92
Yield of Gas: 1.70 ~ 1.90 Normal cubic meter per kg of biomass.
Cleaning and cooling of gas: The producer gas thus generated is cooled and partly cleaned
by collection through displacement of water. The gas is further cleaned by passing it through
two stages of filters, viz. fine filter and check filter, which as normally made of Shaw-dust.
After cooling and cleaning, the gas is having more CV per Nm3 and suitable for use in engines
as well as burners.
Figure 2.1: Bio Mass gasifier
2.1.2 Equipment/technology specification
Biomass gasifiers generate the producer gas which could be sent through pipelines into the
furnace and burnt there.
Biomass Gasifier Replacing Furnace Oil
27
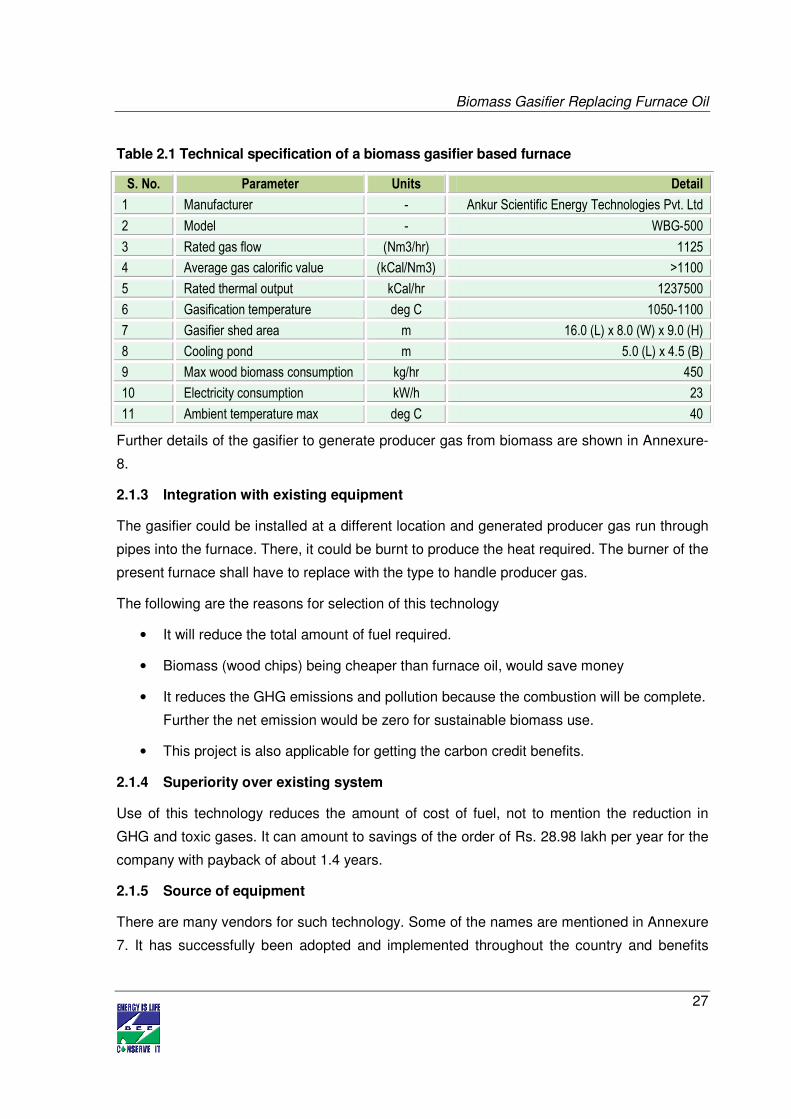
Table 2.1 Technical specification of a biomass gasifier based furnace
S. No. Parameter Units Detail
1 Manufacturer - Ankur Scientific Energy Technologies Pvt. Ltd
2 Model - WBG-500
3 Rated gas flow (Nm3/hr) 1125
4 Average gas calorific value (kCal/Nm3) >1100
5 Rated thermal output kCal/hr 1237500
6 Gasification temperature deg C 1050-1100
7 Gasifier shed area m 16.0 (L) x 8.0 (W) x 9.0 (H)
8 Cooling pond m 5.0 (L) x 4.5 (B)
9 Max wood biomass consumption kg/hr 450
10 Electricity consumption kW/h 23
11 Ambient temperature max deg C 40
Further details of the gasifier to generate producer gas from biomass are shown in Annexure-
8.
2.1.3 Integration with existing equipment
The gasifier could be installed at a different location and generated producer gas run through
pipes into the furnace. There, it could be burnt to produce the heat required. The burner of the
present furnace shall have to replace with the type to handle producer gas.
The following are the reasons for selection of this technology
• It will reduce the total amount of fuel required.
• Biomass (wood chips) being cheaper than furnace oil, would save money
• It reduces the GHG emissions and pollution because the combustion will be complete.
Further the net emission would be zero for sustainable biomass use.
• This project is also applicable for getting the carbon credit benefits.
2.1.4 Superiority over existing system
Use of this technology reduces the amount of cost of fuel, not to mention the reduction in
GHG and toxic gases. It can amount to savings of the order of Rs. 28.98 lakh per year for the
company with payback of about 1.4 years.
2.1.5 Source of equipment
There are many vendors for such technology. Some of the names are mentioned in Annexure
7. It has successfully been adopted and implemented throughout the country and benefits

Biomass Gasifier Replacing Furnace Oil
28
reaped been established beyond doubt. There are no concerns of scarcity of such devices
and the prices are reasonable as well.
2.1.6 Availability of technology/equipment
Suppliers of this technology are available at local level as well as at national level very easily.
Such units supplied are found running in a number of applications for more than four decades
in India.
2.1.7 Service providers
Details of technology service providers are shown in Annexure 7.
2.1.8 Terms and conditions in sales of equipment
The company seeks 50 % of the amount to be paid as a nonrefundable advance along with
the purchase order. Another 30% shall have to be paid within 1 month of sending the
purchase order. The remaining 20% shall have to be paid against Performa invoice but before
the delivery, as given in Annexure-8.
2.1.9 Process down time
The down time might be 10 days for installing the biomass Gasifier and taking the producer
gas generated through a pipeline into the furnace. The burner on the furnace shall have to be
replaced with one that handles producer gas.
2.2 Life cycle assessment and risks analysis
Life of the equipment is about 10 years. Risk involved in the implementation of proposed
project is the improper operation of the device due to lack of maintenance and formation of
leaks on the producer gas bearing pipeline. This needs to be taken care of.
2.3 Suitable unit for Implementation of proposed technology
Suitable unit for implementation of this technology is a galvanizing unit having the production
capacity of about 3750 Ton/yr and having total FO consumption of about 163800 liter/yr.

Biomass Gasifier Replacing Furnace Oil
29
3. ECONOMIC BENEFITS FROM PROPOSED TECHNOLOGY
3.1 Technical benefit
3.1.1 Fuel saving
Switching from furnace oil to biomass generates fuel Replacement of 1,62,000 liters per year
of furnace oil with 756 tonnes of wood consumption in gasifier annually.
3.1.2 Electricity saving
The new Biomass Gasifier would increase an additional 23 kW electrical load and a total of
41400 kWh of electricity per year. Annual operational pattern is estimated to 6 hours per day
with 300 days per annum.
3.1.3 Improvement in product quality
The quality of the product would be improved on account of better temperature regulation with
the use of producer gas as fuel in place of FO.
3.1.4 Increase in production
The production will increase upon better temperature regulation with the use of producer gas
as fuel.
3.1.5 Reduction in raw material
The wastage of zinc during the process would be lower upon better temperature regulation.
3.1.6 Reduction in other losses
The combustion of producer gas is a more efficient process than burning furnace oil. It
reduces the amount of wastage in fuel while performing the process.
3.2 Monetary benefits
The monetary benefits of the unit are mainly due to the lower price of wood chips compared
to furnace oil. This amounts to monetary savings of Rs. 28,07,160 /yr. A detailed estimate of
the saving has been provided in the table 3.1 below:
Table 3.1 Energy and monetary benefit
S.No Parameter Unit Value
1. Electricity consumption in the gasifier unit kW 23
2. Electric energy consumption (6 hrs per day and 300 days of operation) kWh 41400
3. Rate of Electricity Rs/kWh 5.6
4. Cost of electricity `/yr 231840

Biomass Gasifier Replacing Furnace Oil
30
S.No Parameter Unit Value
5. Amount of FO used in furnace l/hr 90
6. Amount of FO used in furnace l/yr 162000
7. Calorific value of FO kcal/kg 10500
8. Calorific value of wood kcal/kg 2250
9. Amount of heat generated by FO kcal/hr 945000
10. Cost of FO `/l 32
11. Cost of FO in present system `/yr 5184000
12. Operation cost – manpower `/month 21250
`/yr 255000
13. Amount of wood required by gasifier kg/hr 420
14. Amount of wood required by gasifier kg/yr 756000
15. Cost of wood `/kg 2.5
16. Cost of wood for the gasifer `/yr 1890000
17. Monetary saving `/yr 2807160
18. Electricity consumption in the gasifier unit kWh 23
Further details of total monetary benefit are given in Annexure 3.
3.3 Social benefits
3.3.1 Improvement in working environment
Reduction in FO consumption would probably make a cleaner working environment.
3.3.2 Improvement in workers skill
The workers have to be trained according to the needs of the system.
3.4 Environmental benefits
3.4.1 Reduction in effluent generation
There would be less effluent generation since there would less fuel burned in the furnace.
Producer gas burns more cleanly than furnace oil and produces less ash. The ash produced
from wood could be used for fertilizers. Moreover, the generation of dross is reduced due to
better temperature regulation.
3.4.2 Reduction in GHG emission
The measure helps in reducing CO2 emission. The sustainable use of biomass as fuel would
have zero net emission of CO2 into the environment.
3.4.3 Reduction in other emissions like SOX

Biomass Gasifier Replacing Furnace Oil
31
Significant amount of SOX will be reduced due to application of the bio-gasification process.
The corresponding SOX emission would also be reduced.
4. INSTALLATION OF PROPOSED EQUIPMENT
4.1 Cost of project
4.1.1 Equipment cost
The cost of equipment is ` 31.14 lakh. This figure includes the cost of Gasifier, the cooling
tower and the producer gas burner with spark ignition as given in table 4.1 below:
4.1.2 Erection, commissioning and other misc. cost
The installation costs could amount to a further ` 1.75 lakh. This figure includes the cost of
building a new producer gas fired furnace, installation and commissioning and the relevant
taxes as given in table 4.1 below:
Table 4.1 Details of proposed technology project cost
Particular Unit Value
‘Ankur’ Biomass Gasifier WBG-500 in Clean Gas Mode along with necessary accessories and auxiliaries
` 2995000
Gasifier Cooling Tower ` 38500
‘Ankur’ fully manual controlled producer gas burner with spark ignition ` 80000
installation and commissioning ` 175000
CST @ 2 % of Material Cost against advance C-FORM, and in absence of C-FORM, 5% Tax will be charged
` 164425
10.30% Service Tax on I & C ` 18025
Cost of rebuilding furnace ` 600000
Total investment ` (in lakh) 40.71
4.2 Arrangements of funds
4.2.1 Entrepreneur’s contribution
The total cost of installing the device to boil flux solution is ` 40.71 lakh. The entrepreneur
shall have to pay 25% of the total amount upfront ` 10.18 lakh. The rest could be arranged as
loans.
4.2.2 Loan amount.
There are loans available for buying such equipments from SIDBI and from the MSME of the
Government of India which have 25% subsidy in some schemes. Total loan amount is Rs.
30.53 lakh.

Biomass Gasifier Replacing Furnace Oil
32
4.2.4 Terms & conditions of loan
The interest rate is considered at 10% which is SIDBI’s rate of interest for energy efficient
projects. The loan tenure is 5 years excluding initial moratorium period is 6 months from the
date of first disbursement of loan.
4.3 Financial indicators
4.3.1 Cash flow analysis
Profitability and cash flow statements have been worked out for a period of 8 years. The
financials have been worked out on the basis of certain reasonable assumptions, which are
outlined below.
The project is expected to achieve monetary savings of ` 28.07 lakh/yr.
• The Operation and Maintenance cost is estimated at 4% of cost of total project with
5% increase in every year as escalations.
• Interest on term loan is estimated at 10%.
• Depreciation is provided as per the rates provided in the companies act.
4.3.2 Simple payback period
The total cost of implementing the proposed technology is ` 40.17 lakh and monetary savings
is ` 28.07 lakh. Hence the simple payback period works out to be 1.45 years.
4.3.3 Net Present Value (NPV)
The Net present value of the investment works out to be ` 63.22 lakh.
4.3.4 Internal rate of return (IRR)
The Internal rate of return of the project would be 50.54 %.
4.3.5 Return on investment (ROI)
The average return on investment of the project activity works out at 27.49%.
Details of financial indicator are shown in Table 4.2 below:
Table 4.2 Financial indicators of proposed technology/equipment
S.No Particulars Unit Value
1 Simple payback period Years 1.45
2 IRR %age 50.54
3 NPV ` in lakh 63.22
4 ROI %age 27.49

Biomass Gasifier Replacing Furnace Oil
33
S.No Particulars Unit Value
5 DSCR Ratio 2.87
4.4 Sensitivity analysis
A sensitivity analysis has been carried out to ascertain how the project financials would
behave in different situations like when there is an increase in fuel savings or decrease in fuel
savings. For the purpose of sensitive analysis, two following scenarios has been considered
• Optimistic scenario (Increase in fuel savings cost by 5%)
• Pessimistic scenario (Decrease in fuel savings cost by 5%)
In each scenario, other inputs are assumed as a constant. The financial indicators in each of
the above situation are indicated along with standard indicators.
Details of sensitivity analysis at different scenarios are shown in Table 4.3 below:
Table 4.3 Sensitivity analysis at different scenarios
Particulars IRR NPV ROI DSCR
Units (%age) (Rs. in lakh) (%age) ratio
Normal 50.54 63.22 27.49 2.87
5% increase in fuel savings cost 54.31 69.53 27.66 3.04
5% decrease in fuel savings cost 46.77 56.91 27.30 2.69
4.5 Procurement and implementation schedule
Procurement and implementation schedule required for proposed project are about 12 weeks
and detail of procurement and implementation schedules are given in Annexure 6.

Biomass Gasifier Replacing Furnace Oil
34
Annexure
Annexure -1: Energy audit data used for baseline establishment
Calculation of efficiency of the furnace by the direct method
Description Unit Excluding pre heat value Including pre heat value
Production Ton/Year 3750 3750
FO Consumption litre/Yr 165000 165000
SG of FO 0.93 0.93
GCV of FO kJ/kg 44100 44100
Heat of FO kJ/Yr 6767145000 6767145000
Coal consumption Ton/yr 150 150
GCV of coal kCal/kg 4000 4000
Heat from coal (kcal) kCal/yr 600000000 600000000
Heat from coal (kJ) kJ/yr 2520000000 2520000000
Weight of Zinc Ton/yr 262.5 262.5
Weight of Iron Ton/yr 3487.5 3487.5
Zinc VAT temperature deg C 695 695
Heat taken by zinc kJ 91494375 94565625
Heat taken by iron kJ 1018698750 1066826250
Heat taken by Metals (output) kJ 1110193125 1161391875
Total Heat of Fuel (Input) kJ/Yr 6767145000 9287145000
Efficiency %age 16.41 12.51
Biomass Gasifier Replacing Furnace Oil
35
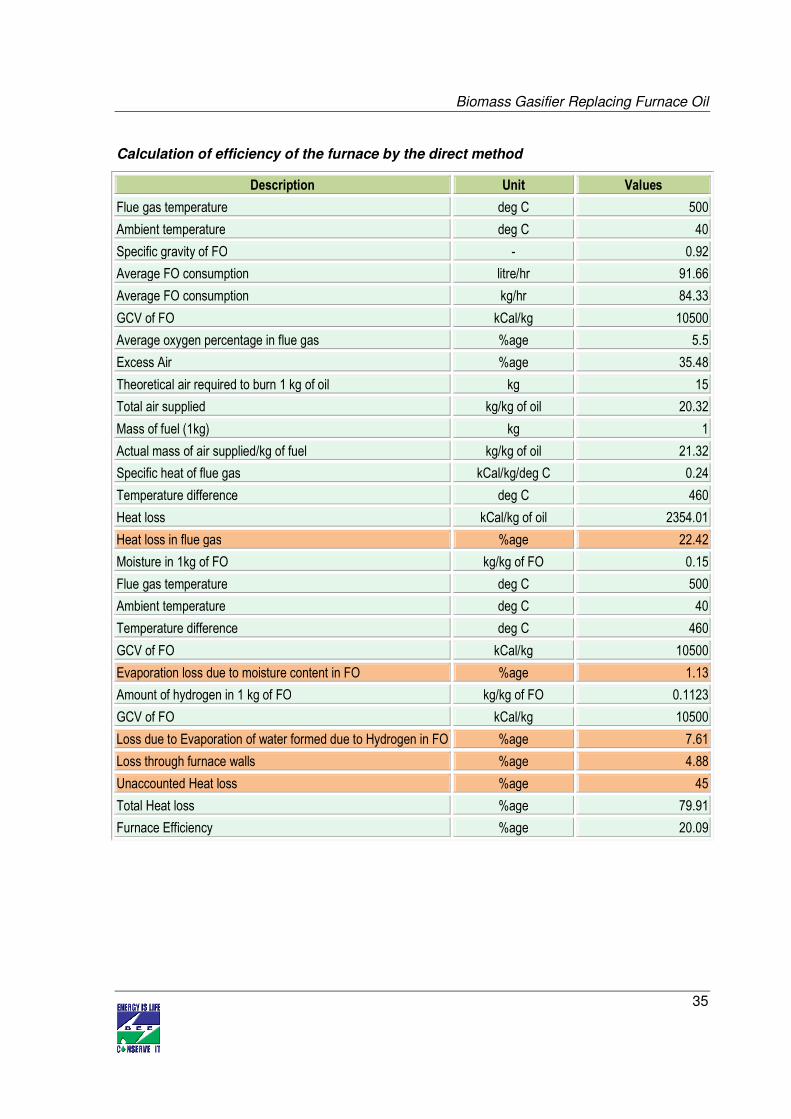
Calculation of efficiency of the furnace by the direct method
Description Unit Values
Flue gas temperature deg C 500
Ambient temperature deg C 40
Specific gravity of FO - 0.92
Average FO consumption litre/hr 91.66
Average FO consumption kg/hr 84.33
GCV of FO kCal/kg 10500
Average oxygen percentage in flue gas %age 5.5
Excess Air %age 35.48
Theoretical air required to burn 1 kg of oil kg 15
Total air supplied kg/kg of oil 20.32
Mass of fuel (1kg) kg 1
Actual mass of air supplied/kg of fuel kg/kg of oil 21.32
Specific heat of flue gas kCal/kg/deg C 0.24
Temperature difference deg C 460
Heat loss kCal/kg of oil 2354.01
Heat loss in flue gas %age 22.42
Moisture in 1kg of FO kg/kg of FO 0.15
Flue gas temperature deg C 500
Ambient temperature deg C 40
Temperature difference deg C 460
GCV of FO kCal/kg 10500
Evaporation loss due to moisture content in FO %age 1.13
Amount of hydrogen in 1 kg of FO kg/kg of FO 0.1123
GCV of FO kCal/kg 10500
Loss due to Evaporation of water formed due to Hydrogen in FO %age 7.61
Loss through furnace walls %age 4.88
Unaccounted Heat loss %age 45
Total Heat loss %age 79.91
Furnace Efficiency %age 20.09

Biomass Gasifier Replacing Furnace Oil
36
Annexure -2: Process flow diagram after project implementation
Biomass Gasifier Replacing Furnace Oil
37
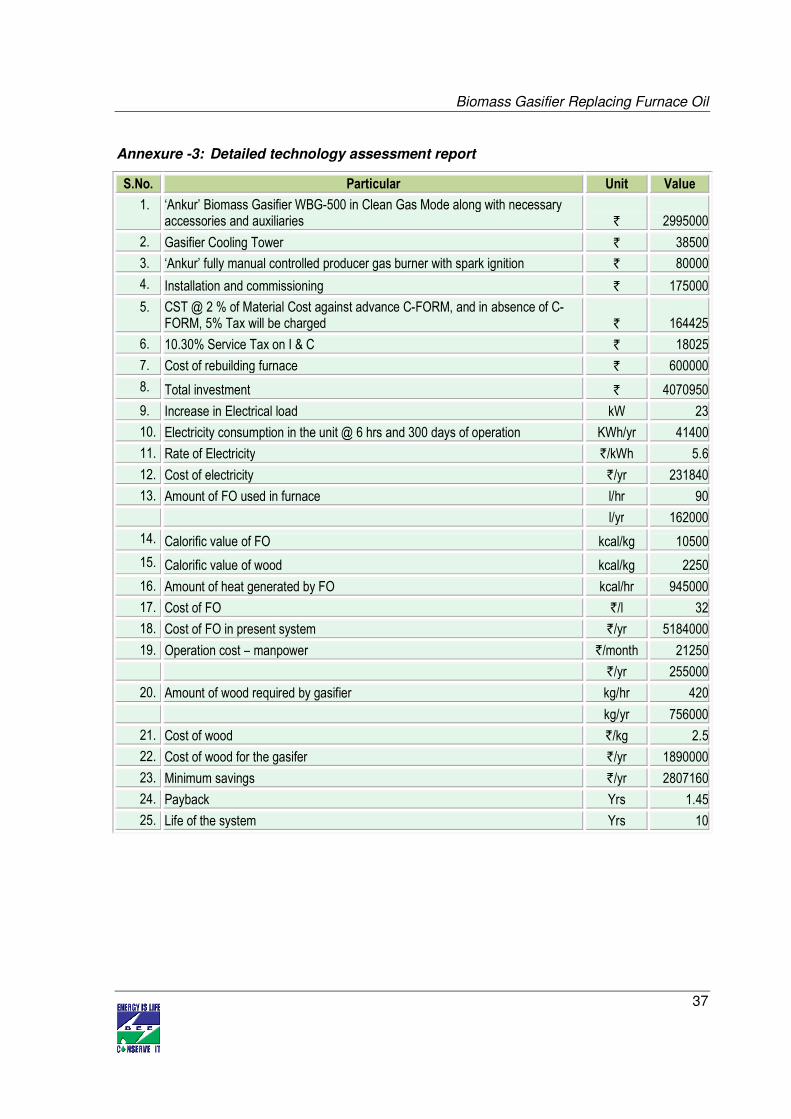
Annexure -3: Detailed technology assessment report
S.No. Particular Unit Value
1. ‘Ankur’ Biomass Gasifier WBG-500 in Clean Gas Mode along with necessary accessories and auxiliaries ` 2995000
2. Gasifier Cooling Tower ` 38500
3. ‘Ankur’ fully manual controlled producer gas burner with spark ignition ` 80000
4. Installation and commissioning ` 175000
5. CST @ 2 % of Material Cost against advance C-FORM, and in absence of C-FORM, 5% Tax will be charged ` 164425
6. 10.30% Service Tax on I & C ` 18025
7. Cost of rebuilding furnace ` 600000
8. Total investment ` 4070950
9. Increase in Electrical load kW 23
10. Electricity consumption in the unit @ 6 hrs and 300 days of operation KWh/yr 41400
11. Rate of Electricity `/kWh 5.6
12. Cost of electricity `/yr 231840
13. Amount of FO used in furnace l/hr 90
l/yr 162000
14. Calorific value of FO kcal/kg 10500
15. Calorific value of wood kcal/kg 2250
16. Amount of heat generated by FO kcal/hr 945000
17. Cost of FO `/l 32
18. Cost of FO in present system `/yr 5184000
19. Operation cost – manpower `/month 21250
`/yr 255000
20. Amount of wood required by gasifier kg/hr 420
kg/yr 756000
21. Cost of wood `/kg 2.5
22. Cost of wood for the gasifer `/yr 1890000
23. Minimum savings `/yr 2807160
24. Payback Yrs 1.45
25. Life of the system Yrs 10

Biomass Gasifier Replacing Furnace Oil
38
Annexure -4 Drawings for proposed electrical & civil works

Biomass Gasifier Replacing Furnace Oil
39
Annexure -5: Detailed financial analysis
Assumption
Name of the Technology Biomass Gasifier Replacing FO
Details Unit Value Basis
No of working days Days 300 Feasibility Study
No of Operating Hours Hrs. 6 Feasibility Study
Proposed Investment
Cost of biomass gasifier with accessories ` in lakh 31.14
Cost of installation ` in lakh 1.75
Other cost ` in lakh 7.82
Total Investment ` in lakh 40.71
Financing pattern
Own Funds (Equity) ` in lakh 10.18
Loan Funds (Term Loan) ` in lakh 30.53
Loan Tenure yr 5 Assumed
Moratorium Period Months 6 Assumed
Repayment Period Months 66 Assumed
Interest Rate %/yr 10 SIDBI Lending rate
Estimation of Costs
O & M Costs % on Plant & Equip 4 Feasibility Study
Annual Escalation % 5 Feasibility Study
Estimation of Revenue
Savings in Coal ` in lakh 32.94
Cost of Electricity consumption ` in lakh 2.32
Cost of manpower ` in lakh 2.55
St. line Depn. % age 5.28 Indian Companies Act
IT Depreciation % age 80.00 Income Tax Rules
Income Tax % age 33.99 Income Tax
Estimation of Interest on Term Loan
Years Opening Balance Repayment Closing Balance Interest
1 30.53 2.40 28.13 3.52
2 28.13 5.40 22.73 2.57
3 22.73 5.60 17.13 2.02
4 17.13 6.20 10.93 1.44
5 10.93 7.20 3.73 0.77
6 3.73 3.73 0.00 0.11
30.53

Biomass Gasifier Replacing Furnace Oil
40
WDV Depreciation
Particulars / years 1 2
Plant and Machinery Cost 40.71 8.14
Depreciation 32.57 6.51
WDV 8.14 1.63
Projected Profitability RRRR`̀̀̀ (in lakh)
Particulars / Years 1 2 3 4 5 6 7 8
Fuel savings 28.07 28.07 28.07 28.07 28.07 28.07 28.07 28.07
Total Revenue (A) 28.07 28.07 28.07 28.07 28.07 28.07 28.07 28.07
Expenses
O & M Expenses 1.63 1.71 1.80 1.89 1.98 2.08 2.18 2.29
Total Expenses (B) 1.63 1.71 1.80 1.89 1.98 2.08 2.18 2.29
PBDIT (A)-(B) 26.44 26.36 26.28 26.19 26.09 25.99 25.89 25.78
Interest 3.52 2.57 2.02 1.44 0.77 0.11 - -
PBDT 22.92 23.79 24.25 24.75 25.33 25.88 25.89 25.78
Depreciation 2.15 2.15 2.15 2.15 2.15 2.15 2.15 2.15
PBT 20.77 21.65 22.10 22.60 23.18 23.73 23.74 23.63
Income tax - 5.87 8.24 8.41 8.61 8.80 8.80 8.76
Profit after tax (PAT) 20.77 15.77 13.86 14.19 14.57 14.93 14.94 14.87
Computation of Tax `̀̀̀ (in lakh)
Particulars / Years 1 2 3 4 5 6 7 8
Profit before tax 20.77 21.65 22.10 22.60 23.18 23.73 23.74 23.63
Add: Book depreciation 2.15 2.15 2.15 2.15 2.15 2.15 2.15 2.15
Less: WDV depreciation 32.57 6.51 - - - - - -
Taxable profit (9.65) 17.28 24.25 24.75 25.33 25.88 25.89 25.78
Income Tax - 5.87 8.24 8.41 8.61 8.80 8.80 8.76
Projected Balance Sheet
Particulars / Years 1 2 3 4 5 6 7 8
Liabilities
Share Capital (D) 10.18 10.18 10.18 10.18 10.18 10.18 10.18 10.18
Reserves & Surplus (E) 20.77 36.54 50.40 64.59 79.16 94.09 109.03 123.90
Term Loans (F) 28.13 22.73 17.13 10.93 3.73 0.00 0.00 0.00
Total Liabilities (D)+(E)+(F) 59.08 69.45 77.71 85.70 93.07 104.27 119.21 134.08
Assets 1 2 3 4 5 6 7 8
Gross Fixed Assets 40.71 40.71 40.71 40.71 40.71 40.71 40.71 40.71
Less Accm. depreciation 2.15 4.30 6.45 8.60 10.75 12.90 15.05 17.20
Net Fixed Assets 38.56 36.41 34.26 32.11 29.96 27.81 25.66 23.51
Cash & Bank Balance 20.52 33.04 43.45 53.59 63.10 76.46 93.55 110.57
TOTAL ASSETS 59.08 69.45 77.71 85.70 93.07 104.27 119.21 134.08
Net Worth 30.95 46.72 60.58 74.77 89.33 104.27 119.21 134.08
Debt Equity Ratio 2.76 2.23 1.68 1.07 0.37 0.00 0.00 0.00

Biomass Gasifier Replacing Furnace Oil
41
Projected Cash Flow RsRsRsRs`̀̀̀ (in lakh) Particulars / Years 0 1 2 3 4 5 6 7 8
Sources
Share Capital 10.18 - - - - - - - -
Term Loan 30.53
Profit After tax 20.77 15.77 13.86 14.19 14.57 14.93 14.94 14.87
Depreciation 2.15 2.15 2.15 2.15 2.15 2.15 2.15 2.15
Total Sources 40.71 22.92 17.92 16.01 16.34 16.72 17.08 17.09 17.02
Application
Capital Expenditure 40.71
Repayment Of Loan - 2.40 5.40 5.60 6.20 7.20 3.73 - -
Total Application 40.71 2.40 5.40 5.60 6.20 7.20 3.73 - -
Net Surplus - 20.52 12.52 10.41 10.14 9.52 13.35 17.09 17.02
Add: Opening Balance - - 20.52 33.04 43.45 53.59 63.10 76.46 93.55
Closing Balance - 20.52 33.04 43.45 53.59 63.10 76.46 93.55 110.57
IRR RsRsRsRs`̀̀̀ (in lakh) Particulars / months 0 1 2 3 4 5 6 7 8
Profit after Tax 20.77 15.77 13.86 14.19 14.57 14.93 14.94 14.87
Depreciation 2.15 2.15 2.15 2.15 2.15 2.15 2.15 2.15
Interest on Term Loan 3.52 2.57 2.02 1.44 0.77 0.11 - -
Cash outflow (40.71) - - - - - - - -
Net Cash flow (40.71) 26.44 20.49 18.03 17.77 17.48 17.20 17.09 17.02
IRR 50.54%% NPV 63.22
Break Even Point
Particulars / Years 1 2 3 4 5 6 7 8
Variable Expenses
Oper. & Maintenance Exp (75%) 1.22 1.28 1.35 1.41 1.48 1.56 1.64 1.72
Sub Total(G) 1.22 1.28 1.35 1.41 1.48 1.56 1.64 1.72
Fixed Expenses
Oper. & Maintenance Exp (25%) 0.41 0.43 0.45 0.47 0.49 0.52 0.55 0.57
Interest on Term Loan 3.52 2.57 2.02 1.44 0.77 0.11 0.00 0.00
Depreciation (H) 2.15 2.15 2.15 2.15 2.15 2.15 2.15 2.15
Sub Total (I) 6.08 5.14 4.62 4.06 3.41 2.78 2.70 2.72
Sales (J) 28.07 28.07 28.07 28.07 28.07 28.07 28.07 28.07
Contribution (K) 26.85 26.79 26.73 26.66 26.59 26.51 26.43 26.35
Break Even Point (L= G/I) 22.64% 19.20% 17.30% 15.22% 12.83% 10.49% 10.19% 10.33%
Cash Break Even {(I)-(H)} 14.63% 11.18% 9.26% 7.16% 4.74% 2.38% 2.06% 2.17%
Break Even Sales (J)*(L) 6.36 5.39 4.86 4.27 3.60 2.94 2.86 2.90
Return on Investment RsRsRsRs`̀̀̀ (in lakh)
Particulars / Years 1 2 3 4 5 6 7 8 Total
Net Profit Before Taxes 20.77 21.65 22.10 22.60 23.18 23.73 23.74 23.63 181.40
Net Worth 30.95 46.72 60.58 74.77 89.33 104.27 119.21 134.08 659.91
27.49%

Biomass Gasifier Replacing Furnace Oil
42
Debt Service Coverage Ratio
`̀̀̀ (in lakh)
Particulars / Years 1 2 3 4 5 6 7 8 Total
Cash Inflow
Profit after Tax 20.77 15.77 13.86 14.19 14.57 14.93 14.94 14.87 94.09
Depreciation 2.15 2.15 2.15 2.15 2.15 2.15 2.15 2.15 12.90
Interest on Term Loan 3.52 2.57 2.02 1.44 0.77 0.11 0.00 0.00 10.43
Total (M) 26.44 20.49 18.03 17.77 17.48 17.20 17.09 17.02 117.42
DEBT Interest on Term Loan 3.52 2.57 2.02 1.44 0.77 0.11 0.00 0.00 10.43
Repayment of Term Loan 2.40 5.40 5.60 6.20 7.20 3.73 0.00 0.00 30.53
Total (N) 5.92 7.97 7.62 7.64 7.97 3.84 0.00 0.00 40.96
4.47 2.57 2.37 2.33 2.19 4.48 0.00 0.00 2.87
Average DSCR (M/N) 2.87

Biomass Gasifier Replacing Furnace Oil
43
Annexure:-6 Procurement and implementation schedule
S. No.
Activities Weeks
1 2 3 4 5 6
1 Ordering the raw materials
2 Replacing the flue gas pathway
3 Making the new furnace
Break up of shutdown period of plant required
S.No Activity Day
1 Prepare the pathway for the producer gas to Circulate 7
2 Remake the furnace to suit burning the producer gas 3
Day wise break up of shut down period of galvanizing furnace operation
S.No Activity Day
1 2 3 4 5 6 7 8 9 10
1 Marking the pathway for the flue gas
2 Dismantling of existing pipeline
3 New ducting & piping arrangement for producer gas
4 Installation of the new furnace using the producer gas
5 Instrumentations and trial

Biomass Gasifier Replacing Furnace Oil
44
Annexure -7: Details of technology service providers
S.No. Name of Service Provider Address Contact Person and No.
1 Ankur Scientific Energy
Technologies Pvt Ltd
Near Navarachana School,
Sama, Vadodara-390008
Ph-(0265) 2793098
Email: [email protected]
Website: www.ankurscientific.com
2 GP Grain Energy Systems Pvt Ltd
BH-114, Sector-II, Saltlake -
700091
Telefax: (033)23580114 / 23210809
Email: [email protected]
Website: www.gpenergy.net
3 Bioresidue Energy Technology Pvt
Ltd
S-2, Digvijay Apartments,1st
Cross, Ganesha
Block.Sultanpalya, R.T. Nagar
PO Bangalore – 560 032
Mr. Amar Kumar
Mobile: 94490 40961
Email : [email protected]
4 OVN Bio Energy Pvt Ltd
Bt-1/90 mangolpuri Ind. Area,
Phase-1, New Delhi-110083
Mr. Navin Raheja
Tel: +91 11 27922603, +91 11 27911608
Mobile: 9891201000

Biomass Gasifier Replacing Furnace Oil
45
Annexure -8: Quotations or Techno-commercial bids for new technology/equipment

Biomass Gasifier Replacing Furnace Oil
46

Biomass Gasifier Replacing Furnace Oil
47
Biomass Gasifier Replacing Furnace Oil
48

Biomass Gasifier Replacing Furnace Oil
49

Biomass Gasifier Replacing Furnace Oil
50

Biomass Gasifier Replacing Furnace Oil
51

Biomass Gasifier Replacing Furnace Oil
52

Biomass Gasifier Replacing Furnace Oil
53

Biomass Gasifier Replacing Furnace Oil
54

Biomass Gasifier Replacing Furnace Oil
55

Biomass Gasifier Replacing Furnace Oil
56

Biomass Gasifier Replacing Furnace Oil
57

Biomass Gasifier Replacing Furnace Oil
58

Biomass Gasifier Replacing Furnace Oil
59

Biomass Gasifier Replacing Furnace Oil
60

Biomass Gasifier Replacing Furnace Oil
61

Biomass Gasifier Replacing Furnace Oil
62
Biomass Gasifier Replacing Furnace Oil
63

Biomass Gasifier Replacing Furnace Oil
64

Biomass Gasifier Replacing Furnace Oil
65
Biomass Gasifier Replacing Furnace Oil
66

Biomass Gasifier Replacing Furnace Oil
67

Biomass Gasifier Replacing Furnace Oil
68

Biomass Gasifier Replacing Furnace Oil
69

Biomass Gasifier Replacing Furnace Oil
70

India SME Technology Services Ltd DFC Building, Plot No.37-38, D-Block, Pankha Road, Institutional Area, Janakpuri, New Delhi-110058 Tel: +91-11-28525534, Fax: +91-11-28525535 Website: www.techsmall.com
Bureau of Energy Efficiency (BEE) (Ministry of Power, Government of India) 4th Floor, Sewa Bhawan, R. K. Puram, New Delhi – 110066 Ph.: +91 – 11 – 26179699 (5 Lines), Fax: +91 – 11 – 26178352
Websites: www.bee-india.nic.in, www.energymanagertraining.com