detailed economic analysis i. economic … · detailed economic analysis ... the subproject...
TRANSCRIPT
DETAILED ECONOMIC ANALYSIS
1. The following economic analysis is presented in two parts. Part one assesses the economic investment into the five road subprojects representing output 1 within the DMF and Part Two assesses the tourism investment in output 2. The summary assesses the ability of the road and tourism subprojects to carry the overhead costs of capacity building, the project management and administration.
I. ECONOMIC ASSESSMENT OF ROADING SUBPROJECTS
A. Background
2. The objective of the Project is poverty reduction through economic growth. The project provinces rely on the agricultural sector for employment and income generation. Improvements in the transport linkages seek to increase the connectivity of the CLVDTA economies to regional and international markets. Given the high dependence of these economies on forestry and agricultural production the connectivity will provide increased efficiency in the market orientation of rural and agricultural production and provide better access to both services and markets for the rural poor.
3. While investment to date in national and provincial highways and on productive rural infrastructure has provided significant gains, the linkages between the two need to be strengthened. The investment proposed under the Project addresses these linkages. An early finding of the PPTA was that the investment required exceeded available resources and proposed that the focus of the Project be limited to infrastructure connecting into national highways, leaving future government and donor programs to support the local connections. The key arterials in the Project areas are National Highway 14 and 14c that pass through the five provinces in a north-south orientation that links into the Ho Chi Minh logistics node and export port and to the east west international border gates.
4. Viet Nam has an extensive road network and a relatively high overall road density. The present network comprises more than 256,000 km, but only about 17,000 km (7%) are classified as national highways, and only about 23,000 km (9%) are provincial roads. The vast majority of the network (84%) is local roads (classified as district, commune, or urban roads). This means that the network is not hierarchically well articulated.
5. Many of the provincial and district roads within the Vietnam Development triangle Area (VDTA) are in poor condition affecting farmers and small traders supplying processors and exporters further down the value chain. As NH 14 links the VDTA with Ho Chi Minh City in the south, it is critical that production areas are connected to NH14 for access to the ports and access to the main domestic market.
6. The project roads will contribute to the agricultural and rural economy by improving the connectivity of agricultural production areas to NH14 and thus to processing facilities and markets. The main benefit will be reduced transport costs. Since the reduction occurs at the first stage of the logistics chain, most of the benefits will accrue to the rural community. Secondary benefits will include a transfer from two wheel to four wheel transport for collection from the farms, further reducing transport costs; and an increase in the area under active cultivation/harvesting (particularly rubber plantations) as a result of greater farm-gate yields. No attempt has been made to quantify the secondary benefits. Reduced transport costs will also reduce the cost for fertilizer and other inputs and for travel by farm workers.
B. Road Subproject Description
7. Each Provincial EA has agreed one road subproject that was identified using multi-criteria analysis. The following briefly describes the project roads.
1. Kon Tum
8. The subproject in Kon Tum has the total length of 70.8 km. The road goes from North East to South West of the district through the area of Ia Toi and Ia Dal communes linking the province to NH14 in the east and NH14C and the Ho Da auxiliary border gate in the west. The subproject has two sections:
Section 1 from junction with Road No.675 to junction with Road No.14C – total of 58.7km will (i).be upgraded to Rural Road Type B in accordance TCVN 10380:2014 (road base: 5m; road surface: 3.5m; road side: 2x0.75m).
Section 2 from junction with Road No.14C to Ho Da Auxiliary Border Gate will be newly (ii).constructed in Grade V Mountain in accordance to TCVN4054-05 road base: 6.5m; road surface: 3.5m; road side: 2x1.0m).
9. The road will be built in cement concrete and will serve Ia H’Drai District whose population is predominantly ethnic minority and where the poverty rate is high. It will enable year-round access for rubber plantations and cassava cropping and is expected to lead to increased agricultural production generating additional employment.
2. Gia Lai
10. The Subproject upgrades 65.87km of provincial road No.665 to Vietnamese Standard Road Grade IV – Mountainous - with the surface width of 5.5 m and base width of 7.5 m. The road surface material is asphalt concrete with design speed of 40 km/h. The road provides a strategic east-west connection from NR 14 at Phu My Junction to NH 14C in the west and border post 729 (Gia Lai – Cambodia Border). The project road serves the districts of Chu Prong. Chu Prong is the biggest rubber producing district and second biggest coffee producer in Gia Lai. It is also high ranking in the production of the other export crops. The ethnic minority proportion, at 47% and the incidence of poverty at 12.4% are high, but not the highest in the province.
3. Dak Lak
11. The subproject in Dak Lak will upgrade NH-29. The subproject will upgrade 40km of National road No.29 to Vietnamese Standard Road Grade III – Mountainous (TCVN 4054-05) with the surface width of 7.5 m and base width of 9.0 m. The road surface material is asphalt concrete. The designation as NH29 for what is currently a minor provincial road reflects the Province’s intention that this will form part of an eventual link from the Cambodian border at Dak Rue to the east coast port of Nha Trang. The section being improved under the project is of particular significance for Dak Lak province and primarily serves Cu M’Gar district, although it passes through the district of, Krong Buk and serves Ea Sup district indirectly. Cu M’Gar is the province’s biggest coffee producer, it also is one of the larger producers of rubber, cashew and pepper. With Kong Buk it has one of the highest proportions of ethnic minorities and median level poverty within the province.
4. Dak Nong
12. The subproject in Dak Nong will upgrade the provincial road from NR No.14 to Bu Prang Border Gate (Section Km3-Km17 of PR No.686 and Section from Tuy Duc District Center to Dak Huyt Bridge) – Dak Nong Province. The Subproject will upgrade about 44 km to connect National Road No.14 (at Km817) to the end point at Bu Prang Border Gate, Tuy Duc district. The subproject will goes through the area of Nam N’Jang; Dak N’Drung communes – Dak Song district and Dak Buk So; Quang Truc communes in Tuy Duc district. Dak Song is the largest coffee and pepper producing district, while Tuy Duc and Dak Song have the second and third highest poverty rate respectively for the province.
5. Binh Phuoc
13. The Subproject in Binh Phuoc will upgrade 50.3 km of provincial road No.756 to Grade III – Mountain in accordance with TCVN 4054:2005. The road links the productive agricultural districts of Loc Ninh, Chon Thanh and Hon Quan with Hoa Lu and Hoang Dieu border crossings in the north and the main route to Ho Chi Minh City in the south. The start point is the Minh Lap junction with National Road No14 in Chon Thanh district. It goes through Minh Lap commune – Chon Thanh district; Tan Hung, Tan Loi, Thanh An communes – Hon Quan district; Loc Quang, Loc Phu, Loc Hiep communes – Loc Ninh district. The end point is the junction with provincial road No. 759B at the center of Loc Hiep commune at a distance of 22 and 31 km to Hoa Lu and Hoang Dieu international border gates respectively. The districts served by the road account for 47% and 53% of the province’s rubber and pepper production respectively and 45% of the ethnic minorities.
C. Methodology
14. Since the main benefit from the project is through the reduction in transport costs, the economic analysis focused on estimation of the transport cost saving. This included savings for other (primarily rural) users of the sub-project roads. The economic analysis was carried out following ADB
“Guidelines for the Economic Analysis of Projects” comparing with and without–project scenarios using IRR and NPV at 12% discount rate as measures.
1. Selection of Options
15. Two road pavement options were selected for testing and were compared with a do minimum option that assumed general maintenance but no major work. Incremental analysis was used to compare the options. Under incremental analysis, a more expensive option is favored if comparing the incremental benefits to the incremental costs gives a return greater than the target 12%.
16. The options for all except Kon Tum were:
(i) Single asphalt concrete layer: for new work or where the existing pavement is completely replaced, the pavement would be formed using a single asphalt layer with two layers of crushed stone base course. Where the new pavement is on top of an existing pavement, the crushed stone layers are reduced depending on the calculated strength of the existing.
(ii) Double asphalt layer: As above, but with separate asphalt concrete base course and wearing course layers. The crushed stone layer is consequently reduced.
17. For the Kon Tum road, three options were tested being:
(i) surface dressing (3cm bituminous surface),
(ii) single layer asphalt concrete and
(iii) cement concrete.
2. Return for the Project
18. To calculate the overall return of the project, the selected treatment options were compared with a do minimum option. The economic analysis covers a period of 23 years (2017-2039), including 3 years for project implementation and 20 years of full usage of the reconstructed road. All benefits and costs are in constant 2016 prices using domestic prices but excluding VAT and other indirect taxes.
3. Engineering Assumptions
19. Without treatment the road roughness index (IRI) would gradually rise to 16 – the default maximum. Under the without project scenario it is assumed that the roads are repaired on an approximately 10 year cycle using penetration macadam or similar to give a 3cm bituminous surface. In practice financial constraints mean that roads are often not repaired until sections of the road pavement have completely failed.
20. Under the with-project scenario, the overlay or reconstruction reduces the IRI to 2.0 by 2018. It gradually rises under the assumed routine and periodic maintenance. Where, in some cases, it would exceed 8 before the end of the project period, a ‘mid-life’ overlay is included.
D. Traffic
1. Historical Data
21. The provinces do not have reliable data on traffic. All provinces have annual traffic count programs, but in all cases these have been suspended due to lack of funds. Traffic counts have been taken by the provinces from time to time, but not in any consistent manner. The data available is thus often dated and incomplete. There are count data for some provincial roads but only for some years and as such no consistent data series is available for analysis and projections. The existing data identifies that the bulk of the traffic by vehicle numbers is made up of two wheelers.
22. There is, in any case, a problem with annual counts. The agricultural nature of the activities along the project roads means that freight flows are heavily peaked around seasonal harvest times. Other flows including inbound fertilizer and the daily travels of farm workers are also seasonal. The same problem applies to the ‘one-off’ surveys conducted specifically for the project. Unless data are already available that would enable a seasonal adjustment to be made, a one-off count provides only limited input to annual traffic levels or composition. Additional surveys were nevertheless undertaken where there had
been no recent surveys. There were undertaken in July 2016, which is wet season with some roads impassable and no major harvesting being undertaken.
23. There has been a considerable growth in vehicle ownership over the last ten years, and this is expected to continue. This will be reflected in trip numbers on the project roads, although it is generally observed that the growth in traffic is less than the growth in ownership, suggesting declining marginal use as ownership increases. There is also evidence of a gradual move from two wheel to four wheel transport.
24. All the roads have sections that are in poor or very poor condition, and some traffic generation and diversion from other routes could be expected to occur. Improvement to the roads is expected to result in the earlier switch to larger vehicles in place of motorcycles. Thus the traffic will likely to be composed of fewer but larger vehicles. However because many link roads remain in a poor state, this will only affect part of the demand. .
a. Kon Tum
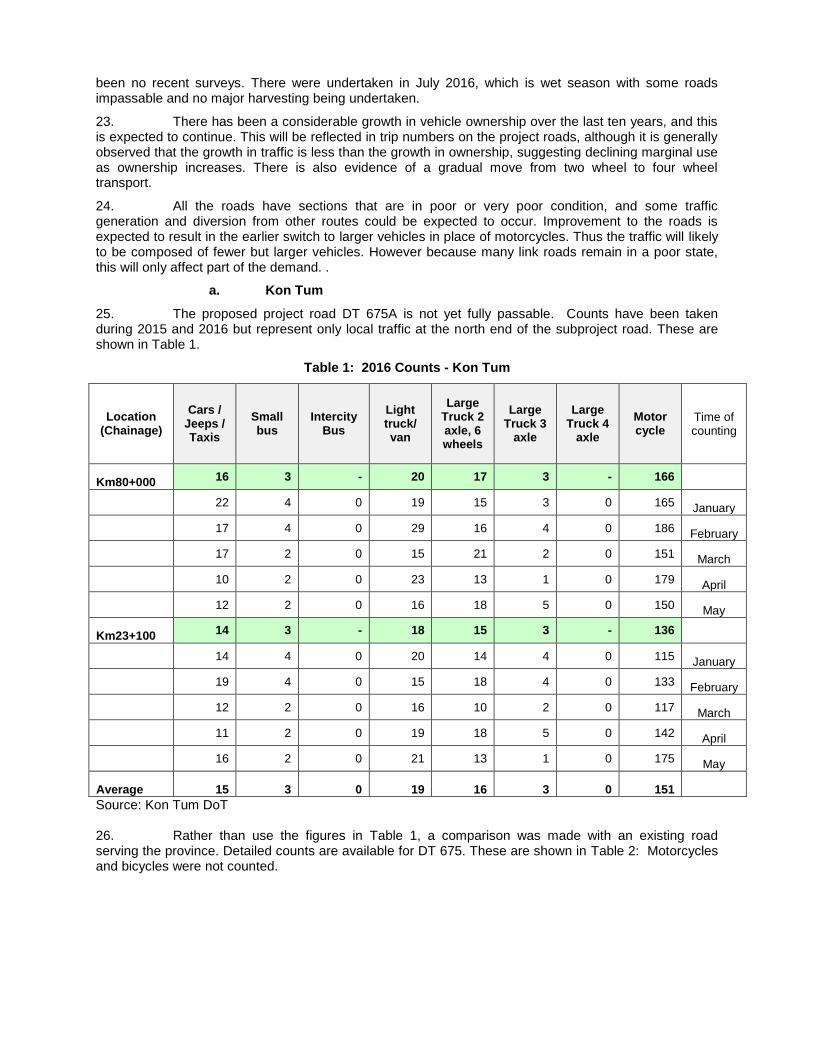
25. The proposed project road DT 675A is not yet fully passable. Counts have been taken during 2015 and 2016 but represent only local traffic at the north end of the subproject road. These are shown in Table 1.
Table 1: 2016 Counts - Kon Tum
Location (Chainage)
Cars / Jeeps / Taxis
Small bus
Intercity Bus
Light truck/ van
Large Truck 2 axle, 6 wheels
Large Truck 3
axle
Large Truck 4
axle
Motor cycle
Time of counting
Km80+000 16 3 - 20 17 3 - 166
22 4 0 19 15 3 0 165 January
17 4 0 29 16 4 0 186 February
17 2 0 15 21 2 0 151 March
10 2 0 23 13 1 0 179 April
12 2 0 16 18 5 0 150 May
Km23+100 14 3 - 18 15 3 - 136
14 4 0 20 14 4 0 115 January
19 4 0 15 18 4 0 133 February
12 2 0 16 10 2 0 117 March
11 2 0 19 18 5 0 142 April
16 2 0 21 13 1 0 175 May
Average 15 3 0 19 16 3 0 151
Source: Kon Tum DoT 26. Rather than use the figures in Table 1, a comparison was made with an existing road serving the province. Detailed counts are available for DT 675. These are shown in Table 2: Motorcycles and bicycles were not counted.
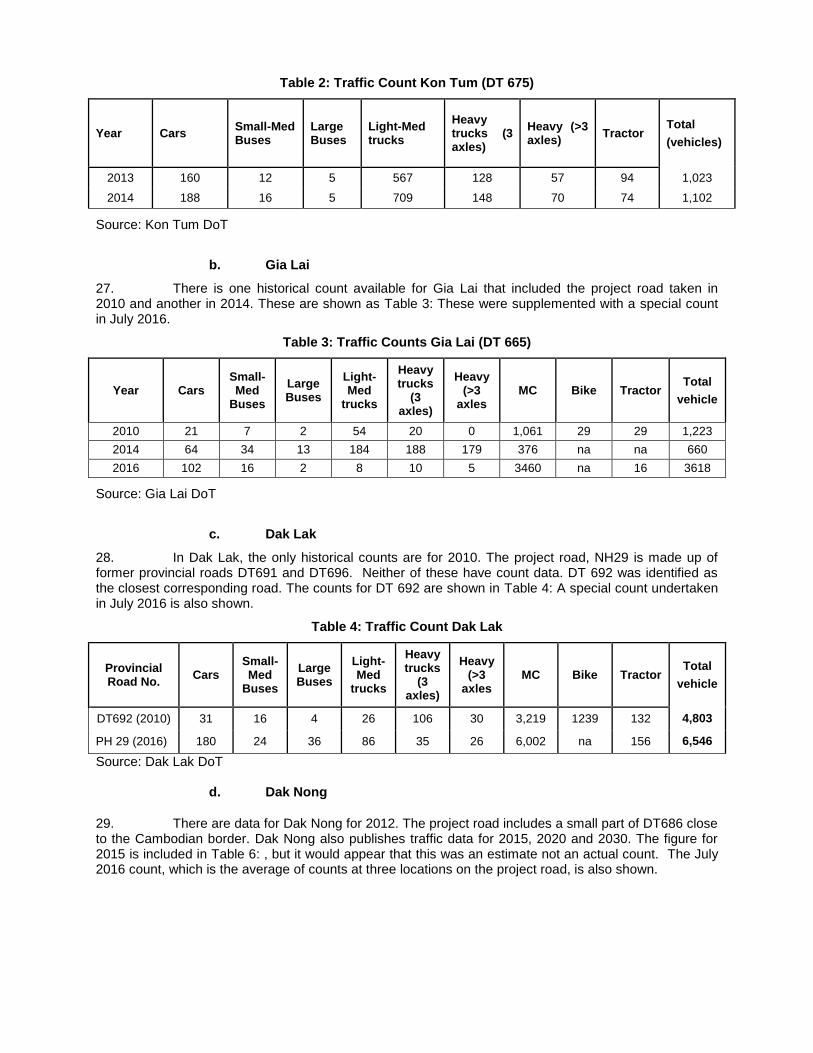
Table 2: Traffic Count Kon Tum (DT 675)
Year Cars Small-Med Buses
Large Buses
Light-Med trucks
Heavy trucks (3 axles)
Heavy (>3 axles)
Tractor Total
(vehicles)
2013 160 12 5 567 128 57 94 1,023
2014 188 16 5 709 148 70 74 1,102
Source: Kon Tum DoT
b. Gia Lai
27. There is one historical count available for Gia Lai that included the project road taken in 2010 and another in 2014. These are shown as Table 3: These were supplemented with a special count in July 2016.
Table 3: Traffic Counts Gia Lai (DT 665)
Year Cars Small-Med
Buses
Large Buses
Light-Med
trucks
Heavy trucks
(3 axles)
Heavy (>3
axles MC Bike Tractor
Total
vehicle
2010 21 7 2 54 20 0 1,061 29 29 1,223
2014 64 34 13 184 188 179 376 na na 660
2016 102 16 2 8 10 5 3460 na 16 3618
Source: Gia Lai DoT
c. Dak Lak
28. In Dak Lak, the only historical counts are for 2010. The project road, NH29 is made up of former provincial roads DT691 and DT696. Neither of these have count data. DT 692 was identified as the closest corresponding road. The counts for DT 692 are shown in Table 4: A special count undertaken in July 2016 is also shown.
Table 4: Traffic Count Dak Lak
Provincial Road No.
Cars Small-Med
Buses
Large Buses
Light-Med
trucks
Heavy trucks
(3 axles)
Heavy (>3
axles MC Bike Tractor
Total
vehicle
DT692 (2010) 31 16 4 26 106 30 3,219 1239 132 4,803
PH 29 (2016) 180 24 36 86 35 26 6,002 na 156 6,546
Source: Dak Lak DoT
d. Dak Nong
29. There are data for Dak Nong for 2012. The project road includes a small part of DT686 close to the Cambodian border. Dak Nong also publishes traffic data for 2015, 2020 and 2030. The figure for 2015 is included in Table 6: , but it would appear that this was an estimate not an actual count. The July 2016 count, which is the average of counts at three locations on the project road, is also shown.
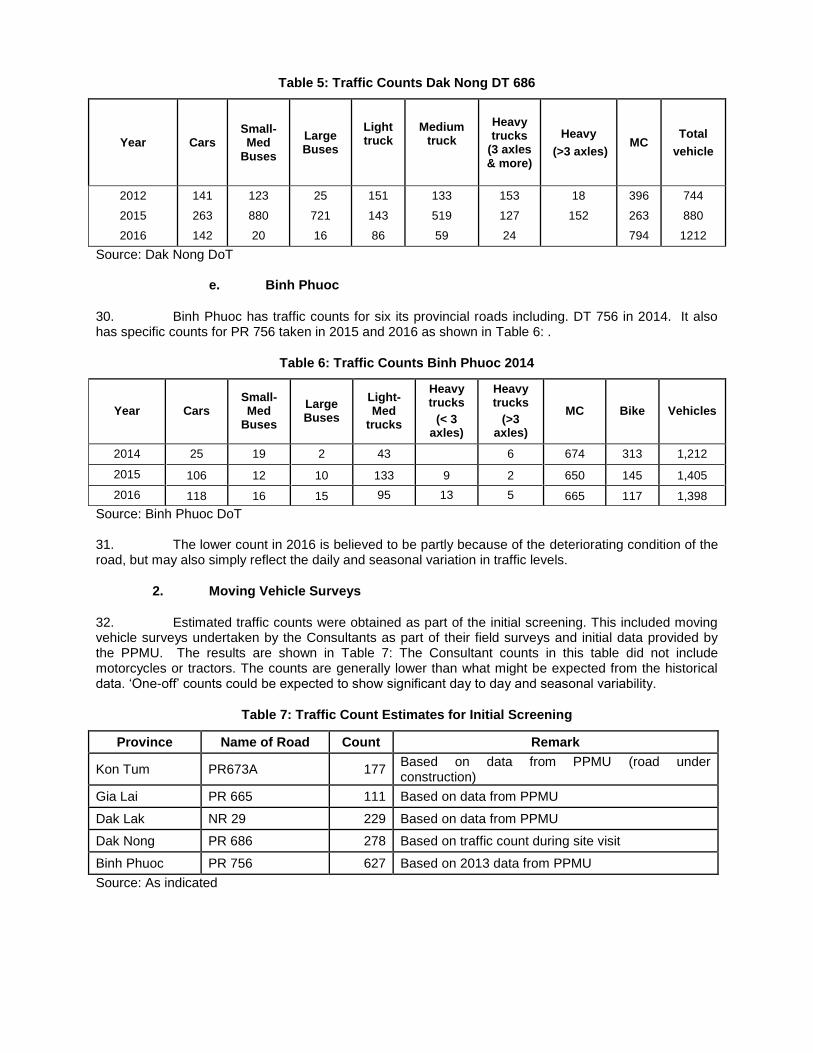
Table 5: Traffic Counts Dak Nong DT 686
Year Cars Small-Med
Buses
Large Buses
Light truck
Medium truck
Heavy trucks
(3 axles & more)
Heavy
(>3 axles) MC
Total
vehicle
2012 141 123 25 151 133 153 18 396 744
2015 263 880 721 143 519 127 152 263 880
2016 142 20 16 86 59 24 794 1212
Source: Dak Nong DoT
e. Binh Phuoc
30. Binh Phuoc has traffic counts for six its provincial roads including. DT 756 in 2014. It also has specific counts for PR 756 taken in 2015 and 2016 as shown in Table 6: .
Table 6: Traffic Counts Binh Phuoc 2014
Year Cars Small-Med
Buses
Large Buses
Light-Med
trucks
Heavy trucks
(< 3 axles)
Heavy trucks
(>3 axles)
MC Bike Vehicles
2014 25 19 2 43 6 674 313 1,212
2015 106 12 10 133 9 2 650 145 1,405
2016 118 16 15 95 13 5 665 117 1,398
Source: Binh Phuoc DoT 31. The lower count in 2016 is believed to be partly because of the deteriorating condition of the road, but may also simply reflect the daily and seasonal variation in traffic levels.
2. Moving Vehicle Surveys
32. Estimated traffic counts were obtained as part of the initial screening. This included moving vehicle surveys undertaken by the Consultants as part of their field surveys and initial data provided by the PPMU. The results are shown in Table 7: The Consultant counts in this table did not include motorcycles or tractors. The counts are generally lower than what might be expected from the historical data. ‘One-off’ counts could be expected to show significant day to day and seasonal variability.
Table 7: Traffic Count Estimates for Initial Screening
Province Name of Road Count Remark
Kon Tum PR673A 177 Based on data from PPMU (road under construction)
Gia Lai PR 665 111 Based on data from PPMU
Dak Lak NR 29 229 Based on data from PPMU
Dak Nong PR 686 278 Based on traffic count during site visit
Binh Phuoc PR 756 627 Based on 2013 data from PPMU
Source: As indicated
3. Traffic Growth
33. There are insufficient data on actual traffic to use for estimating traffic growth on the project roads. Traffic growth was therefore estimated from historical data relating to
Growth in transport activity
Vehicle ownership
Growth in agricultural output
Growth in GDP
34. These measures were also used to bring the historical counts for the project roads to a common base year figure for 2016.
a. Transport Activity
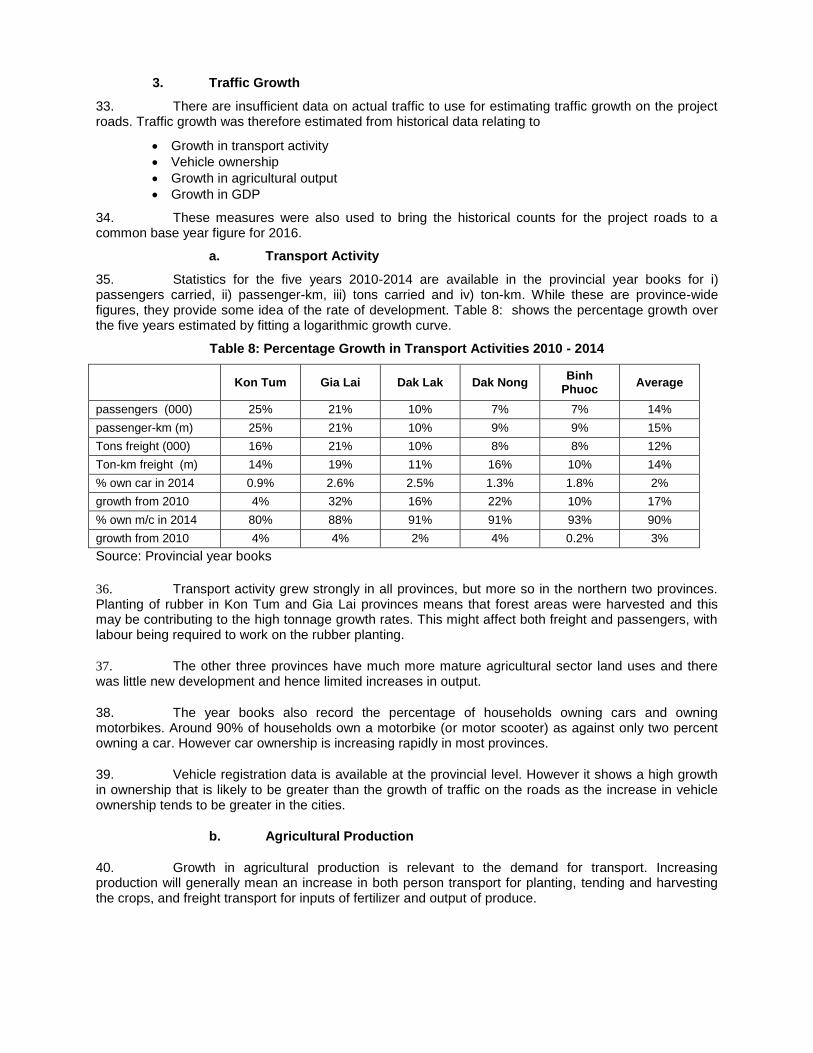
35. Statistics for the five years 2010-2014 are available in the provincial year books for i) passengers carried, ii) passenger-km, iii) tons carried and iv) ton-km. While these are province-wide figures, they provide some idea of the rate of development. Table 8: shows the percentage growth over the five years estimated by fitting a logarithmic growth curve.
Table 8: Percentage Growth in Transport Activities 2010 - 2014
Kon Tum Gia Lai Dak Lak Dak Nong
Binh Phuoc
Average
passengers (000) 25% 21% 10% 7% 7% 14%
passenger-km (m) 25% 21% 10% 9% 9% 15%
Tons freight (000) 16% 21% 10% 8% 8% 12%
Ton-km freight (m) 14% 19% 11% 16% 10% 14%
% own car in 2014 0.9% 2.6% 2.5% 1.3% 1.8% 2%
growth from 2010 4% 32% 16% 22% 10% 17%
% own m/c in 2014 80% 88% 91% 91% 93% 90%
growth from 2010 4% 4% 2% 4% 0.2% 3%
Source: Provincial year books
36. Transport activity grew strongly in all provinces, but more so in the northern two provinces. Planting of rubber in Kon Tum and Gia Lai provinces means that forest areas were harvested and this may be contributing to the high tonnage growth rates. This might affect both freight and passengers, with labour being required to work on the rubber planting.
37. The other three provinces have much more mature agricultural sector land uses and there was little new development and hence limited increases in output.
38. The year books also record the percentage of households owning cars and owning motorbikes. Around 90% of households own a motorbike (or motor scooter) as against only two percent owning a car. However car ownership is increasing rapidly in most provinces.
39. Vehicle registration data is available at the provincial level. However it shows a high growth in ownership that is likely to be greater than the growth of traffic on the roads as the increase in vehicle ownership tends to be greater in the cities.
b. Agricultural Production
40. Growth in agricultural production is relevant to the demand for transport. Increasing production will generally mean an increase in both person transport for planting, tending and harvesting the crops, and freight transport for inputs of fertilizer and output of produce.
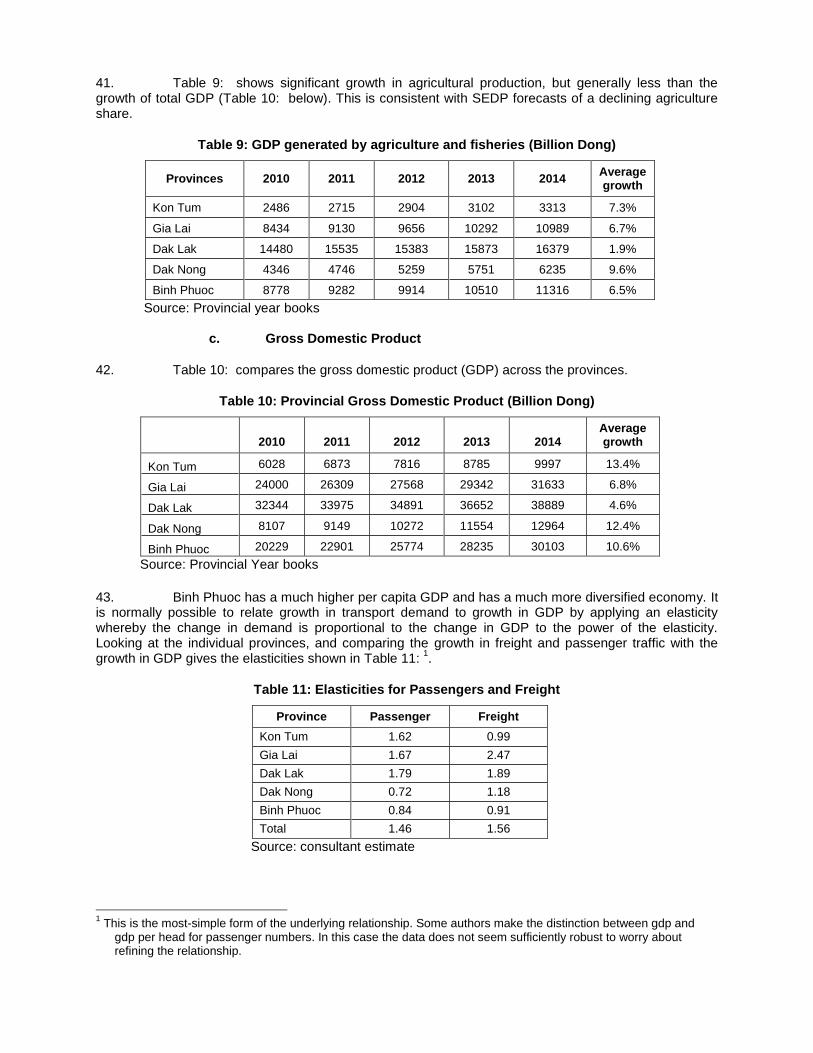
41. Table 9: shows significant growth in agricultural production, but generally less than the growth of total GDP (Table 10: below). This is consistent with SEDP forecasts of a declining agriculture share.
Table 9: GDP generated by agriculture and fisheries (Billion Dong)
Provinces 2010 2011 2012 2013 2014 Average growth
Kon Tum 2486 2715 2904 3102 3313 7.3%
Gia Lai 8434 9130 9656 10292 10989 6.7%
Dak Lak 14480 15535 15383 15873 16379 1.9%
Dak Nong 4346 4746 5259 5751 6235 9.6%
Binh Phuoc 8778 9282 9914 10510 11316 6.5%
Source: Provincial year books
c. Gross Domestic Product
42. Table 10: compares the gross domestic product (GDP) across the provinces.
Table 10: Provincial Gross Domestic Product (Billion Dong)
2010 2011 2012 2013 2014 Average growth
Kon Tum 6028 6873 7816 8785 9997 13.4%
Gia Lai 24000 26309 27568 29342 31633 6.8%
Dak Lak 32344 33975 34891 36652 38889 4.6%
Dak Nong 8107 9149 10272 11554 12964 12.4%
Binh Phuoc 20229 22901 25774 28235 30103 10.6%
Source: Provincial Year books
43. Binh Phuoc has a much higher per capita GDP and has a much more diversified economy. It is normally possible to relate growth in transport demand to growth in GDP by applying an elasticity whereby the change in demand is proportional to the change in GDP to the power of the elasticity. Looking at the individual provinces, and comparing the growth in freight and passenger traffic with the growth in GDP gives the elasticities shown in Table 11:
1.
Table 11: Elasticities for Passengers and Freight
Province Passenger Freight
Kon Tum 1.62 0.99
Gia Lai 1.67 2.47
Dak Lak 1.79 1.89
Dak Nong 0.72 1.18
Binh Phuoc 0.84 0.91
Total 1.46 1.56
Source: consultant estimate
1 This is the most-simple form of the underlying relationship. Some authors make the distinction between gdp and
gdp per head for passenger numbers. In this case the data does not seem sufficiently robust to worry about refining the relationship.
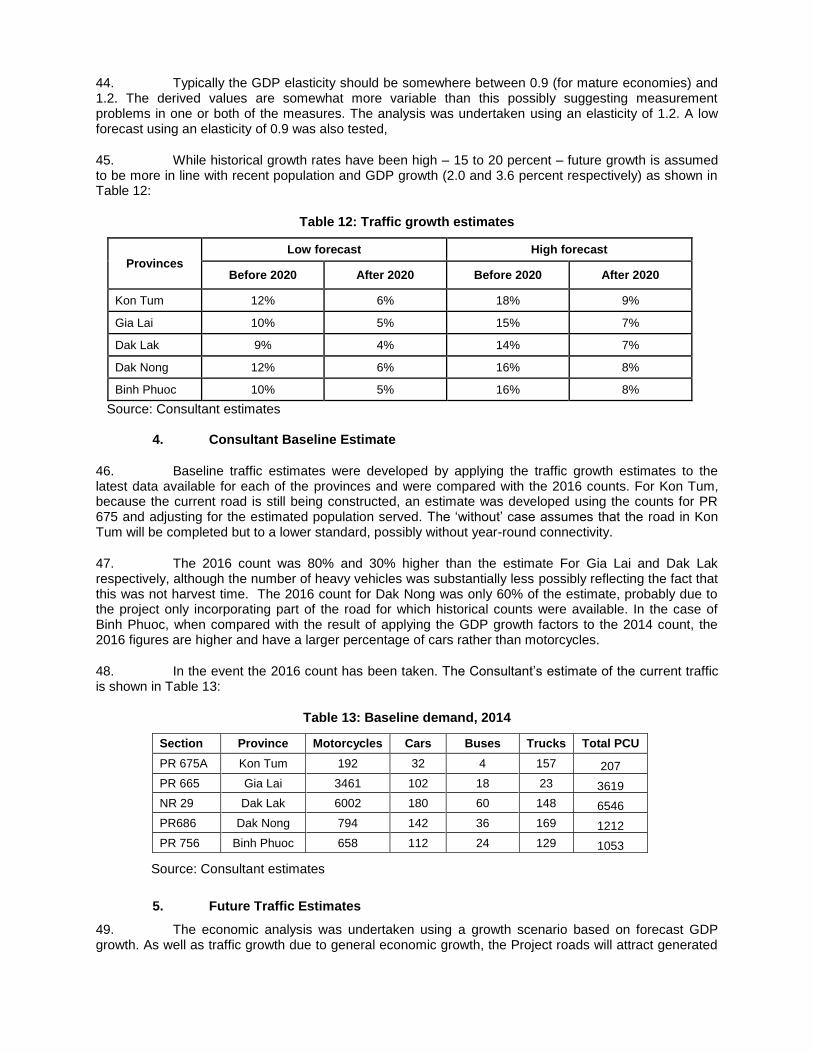
44. Typically the GDP elasticity should be somewhere between 0.9 (for mature economies) and 1.2. The derived values are somewhat more variable than this possibly suggesting measurement problems in one or both of the measures. The analysis was undertaken using an elasticity of 1.2. A low forecast using an elasticity of 0.9 was also tested,
45. While historical growth rates have been high – 15 to 20 percent – future growth is assumed to be more in line with recent population and GDP growth (2.0 and 3.6 percent respectively) as shown in Table 12:
Table 12: Traffic growth estimates
Provinces
Low forecast High forecast
Before 2020 After 2020 Before 2020 After 2020
Kon Tum 12% 6% 18% 9%
Gia Lai 10% 5% 15% 7%
Dak Lak 9% 4% 14% 7%
Dak Nong 12% 6% 16% 8%
Binh Phuoc 10% 5% 16% 8%
Source: Consultant estimates
4. Consultant Baseline Estimate
46. Baseline traffic estimates were developed by applying the traffic growth estimates to the latest data available for each of the provinces and were compared with the 2016 counts. For Kon Tum, because the current road is still being constructed, an estimate was developed using the counts for PR 675 and adjusting for the estimated population served. The ‘without’ case assumes that the road in Kon Tum will be completed but to a lower standard, possibly without year-round connectivity.
47. The 2016 count was 80% and 30% higher than the estimate For Gia Lai and Dak Lak respectively, although the number of heavy vehicles was substantially less possibly reflecting the fact that this was not harvest time. The 2016 count for Dak Nong was only 60% of the estimate, probably due to the project only incorporating part of the road for which historical counts were available. In the case of Binh Phuoc, when compared with the result of applying the GDP growth factors to the 2014 count, the 2016 figures are higher and have a larger percentage of cars rather than motorcycles.
48. In the event the 2016 count has been taken. The Consultant’s estimate of the current traffic is shown in Table 13:
Table 13: Baseline demand, 2014
Section Province Motorcycles Cars Buses Trucks Total PCU
PR 675A Kon Tum 192 32 4 157 207
PR 665 Gia Lai 3461 102 18 23 3619
NR 29 Dak Lak 6002 180 60 148 6546
PR686 Dak Nong 794 142 36 169 1212
PR 756 Binh Phuoc 658 112 24 129 1053
Source: Consultant estimates
5. Future Traffic Estimates
49. The economic analysis was undertaken using a growth scenario based on forecast GDP growth. As well as traffic growth due to general economic growth, the Project roads will attract generated
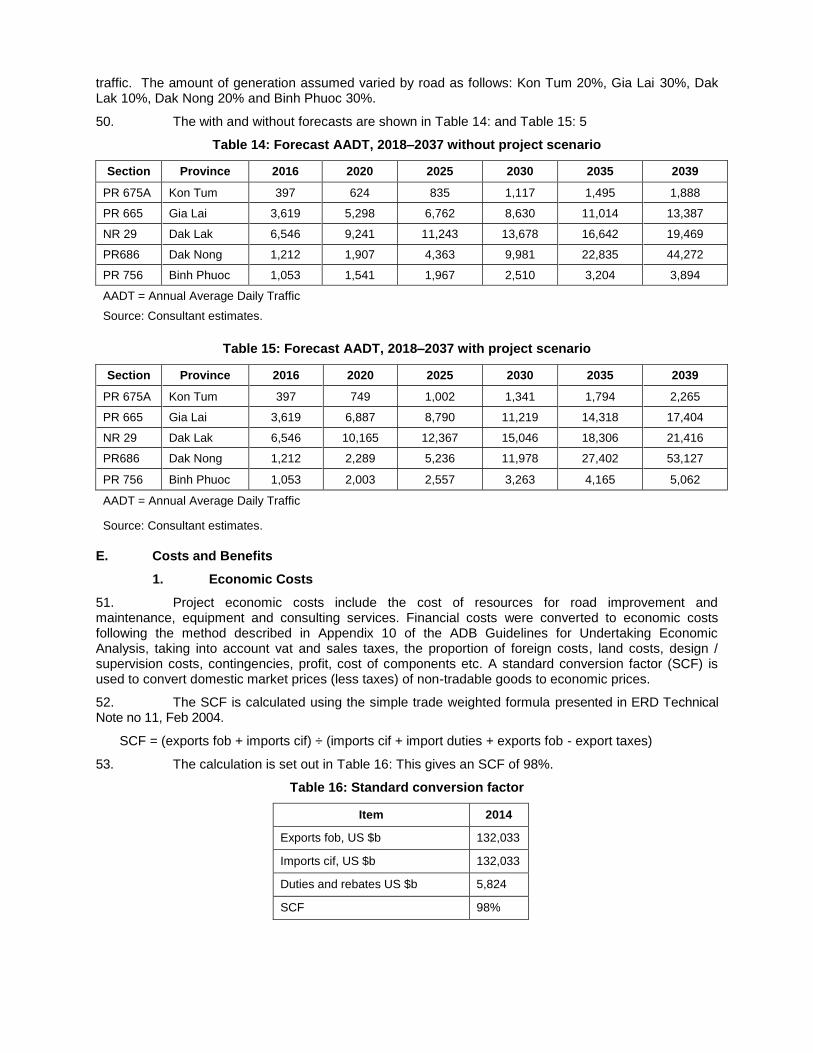
traffic. The amount of generation assumed varied by road as follows: Kon Tum 20%, Gia Lai 30%, Dak Lak 10%, Dak Nong 20% and Binh Phuoc 30%.
50. The with and without forecasts are shown in Table 14: and Table 15: 5
Table 14: Forecast AADT, 2018–2037 without project scenario
Section Province 2016 2020 2025 2030 2035 2039
PR 675A Kon Tum 397 624 835 1,117 1,495 1,888
PR 665 Gia Lai 3,619 5,298 6,762 8,630 11,014 13,387
NR 29 Dak Lak 6,546 9,241 11,243 13,678 16,642 19,469
PR686 Dak Nong 1,212 1,907 4,363 9,981 22,835 44,272
PR 756 Binh Phuoc 1,053 1,541 1,967 2,510 3,204 3,894
AADT = Annual Average Daily Traffic
Source: Consultant estimates.
Table 15: Forecast AADT, 2018–2037 with project scenario
Section Province 2016 2020 2025 2030 2035 2039
PR 675A Kon Tum 397 749 1,002 1,341 1,794 2,265
PR 665 Gia Lai 3,619 6,887 8,790 11,219 14,318 17,404
NR 29 Dak Lak 6,546 10,165 12,367 15,046 18,306 21,416
PR686 Dak Nong 1,212 2,289 5,236 11,978 27,402 53,127
PR 756 Binh Phuoc 1,053 2,003 2,557 3,263 4,165 5,062
AADT = Annual Average Daily Traffic
Source: Consultant estimates.
E. Costs and Benefits
1. Economic Costs
51. Project economic costs include the cost of resources for road improvement and maintenance, equipment and consulting services. Financial costs were converted to economic costs following the method described in Appendix 10 of the ADB Guidelines for Undertaking Economic Analysis, taking into account vat and sales taxes, the proportion of foreign costs, land costs, design / supervision costs, contingencies, profit, cost of components etc. A standard conversion factor (SCF) is used to convert domestic market prices (less taxes) of non-tradable goods to economic prices.
52. The SCF is calculated using the simple trade weighted formula presented in ERD Technical Note no 11, Feb 2004.
SCF = (exports fob + imports cif) ÷ (imports cif + import duties + exports fob - export taxes)
53. The calculation is set out in Table 16: This gives an SCF of 98%.
Table 16: Standard conversion factor
Item 2014
Exports fob, US $b 132,033
Imports cif, US $b 132,033
Duties and rebates US $b 5,824
SCF 98%
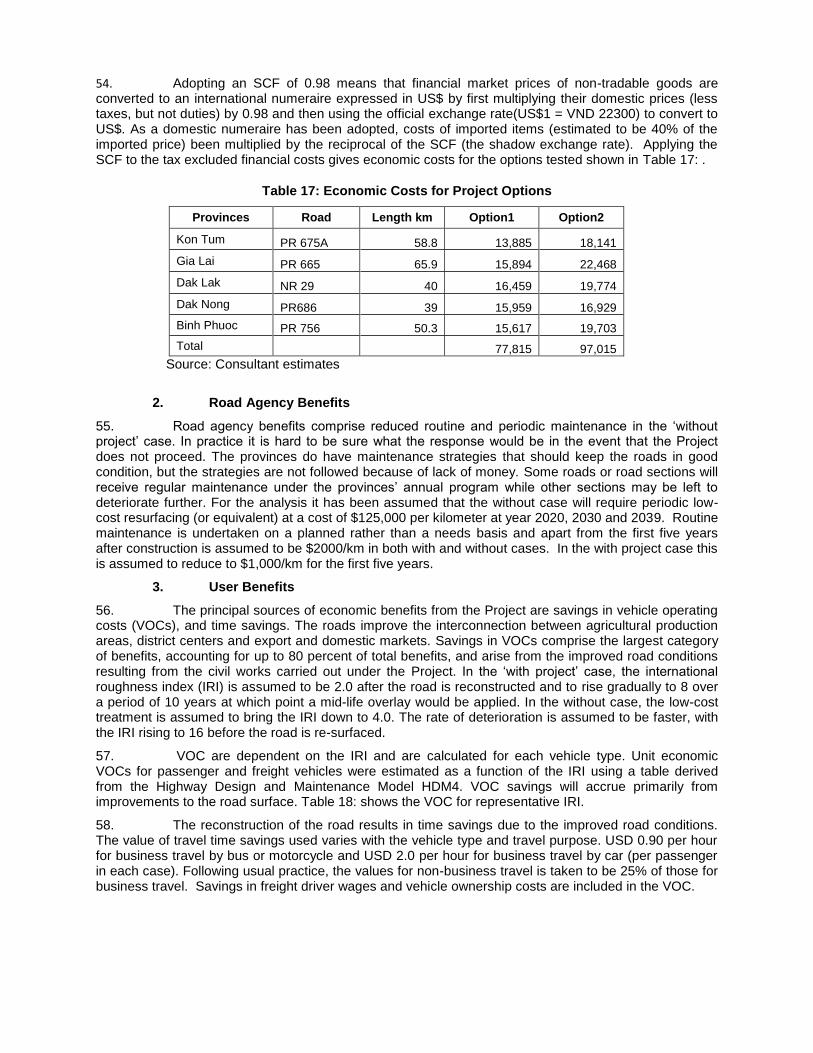
54. Adopting an SCF of 0.98 means that financial market prices of non-tradable goods are converted to an international numeraire expressed in US$ by first multiplying their domestic prices (less taxes, but not duties) by 0.98 and then using the official exchange rate(US$1 = VND 22300) to convert to US$. As a domestic numeraire has been adopted, costs of imported items (estimated to be 40% of the imported price) been multiplied by the reciprocal of the SCF (the shadow exchange rate). Applying the SCF to the tax excluded financial costs gives economic costs for the options tested shown in Table 17: .
Table 17: Economic Costs for Project Options
Provinces Road Length km Option1 Option2
Kon Tum PR 675A 58.8 13,885 18,141
Gia Lai PR 665 65.9 15,894 22,468
Dak Lak NR 29 40 16,459 19,774
Dak Nong PR686 39 15,959 16,929
Binh Phuoc PR 756 50.3 15,617 19,703
Total
77,815 97,015
Source: Consultant estimates
2. Road Agency Benefits
55. Road agency benefits comprise reduced routine and periodic maintenance in the ‘without project’ case. In practice it is hard to be sure what the response would be in the event that the Project does not proceed. The provinces do have maintenance strategies that should keep the roads in good condition, but the strategies are not followed because of lack of money. Some roads or road sections will receive regular maintenance under the provinces’ annual program while other sections may be left to deteriorate further. For the analysis it has been assumed that the without case will require periodic low-cost resurfacing (or equivalent) at a cost of $125,000 per kilometer at year 2020, 2030 and 2039. Routine maintenance is undertaken on a planned rather than a needs basis and apart from the first five years after construction is assumed to be $2000/km in both with and without cases. In the with project case this is assumed to reduce to $1,000/km for the first five years.
3. User Benefits
56. The principal sources of economic benefits from the Project are savings in vehicle operating costs (VOCs), and time savings. The roads improve the interconnection between agricultural production areas, district centers and export and domestic markets. Savings in VOCs comprise the largest category of benefits, accounting for up to 80 percent of total benefits, and arise from the improved road conditions resulting from the civil works carried out under the Project. In the ‘with project’ case, the international roughness index (IRI) is assumed to be 2.0 after the road is reconstructed and to rise gradually to 8 over a period of 10 years at which point a mid-life overlay would be applied. In the without case, the low-cost treatment is assumed to bring the IRI down to 4.0. The rate of deterioration is assumed to be faster, with the IRI rising to 16 before the road is re-surfaced.
57. VOC are dependent on the IRI and are calculated for each vehicle type. Unit economic VOCs for passenger and freight vehicles were estimated as a function of the IRI using a table derived from the Highway Design and Maintenance Model HDM4. VOC savings will accrue primarily from improvements to the road surface. Table 18: shows the VOC for representative IRI.
58. The reconstruction of the road results in time savings due to the improved road conditions. The value of travel time savings used varies with the vehicle type and travel purpose. USD 0.90 per hour for business travel by bus or motorcycle and USD 2.0 per hour for business travel by car (per passenger in each case). Following usual practice, the values for non-business travel is taken to be 25% of those for business travel. Savings in freight driver wages and vehicle ownership costs are included in the VOC.
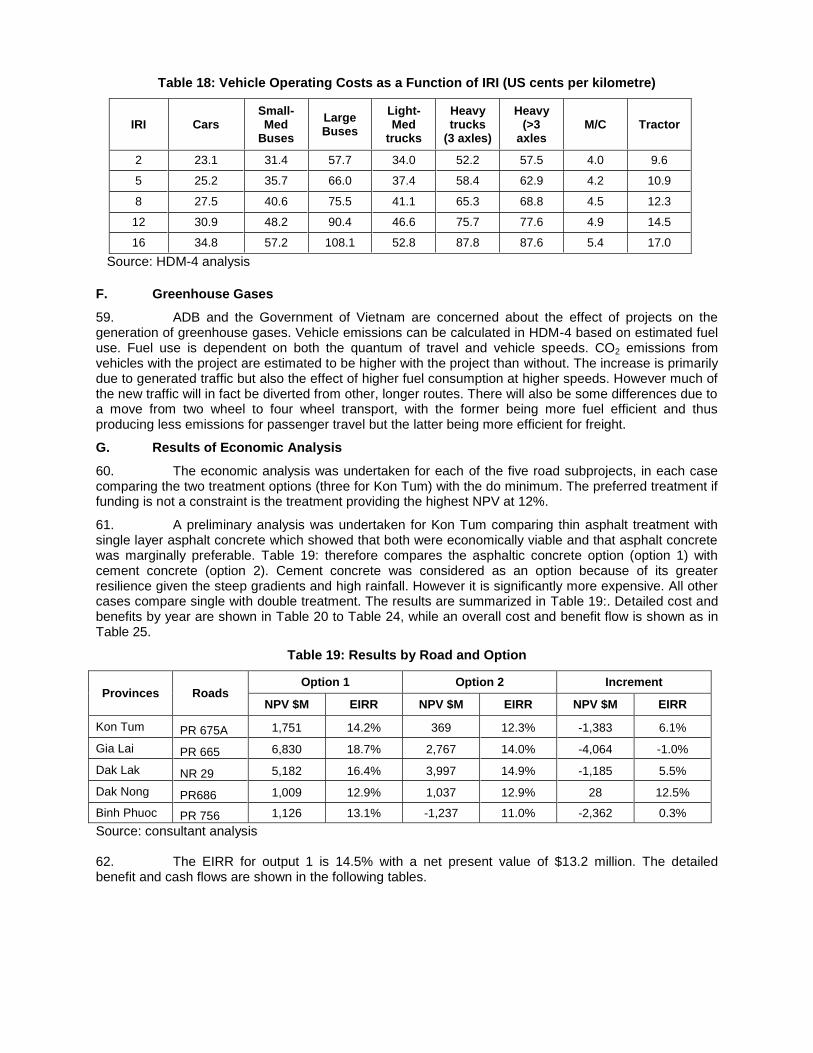
Table 18: Vehicle Operating Costs as a Function of IRI (US cents per kilometre)
IRI Cars Small-Med
Buses
Large Buses
Light-Med
trucks
Heavy trucks
(3 axles)
Heavy (>3
axles M/C Tractor
2 23.1 31.4 57.7 34.0 52.2 57.5 4.0 9.6
5 25.2 35.7 66.0 37.4 58.4 62.9 4.2 10.9
8 27.5 40.6 75.5 41.1 65.3 68.8 4.5 12.3
12 30.9 48.2 90.4 46.6 75.7 77.6 4.9 14.5
16 34.8 57.2 108.1 52.8 87.8 87.6 5.4 17.0
Source: HDM-4 analysis
F. Greenhouse Gases
59. ADB and the Government of Vietnam are concerned about the effect of projects on the generation of greenhouse gases. Vehicle emissions can be calculated in HDM-4 based on estimated fuel use. Fuel use is dependent on both the quantum of travel and vehicle speeds. CO2 emissions from vehicles with the project are estimated to be higher with the project than without. The increase is primarily due to generated traffic but also the effect of higher fuel consumption at higher speeds. However much of the new traffic will in fact be diverted from other, longer routes. There will also be some differences due to a move from two wheel to four wheel transport, with the former being more fuel efficient and thus producing less emissions for passenger travel but the latter being more efficient for freight.
G. Results of Economic Analysis
60. The economic analysis was undertaken for each of the five road subprojects, in each case comparing the two treatment options (three for Kon Tum) with the do minimum. The preferred treatment if funding is not a constraint is the treatment providing the highest NPV at 12%.
61. A preliminary analysis was undertaken for Kon Tum comparing thin asphalt treatment with single layer asphalt concrete which showed that both were economically viable and that asphalt concrete was marginally preferable. Table 19: therefore compares the asphaltic concrete option (option 1) with cement concrete (option 2). Cement concrete was considered as an option because of its greater resilience given the steep gradients and high rainfall. However it is significantly more expensive. All other cases compare single with double treatment. The results are summarized in Table 19:. Detailed cost and benefits by year are shown in Table 20 to Table 24, while an overall cost and benefit flow is shown as in Table 25.
Table 19: Results by Road and Option
Provinces Roads Option 1 Option 2 Increment
NPV $M EIRR NPV $M EIRR NPV $M EIRR
Kon Tum PR 675A 1,751 14.2% 369 12.3% -1,383 6.1%
Gia Lai PR 665 6,830 18.7% 2,767 14.0% -4,064 -1.0%
Dak Lak NR 29 5,182 16.4% 3,997 14.9% -1,185 5.5%
Dak Nong PR686 1,009 12.9% 1,037 12.9% 28 12.5%
Binh Phuoc PR 756 1,126 13.1% -1,237 11.0% -2,362 0.3%
Source: consultant analysis 62. The EIRR for output 1 is 14.5% with a net present value of $13.2 million. The detailed benefit and cash flows are shown in the following tables.
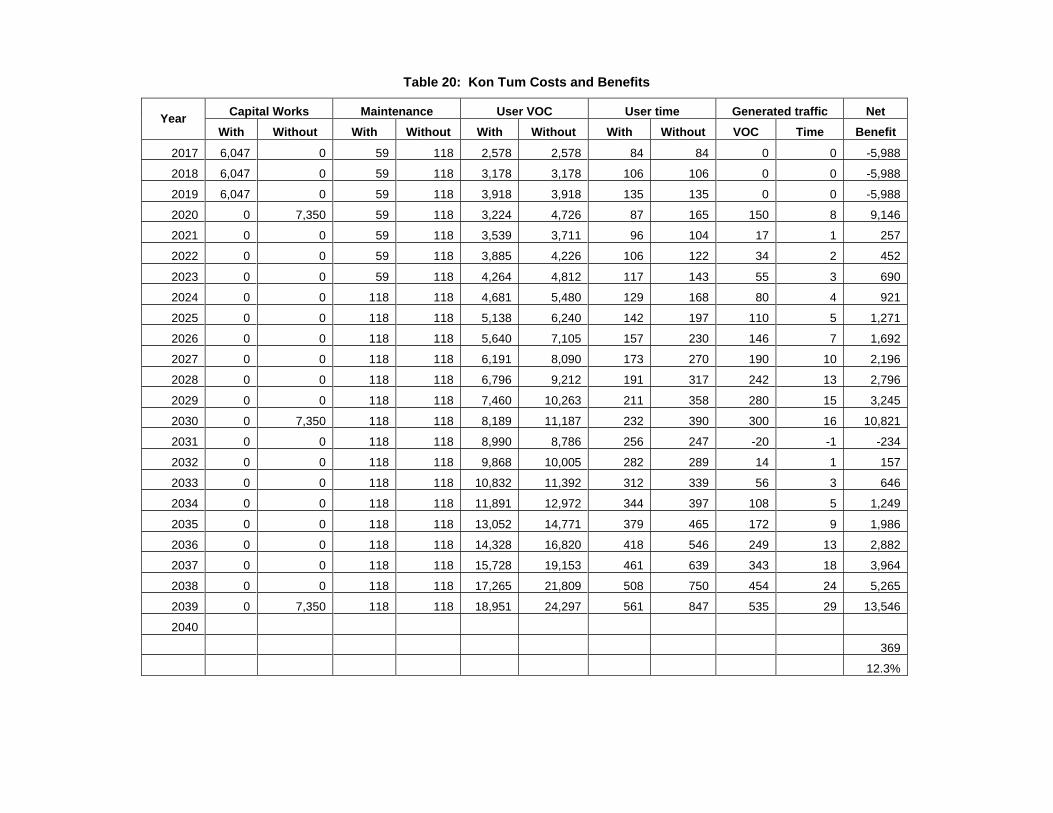
Table 20: Kon Tum Costs and Benefits
Year Capital Works Maintenance User VOC User time Generated traffic Net
With Without With Without With Without With Without VOC Time Benefit
2017 6,047 0 59 118 2,578 2,578 84 84 0 0 -5,988
2018 6,047 0 59 118 3,178 3,178 106 106 0 0 -5,988
2019 6,047 0 59 118 3,918 3,918 135 135 0 0 -5,988
2020 0 7,350 59 118 3,224 4,726 87 165 150 8 9,146
2021 0 0 59 118 3,539 3,711 96 104 17 1 257
2022 0 0 59 118 3,885 4,226 106 122 34 2 452
2023 0 0 59 118 4,264 4,812 117 143 55 3 690
2024 0 0 118 118 4,681 5,480 129 168 80 4 921
2025 0 0 118 118 5,138 6,240 142 197 110 5 1,271
2026 0 0 118 118 5,640 7,105 157 230 146 7 1,692
2027 0 0 118 118 6,191 8,090 173 270 190 10 2,196
2028 0 0 118 118 6,796 9,212 191 317 242 13 2,796
2029 0 0 118 118 7,460 10,263 211 358 280 15 3,245
2030 0 7,350 118 118 8,189 11,187 232 390 300 16 10,821
2031 0 0 118 118 8,990 8,786 256 247 -20 -1 -234
2032 0 0 118 118 9,868 10,005 282 289 14 1 157
2033 0 0 118 118 10,832 11,392 312 339 56 3 646
2034 0 0 118 118 11,891 12,972 344 397 108 5 1,249
2035 0 0 118 118 13,052 14,771 379 465 172 9 1,986
2036 0 0 118 118 14,328 16,820 418 546 249 13 2,882
2037 0 0 118 118 15,728 19,153 461 639 343 18 3,964
2038 0 0 118 118 17,265 21,809 508 750 454 24 5,265
2039 0 7,350 118 118 18,951 24,297 561 847 535 29 13,546
2040
369
12.3%
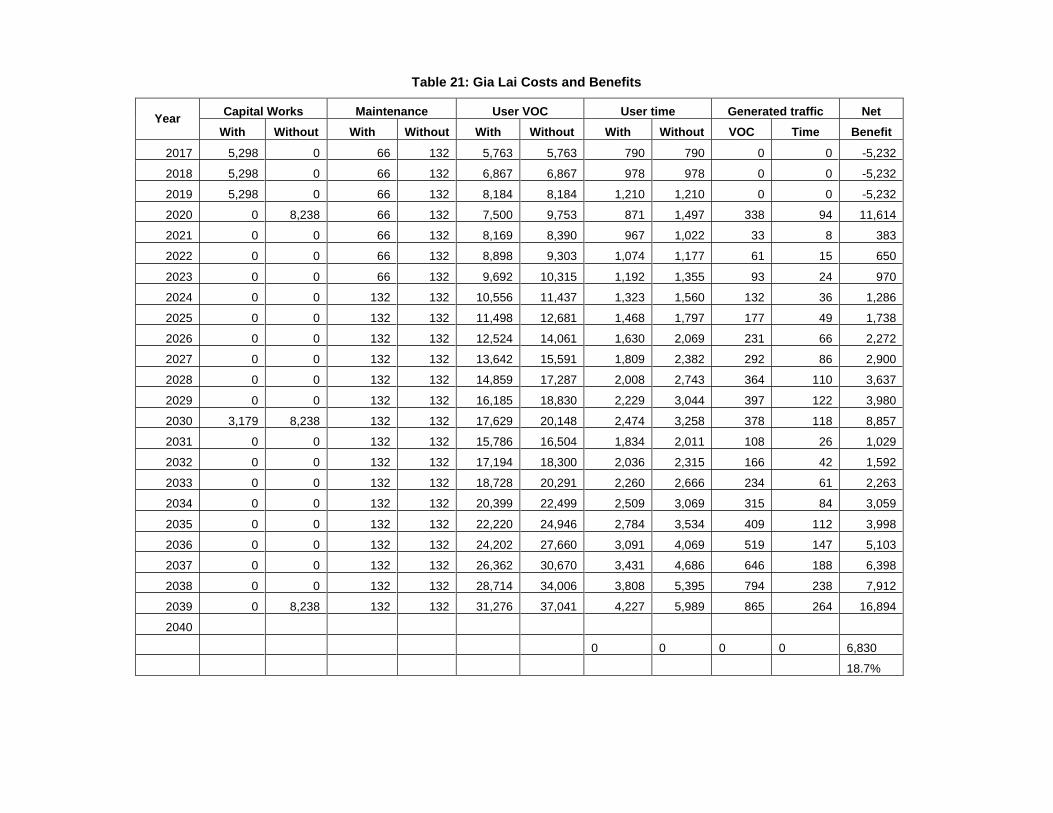
Table 21: Gia Lai Costs and Benefits
Year Capital Works Maintenance User VOC User time Generated traffic Net
With Without With Without With Without With Without VOC Time Benefit
2017 5,298 0 66 132 5,763 5,763 790 790 0 0 -5,232
2018 5,298 0 66 132 6,867 6,867 978 978 0 0 -5,232
2019 5,298 0 66 132 8,184 8,184 1,210 1,210 0 0 -5,232
2020 0 8,238 66 132 7,500 9,753 871 1,497 338 94 11,614
2021 0 0 66 132 8,169 8,390 967 1,022 33 8 383
2022 0 0 66 132 8,898 9,303 1,074 1,177 61 15 650
2023 0 0 66 132 9,692 10,315 1,192 1,355 93 24 970
2024 0 0 132 132 10,556 11,437 1,323 1,560 132 36 1,286
2025 0 0 132 132 11,498 12,681 1,468 1,797 177 49 1,738
2026 0 0 132 132 12,524 14,061 1,630 2,069 231 66 2,272
2027 0 0 132 132 13,642 15,591 1,809 2,382 292 86 2,900
2028 0 0 132 132 14,859 17,287 2,008 2,743 364 110 3,637
2029 0 0 132 132 16,185 18,830 2,229 3,044 397 122 3,980
2030 3,179 8,238 132 132 17,629 20,148 2,474 3,258 378 118 8,857
2031 0 0 132 132 15,786 16,504 1,834 2,011 108 26 1,029
2032 0 0 132 132 17,194 18,300 2,036 2,315 166 42 1,592
2033 0 0 132 132 18,728 20,291 2,260 2,666 234 61 2,263
2034 0 0 132 132 20,399 22,499 2,509 3,069 315 84 3,059
2035 0 0 132 132 22,220 24,946 2,784 3,534 409 112 3,998
2036 0 0 132 132 24,202 27,660 3,091 4,069 519 147 5,103
2037 0 0 132 132 26,362 30,670 3,431 4,686 646 188 6,398
2038 0 0 132 132 28,714 34,006 3,808 5,395 794 238 7,912
2039 0 8,238 132 132 31,276 37,041 4,227 5,989 865 264 16,894
2040
0 0 0 0 6,830
18.7%
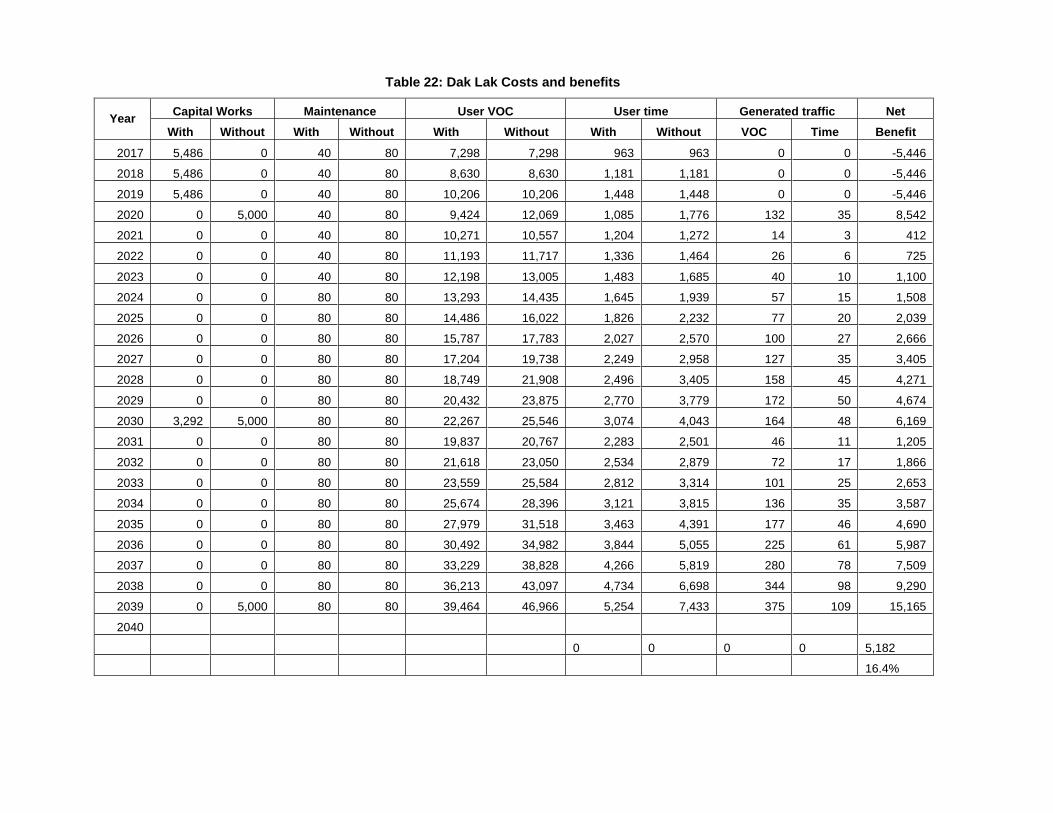
Table 22: Dak Lak Costs and benefits
Year Capital Works Maintenance User VOC User time Generated traffic Net
With Without With Without With Without With Without VOC Time Benefit
2017 5,486 0 40 80 7,298 7,298 963 963 0 0 -5,446
2018 5,486 0 40 80 8,630 8,630 1,181 1,181 0 0 -5,446
2019 5,486 0 40 80 10,206 10,206 1,448 1,448 0 0 -5,446
2020 0 5,000 40 80 9,424 12,069 1,085 1,776 132 35 8,542
2021 0 0 40 80 10,271 10,557 1,204 1,272 14 3 412
2022 0 0 40 80 11,193 11,717 1,336 1,464 26 6 725
2023 0 0 40 80 12,198 13,005 1,483 1,685 40 10 1,100
2024 0 0 80 80 13,293 14,435 1,645 1,939 57 15 1,508
2025 0 0 80 80 14,486 16,022 1,826 2,232 77 20 2,039
2026 0 0 80 80 15,787 17,783 2,027 2,570 100 27 2,666
2027 0 0 80 80 17,204 19,738 2,249 2,958 127 35 3,405
2028 0 0 80 80 18,749 21,908 2,496 3,405 158 45 4,271
2029 0 0 80 80 20,432 23,875 2,770 3,779 172 50 4,674
2030 3,292 5,000 80 80 22,267 25,546 3,074 4,043 164 48 6,169
2031 0 0 80 80 19,837 20,767 2,283 2,501 46 11 1,205
2032 0 0 80 80 21,618 23,050 2,534 2,879 72 17 1,866
2033 0 0 80 80 23,559 25,584 2,812 3,314 101 25 2,653
2034 0 0 80 80 25,674 28,396 3,121 3,815 136 35 3,587
2035 0 0 80 80 27,979 31,518 3,463 4,391 177 46 4,690
2036 0 0 80 80 30,492 34,982 3,844 5,055 225 61 5,987
2037 0 0 80 80 33,229 38,828 4,266 5,819 280 78 7,509
2038 0 0 80 80 36,213 43,097 4,734 6,698 344 98 9,290
2039 0 5,000 80 80 39,464 46,966 5,254 7,433 375 109 15,165
2040
0 0 0 0 5,182
16.4%
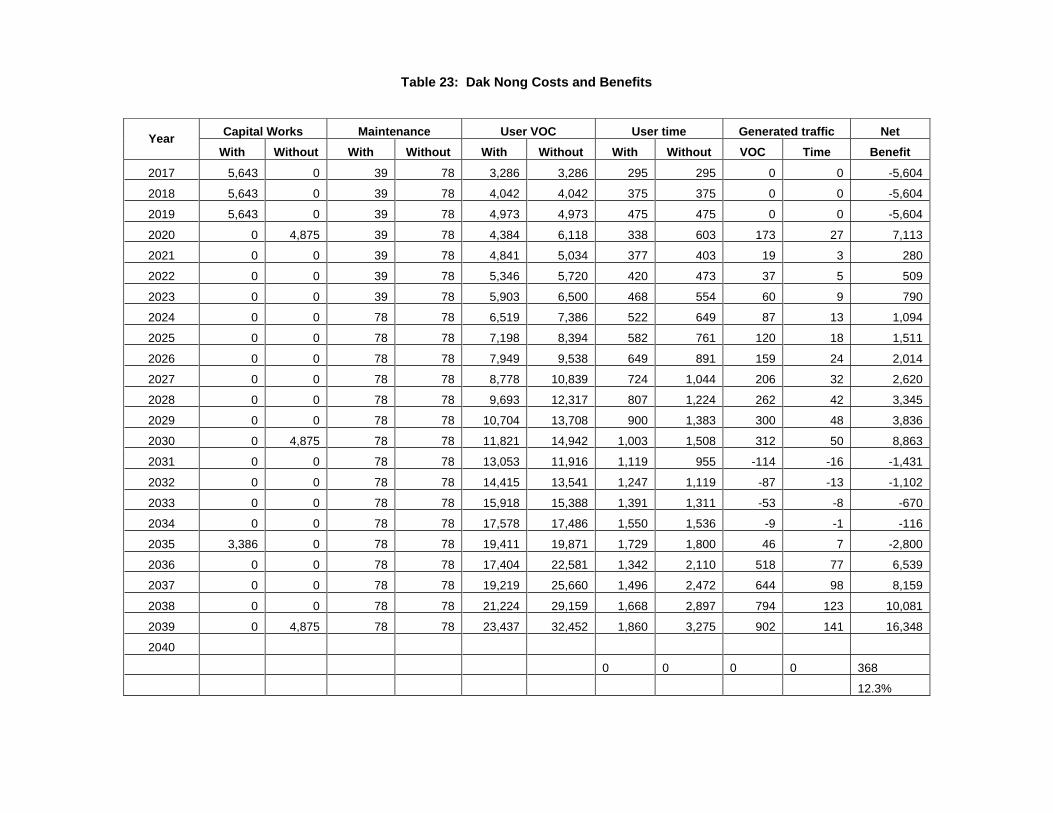
Table 23: Dak Nong Costs and Benefits
Year Capital Works Maintenance User VOC User time Generated traffic Net
With Without With Without With Without With Without VOC Time Benefit
2017 5,643 0 39 78 3,286 3,286 295 295 0 0 -5,604
2018 5,643 0 39 78 4,042 4,042 375 375 0 0 -5,604
2019 5,643 0 39 78 4,973 4,973 475 475 0 0 -5,604
2020 0 4,875 39 78 4,384 6,118 338 603 173 27 7,113
2021 0 0 39 78 4,841 5,034 377 403 19 3 280
2022 0 0 39 78 5,346 5,720 420 473 37 5 509
2023 0 0 39 78 5,903 6,500 468 554 60 9 790
2024 0 0 78 78 6,519 7,386 522 649 87 13 1,094
2025 0 0 78 78 7,198 8,394 582 761 120 18 1,511
2026 0 0 78 78 7,949 9,538 649 891 159 24 2,014
2027 0 0 78 78 8,778 10,839 724 1,044 206 32 2,620
2028 0 0 78 78 9,693 12,317 807 1,224 262 42 3,345
2029 0 0 78 78 10,704 13,708 900 1,383 300 48 3,836
2030 0 4,875 78 78 11,821 14,942 1,003 1,508 312 50 8,863
2031 0 0 78 78 13,053 11,916 1,119 955 -114 -16 -1,431
2032 0 0 78 78 14,415 13,541 1,247 1,119 -87 -13 -1,102
2033 0 0 78 78 15,918 15,388 1,391 1,311 -53 -8 -670
2034 0 0 78 78 17,578 17,486 1,550 1,536 -9 -1 -116
2035 3,386 0 78 78 19,411 19,871 1,729 1,800 46 7 -2,800
2036 0 0 78 78 17,404 22,581 1,342 2,110 518 77 6,539
2037 0 0 78 78 19,219 25,660 1,496 2,472 644 98 8,159
2038 0 0 78 78 21,224 29,159 1,668 2,897 794 123 10,081
2039 0 4,875 78 78 23,437 32,452 1,860 3,275 902 141 16,348
2040
0 0 0 0 368
12.3%
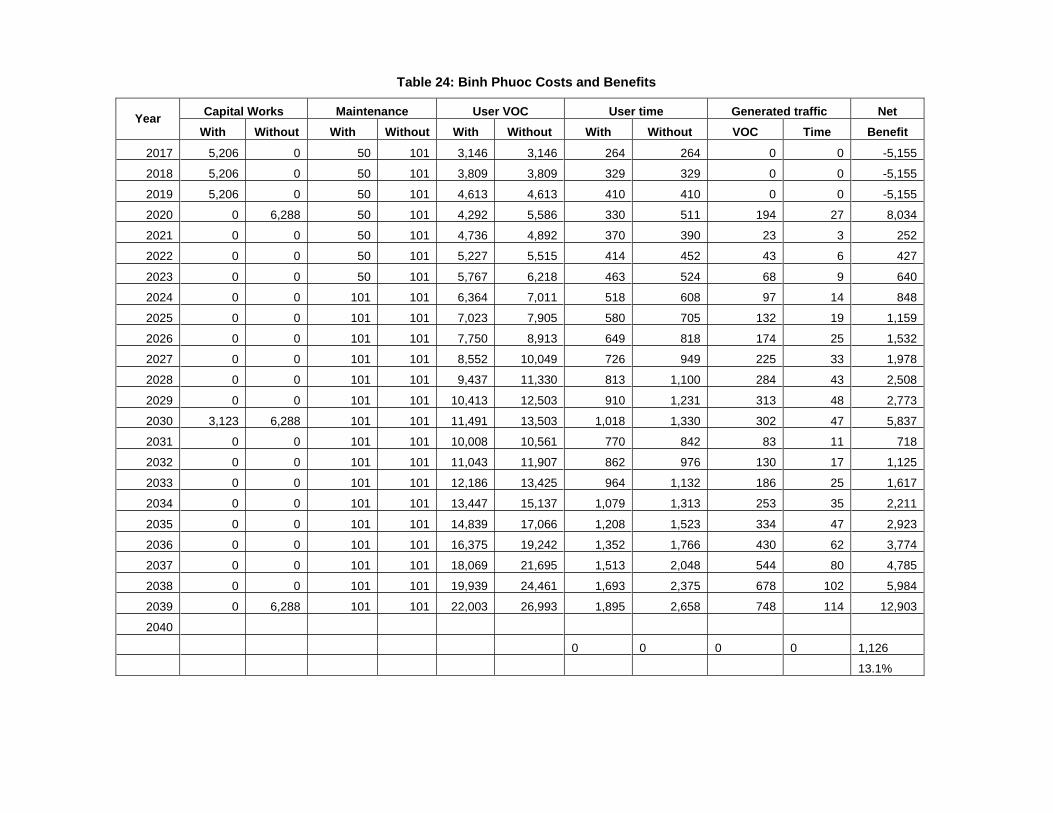
Table 24: Binh Phuoc Costs and Benefits
Year Capital Works Maintenance User VOC User time Generated traffic Net
With Without With Without With Without With Without VOC Time Benefit
2017 5,206 0 50 101 3,146 3,146 264 264 0 0 -5,155
2018 5,206 0 50 101 3,809 3,809 329 329 0 0 -5,155
2019 5,206 0 50 101 4,613 4,613 410 410 0 0 -5,155
2020 0 6,288 50 101 4,292 5,586 330 511 194 27 8,034
2021 0 0 50 101 4,736 4,892 370 390 23 3 252
2022 0 0 50 101 5,227 5,515 414 452 43 6 427
2023 0 0 50 101 5,767 6,218 463 524 68 9 640
2024 0 0 101 101 6,364 7,011 518 608 97 14 848
2025 0 0 101 101 7,023 7,905 580 705 132 19 1,159
2026 0 0 101 101 7,750 8,913 649 818 174 25 1,532
2027 0 0 101 101 8,552 10,049 726 949 225 33 1,978
2028 0 0 101 101 9,437 11,330 813 1,100 284 43 2,508
2029 0 0 101 101 10,413 12,503 910 1,231 313 48 2,773
2030 3,123 6,288 101 101 11,491 13,503 1,018 1,330 302 47 5,837
2031 0 0 101 101 10,008 10,561 770 842 83 11 718
2032 0 0 101 101 11,043 11,907 862 976 130 17 1,125
2033 0 0 101 101 12,186 13,425 964 1,132 186 25 1,617
2034 0 0 101 101 13,447 15,137 1,079 1,313 253 35 2,211
2035 0 0 101 101 14,839 17,066 1,208 1,523 334 47 2,923
2036 0 0 101 101 16,375 19,242 1,352 1,766 430 62 3,774
2037 0 0 101 101 18,069 21,695 1,513 2,048 544 80 4,785
2038 0 0 101 101 19,939 24,461 1,693 2,375 678 102 5,984
2039 0 6,288 101 101 22,003 26,993 1,895 2,658 748 114 12,903
2040
0 0 0 0 1,126
13.1%
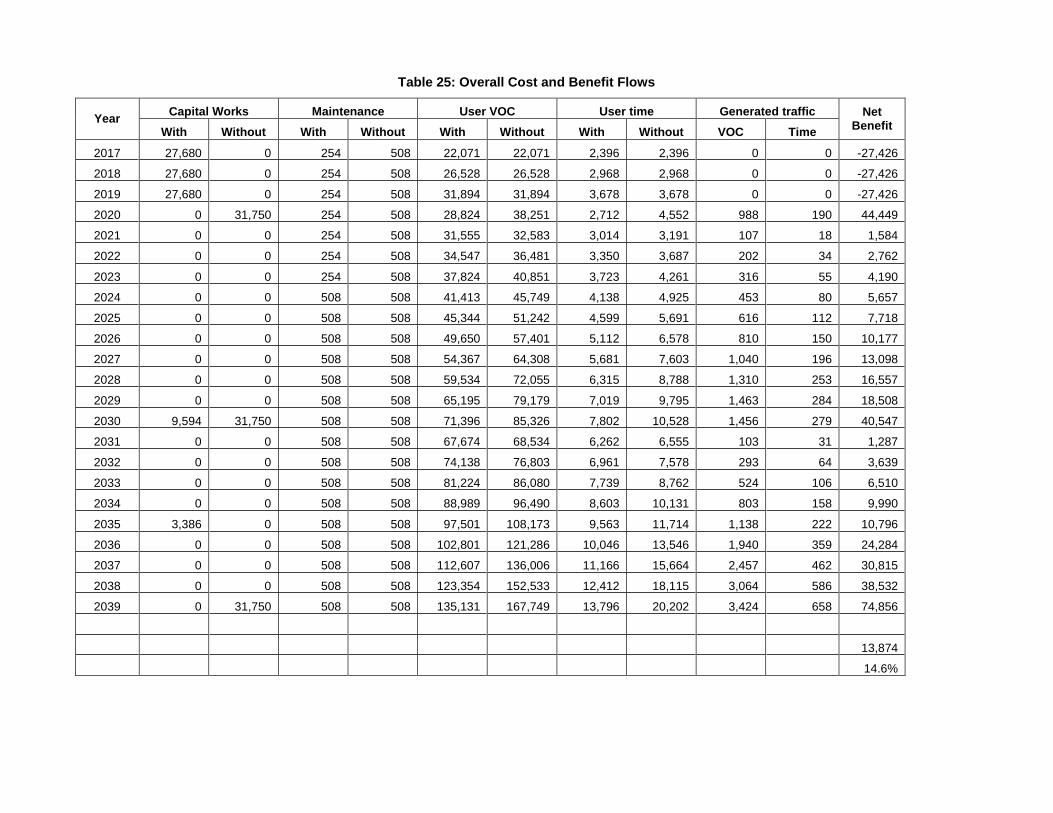
Table 25: Overall Cost and Benefit Flows
Year Capital Works Maintenance User VOC User time Generated traffic Net
Benefit With Without With Without With Without With Without VOC Time
2017 27,680 0 254 508 22,071 22,071 2,396 2,396 0 0 -27,426
2018 27,680 0 254 508 26,528 26,528 2,968 2,968 0 0 -27,426
2019 27,680 0 254 508 31,894 31,894 3,678 3,678 0 0 -27,426
2020 0 31,750 254 508 28,824 38,251 2,712 4,552 988 190 44,449
2021 0 0 254 508 31,555 32,583 3,014 3,191 107 18 1,584
2022 0 0 254 508 34,547 36,481 3,350 3,687 202 34 2,762
2023 0 0 254 508 37,824 40,851 3,723 4,261 316 55 4,190
2024 0 0 508 508 41,413 45,749 4,138 4,925 453 80 5,657
2025 0 0 508 508 45,344 51,242 4,599 5,691 616 112 7,718
2026 0 0 508 508 49,650 57,401 5,112 6,578 810 150 10,177
2027 0 0 508 508 54,367 64,308 5,681 7,603 1,040 196 13,098
2028 0 0 508 508 59,534 72,055 6,315 8,788 1,310 253 16,557
2029 0 0 508 508 65,195 79,179 7,019 9,795 1,463 284 18,508
2030 9,594 31,750 508 508 71,396 85,326 7,802 10,528 1,456 279 40,547
2031 0 0 508 508 67,674 68,534 6,262 6,555 103 31 1,287
2032 0 0 508 508 74,138 76,803 6,961 7,578 293 64 3,639
2033 0 0 508 508 81,224 86,080 7,739 8,762 524 106 6,510
2034 0 0 508 508 88,989 96,490 8,603 10,131 803 158 9,990
2035 3,386 0 508 508 97,501 108,173 9,563 11,714 1,138 222 10,796
2036 0 0 508 508 102,801 121,286 10,046 13,546 1,940 359 24,284
2037 0 0 508 508 112,607 136,006 11,166 15,664 2,457 462 30,815
2038 0 0 508 508 123,354 152,533 12,412 18,115 3,064 586 38,532
2039 0 31,750 508 508 135,131 167,749 13,796 20,202 3,424 658 74,856
13,874
14.6%
63. All the sub-projects have EIRR exceeding 12%. In the case of Kon Tum and Dak Nong, Option 2 has a higher NPV than Option 1, hence for these roads, the higher cost treatment is preferred.
1. Distribution Analysis
64. No formal distribution analysis has been attempted as it is difficult to predict where in the value chain the benefits from reduced costs will be captured. However the reduction in transport costs will be most significant for cassava growers because of its lower value per ton – this is the crop grown most by ethnic minority and poor farmers because it requires low initial investment. It will reduce costs for casual farm workers, who tend to be the poorest paid. It will have social benefits by improving access to schools, health facilities, etc.
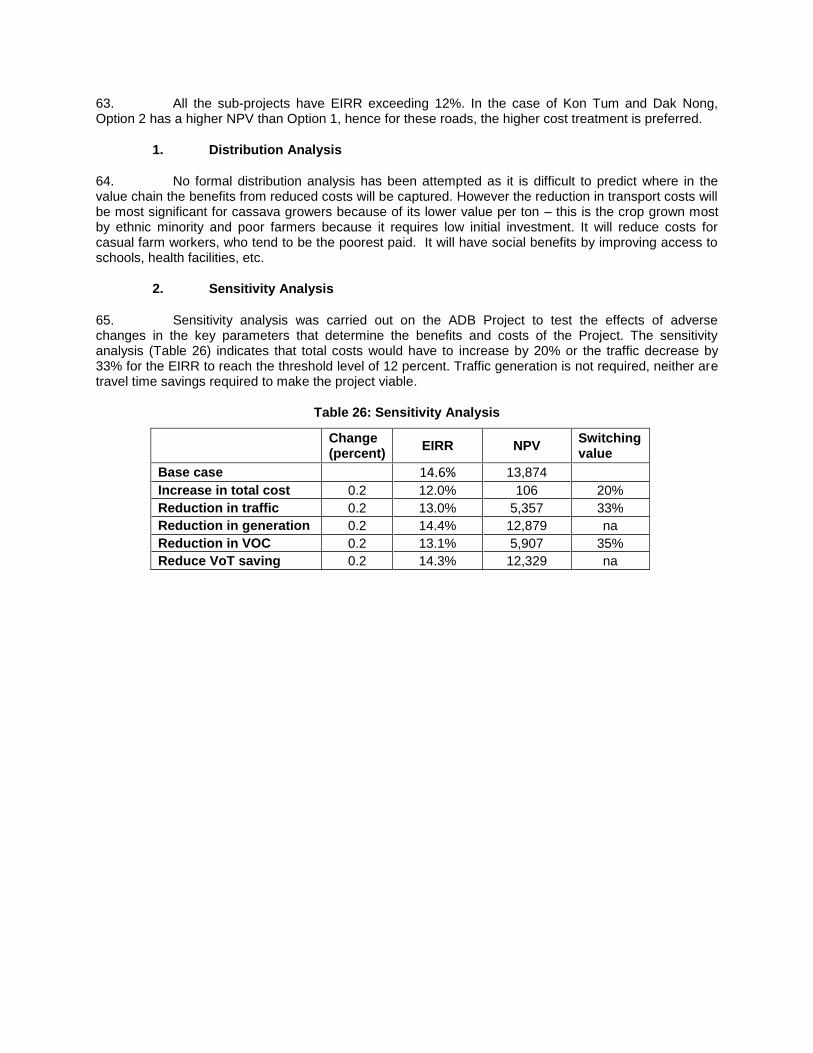
2. Sensitivity Analysis
65. Sensitivity analysis was carried out on the ADB Project to test the effects of adverse changes in the key parameters that determine the benefits and costs of the Project. The sensitivity analysis (Table 26) indicates that total costs would have to increase by 20% or the traffic decrease by 33% for the EIRR to reach the threshold level of 12 percent. Traffic generation is not required, neither are travel time savings required to make the project viable.
Table 26: Sensitivity Analysis
Change (percent)
EIRR NPV Switching value
Base case 14.6% 13,874
Increase in total cost 0.2 12.0% 106 20%
Reduction in traffic 0.2 13.0% 5,357 33%
Reduction in generation 0.2 14.4% 12,879 na
Reduction in VOC 0.2 13.1% 5,907 35%
Reduce VoT saving 0.2 14.3% 12,329 na
II. ECONOMIC ASSESSMENT OF TOURISM SUBPROJECTS
A. Overview
Para no - The proposed investment within output 2 (6 percent of base cost) will be in seven community based subproject tourism sites in Dak Lak, Dak Nong, Binh Phuoc and Kon Tum Provinces.
2 For these
subprojects it is proposed that the Project shall invest into site based infrastructure for community based tourism, capacity building within communities, linking sites to wider market chains in tourism, and community development programs that support the use of locally derived goods including ethnic and local agricultural output, fresh produce for local food and beverage trades and local service providers.
B. Approach and Assumption
66. The subprojects (see Appendix Supplementary Document 21 Feasibility Assessment of Tourism Subprojects [SD20]) were assessed during the project preparation. Government standard feasibility studies will be completed during implementation of the project. For the economic assessment a priority community based tourism subproject for one village from Dak Lak province was used as a representative subproject. This subproject was assessed as being indicative of the range of subproject likely to be implemented, as confirmed in SD20.
67. The approach used is based on:
(i) current provincial visitor profiles projected through for 30 years at a conservative rate of growth (70% of the 2015 level) being 11% per annum for international arrivals and 14% per annum for national arrivals
(ii) current 2015 arrivals of 550,000 – 50,000 are international arrivals (9%) (iii) visits to the project sites “without project” are projected at the rate of 0.5% of provincial
international arrivals and 0.3% of provincial national arrivals and “with project” at 0.75% and 0.5% respectively.
(iv) Average daily spend for the site visits has been set at 30% of the 2015 average daily spend of $26 per day
(v) Incremental revenues from home stay revenues are based on 10 rooms per community, with occupancy split between wet season ( 5% in year 6 increasing to 10% in year 20) and the dry season (ranging from 30% in year 6 increasing to 50% in year 20).
(vi) An average room tariff of US $ 15 per night (vii) Shadow wage rate for unskilled labor – 0.70
68. Tourism benefits are adjusted to reflect the degree of leakage from the sector out of Viet Nam. Some industry studies report leakage levels of around 50% however given the dominance of the national arrivals leakage has been set to 25% of incremental revenues.
69. Further adjustment to the incremental revenue is based on the extent that new site visits substitute for other experiences. It is assumed that during the life of the project the extent of substitution is 25% of incremental revenues.
C. Visitor Projections
70. Without detailed demand estimates the projected site demand is based on conservative numbers of provincial visitors visiting the site based on current and projected visitor numbers differentiated by the international and national arrivals – Table 27. The value of site visitation is based on the 2015 average daily spend of $26 per day with 30% of this figure applied representing the likely amount of time (1/3 per day on average) at the site. The visitation value does not include the new homestays but will include cultural displays and food and beverage expenditures.
2
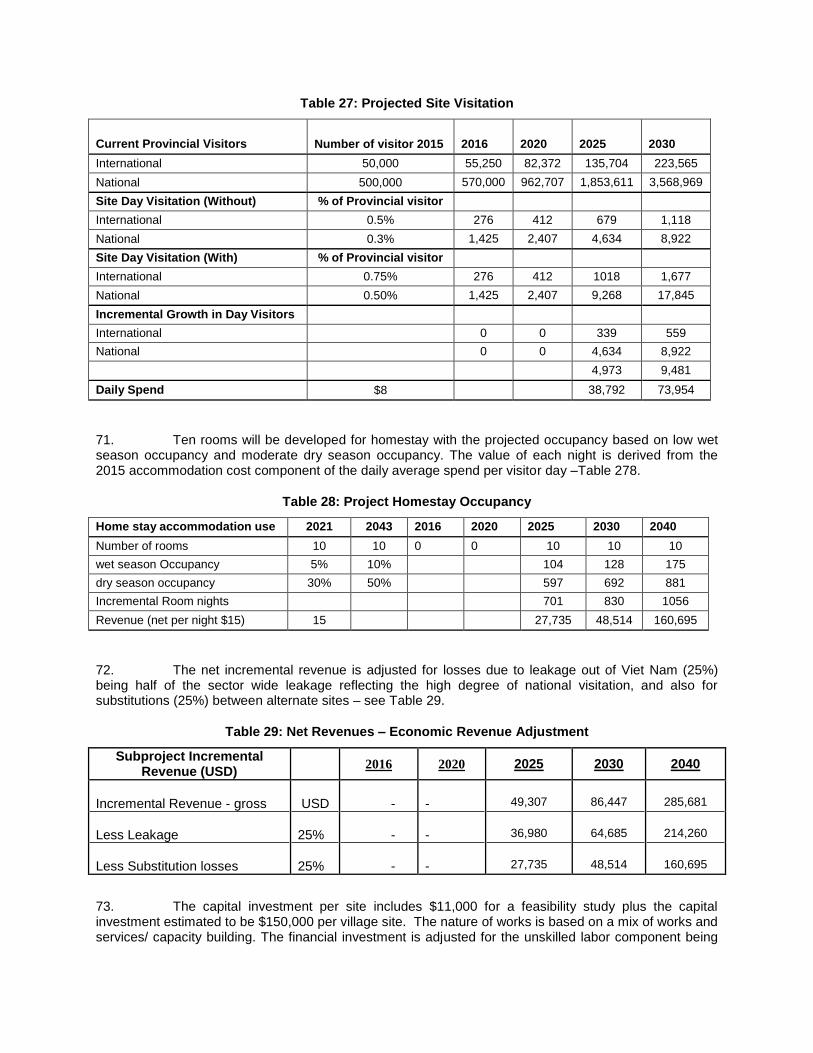
Table 27: Projected Site Visitation
Current Provincial Visitors Number of visitor 2015 2016 2020 2025 2030
International 50,000 55,250 82,372 135,704 223,565
National 500,000 570,000 962,707 1,853,611 3,568,969
Site Day Visitation (Without) % of Provincial visitor
International 0.5% 276 412 679 1,118
National 0.3% 1,425 2,407 4,634 8,922
Site Day Visitation (With) % of Provincial visitor
International 0.75% 276 412 1018 1,677
National 0.50% 1,425 2,407 9,268 17,845
Incremental Growth in Day Visitors
International
0 0 339 559
National
0 0 4,634 8,922
4,973 9,481
Daily Spend $8
38,792 73,954
71. Ten rooms will be developed for homestay with the projected occupancy based on low wet season occupancy and moderate dry season occupancy. The value of each night is derived from the 2015 accommodation cost component of the daily average spend per visitor day –Table 278.
Table 28: Project Homestay Occupancy
Home stay accommodation use 2021 2043 2016 2020 2025 2030 2040
Number of rooms 10 10 0 0 10 10 10
wet season Occupancy 5% 10% 104 128 175
dry season occupancy 30% 50% 597 692 881
Incremental Room nights
701 830 1056
Revenue (net per night $15) 15
27,735 48,514 160,695
72. The net incremental revenue is adjusted for losses due to leakage out of Viet Nam (25%) being half of the sector wide leakage reflecting the high degree of national visitation, and also for substitutions (25%) between alternate sites – see Table 29.
Table 29: Net Revenues – Economic Revenue Adjustment
Subproject Incremental Revenue (USD)
2016 2020 2025 2030 2040
Incremental Revenue - gross USD - - 49,307 86,447 285,681
Less Leakage 25% - - 36,980 64,685 214,260
Less Substitution losses 25% - - 27,735 48,514 160,695
73. The capital investment per site includes $11,000 for a feasibility study plus the capital investment estimated to be $150,000 per village site. The nature of works is based on a mix of works and services/ capacity building. The financial investment is adjusted for the unskilled labor component being
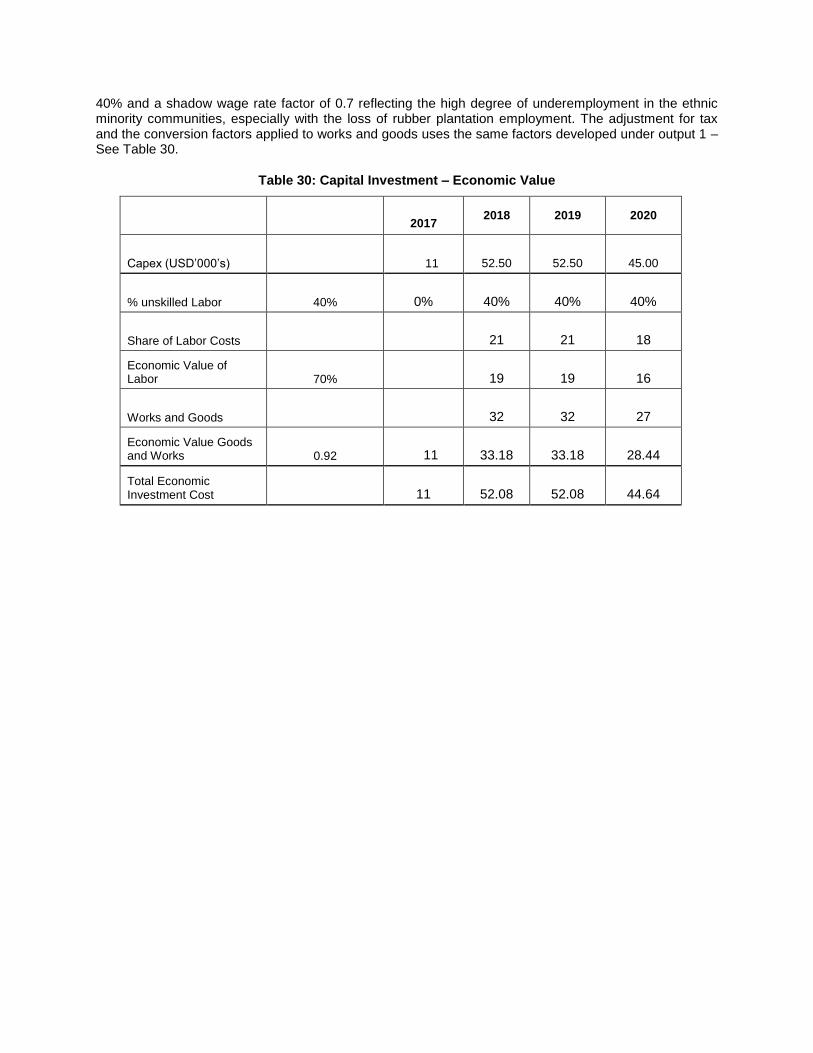
40% and a shadow wage rate factor of 0.7 reflecting the high degree of underemployment in the ethnic minority communities, especially with the loss of rubber plantation employment. The adjustment for tax and the conversion factors applied to works and goods uses the same factors developed under output 1 – See Table 30.
Table 30: Capital Investment – Economic Value
2017 2018 2019 2020
Capex (USD’000’s) 11
52.50
52.50
45.00
% unskilled Labor 40% 0% 40% 40% 40%
Share of Labor Costs
21
21
18
Economic Value of Labor 70%
19
19
16
Works and Goods
32
32
27
Economic Value Goods and Works 0.92 11
33.18
33.18
28.44
Total Economic Investment Cost 11
52.08
52.08
44.64
D. Economic Feasibility
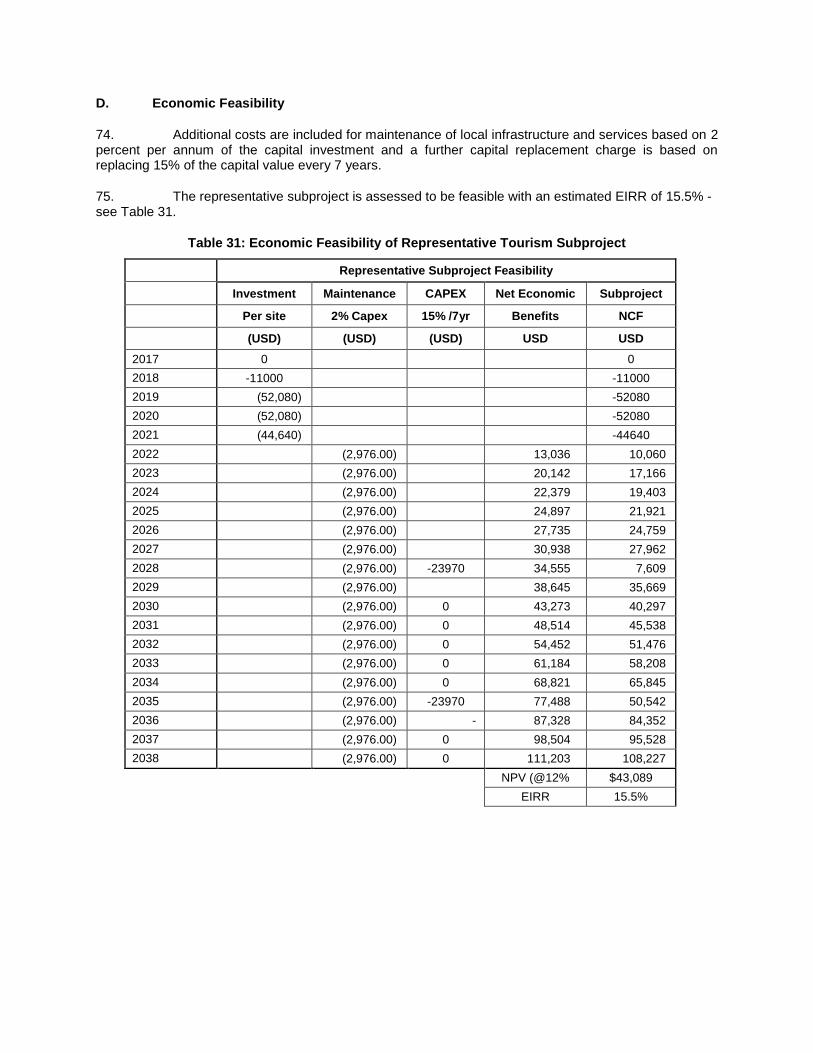
74. Additional costs are included for maintenance of local infrastructure and services based on 2 percent per annum of the capital investment and a further capital replacement charge is based on replacing 15% of the capital value every 7 years.
75. The representative subproject is assessed to be feasible with an estimated EIRR of 15.5% - see Table 31.
Table 31: Economic Feasibility of Representative Tourism Subproject
Representative Subproject Feasibility
Investment Maintenance CAPEX Net Economic Subproject
Per site 2% Capex 15% /7yr Benefits NCF
(USD) (USD) (USD) USD USD
2017 0 0
2018 -11000 -11000
2019 (52,080) -52080
2020 (52,080) -52080
2021 (44,640) -44640
2022 (2,976.00) 13,036 10,060
2023 (2,976.00) 20,142 17,166
2024 (2,976.00) 22,379 19,403
2025 (2,976.00) 24,897 21,921
2026 (2,976.00) 27,735 24,759
2027 (2,976.00) 30,938 27,962
2028 (2,976.00) -23970 34,555 7,609
2029 (2,976.00) 38,645 35,669
2030 (2,976.00) 0 43,273 40,297
2031 (2,976.00) 0 48,514 45,538
2032 (2,976.00) 0 54,452 51,476
2033 (2,976.00) 0 61,184 58,208
2034 (2,976.00) 0 68,821 65,845
2035 (2,976.00) -23970 77,488 50,542
2036 (2,976.00) - 87,328 84,352
2037 (2,976.00) 0 98,504 95,528
2038 (2,976.00) 0 111,203 108,227
NPV (@12% $43,089
EIRR 15.5%
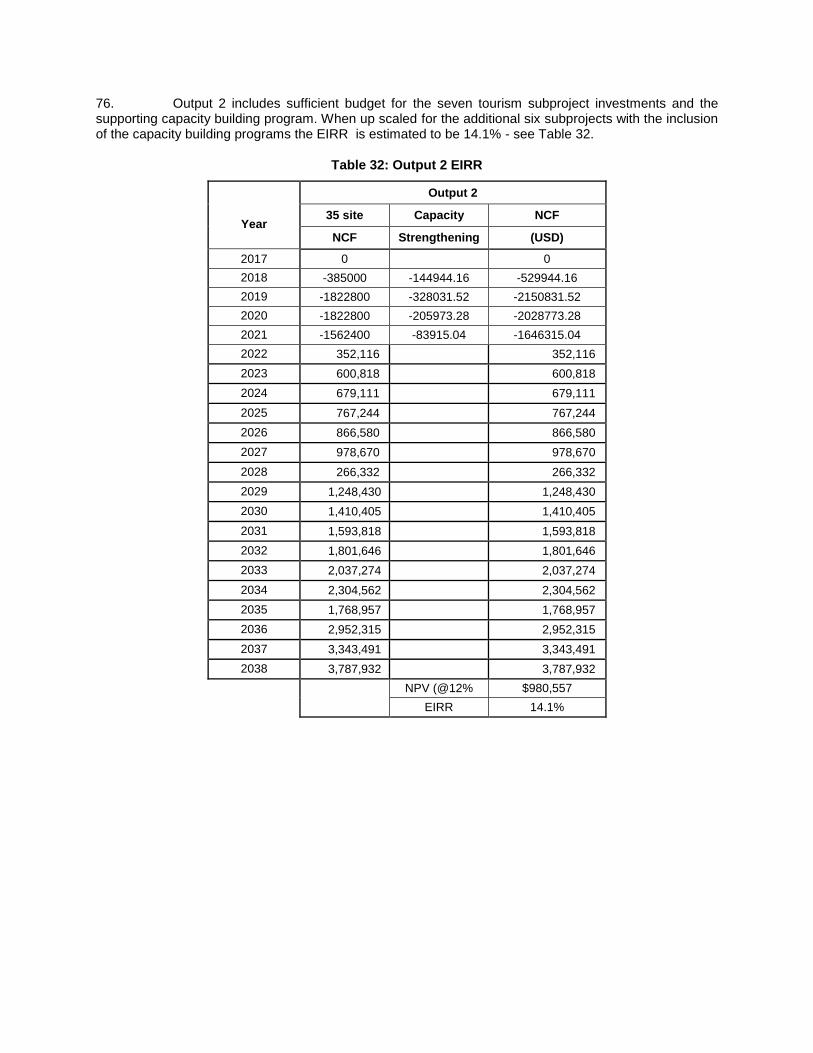
76. Output 2 includes sufficient budget for the seven tourism subproject investments and the supporting capacity building program. When up scaled for the additional six subprojects with the inclusion of the capacity building programs the EIRR is estimated to be 14.1% - see Table 32.
Table 32: Output 2 EIRR
Year
Output 2
35 site Capacity NCF
NCF Strengthening (USD)
2017 0 0
2018 -385000 -144944.16 -529944.16
2019 -1822800 -328031.52 -2150831.52
2020 -1822800 -205973.28 -2028773.28
2021 -1562400 -83915.04 -1646315.04
2022 352,116
352,116
2023 600,818
600,818
2024 679,111
679,111
2025 767,244
767,244
2026 866,580
866,580
2027 978,670
978,670
2028 266,332
266,332
2029 1,248,430
1,248,430
2030 1,410,405
1,410,405
2031 1,593,818
1,593,818
2032 1,801,646
1,801,646
2033 2,037,274
2,037,274
2034 2,304,562
2,304,562
2035 1,768,957
1,768,957
2036 2,952,315
2,952,315
2037 3,343,491
3,343,491
2038 3,787,932 3,787,932
NPV (@12% $980,557
EIRR 14.1%
III. PROJECT FEASIBILITY ASSESSMENT
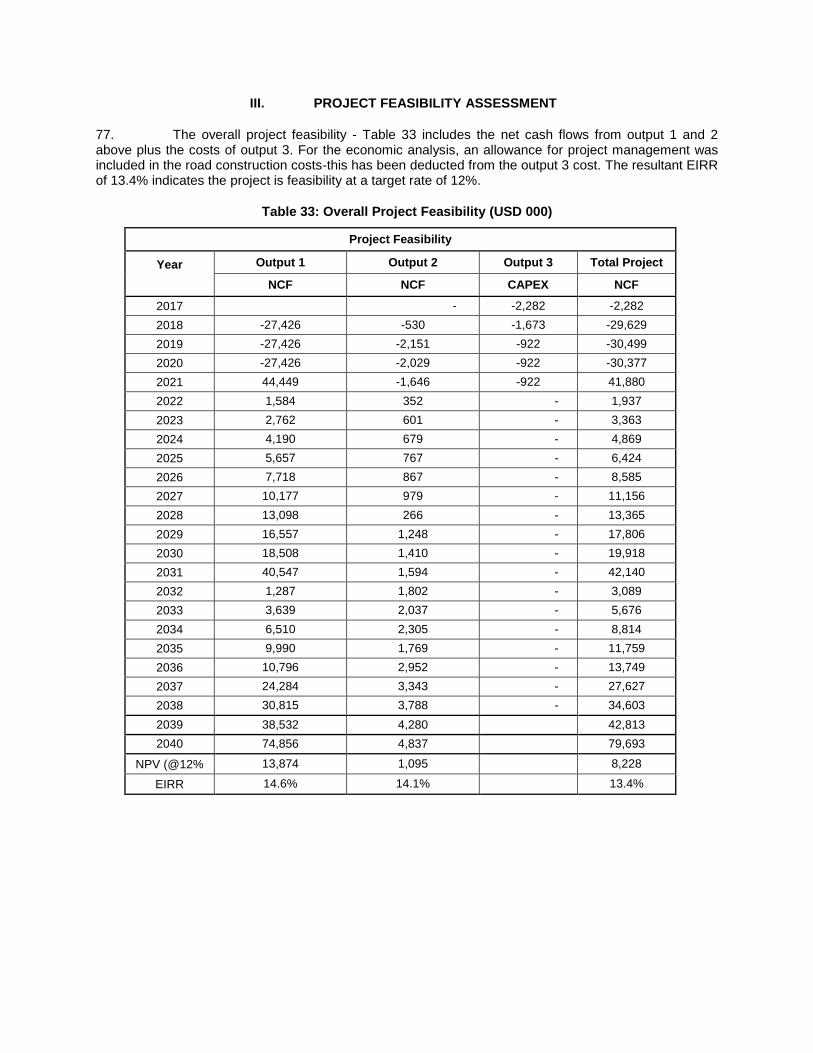
77. The overall project feasibility - Table 33 includes the net cash flows from output 1 and 2 above plus the costs of output 3. For the economic analysis, an allowance for project management was included in the road construction costs-this has been deducted from the output 3 cost. The resultant EIRR of 13.4% indicates the project is feasibility at a target rate of 12%.
Table 33: Overall Project Feasibility (USD 000)
Project Feasibility
Year
Output 1 Output 2 Output 3 Total Project
NCF NCF CAPEX NCF
2017 - -2,282 -2,282
2018 -27,426 -530 -1,673 -29,629
2019 -27,426 -2,151 -922 -30,499
2020 -27,426 -2,029 -922 -30,377
2021 44,449 -1,646 -922 41,880
2022 1,584 352 - 1,937
2023 2,762 601 - 3,363
2024 4,190 679 - 4,869
2025 5,657 767 - 6,424
2026 7,718 867 - 8,585
2027 10,177 979 - 11,156
2028 13,098 266 - 13,365
2029 16,557 1,248 - 17,806
2030 18,508 1,410 - 19,918
2031 40,547 1,594 - 42,140
2032 1,287 1,802 - 3,089
2033 3,639 2,037 - 5,676
2034 6,510 2,305 - 8,814
2035 9,990 1,769 - 11,759
2036 10,796 2,952 - 13,749
2037 24,284 3,343 - 27,627
2038 30,815 3,788 - 34,603
2039 38,532 4,280 42,813
2040 74,856 4,837 79,693
NPV (@12% 13,874 1,095 8,228
EIRR 14.6% 14.1% 13.4%