designing quantitative structure activity relationships to predict specific toxic endpoints for...
TRANSCRIPT

This article was downloaded by: [University of Stellenbosch]On: 08 October 2014, At: 22:19Publisher: Taylor & FrancisInforma Ltd Registered in England and Wales Registered Number: 1072954 Registeredoffice: Mortimer House, 37-41 Mortimer Street, London W1T 3JH, UK
SAR and QSAR in EnvironmentalResearchPublication details, including instructions for authors andsubscription information:http://www.tandfonline.com/loi/gsar20
Designing quantitative structureactivity relationships to predict specifictoxic endpoints for polybrominateddiphenyl ethers in mammalian cellsS. Rawata & E.D. Brucea
a Department of Environmental Science, Baylor University, Waco,TX, USAPublished online: 16 Apr 2014.
To cite this article: S. Rawat & E.D. Bruce (2014) Designing quantitative structureactivity relationships to predict specific toxic endpoints for polybrominated diphenylethers in mammalian cells, SAR and QSAR in Environmental Research, 25:7, 527-549, DOI:10.1080/1062936X.2014.899512
To link to this article: http://dx.doi.org/10.1080/1062936X.2014.899512
PLEASE SCROLL DOWN FOR ARTICLE
Taylor & Francis makes every effort to ensure the accuracy of all the information (the“Content”) contained in the publications on our platform. However, Taylor & Francis,our agents, and our licensors make no representations or warranties whatsoever as tothe accuracy, completeness, or suitability for any purpose of the Content. Any opinionsand views expressed in this publication are the opinions and views of the authors,and are not the views of or endorsed by Taylor & Francis. The accuracy of the Contentshould not be relied upon and should be independently verified with primary sourcesof information. Taylor and Francis shall not be liable for any losses, actions, claims,proceedings, demands, costs, expenses, damages, and other liabilities whatsoever orhowsoever caused arising directly or indirectly in connection with, in relation to or arisingout of the use of the Content.
This article may be used for research, teaching, and private study purposes. Anysubstantial or systematic reproduction, redistribution, reselling, loan, sub-licensing,systematic supply, or distribution in any form to anyone is expressly forbidden. Terms &

Conditions of access and use can be found at http://www.tandfonline.com/page/terms-and-conditions
Dow
nloa
ded
by [
Uni
vers
ity o
f St
elle
nbos
ch]
at 2
2:19
08
Oct
ober
201
4
Designing quantitative structure activity relationships to predict specifictoxic endpoints for polybrominated diphenyl ethers in mammalian cells
S. Rawat† and E.D. Bruce*
Department of Environmental Science, Baylor University, Waco, TX, USA
(Received 7 October 2013; in final form 21 February 2014)
Polybrominated diphenyl ethers (PBDEs) are known as effective flame retardants and havevast industrial application in products like plastics, building materials and textiles. They arefound to be structurally similar to thyroid hormones that are responsible for regulatingmetabolism in the body. Structural similarity with the hormones poses a threat to humanhealth because, once in the system, PBDEs have the potential to affect thyroid hormonetransport and metabolism. This study was aimed at designing quantitative structure–activityrelationship (QSAR) models for predicting toxic endpoints, namely cell viability and apop-tosis, elicited by PBDEs in mammalian cells. Cell viability was evaluated quantitativelyusing a general cytotoxicity bioassay using Janus Green dye and apoptosis was evaluatedusing a caspase assay. This study has thus modelled the overall cytotoxic influence ofPBDEs at an early and a late endpoint by the Genetic Function Approximation method.This research was a twofold process including running in vitro bioassays to collect data onthe toxic endpoints and modeling the evaluated endpoints using QSARs. Cell viability andapoptosis responses for Hep G2 cells exposed to PBDEs were successfully modelled withan r2 of 0.97 and 0.94, respectively.
Keywords: QSAR; polybrominated diphenyl ethers; genetic function approximation; HepG2 cells; cell viability; apoptosis
1. Introduction
Polybrominated diphenyl ethers (PBDEs) are a class of organic compounds with wide indus-trial application as flame retardants (Figure 1). PBDEs have been used in a wide range ofproducts like plastics, building materials, airplanes, electronics, upholstery, furnishings, poly-urethane foams, motor vehicles and textiles. PBDEs as flame retardants are not chemically(covalently) bonded to the polymer particles of the plastic, textile or other raw material butare physically attached, at levels ranging from 5% to 30% (w/w) [1,2]. This allows PBDEs toleach out and spread to the surrounding dust particles of an indoor or occupational setting[3,4]. The main route of exposure for humans is predominantly ingestion of contaminatedfoods (meat and dairy) [5]; inhalation and ingestion and/or dermal uptake of house dust con-taining PBDEs being others [1].
There has been an increasing use of PBDEs on an industrial scale and along with thata rising awareness to investigate their adverse effects on human physiology. They pose a
*Corresponding author. Email: [email protected]†Current address: US Environmental Protection Agency, Office of Research and Development, Athens,GA, USA
© 2014 Taylor & Francis
SAR and QSAR in Environmental Research, 2014Vol. 25, No. 7, 527–549, http://dx.doi.org/10.1080/1062936X.2014.899512
Dow
nloa
ded
by [
Uni
vers
ity o
f St
elle
nbos
ch]
at 2
2:19
08
Oct
ober
201
4
threat to human health due to their long half-life and characteristic thyroid hormonedisrupting potency [6–9]. Proliferation characteristics, apoptosis, oxidative stress and cellviability are important for the class of PBDEs. Studies have shown that bioconcentrationfactors for PBDE-47, PBDE-99 and PBDE-153 in lab studies with blue mussel lie in therange 220,000 to 1,400,000 [10]. The bioconcentration factor is an important indicator oftoxicity and is measured as the ratio of the concentration of a particular chemical in tissueper concentration of chemical in medium. Thus the toxic effects of PBDEs are currently arising public concern. Their structural similarity to polychlorinated biphenyls (PCBs) hascaused attention to focus on the potential effects to the developing nervous system andhence one of the most important toxic endpoints of PBDEs exposure is developmentalneurotoxicity.
Structurally, the most active site in PBDEs is the bromine atom which is responsible forfire suppression. One mechanism accounting for the effectiveness of brominated flame retar-dants is their ability to release active bromine atoms (free radicals) into the gas phase as thematerial is decomposed in the fire. These bromine atoms efficiently work to extinguish thechemical reactions in the flame, eventually, reducing the heat generated and slowing or evenpreventing the burning process. PBDEs vary structurally, as do their lipophilicity, bioaccumu-lation and environmental persistence, all of which are dependent on the number of bromineatoms. Studies show a high degree of bioavailability, bioaccumulation and biomagnificationof these compounds in aquatic systems [11,12]. The PBDE congeners have been reported tobe observed in natural matrices like sand, sediment and soil [13,14] and in biota [15]. Resultsfrom several studies illustrate that the higher brominated congeners are not as volatile, mobileand bioavailable as the lower brominated ones [16]. They have also been observed in aquaticbiota although at much higher concentrations than in air, water and sediment [17]. The lowerbrominated congeners are more mobile and have been found at places far away from theirsource [14,17].
PBDEs are resistant to degradation and have a high degree of binding affinity to particles,hence they tend to bioaccumulate in sediments [13,18]. Studies have also been conducted toassess the presence of PBDEs in sewage sludge and waste water [16,19]. PBDEs present inwater bodies are mainly sourced from effluents from nearby sewage treatment plants. Deposi-tion of PBDEs from the atmosphere to the aquatic sediments and terrestrial soils could beanother source of the chemicals in aquatic biota [20,21]. Most concerning are the observa-tions made in human blood [22] and mother’s breast milk which, in general, show risingtrends in PBDE levels over the past 30 years [15,23,24].
Experiments show that PBDEs or their metabolites may influence thyroid function bychanging thyroid hormone transport and metabolism. They may bind to thyroid hormones orother receptors and may cause a direct effect on thyroid gland tissues [1]. Hormones, like thy-roxin, play a vital role in cell growth and differentiation. An adverse effect on the thyroidhormone homeostasis may result in various downstream results throughout the body. Further,alterations to thyroid hormone homeostasis may negatively influence the overall growth ofthe body [25].
Figure 1. General structure of a PBDE. PBDE = C12 H10-x Brx O (x = 1, 2, 3, … 10 = m + n).
528 S. Rawat and E.D. Bruce
Dow
nloa
ded
by [
Uni
vers
ity o
f St
elle
nbos
ch]
at 2
2:19
08
Oct
ober
201
4

In this study, a general cytotoxicity bioassay as well as an apoptosis assay was used tomeasure cell viability elicited by PBDEs in Hep G2 cells. These two endpoints were chosenbecause cell viability is the most general and easily recognizable measure of cytotoxicity, andapoptosis is an important but more specific and downstream effect of the toxic influence ofPBDE exposure. The quantitative results from the experiments were used to design two dif-ferent quantitative structure–activity relationship (QSAR) models for each of the endpoints.
QSAR modelling gives us statistically robust models that reduce the time and cost ofexperimentation along with cutting down on the hazardous waste produced. Thousands ofdescriptors are used to characterize the link between the properties of a compound and itsbiological activity. This research is aimed at designing QSAR models for predicting toxicendpoints for a class of persistent organic pollutants in mammalian cells. These concepts andmethods can be extended to other classes of compounds or can be designed for a number ofdifferent toxic endpoints. These endpoints can be specific to a disease, a toxic response or acertain mechanism of action. This concept holds a significant potential in the toxicology/phar-macology fields as it has the potential to reduce the cost, time and animal lives lost to toxicitytesting.
The fundamental theory of QSAR modeling is based on the assumption that there is arelationship between the molecular and structural features of a compound and its biologicalactivity. The aim of QSAR modelling is to characterize these relationships and extend the pre-dictive model to the activity of new chemicals within the same family [26–29]. This canreduce the time and cost associated with designing new drugs or can shorten the process, thusmaking it more economical.
QSARs are one of the several in silico tools that aid risk assessment and other researchefforts that need toxicity data not available in the existing databases or libraries. Testing forsuch data would demand investment of enormous amount of time, labor and resources. All ofthis can be saved or reduced if reliable models can be established for the more investigatedtoxicological chemicals, thus filling critical information gaps. The basic utility of QSAR froman industrial perspective is that the toxicity predictions may be used to quantitatively deter-mine risks from untested or unreliably tested chemicals. Hence, the manufacturers obtaininformation about the toxicity of a certain chemical as well as its long-term effects in itsdevelopmental stage. Internationally, QSARs are used in regulatory contexts for screeningapplications. For example, the US Environmental Protection Agency (US EPA) uses QSARsto screen industrial chemicals to determine if they need to be tested further. The US EPA isinterested in the possibility of combining traditional physiologically-based pharmacokinetic(PBPK) modeling with QSAR analysis to produce a protocol for high-throughput screeningprocesses for chemicals of concern. The QSAR paradigm found its earliest utility in the fieldsof agro chemistry, then grew into pharmaceutical chemistry applications and today is used byalmost every branch of chemistry [30].
Overall, the method used in this study is a combination of traditional toxicological analy-ses and an alternative research method. The alternative method of the in silico predictive toolgeneration is a novel and forthcoming area of study, which is not the end all, but a means ofmore focused toxicological experimentation that then leads to a more robust estimate ofhuman health risk. The current study is an initial effort towards an extremely novel researchmethod. These methods will eventually allow researchers to focus their experimental effortsby using an in silico method to predict toxicity thus reducing time, cost, hazardous waste,and animal lives lost for testing toxicants.
SAR and QSAR in Environmental Research 529
Dow
nloa
ded
by [
Uni
vers
ity o
f St
elle
nbos
ch]
at 2
2:19
08
Oct
ober
201
4

2. Methods
2.1 Cell culture and bioassays for specific endpoints
Human hepatocarcinoma (Hep G2) cells were purchased from the American Type CultureCollection (ATCC, Manassas, VA, USA). They were cultured in a simulated environment inan incubator at 37°C and 5% CO2. Eagle’s minimum essential medium (ATCC Manassas,VA, or Sigma Aldrich, St Louis, MO, USA) was made into a complete growth medium byadding fetal bovine serum (Atlanta Biologicals, Lawrenceville, GA, USA) to a final concen-tration of 10% and was used for culturing the cells. Cells were exposed to chemicals dis-solved in 0.5% dimethyl sulfoxide (DMSO) (final concentration) for an incubation period of72 hours. Control cells were incubated with the vehicle (DMSO) only. The treatments wereexperimented with PBDE-28, PBDE-47, PBDE-99, PBDE-100, PBDE-153, PBDE-183,PBDE-209, 3-OH-BDE-47, 5-OH-BDE-47 and 6-OH-BDE-47. The chemicals were procuredfrom AccuStandard (New Haven, CT, USA). They were bought in neat form and a volumetricmethod was used to put them into solution. All chemicals were evaluated across the samedose range so to enable accurate comparison of effects across varying congeners. Concentra-tion ranges of each congener tested were used to calculate the no observed adverse effectlevel (NOAEL) or lowest observed adverse effect level (LOAEL) to align with data neededto incorporate into the human health risk assessment paradigm. The concentrations of thesechemicals in DMSO were verified by analysis using gas chromatography/mass spectrometry(GC/MS) in the laboratory. Caspase-3 activity kits used for apoptosis rates study were pur-chased from Life Technologies (Grand Island, NY, USA).
2.2 Determination of cell viability by Janus Green dye
The Janus Green dye was used to measure the cell viability. The cells were cultured in 96-well plates and were exposed to varying concentrations of the toxic chemical with 16 repli-cates for each concentration and incubated for a 24-hour period. This was followed by twophosphate-buffered saline (PBS) rinses, after which the dye was applied to the cells for60 seconds. The lysed cells were able to take up the dye as against the live ones, giving ameasure of cell toxicity under the effect of chemical exposure. Excess dye was removed bytwo PBS rinses. Ethanol (100%) was used to extract the dye ready to be read. A measuredvolume of nanopure water was added to each well of the culture plate before it was read onthe spectrophotometer to measure absorbance at 654 nm. A ELx800 absorbance microplatereader by BioTek® (Winooski, VT, USA) was used to measure the optical density from theexperimented plates.
2.3 Determination of apoptosis by caspase assay
The EnzChek® Caspase-3 assay kit from Life Technologies (Grand Island, NY, USA) wasused for the assessment of apoptosis by using an assay for increases in caspase-3 and otherDEVD-specific protease activities (e.g. caspase-7). Hepatocarcinoma (Hep G2) cells were cul-tured and seeded in 96-well plates @ 9000 cells/well. They were dosed with varying concen-trations of PBDEs 24 hours after seeding and incubated at 37°C and 5% CO2 for 72 hours.Each plate had 16 replicates for one concentration, one chemical per plate; 50 μl of cell lysisbuffer was added to each well and the plates were incubated at -80°C overnight. The lysatefrom individual wells was collected the following day and centrifuged. The supernatant wastransferred to another micro plate. Next, 50 μl of the substrate working solution (with
530 S. Rawat and E.D. Bruce
Dow
nloa
ded
by [
Uni
vers
ity o
f St
elle
nbos
ch]
at 2
2:19
08
Oct
ober
201
4

Z-DEVD-R110) was added to each well and the plate was incubated at room temperature for30 minutes. Finally, plates were read on a Fluoroscan Ascent FL® fluorescence plate reader(Thermo Scientific, Watham, MA, USA) at 485 ± 10 nm/530 ± 10 nm excitation versusemission wavelengths.
2.4 Statistical methods
Control and treatment levels were compared using one way analysis of variance (ANOVA)with Tukey’s test to determine significance (p < 0.05) using JUMP (8.0 by SAS, Cary, NC,USA) and SigmaPlot 11.0 software (Systat Software, Inc., San Jose, CA). Dunnett’s test wasused to cross check the results from Tukey’s test (data not shown). Assumptions for ANOVAwere confirmed, including the following: datasets from each experiment are normally distrib-uted; and groups in the set are independent and have homogeneous variances.
2.5 Building QSARs in discovery studio (Accelyrs Inc., San Diego, CA)
The experimentally determined quantitative values for the endpoint responses elicited by thePBDEs from the mentioned bioassays were used to construct QSAR models using theGenetic Function Approximation (GFA) method. For each congener tested in each experi-ment, the assay response at the lowest observable adverse effect concentration (LOAEC)value was selected for modeling (Table 1). This denotes the first indication of a significanttoxic influence on the cells. Responses at and above the modeled value were considered topose an unacceptable risk from a human health risk assessment standpoint.
First, the chemical structures were entered into the program through SMILES (SimplifiedMolecular Input Line Entry Specification) codes. The structures when entered in the programwere in a crude form. They were refined by generating three-dimensional (3D) structures andco-ordinates for the set of chemicals. In addition, the structures were refined by generatingtautomers and isomers, ionizing functional groups, standardizing charges for common groups,enumerating ionization states, adding hydrogen atoms, removing duplicate structures andretaining only the largest fragments among other functions (Discovery Studio 2.5.5, 2010).
Molecular descriptors were determined by calculating molecular properties. Descriptorsare characteristics or properties of compounds that relate to the predicted variable in theQSAR equation. The QSAR module of Discovery Studio helped determine the appropriate
Table 1. Lowest observable adverse effect concentration (LOAEC) responses from in vitro experimentsused for generating QSAR equations.
Chemical↓ Experiment→ Cell viability (absorbance intensity) Apoptosis (fluorescence intensity)
PBDE-28 0.231563 8.687625PBDE-47 0.25125 5.076438PBDE-99 0.374188 3.894313PBDE-100 0.370688 6.502875PBDE-153 0.565938 7.166438PBDE-183 0.265125 4.68775PBDE-209 0.2145 0.5550253-OH-PBDE-47 0.22515 11.418135-OH-PBDE-47 0.209188 4.2168136-OH-PBDE-47 0.203375 2.95
SAR and QSAR in Environmental Research 531
Dow
nloa
ded
by [
Uni
vers
ity o
f St
elle
nbos
ch]
at 2
2:19
08
Oct
ober
201
4
descriptors to characterize the dependent properties or activities, find their calculated valuesand develop a correlation matrix of all the descriptors. The least correlated descriptors werepreferred over more correlated ones. The program has a library of different types of descrip-tors which was used to find the most appropriate and those most relevant to the chemicalsand the activity being modeled. The library consists of multiple descriptors – traditionalmolecular descriptors, semi-empirical quantum mechanical (QM) descriptors, density func-tional QM descriptors, topological descriptors, chemical and biological descriptors, geometricdescriptors, physicochemical descriptors, as well as user-defined descriptors. The QSAR equa-tions were generated by running the GFA protocol. GFA is, an analogy derived from the evo-lution of DNA where individual biological entities were represented as equations. The processof QSAR evolution started with a population of random initial strings of bits or descriptorsets. Ranking or scoring all the strings was done by a goodness of fit function, namely, theFriedman lack of fit (LOF) score. Friedman LOF tested the strings for their quality. The bestfit combinations were paired together for developing a new generation by a crossover opera-tion, so that only good genetic material (descriptors) from both parents was passed on to theoffspring. This process of scoring, ranking, and mating of strings (equations) continued for5000 generations until the average fitness of the individuals in the population was raised. Thefinal products included only good quality genetic material for further observation [31].
The GFA approach had several advantages over other methods. It generated a number ofmodels and could build not just linear equations but higher order polynomials as well. Thisapproach includes automatic outlier removal using splines as well as being able to select thedescriptors depending on the dataset and the chemical structures. The user, however, has dis-cretion over a number of parameters in modeling thus making this a superior method.
In the current study, GFA underwent 5000 generations to create 10 linear models. Theuser was able to specify the population size, the total number of models or equations in theevolving population, 100 in this case. The GFA used Friedman LOF score as a measure ofgoodness of fit which curtails over-fitting [31] and gave a score to each model. A single scoremethod was used to rank the models on the basis of the outcome of scoring done using theFriedman’s method. The QSARs generated were checked for their predictive property throughinternal validation using the ‘leave-one-out’ cross validation method.
3. Results
Tri, tetra, penta, hepta and decabrominated PBDE congeners (PBDE-28, PBDE-47, PBDE-99,PBDE-183 and PBDE-209) elicited significant toxic responses by reducing cell viability inHep G2 cells. The lower brominated PBDE congeners were found to be more toxic than thehigher brominated congeners. 6-OH-BDE-47 induced the most toxicity among the hydroxyl-ated and the parent congeners. A tetrabrominated congener (PBDE-47) and a pentabrominatedcongener (PBDE-99) were observed to elicit significant apoptosis at a high dose [10 parts permillion (ppm)]. A pentabrominated congener (PBDE-100) was found to induce significantincreases in the rate of apoptosis in a dose-dependent manner.
3.1 Toxicity metric
Responses from bioassays were compared among each other for a significant difference (p <0.05, Tukey’s test). Control and solvent control (0.5% DMSO) responses were checked first
532 S. Rawat and E.D. Bruce
Dow
nloa
ded
by [
Uni
vers
ity o
f St
elle
nbos
ch]
at 2
2:19
08
Oct
ober
201
4

for significant differences. No significant difference meant the solvent did not interfere withthe responses elicited by the treatment chemicals (Cell Viability ≥85%). Then the solventcontrol was statistically compared with each of the responses from treatments at increasingconcentration. A NOAEL is the highest exposure level at which no statistically or biologicallysignificant increases are seen in the frequency or severity of adverse effect between theexposed population and its appropriate control population. In cases in which a NOAEL havenot been demonstrated experimentally, the term LOAEL or LOAEC is used, which is thelowest dose tested at which a statistically significant response is observed [32]. This is stan-dard protocol when evaluating human health risks due to exposures to toxic compounds. Thelowest concentration at which the response was significantly different from the solvent controlwas the experimental LOAEC value. The associated response measured at the LOAEC, ineach particular assay, was incorporated into the model.
Determination of LOAEC was an important step towards designing sound QSAR models.The responses observed at the LOAEC values for each bioassay were used for designing theQSAR models and have been illustrated in Table 1. These responses are in terms of eitherabsorbance intensity or fluorescence intensity for the two endpoints presented herein, adimensionless, numeric quantity, obtained from reading the experimental plates using a spec-trophotometer. This work attempts to model the effect and not the dose of chemicals used ineach bioassay. In addition, the responses at the LOAEC concentrations that were chosen formodeling are not estimations from a dose response curve but actual values from quantitativeexperimental results. Tukey’s test and Dunnet’s test were used to check the modeled valuesfor statistically significant differences. These values were used for modeling after log transfor-mation to make the values variable with respect to each other and cover a considerable range.
For experiments where we obtained no significant results over the concentrations tested,we selected the lowest response from among all the responses obtained to be used for model-ing. This was done to satisfy the need to be conservative in toxicity estimates for humanhealth effects. Future work to improve these models would include a broader range of con-centrations and congeners within the family. The idea presented in this manuscript, thatincludes biological data collected using molecular analysis, generates data that are less expan-sive over the range of concentrations tested.
All the experiments were conducted at 0.5% DMSO concentration. This percentage sol-vent was determined from an experimental run using different concentrations of DMSO (0.1,0.3, 0.5, 0.7 and 1.0%). Cells were dosed for 24 hours and checked for cell viability (85%minimum). The percentage of DMSO that did not cause a statistically significant difference incell viability was then used for comparison of treated cells and control. This was done toensure that the solvent did not interfere with the effect of the treatment chemical. If there wasa statistically significant difference found between the two (p < 0.05, Tukey’s test), the resultswere discarded and re-run. Hence, all the results presented come from experimental data thathad no statistically significant difference between control and solvent control.
3.2 Control variability
Although the acceptable variation in control and solvent control is variable in different assaysystems, a variation of 10–20% in the two responses is considered to be acceptable forin vitro assays [33]. This implies that there should be at least 80–90% survival for acceptableresults from in vitro studies [34,35]. For our experimentation our error was lower than normalvariation and was in the range of 5 to 10%.
SAR and QSAR in Environmental Research 533
Dow
nloa
ded
by [
Uni
vers
ity o
f St
elle
nbos
ch]
at 2
2:19
08
Oct
ober
201
4

3.3 In vitro: cell viability
Figure 2 shows the cell viability responses among different PBDE congeners. The results rep-resent the percentage of cells surviving the influence following a 72-hour exposure to increas-ing nominal concentration of the toxic chemical. No statistically significant difference wasfound between controls and solvent controls for any of the experiments. PBDE-28, PBDE-47,PBDE-99 and PBDE-183 showed statistically significant decreases in cell viability in a dosedependent manner. PBDE-209 showed significant reductions in percentage viability from thelowest dose tested up to 5 mg/l. PBDE-153 did not show any significant decreases inpercentage cell viability, whereas PBDE-100 was significantly different from controls at onlythe 10 mg/l treatment level.
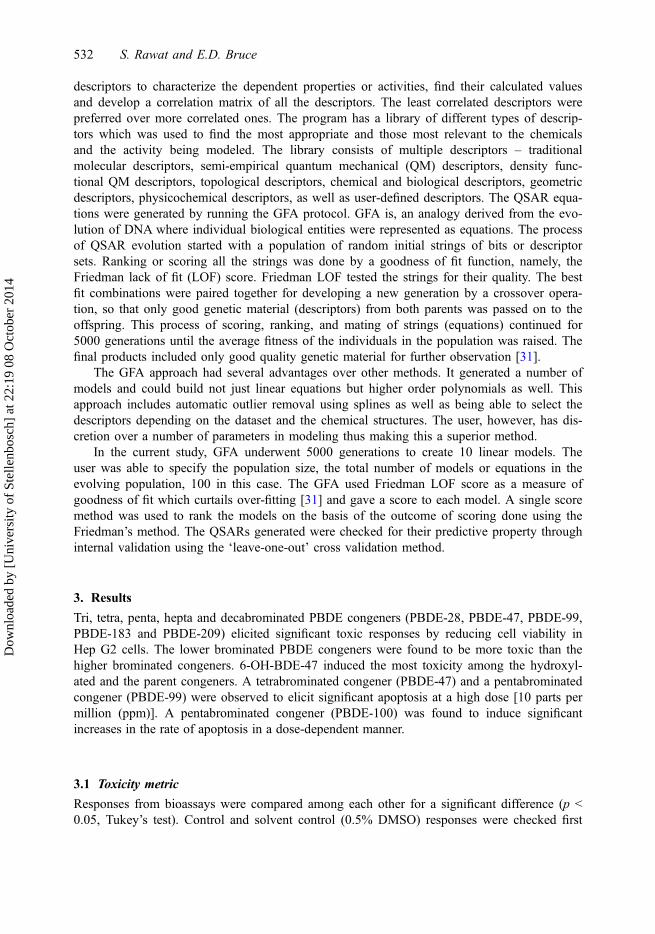
PBDE-47 and 6-OH-PBDE-47 showed statistically significant decreases in cell viability ina dose-dependent manner (Figure 3). 5-OH-PBDE-47 showed significant decreases only athigh nominal concentrations (i.e. 10 mg/l, 20 mg/l), whereas 3-OH-PBDE-47 did not showsignificant decreases in percentage cell viability at any of the doses tested.
3.4 In vitro: apoptosis
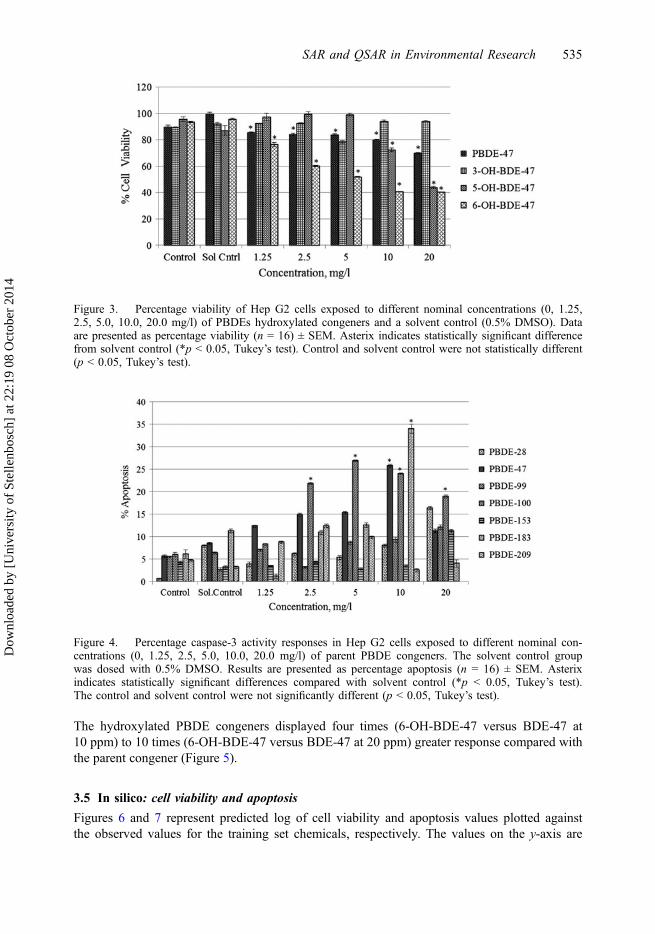
It was observed (Figure 4) that PBDE-100 induced significant caspase-3 activity in the cellsin a dose-dependent manner, effective at 2.5, 5.0, 10.0 and 20.0 mg/l nominal concentrations.PBDE-47 and PBDE-183 had significant effects only at 10.0 mg/l. PBDE-47, PBDE-100 andPBDE-209 elicited a dose-dependent response to increasing concentrations. The resultscompiled in Figure 4 are from experiments performed under identical conditions.
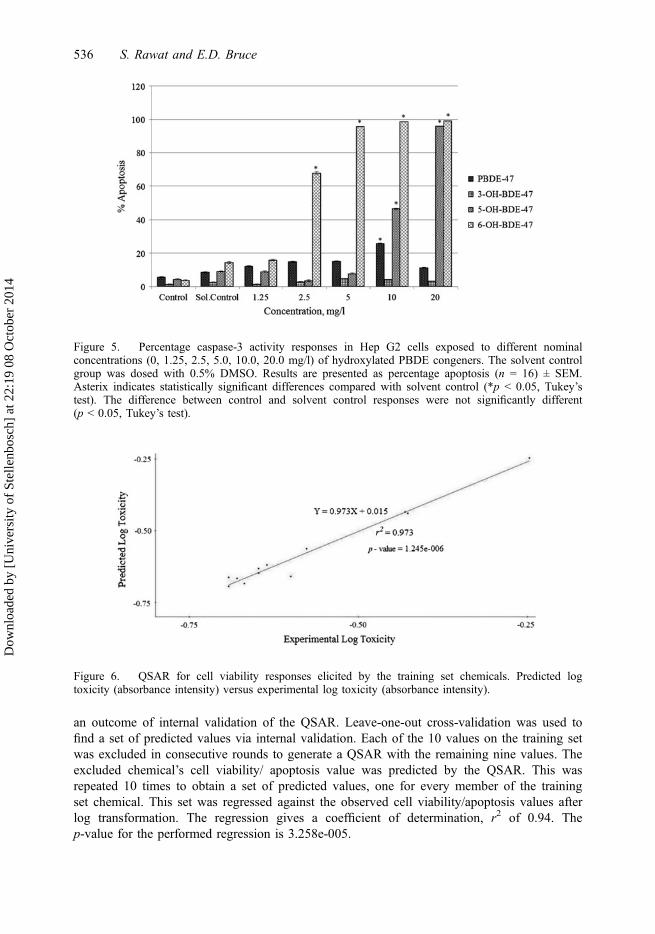
A dose-dependent response was observed with 6-OH-PBDE-47 starting at 2.5 mg/l, up to20.0 mg/l nominal concentration. The caspase-3 activity doubled at higher nominal concentra-tions showing a 100% increase in apoptosis with respect to the solvent control. 5-OH-PBDE-47had significant effects only at high nominal concentrations, 10.0 and 20.0 mg/l, respectively.
Figure 2. Percentage viability of Hep G2 cells exposed to different nominal concentrations (0, 1.25,2.5, 5.0, 10.0, 20.0 mg/l) of PBDE parent congeners and a solvent control group (0.5% DMSO). Dataare presented as percentage viability (n = 16) ± standard error of the mean (SEM). Asterix indicates sta-tistically significant difference from solvent control (*p < 0.05, Tukey’s test). Control and solvent con-trol were not significantly different (p < 0.05, Tukey’s test).
534 S. Rawat and E.D. Bruce
Dow
nloa
ded
by [
Uni
vers
ity o
f St
elle
nbos
ch]
at 2
2:19
08
Oct
ober
201
4
The hydroxylated PBDE congeners displayed four times (6-OH-BDE-47 versus BDE-47 at10 ppm) to 10 times (6-OH-BDE-47 versus BDE-47 at 20 ppm) greater response compared withthe parent congener (Figure 5).
3.5 In silico: cell viability and apoptosis
Figures 6 and 7 represent predicted log of cell viability and apoptosis values plotted againstthe observed values for the training set chemicals, respectively. The values on the y-axis are
Figure 3. Percentage viability of Hep G2 cells exposed to different nominal concentrations (0, 1.25,2.5, 5.0, 10.0, 20.0 mg/l) of PBDEs hydroxylated congeners and a solvent control (0.5% DMSO). Dataare presented as percentage viability (n = 16) ± SEM. Asterix indicates statistically significant differencefrom solvent control (*p < 0.05, Tukey’s test). Control and solvent control were not statistically different(p < 0.05, Tukey’s test).
Figure 4. Percentage caspase-3 activity responses in Hep G2 cells exposed to different nominal con-centrations (0, 1.25, 2.5, 5.0, 10.0, 20.0 mg/l) of parent PBDE congeners. The solvent control groupwas dosed with 0.5% DMSO. Results are presented as percentage apoptosis (n = 16) ± SEM. Asterixindicates statistically significant differences compared with solvent control (*p < 0.05, Tukey’s test).The control and solvent control were not significantly different (p < 0.05, Tukey’s test).
SAR and QSAR in Environmental Research 535
Dow
nloa
ded
by [
Uni
vers
ity o
f St
elle
nbos
ch]
at 2
2:19
08
Oct
ober
201
4
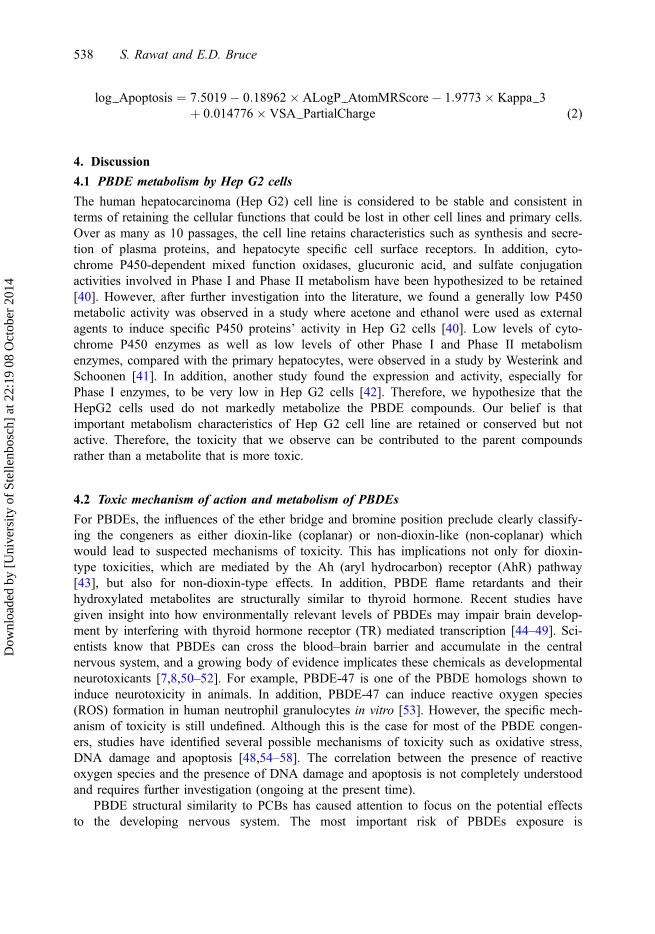
an outcome of internal validation of the QSAR. Leave-one-out cross-validation was used tofind a set of predicted values via internal validation. Each of the 10 values on the training setwas excluded in consecutive rounds to generate a QSAR with the remaining nine values. Theexcluded chemical’s cell viability/ apoptosis value was predicted by the QSAR. This wasrepeated 10 times to obtain a set of predicted values, one for every member of the trainingset chemical. This set was regressed against the observed cell viability/apoptosis values afterlog transformation. The regression gives a coefficient of determination, r2 of 0.94. Thep-value for the performed regression is 3.258e-005.
Figure 5. Percentage caspase-3 activity responses in Hep G2 cells exposed to different nominalconcentrations (0, 1.25, 2.5, 5.0, 10.0, 20.0 mg/l) of hydroxylated PBDE congeners. The solvent controlgroup was dosed with 0.5% DMSO. Results are presented as percentage apoptosis (n = 16) ± SEM.Asterix indicates statistically significant differences compared with solvent control (*p < 0.05, Tukey’stest). The difference between control and solvent control responses were not significantly different(p < 0.05, Tukey’s test).
Figure 6. QSAR for cell viability responses elicited by the training set chemicals. Predicted logtoxicity (absorbance intensity) versus experimental log toxicity (absorbance intensity).
536 S. Rawat and E.D. Bruce
Dow
nloa
ded
by [
Uni
vers
ity o
f St
elle
nbos
ch]
at 2
2:19
08
Oct
ober
201
4

Equations (1) and (2) represent the QSARs designed for the two sets of data; cell toxicityand apoptosis (described in Figures 6 and 7). For each dataset, a total of 10 QSAR equationswas generated. One was selected by the user from the best three on the basis of FriedmanLOF score and the r2. The highest r2 and the lowest LOF score represent a well-trainedmodel that has not been over-fitted and predicts reliably. Table 1 is a representation of theLOAEC response values selected from the experimental dose–response results for generatingthe models. Table 2 enumerates the relevant statistical data for the two equations. This workincludes 10 chemicals in the training set and includes three descriptors in each QSAR model.According to the rule put forward by Hansch [36–39], regression-based models are best fitwith one descriptor per four chemicals in the training set. The method that we have used inthis work, GFA, designs QSAR models using an analogy of the evolution of DNA in genesand is not completely regression based. Rather, this algorithm works in conjunction withregression. A detailed description of the descriptors obtained and their significance withrespect to the results follows in the discussion section.
log Toxicity ¼ �0:90321� 2:0635� Gasteiger Chargesþ 0:0073731� VSA AtomicAreasþ 0:0052213� VSA PartialCharge
(1)
Figure 7. QSAR for the caspase-3 activity responses elicited the training set chemicals. Predicted logapoptosis (fluoroscence intensity) versus experimental log apoptosis (fluoroscence intensity).
Table 2. Relevant statistics for the developed QSARs.
Statistic→r2 r2 (adj) r2 (pred) Friedman LOF RMS residual error SOR p-valueEndpoint↓
log_Toxicity 0.9733 0.9632 0.9400 0.003245 0.0266 1.245e-006log_Apoptosis 0.9393 0.9165 0.8536 0.1021 0.04782 3.258e-005
SAR and QSAR in Environmental Research 537
Dow
nloa
ded
by [
Uni
vers
ity o
f St
elle
nbos
ch]
at 2
2:19
08
Oct
ober
201
4
log Apoptosis ¼ 7:5019� 0:18962� ALogP AtomMRScore� 1:9773� Kappa 3þ 0:014776� VSA PartialCharge (2)
4. Discussion
4.1 PBDE metabolism by Hep G2 cells
The human hepatocarcinoma (Hep G2) cell line is considered to be stable and consistent interms of retaining the cellular functions that could be lost in other cell lines and primary cells.Over as many as 10 passages, the cell line retains characteristics such as synthesis and secre-tion of plasma proteins, and hepatocyte specific cell surface receptors. In addition, cyto-chrome P450-dependent mixed function oxidases, glucuronic acid, and sulfate conjugationactivities involved in Phase I and Phase II metabolism have been hypothesized to be retained[40]. However, after further investigation into the literature, we found a generally low P450metabolic activity was observed in a study where acetone and ethanol were used as externalagents to induce specific P450 proteins’ activity in Hep G2 cells [40]. Low levels of cyto-chrome P450 enzymes as well as low levels of other Phase I and Phase II metabolismenzymes, compared with the primary hepatocytes, were observed in a study by Westerink andSchoonen [41]. In addition, another study found the expression and activity, especially forPhase I enzymes, to be very low in Hep G2 cells [42]. Therefore, we hypothesize that theHepG2 cells used do not markedly metabolize the PBDE compounds. Our belief is thatimportant metabolism characteristics of Hep G2 cell line are retained or conserved but notactive. Therefore, the toxicity that we observe can be contributed to the parent compoundsrather than a metabolite that is more toxic.
4.2 Toxic mechanism of action and metabolism of PBDEs
For PBDEs, the influences of the ether bridge and bromine position preclude clearly classify-ing the congeners as either dioxin-like (coplanar) or non-dioxin-like (non-coplanar) whichwould lead to suspected mechanisms of toxicity. This has implications not only for dioxin-type toxicities, which are mediated by the Ah (aryl hydrocarbon) receptor (AhR) pathway[43], but also for non-dioxin-type effects. In addition, PBDE flame retardants and theirhydroxylated metabolites are structurally similar to thyroid hormone. Recent studies havegiven insight into how environmentally relevant levels of PBDEs may impair brain develop-ment by interfering with thyroid hormone receptor (TR) mediated transcription [44–49]. Sci-entists know that PBDEs can cross the blood–brain barrier and accumulate in the centralnervous system, and a growing body of evidence implicates these chemicals as developmentalneurotoxicants [7,8,50–52]. For example, PBDE-47 is one of the PBDE homologs shown toinduce neurotoxicity in animals. In addition, PBDE-47 can induce reactive oxygen species(ROS) formation in human neutrophil granulocytes in vitro [53]. However, the specific mech-anism of toxicity is still undefined. Although this is the case for most of the PBDE congen-ers, studies have identified several possible mechanisms of toxicity such as oxidative stress,DNA damage and apoptosis [48,54–58]. The correlation between the presence of reactiveoxygen species and the presence of DNA damage and apoptosis is not completely understoodand requires further investigation (ongoing at the present time).
PBDE structural similarity to PCBs has caused attention to focus on the potential effectsto the developing nervous system. The most important risk of PBDEs exposure is
538 S. Rawat and E.D. Bruce
Dow
nloa
ded
by [
Uni
vers
ity o
f St
elle
nbos
ch]
at 2
2:19
08
Oct
ober
201
4

developmental neurotoxicity. Mice receiving PBDE exposures during the brain spurt, mani-fested spontaneous altered behavior, learning and memory defects, and dysfunction in thecholinergic system in adults, all of which worsen with age [59–63]. Hippocampal neuronsplay a central role in the process. However, little information exists on possible cellular mech-anisms underlying the neurotoxic effects of PBDEs.
Thus, one of the objectives of the present study was to gain an understanding of the cyto-toxicity of PBDEs and to investigate possible mechanisms of toxicity, namely, cell viabilityand apoptosis. Apoptosis is a cellular autonomy death model controlled by genes, which iscompletely different from cellular necrosis in morphology. Apoptosis contributes to the selec-tive elimination of cells in physiological and pathological situations. Some studies have sug-gested that apoptosis involves the participation, at different levels, of ROS like hydrogenperoxide, superoxide anion and singlet oxygen [64–66]. Whether or not ROS play an impor-tant role in the course of apoptosis needs to be confirmed with further experiments (ongoingat the present time). In addition, cytotoxicity assays are widely used by the pharmaceuticalindustry to screen for cytotoxicity in compound libraries. Assessing cell membrane integrityis one of the most common ways to measure cell viability and cytotoxic effects. Compoundsthat have cytotoxic effects often compromise cell membrane integrity. Vital dyes, such asTrypan Blue, Janus Green B or propidium iodide are normally excluded from the inside ofhealthy cells; however, if the cell membrane has been compromised, they freely cross themembrane and stain intracellular components. Structure–activity relationships have beenincompletely examined for non-dioxin-like effects of PBDEs such as neurotoxicity and thy-roid hormone alterations. Therefore this study presents an initial effort to evaluate two toxicendpoints using QSARs to begin to elucidate the detailed mechanisms of toxic action forthese compounds.
4.3 Cell viability discussion
Cell viability was assessed by exposing Hep G2 cells to the PBDEs for 72 hours. PBDE-28,PBDE-47 and PBDE-99 showed a significant increase in cell toxicity in Hep G2 cells in adose-dependent manner. It is hypothesized that lower brominated PBDE congeners, in solu-tion with culturing medium, permeated through the cell membranes easily and altered cellviability significantly. Tribrominated, tetrabrominated and pentabrominated PBDEs altered cellviability more readily than the higher brominated congeners like PBDE-153. Bromine consti-tutes 50–85% of the molecular weight of a PBDE compound [67]. For instance, PBDE-28molecule weighs 407 Daltons out of which bromine counts for 240 Daltons, i.e. more than50% of the molecular weight. Bromine atoms are responsible for the fire suppression functionof the flame retardants. Higher bromine substitution makes the PBDE structure bulkier, add-ing to the steric hindrance due to bromine atoms as well as the molecular weight. The bro-mine substitution, both number and position, on the PBDE parent structure may directlyinfluence their tendency to cross the cell membrane and therefore could be a reason whylower brominated congeners elicited a relatively greater toxic response on the cells comparedwith the higher brominated congeners. Relative ease of transition through the cell membranedepends on the size of the molecule. Also, there could be other factors that are playing a rolein transport of chemicals across the cell membrane. Biological membranes are barriers thatare semi-permeable, meaning that they selectively allow some substances to pass across themembrane (barrier). What substances can pass across a membrane depends not only on theparticles of the substances themselves but often also on additional considerations. Suchconsiderations include how much of the substance is already on each side of the membrane
SAR and QSAR in Environmental Research 539
Dow
nloa
ded
by [
Uni
vers
ity o
f St
elle
nbos
ch]
at 2
2:19
08
Oct
ober
201
4

(i.e. concentration gradient), or on the availability of energy to support the process becausesome transport mechanisms require energy to be provided by the cell in order for certaintypes of substances to be moved from one side of the membrane to the other (i.e. activetransport) [68].
Among the PBDE congeners affected by concentration gradient and active transport, tetr-abrominated congener induced significant cell toxicity in Hep G2 cells (Figures 2 and 3). Thisresult was found to be consistent with observations made in similar studies with thetetrabrominated PBDE congener [54,57,69]. In the current study, hepta- and deca- brominatedcongeners, PBDE-183 and PBDE-209, elicited a statistically significant response to the cellviability assay. These congeners were suspected to undergo de-bromination in solution intoocta, penta and other lower brominated PBDE congeners. There is a suggested mechanism ofde-bromination and consequent cytotoxic effects of these chemicals. According to a theoryproposed by He et al. in 2006 [70], microbial bacteria could be responsible for anaerobic deg-radation of bigger molecules belonging to the PBDE family into smaller more toxic congen-ers. Looking at similar observations made by other studies [71,72] with the decabrominatedPBDE congener (Figure 2), we can hypothesize that BDE-209 breaks down into lower, moretoxic congeners in solution and induces cytotoxicity despite being a bulky parent congener.
The hydroxylated PBDE congeners were found to be significantly more toxic than theparent congeners, predominantly 6-OH-BDE-47 (Figures 3 and 5). It was hypothesized thatthe hydroxy group at the ortho position with relation to the ether linkage in 6-OH-BDE-47played a pivotal role in intramolecular hydrogen bonding between the hydroxy group and ahighly electronegative oxygen atom of the ether linkage. The study assumed that this addedto the hydrophobicity of the molecule and enhanced its ability to exert a toxic effect on thecells [73,74]. This theory regarding 6-OH-BDE-47 toxicity applies to both the endpoints stud-ied. 6-OH-BDE-47 showed significant toxic influences for almost all the nominal concentra-tions for both cell viability and apoptosis, and it is hypothesized that this can be attributed tothe above mentioned intramolecular hydrogen bonding. Results of the study conducted by Anet al. in 2010 [75] to assess the anti-proliferative effect and apoptosis elicited by 6-OH-BDE-47 were consistent with the findings of the current study, where cell viability (Figure 3) andapoptosis (Figure 5) experiments gave results indicating high cytotoxic (cell viability andapoptotic) influence induced by 6-OH-BDE-47.
We conducted all the experiments at neutral pH (7.0–7.25). Given that the pKa for thehydroxy (OH) group is 6.87 [76], we may expect the hydroxylated PBDE congeners to ionizein solution since the pH of the solution is slightly higher than the pKa for the hydroxy group.We suspect that the concentration of the ionized species of the hydroxylated congeners insolution is approximately the same as that of the unionized species. This may influence thetoxicity of the chemicals in that the ionized hydroxylated congeners are more toxic than inunionized form since it is in an anionic, unstable and active form of the compound. Thesecongeners would more readily interact with thyroid hormone carriers like transthyretin,thyroxine-binding globulin and albumin, and compete for thyroid hormones like T4 [77]. Thisconfirms the observed toxicity associated with the hydroxylated PBDE congeners.
According to Equation (1), VSA_AtomicAreas and VSA_PartialCharge are two importantdescriptors that characterize the cytotoxic influence of PBDEs on Hep G2 cells. Van derWaals surface area (VSA) variants, VSA_AtomicAreas and VSA_PartialCharge, are geometricdescriptors that characterize cell viability or toxicity as shown by the QSAR obtained (Equa-tion (1)). They represent each atom’s contribution towards the surface area of the molecule.This has relevance with respect to the theory mentioned previously that molecules with lessbromine atoms, and hence smaller structures and less surface area, cause more toxicity due to
540 S. Rawat and E.D. Bruce
Dow
nloa
ded
by [
Uni
vers
ity o
f St
elle
nbos
ch]
at 2
2:19
08
Oct
ober
201
4

the ease with which they are taken through the cell membrane and bind to receptors. Thedegree of bromination adds a significant characteristic because the bromine atom sizeaccounts for more than 50% of the molecular weight [67] and adds to the steric hindrance forany PBDE molecule.
VSA_PartialCharge and VSA_AtomicAreas are two dimensional molecular descriptorsthat belong to the van der Waals surface area family of descriptors. VSA_PartialCharge firstcalculates the partial charge on each atom of the molecule by Gasteiger’s method and furtherdivides the molecular surface area according to an individual atom’s partial charge.VSA_AtomicAreas is the atomic contribution of each individual atom towards the total sur-face area of the molecule. The surface area contribution of any atom in a molecule is the areaof that atom not part of any other atom.
Gasteiger Charges is the third significant descriptor with VSA_AtomicAreas andVSA_PartialCharge used to characterize the PBDE cytotoxicity in Hep G2 cells. GasteigerCharges is named after scientist Johann Gasteiger who postulated a method for calculatingthe partial charge on each atom of a molecule. According to his work published in 1979 [77],electronegativity is one important characteristic of every atom. Gasteiger charges are partialatomic charges, the difference between the orbital charge density of an atom in its unexcitedstate and when it is in a molecular environment [77]. The electron affinity, as well as the ion-ization potential, of an atom contributes to the partial atomic charge or the electronegativityalong with the influence of those from the neighboring atoms. It was observed that the celltoxicity is reduced (Equation (1)) for a molecule with more bromines substituted or greateratomic electronegativity or higher range Gasteiger charge numbers. The higher brominatedPBDE congeners with higher electronegativity do not have that significant of an effect on cellviability compared with the lower brominated ones since the higher electronegativity attributereduces their effect on cell toxicity. Similarly, 3-OH-BDE-47 and 5-OH-BDE-47 (at lowernominal concentrations) do not have significant toxic effect on the cells since they contain ahydroxy group with a highly electronegative oxygen atom. The high partial atomic chargesgiven the high electronegativity of the substituted atoms influence their effect on cell viabilitynegatively (Equation (1)), according to our hypothesis.
4.3 Apoptosis discussion
Apoptosis is a downstream effect in the cytotoxicity process. It can be the culmination of thetoxic insults or injuries on the cell from exposure to a xenobiotic. PBDE-100, PBDE-47 andPBDE-183 showed a significant apoptotic effect on the treated cells. PBDE-100 is a pentabro-minated congener, one of the most toxic as observed by some studies [67]. A significantapoptotic response was observed for most of the nominal concentrations of PBDE-100. Thiscan be attributed to its high log Kow value (please refer to Table S3 in the supplementarymaterial which is available via the multimedia link on the online article webpage) demonstrat-ing its ability to interact with the cells. Log Kow value is a measure of the hydrophobicity ofa chemical and signifies the tendency of a compound to get absorbed into lipids or tissuesand not stay in solution with water [78]. The log Kow value for the pentabrominated conge-ner, PBDE-100, is relatively higher than the lower brominated congeners. We hypothesizethat the observed dose-dependent apoptotic response of PBDE-100 in the cells is due to itsmarked hydrophobicity indicated by its high log Kow. Also, the cell membrane has aphospholipid bilayer that selectively allows only hydrophobic substances to pass through. Socompounds with higher hydrophobicity values are more likely to diffuse through the mem-brane more easily. PBDE-47 and PBDE-183 produced a significant response at a 10 mg/l
SAR and QSAR in Environmental Research 541
Dow
nloa
ded
by [
Uni
vers
ity o
f St
elle
nbos
ch]
at 2
2:19
08
Oct
ober
201
4

nominal concentration when tested for apoptosis (Figure 5). Results similar to the ones in thecurrent study were reported in two other studies with the tetrabrominated congener [54,57].
Further research into the apoptosis mechanism of toxic action has resulted in our evalua-tion of the oxidative stress assay for the same PBDEs in similar experimental conditionsusing a dichloro-dihydro-fluorescein diacetate (DCFH-DA) assay. The cells were highlyresponsive to the PBDE exposure, especially for the tetrabrominated congener, PBDE-47,with statistically significant response for most concentrations (ongoing at the present time,data not shown). A positive response to oxidative stress experiments indicates a compound’sability to induce apoptosis in the cells. The presence of excess ROS like hydrogen peroxidein the cells is a marker for apoptosis.
The QSAR equation for cell apoptosis prediction (Equation (2)) has ALogP_AtomMR-Score, Kappa 3 and VSA_PartialCharge descriptors that characterize the apoptotic trends oncells exposed to PBDEs. ALogP_AtomMRScore is a measure of an individual atom’s contri-bution to the molar refractivity of the compound. Molar refractivity (MR) is defined in termsof polarizability as follows:
MR ¼ 4PN a=3 (3)
where N is the Avogadro’s number (signifies a mole of substance) and α is the polarizability[77]. Clearly, the molar refractivity (MR) of a substance is a direct function of its polarizability(α). Furthermore, it can be assessed from electrostatics that for a spherical molecule, α = r3,where r stands for the radius of a molecule, assuming the molecule to be spherical [79]. Substi-tuting this conversion in Equation (3), it can be observed that MR is the same as the volume(4пr3/3) of spherical molecules in one mole of the substance. Theoretically speaking, molecularvolume is comprised of each individual atom’s volume added together; however, that would betrue only if we ignore the influence of the atomic bond’s polarity in a molecule and the overlapof the electron clouds of the atoms that come together to form the molecule [79].
Molar refractivity is a measure of the dispersive interaction or polarizability of a substance[80] and is important as a steric descriptor [81]. The polarizability descriptor encompasses thedual nature of a compound, that of the steric bulk and of the changes in the electrondistribution in the presence of an electric field. This may lead to the formation of inducedatomic dipoles in the presence of another local or foreign electric field [81]. Polarizability isdirectly related to the atomic volume as discussed under Equation (3). The greater the polarparts in a molecule, the greater is the MR value for that compound (given the condition offormation of atomic dipoles). Molar refractivity as a steric property is responsible for solva-tion energies of a compound in different solvents; hence it has a role in the hydrophobicitycharacteristics of a compound [81]. This could explain why MR has been linked with ALogP(atomic level hydrophobicity) in this modeling. Of the PBDEs tested, 5-OH-BDE-47 (only athigh nominal concentrations), 6-OH-BDE-47 (high hydrophobicity due to intramolecularhydrogen bonding), PBDE-47, PBDE-100 and PBDE-153 produced a significant increase inpercentage caspase-3 activity (Figures 4 and 5), probably because they are more polar thanthe other congeners. The ALogP_AtomMRScore is thus the atomic contribution to the totalvalue of ALogP_MR, the molar refractivity calculated by the atomic method defined byCrippen and Ghose [79]. It plays an important role in characterizing apoptosis induced byPBDEs and is a descriptor in the QSAR generated for predicting apoptosis (Equation (2)).
Kappa-3 is a Topostructural Index (TI). Atoms are represented as the vertices of themolecular graph and bonds by the edges. They are, in effect, numerical indices of moleculartopology derived by mathematical methods from the molecular structural graphs as describedabove.
542 S. Rawat and E.D. Bruce
Dow
nloa
ded
by [
Uni
vers
ity o
f St
elle
nbos
ch]
at 2
2:19
08
Oct
ober
201
4

3K ¼ 4:3Pmax:3Pmin=ð3PÞ2 fðA� 3Þ:ðA� 2Þ2=ð3PÞ2 for evenA
¼ ðA� 1Þ:ðA� 3Þ2=ð3PÞ2 for oddAg (4)
where mP is the number of paths in the hydrogen depleted molecular structure with length m(m = 1,2,3) and A is the number of non-hydrogen atoms in the molecule [82].
Kappa-3 descriptors are second-generation third-order TIs since they are real numbersbased on integer graph properties [83]. These descriptors encode information about the cen-trality of branching in a molecule. A higher number implies that molecular branching doesnot exist in the molecular graph or that it is located towards the extreme ends of the graph[82]. It clearly shows that the Kappa-3 values for all the PBDE molecules are quite close(Table S6 in in the supplementary material which is available via the multimedia link on theonline article webpage), which means that there is not a considerable variation in the central-ity of branching for the PBDE structures. The number is low for PBDE-209 (3.2) since it issymmetrical structurally and has basically no branching on the fundamental PBDE structure.The value is a bit higher for the other congeners but very close (3.2–3.5) given the uniformityin the dual benzene ring structure, limited branching and almost uniform atom substitution onthe two ether linked aromatic rings on the fundamental PBDE structure.
VSA_PartialCharge is the third descriptor that characterizes apoptosis caused by PBDEsother than ALogP_AtomMRScore and Kappa-3 (Equation (2)). The surface area contributionof each individual atom that adds towards the total surface area of the molecule plays a rolein characterizing the apoptosis (Equation (2)). These atomic surface areas are calculated basedon partial atomic charges. VSA_PartialCharge is calculated first by calculating the partialcharge on each atom of the molecule by Gasteiger’s method and then dividing the molecularsurface area according to an individual atom’s partial charge as mentioned previously.
The developed and validated QSAR models need to have their applicability domain (AD)defined before they can be used for prediction. If the descriptors used in QSAR models arenon- discrete or continuous, AD can be defined in terms of the model descriptor space inwhich the training set data lie. This is due to the fact that interpolated data are consideredmore reliable than extrapolated data [84]. The training set of the current study has chemicalsthat cover a range of parent PBDE congeners as well as hydroxylated versions, in their struc-ture and physicochemical properties and/or their mechanisms of action (assumed uniform ifotherwise). The applicability domain of the developed QSARs thus can be said to includeparent PBDEs and their hydroxylated congeners. The models developed in this work are pre-liminary in nature and can be used to observe trends within the data. Currently, an effort toexpand these models to include more compounds per descriptor, further cross-validation andadditional external validation with new datasets is ongoing.
5. Conclusions
As a result of the in vitro experiments, tri, tetra, penta, hepta and decabrominated PBDEcongeners (PBDE-28, PBDE-47, PBDE-99, PBDE-183 and PBDE-209) elicited significanttoxic responses in cell viability with Hep G2 cells. Van der Waal’s surface area and Gasteigercharges are the important properties that characterize cell viability. A pentabrominated conge-ner (PBDE-100) was found to induce significant increases in the rate of apoptosis in a dose-dependent manner. Molar refractivity, Kappa-3 and VSA_PartialCharge were found to be themost appropriate descriptors to characterize this response.
SAR and QSAR in Environmental Research 543
Dow
nloa
ded
by [
Uni
vers
ity o
f St
elle
nbos
ch]
at 2
2:19
08
Oct
ober
201
4

As a result of in silico QSAR modeling, cell viability and apoptosis responses for HepG2 cells exposed to PBDEs were successfully modeled with an r2 of 0.97 and 0.94, respec-tively (Table 2, Figures 6 and 7). More training set data would improve the quality, reliabilityand statistical robustness of the models. Similarly, other important toxic endpoints for PBDEexposures can be modeled for prediction using a similar method.
This is a preliminary investigation and is key to the development of future models. Thismethod could significantly reduce the time and improve the efficiency by which we maketoxicological predictions for certain classes of compounds. The expansion of these efforts toinclude more data for more compounds over a wider range of concentrations within a familyof compounds is what is needed to make this a more robust technique.
Supplemental material
Supplemental material for this article can be accessed here: http://dx.doi.org/10.1080/1062936X.2014.899512
AcknowledgementsWe are grateful to the Department of Environmental Science at Baylor University for providing us withthe opportunity and funding to conduct this study. Gratitude is due to the Glasscock family for theC. Gus Glasscock Junior endowed funds for Excellence in Environmental Sciences that supported thisproject.
References
[1] J.D. Meeker, P.I. Johnson, D. Camann, and R. Hauser, Polybrominated diphenyl ether (PBDE)concentrations in house dust is related to hormone levels in men, Sci. Total Environ. 407 (2009),pp. 3425–3429.
[2] C.A. de Wit, An overview of brominated flame retardants in the environment, Chemosphere 46(2002), pp. 583–624.
[3] Y.J. Kim, M. Osako, and S.I. Sakai, Leaching characteristics of polybrominated diphenyl ethers(PBDEs) from flame-retardant plastics, Chemosphere 65 (2006), pp. 506–513.
[4] A. Besis and C. Samara, Polybrominated diphenyl ethers (PBDEs) in the indoor and outdoorenvironments – a review on occurrence and human exposure, Environ. Pollut. 169 (2012),pp. 217–229.
[5] H.G. Ni, C. Ding, S.Y. Lu, X.L. Yin, and S.O. Samuel, Food as a main route of adult exposure toPBDEs in Shenzhen, China, Sci. Total Environ. 437 (2012), pp. 10–14.
[6] J. Chevrier, K.G. Harley, A. Bradman, M. Gharbi, A. Sjodin, and B. Eskenazi, Polybrominateddiphenyl ether (PBDE) flame retardants and thyroid hormone during pregnancy, Environ. HealthPerspect. 118 (2010), pp. 1444–1449.
[7] J.B. Herbstman, A. Sjodin, M. Kurzon, S.A. Lederman, R.S. Jones, V. Rauh, L.L. Needham, D.Tang, M. Niedzwiecki, R.Y. Wang, and F. Perera, Prenatal exposure to PBDEs and neurodevelop-ment, Environ. Health Perspect. 118 (2010), pp. 712–719.
[8] P. Porazzi, D. Calebiro, F. Benato, N. Tiso, and L. Persani, Thyroid gland development andfunction in the zebrafish model, Mol. Cell Endocrinol. 312 (2009), pp. 14–23.
[9] L.Q. Yu, J. Deng, X.J. Shi, C.S. Liu, K. Yu, and B.S. Zhou, Erratum to ‘Exposure to DE-71 altersthyroid hormone levels and gene transcription in the hypothalamic-pituitary-thyroid axis of zebra-fish larvae’ [Aquat. Toxicol. 97 (2010), pp. 226–233], Aquat. Toxicol. 100 (2010), pp. 376–376.
544 S. Rawat and E.D. Bruce
Dow
nloa
ded
by [
Uni
vers
ity o
f St
elle
nbos
ch]
at 2
2:19
08
Oct
ober
201
4

[10] K. Gustafsson, M. Björk, S. Burreau, and M. Gilek, Bioaccumulation kinetics of brominated flameretardants (polybrominated diphenyl ethers) in blue mussels (Mytilus edulis), Environ. Toxicol.Chem. 18 (1999), pp. 1218–1224.
[11] J.P. Wu, X.J. Luo, Y. Zhang, M. Yu, S.J. Chen, B.X. Mai, and Z.Y. Yang, Biomagnification ofpolybrominated diphenyl ethers (PBDEs) and polychlorinated biphenyls in a highly contaminatedfreshwater food web from South China, Environ. Pollut. 157 (2009), pp. 904–909.
[12] L. Weijs, S. Losada, K. Das, L. Roosens, P.J.H. Reijnders, J.F. Santos, H. Neels, R. Blust, and A.Covaci, Biomagnification of naturally-produced methoxylated polybrominated diphenyl ethers(MeO-PBDEs) in harbour seals and harbour porpoises from the Southern North Sea, Environ.Intern. 35 (2009), pp. 893–899.
[13] P.O. Darnerud, G.S. Eriksen, T. Johannesson, P.B. Larsen, and M. Viluksela, Polybrominateddiphenyl ethers: Occurrence, dietary exposure, and toxicology, Environ. Health Perspect. 109(2001), pp. 49–68.
[14] Q. Li, C. Yan, Z. Luo, and X. Zhang, Occurrence and levels of polybrominated diphenyl ethers(PBDEs) in recent sediments and marine organisms from Xiamen offshore areas, China, MarinePollut. Bull. 60 (2010), pp. 464–469.
[15] M. Harju, T. Hamers, J.H. Kamstra, E. Sonneveld, J.P. Boon, M. Tysklind, and P.L. Andersson,Quantitative structure-activity relationship modeling on in vitro endocrine effects and metabolicstability involving 26 selected brominated flame retardants, Environ. Toxicol. Chem. 26 (2007),pp. 816–826.
[16] R.C. Hale, M.J. La Guardia, E. Harvey, M.O. Gaylor, and T.M. Mainor, Brominated flameretardant concentrations and trends in abiotic media, Chemosphere 64 (2006), pp. 181–186.
[17] R.C. Hale, M. Alaee, J.B. Manchester-Neevig, H.M. Stapleton, and M.G. Ikonomou, Polybromi-nated diphenyl ether flame retardants in the North American environment, Environ. Intern. 29(2003), pp. 771–779.
[18] X. Liang, S. Zhu, P. Chen, and L. Zhu, Bioaccumulation and bioavailability of polybrominateddiphenyl ethers (PBDEs) in soil, Environ. Pollut. 158 (2010), pp. 2387–2392.
[19] N. Xiang, X. Zhao, X.Z. Meng, and L. Chen, Polybrominated diphenyl ethers (PBDEs) in a con-ventional wastewater treatment plant (WWTP) from Shanghai, the Yantze River Delta: Implicationfor input source and mass loading, Sci. Total Environ. 461–462 (2013), pp. 391–396.
[20] C. Sanchez-Brunete, E. Miguel, and J.L. Tadeo, Analysis of polybrominated diphenyl ethers in sew-age sludge by matrix solid-phase dispersion and isotope dilution GC-MS, J. Sep. Sci. 32 (2009),pp. 109–117.
[21] J. Li, Q. Li, R. Gioia, Y. Zhang, G. Zhang, X. Li, B. Spiro, R.S. Bhatia, and K.C. Jones, PBDEsin the atmosphere over the Asian marginal seas, and the Indian and Atlantic oceans, Atmos.Environ. 45 (2011), pp. 6622–6628.
[22] B. Link, T. Gabrio, V. Mann, B. Schilling, V. Maisner, M. Konig, A. Flicker-Klein, I. Zollner, andG. Fisher, Polybrominated diphenyl ethers (PBDE) in blood of children in Baden-Wurttembergbetween 2002/03 and 2008/09, Intern. J. Hyg. Environ. Health 215 (2012), pp. 224–228.
[23] A.P. Vonderheide, K.E. Mueller, J. Meija, and G.L. Welsh, Polybrominated diphenyl ethers: Causesfor concern and knowledge gaps regarding environmental distribution, fate and toxicity, Sci. TotalEnviron. 400 (2008), pp. 425–435.
[24] M. Petreas, D. Nelson, F.R. Brown, D. Goldberg, S. Hurley, and P. Reynolds, High concentrationsof polybrominated diphenylethers (PBDEs) in breast adipose tissue of California women, Environ.Intern. 37 (2011), pp. 190–197.
[25] C.E. Talsness, Overview of toxicological aspects of polybrominated diphenyl ethers: A flame-retar-dant additive in several consumer products, Environ. Res. 108 (2008), pp. 158–167.
[26] Y. Liu, Drug design by machine learning: Ensemble learning for QSAR modeling, Proceedings ofthe fourth International Conference on Machine Learning and Applications, 2005.
[27] T.M. Frimurer, R. Bywater, L. Narum, L.N. Lauritsen, and S. Brunak, Improving the odds indiscriminating ‘drug-like; from ‘non drug-like’ compounds, J. Chem. Inf. Comput. Sci. 40 (2000),pp. 1315–1324.
SAR and QSAR in Environmental Research 545
Dow
nloa
ded
by [
Uni
vers
ity o
f St
elle
nbos
ch]
at 2
2:19
08
Oct
ober
201
4
[28] M. Wagener and V. van Geerestein, Potential drugs and non-drugs: Prediction and identification ofimportant structural features, J. Chem. Inf. Comput. Sci. 40 (2000), pp. 280–292.
[29] Y. Liu, A comparative study on feature selection methods for drug discovery, J. Chem. Inf.Comput. Sci. 44 (2004), pp. 1823–1828.
[30] G.W. Suter II, L.W. Barnthouse, S.M. Bartell, S.M. Coemier, D. Mackay, N. Mackay, and S.B.Norton, Ecological Risk Assessment, in Organism Level Extrapolation Models, CRC Press,New York, 2007.
[31] D. Rogers and A.J. Hopfinger, Application of genetic function approximation to quantitative struc-ture-activity relationships and quantitative structure-property relationships, J. Chem. Inf. Comput.Sci. 34 (1994), pp. 854–866.
[32] United States Environmental Protection Agency (USEPA), Risk Assessment Guidance For Super-fund (RAGS), Volume 1 - Human Health Evaluation Manual, Part A. Interim Final 1989, Office ofEmergency and Remedial Response (EPA/540/1-89/002).
[33] G.M. Rand, Fundamentals of Aquatic Toxicology: Effects, Environmental Fate, and RiskAssessment, Taylor & Francis, Philadelphia, PA, 1995.
[34] David Brusick, Principles of Genetic Toxicology, 2nd ed., Plenum Press, New York, 1987.[35] W.G. Landis, J.S. Hughes, and M.A. Lewis, Environmental Toxicology and Risk Assessment,
STP1179, American Society for Testing and Materials, West Conshohocken, PA, 1993.[36] C. Hansch and C. Selassie, Quantitative structure–activity relationship – a historical perspective
and the future, in Comprehensive Medicinal Chemistry II, J.B. Taylor and D.J. Triggle, eds.,Elsevier, Oxford, 2007, pp. 43–63.
[37] C. Hansch, R. Garg, B. Kurup, and S.B. Mekapati, Allosteric interactions and QSAR: On the roleof ligand hydrophobicity, Bioorg. Med. Chem. 11 (2003), pp. 2075–2084.
[38] C. Hansch, B.R. Telzer, and L.T. Zhang, Comparative QSAR in toxicology - examples from teratol-ogy and cancer-chemotherapy of aniline mustards, Crit. Rev. Toxicol. 25 (1995), pp. 67–89.
[39] C.H. Hansch, Demonstration of the use of a QSAR database to illustrate the development of amodel for estrogenic toxicity, Abstr. Pap. Am. Chem. Soc. 217, (1999), U668.
[40] A.L. Roe, J.E. Snawder, R.W. Benson, D.W. Roberts, and D.A. Casciano, Hep G2 cells: Anin-vitro model for P-450 dependent metabolism of acetaminophen, Biochem. Biophys. Res. Comm.190 (1993), pp. 15–19.
[41] W.M.A. Westerink and W.G.E.J. Schoonen, Cytochrome P450 enzyme levels in Hep G2 cells andcryopreserved primary human hepatocytes and their induction in Hep G2 cells, Toxicol. In Vitro21 (2007), pp. 1581–1591.
[42] S. Wilkening, F. Stahl, and A. Bader, Comparison of primary human hepatocytes and hepatomacell line Hep G2 with regard to their biotransformation properties, Drug Metab. Dispos. 31(2003), pp. 1035–1042.
[43] H.M. Stapleton, S.M. Kelly, R. Pei, R.J. Letcher, and C. Gunsch, Metabolism of polybrominateddiphenyl ethers (PBDEs) by human hepatocytes in vitro, Environ. Health Perspect. 117 (2009),pp. 197–202.
[44] M.M. Dingemans, M. van den Berg, and R.H. Westerink, Neurotoxicity of brominated flameretardants: (in)direct effects of parent and hydroxylated polybrominated diphenyl ethers on the(developing) nervous system, Environ. Health Perspect. 119 (2011), pp. 900–907.
[45] K. Ibhazehiebo, T. Iwasaki, J. Kimura-Kuroda, W. Miyazaki, N. Shimokawa, and N. Koibuchi,Disruption of thyroid hormone receptor-mediated transcription and thyroid hormone-inducedPurkinje cell dendrite arborization by polybrominated diphenyl ethers, Environ. Health Perspect.119 (2010), pp. 168–175.
[46] K. Ibhazehiebo, T. Iwasaki, T. Okano-Uchida, N. Shimokawa, Y. Ishizaki, and N. Koibuchi, Sup-pression of thyroid hormone receptor-mediated transcription and disruption of thyroid hormone-induced cerebellar morphogenesis by the polybrominated biphenyl mixture, BP-6, Neurotoxicology32 (2011), pp. 400–409.
546 S. Rawat and E.D. Bruce
Dow
nloa
ded
by [
Uni
vers
ity o
f St
elle
nbos
ch]
at 2
2:19
08
Oct
ober
201
4

[47] K. Ibhazehiebo and N. Koibuchi, Temporal effects of thyroid hormone (TH) and decabrominateddiphenyl ether (BDE209) on Purkinje cell dendrite arborization, Niger J. Physiol. Sci. 27 (2012),pp. 11–17.
[48] C.Y. Usenko, D.C. Hopkins, S.J. Trumble, and E.D. Bruce, Hydroxylated PBDEs induce develop-mental arrest in zebrafish, Toxicol. Appl. Pharmacol. 262 (2012), pp. 43–51.
[49] Y. Xiong, K. Ibhazehiebo, T. Iwasaki, and N. Koibuchi, An in vitro method to study the effects ofthyroid hormone-disrupting chemicals on neuronal development, Neurotoxicology 33 (2012),pp. 753–757.
[50] P.R. Kodavanti, C.G. Coburn, V.C. Moser, R.C. MacPhail, S.E. Fenton, T.E. Stoker, J.L. Rayner,K. Kannan, and L.S. Birnbaum, Developmental exposure to a commercial PBDE mixture, DE-71:Neurobehavioral, hormonal, and reproductive effects, Toxicol. Sci. 116 (2010), pp. 297–312.
[51] H. Viberg, Exposure to polybrominated diphenyl ethers 203 and 206 during the neonatal braingrowth spurt affects proteins important for normal neurodevelopment in mice, Toxicol. Sci. 109(2009), pp. 306–311.
[52] S. Zhang, S.J. Bursian, P.A. Martin, H.M. Chan, G. Tomy, V.P. Palace, G.J. Mayne, andJ.W. Martin, Reproductive and developmental toxicity of a pentabrominated diphenyl ether mixture,DE-71, to ranch mink (Mustela vison) and hazard assessment for wild mink in the Great Lakesregion, Toxicol. Sci. 110 (2009), pp. 107–116.
[53] T. Reistad and E. Mariussen, A commercial mixture of the brominated flame retardant pentabromi-nated diphenyl ether (DE-71) induces respiratory burst in human neutrophil granulocytes in vitro,Toxicol. Sci. 87 (2005), pp. 57–65.
[54] P. He, W. He, A. Wang, T. Xia, B. Xu, M. Zhang, and X. Chen, PBDE-47-induced oxidative stress,DNA damage and apoptosis in primary cultured rat hippocampal neurons, Neurotoxicology 29(2008), pp.124–129.
[55] P. He, A.G. Wang, T. Xia, P. Gao, Q. Niu, L.J. Guo, and X.M. Chen, Mechanisms underlying thedevelopmental neurotoxic effect of PBDE-47 and the enhanced toxicity associated with its combina-tion with PCB153 in rats, Neurotoxicology 30 (2009), pp. 1088–1095.
[56] P. He, A.G. Wang, T. Xia, P. Gao, Q. Niu, L.J. Guo, B.Y. Xu, and X.M. Chen, Mechanism of theneurotoxic effect of PBDE-47 and interaction of PBDE-47 and PCB153 in enhancing toxicity inSH-SY5Y cells, Neurotoxicology 30 (2009), pp. 10–15.
[57] C. Yan, D. Huang, and Y. Zhang, The involvement of ROS overproduction and mitochondrialdysfunction in PBDE-47-induced apoptosis on Jurkat cells, Exp. Toxicol. Pathol. 63 (2010),pp. 413–417.
[58] M. Zhang, W.H. He, P. He, T. Xia, X.M. Chen, and A.G. Wang, Effects of PBDE-47 on oxidativestress and apoptosis in SH-SY5Y cell, Zhonghua Lao Dong Wei Sheng Zhi Ye Bing Za Zhi 25(2007), pp. 145–147.
[59] P. Eriksson, E. Jakobsson, and A. Fredriksson, Brominated flame retardants: A novel class of devel-opmental neurotoxicants in our environment, Environ. Health Perspect. 109 (2001), pp. 903–908.
[60] P. Eriksson, H. Viberg, E. Jakobsson, U. Orn, and A. Fredriksson, A brominated flame retardant,2,2’,4,4’,5-pentabromodiphenyl ether: Uptake, retention, and induction of neurobehavioralalterations in mice during a critical phase of neonatal brain development, Toxicol. Sci. 67 (2002),pp. 98–103.
[61] H. Viberg, A. Fredriksson, and P. Eriksson, Neonatal exposure to the brominated flame retardant2,2’,4,4’,5-pentabromodiphenyl ether causes altered susceptibility in the cholinergic transmittersystem in the adult mouse, Toxicol. Sci. 67 (2002), pp. 104–107.
[62] H. Viberg, A. Fredriksson, and P. Eriksson, Neonatal PBDE 99 exposure causes dose-responserelated behavioural derangements that are not sex or strain specific in mice, Toxicol. Sci. 72(2003), pp. 126–126.
[63] H. Viberg, A. Fredriksson, E. Jakobsson, U. Orn, and P. Eriksson, Neurobehavioral derangementsin adult mice receiving decabrominated diphenyl ether (PBDE 209) during a defined period ofneonatal brain development, Toxicol. Sci. 76 (2003), pp. 112–120.
SAR and QSAR in Environmental Research 547
Dow
nloa
ded
by [
Uni
vers
ity o
f St
elle
nbos
ch]
at 2
2:19
08
Oct
ober
201
4
[64] L.J. Greenlund, T.L. Deckwerth, and E.M. Johnson Jr., Superoxide dismutase delays neuronalapoptosis: A role for reactive oxygen species in programmed neuronal death, Neuron 14 (1995),pp. 303–315.
[65] Y. Ishikawa, T. Satoh, Y. Enokido, C. Nishio, T. Ikeuchi, and H. Hatanaka, Generation of reactiveoxygen species, release of l-glutamate and activation of caspases are required for oxygen-inducedapoptosis of embryonic hippocampal neurons in culture, Brain Res. Bull. 824 (1999), pp. 71–80.
[66] T. Wei, Y. Ni, J. Hou, C. Chen, B. Zhao, and W. Xin, Hydrogen peroxide-induced oxidative dam-age and apoptosis in cerebellar granule cells: Protection by ginkgo biloba extract, Pharmacol. Res.41 (2000), pp. 427–433.
[67] S.A. Tittlemier, T. Halldorson, G.A. Stern, and G.T. Tomy, Vapor pressures, aqueous solubilities,and Henry’s law constants of some brominated flame retardants, Environ. Toxicol. Chem. 21(2002), pp. 1804–1810.
[68] S. Mader and M. Windelspecht, Essentials of Biology, 3rd ed., McGraw-Hill Education, New York,2011.
[69] X. Hu, D. Hu, and Y. Xu, Effects of tetrabrominated diphenyl ether and hexabromocyclododecanesin single and complex exposure to hepatoma Hep G2 cells, Environ. Toxicol. Pharmacol. 27(2009), pp. 327–337.
[70] J. He, K.R. Robrock, and L. Alvarex-Cohen, Microbial reductive debromination of polybrominateddiphenyl ethers (PBDEs), Environ. Sci. Technol. 40 (2006), pp. 4429–4434.
[71] X.-Z. Hu, Y. Xu, D.-C. Hu, Y. Hui, and F.-X. Yang, Apoptosis induction on human heptaoma cellsHep G2 of decabrominated diphenyl ether (PBDE-209), Toxicol. Lett. 171 (2007), pp. 19–28.
[72] J. Chen, C. Liufu, W. Sun, X. Sun, and D. Chen, Assessment of the neurotoxic mechanisms of dec-abrominated diphenyl ether (PBDE-209) in primary cultured neonatal rat hippocampal neuronsinclude alterations in second messenger signaling and oxidative stress, Toxicol. Lett. 192 (2010),pp. 431–439.
[73] A.K. Ghose and G. Crippen, Atomic physicochemical parameters for three-dimensional structure-directed quantitative structure-activity relationships. 2. Modeling dispersive and hydrophobic inter-actions, J. Chem. Inf. Comput. Sci. 27 (1987), pp. 21–35.
[74] A.K. Ghose, A. Pritchett, and G.M. Crippen, Atomic physicochemical parameters for three dimen-sional structure directed quantitative structure-activity relationships III: Modeling hydrophobicinteractions, J. Comput. Chem. 9 (1987), pp. 80–90.
[75] J. An, S. Li, Y. Zhong, Y. Wang, K. Zhen, X. Zhang, Y. Wang, M. Wu, Z. Yu, G. Sheng, J. Fu,and Y. Huang, The cytotoxic effects of synthetic 6-hydroxylated and 6-methoxylated polybrominateddiphenyl ether 47 (BDE47), Environ. Toxicol. 26 (2011), pp. 591–599.
[76] X. Yang, H. Xie, J. Chen, and X. Li, Anionic phenolic compounds bind stronger with Transthyretinthan their neutral forms: Nonnegligible mechanisms in virtual screening of endocrine disruptingchemicals, Chem. Res. Toxicol. 26 (2013), pp. 1340–1347.
[77] E. Estrada and E. Uriate, Recent advances on the role of topological indices in drug discoveryresearch, Curr. Med. Chem. 8 (2001), pp. 1573–1588.
[78] J. Gasteiger and M. Marsili, Iterative partial equalization of orbital electronegativity- a rapidaccess to atomic charges, Tetrahedron 36 (1979), pp. 3219–3288.
[79] G. Crippen and A.K. Ghose, Atomic physicochemical parameters for three-dimensional structure-directed quantitative structure-activity relationships I. Partition coefficient as a measure of hydro-phobicity, J. Comp. Chem. 7 (1986), pp. 565–577.
[80] V.N. Viswanadhan, A.K. Ghose, G.R. Revankar, and R.K. Robins, An estimation of the atomic con-tribution to octanol-water partition coefficient and molar refractivity from fundamental atomic andstructural properties: Its uses in computer aided drug design, Math. Comput. Model. 14 (1990),pp. 505–510.
[81] M. Nendza, Structure-Activity Relationships in Environmental Sciences, Chapman & Hall, London,1998.
[82] R. Todeschini and V. Consonni, Handbook of Molecular Descriptors, Wiley-VCH, Weinheim,Germany, 2000.
548 S. Rawat and E.D. Bruce
Dow
nloa
ded
by [
Uni
vers
ity o
f St
elle
nbos
ch]
at 2
2:19
08
Oct
ober
201
4

[83] E. Braekevelt, S.A. Tittlemier, and G.T. Tomy, Direct measurement of octanol-water partition coef-ficients of some environmentally relevant brominated diphenyl ether congeners, Chemosphere 51(2003), pp. 563–567.
[84] T.I. Netzeva, A.P. Worth, T. Aldenberg, R. Benigni, M.T.D. Cronin, P. Gramatica, J.S. Jaworska, S.Kahn, G. Klopman, C.A. Marchant, G. Myatt, N. Nikolova-Jeliazkova, G.Y. Patlewicz, R. Perkins,D.W. Roberts, T.W. Schultz, D.T. Stanton, J.J.M. van de Sandt, W.D. Tong, G. Veith, and C.H.Yang, Current status of methods for defining the applicability domain of (quantitative) structure-activity relationships - The report and recommendations of ECVAM Workshop 52, Atla-Altern LabAnim. 33, (2005), pp. 155–73.
SAR and QSAR in Environmental Research 549
Dow
nloa
ded
by [
Uni
vers
ity o
f St
elle
nbos
ch]
at 2
2:19
08
Oct
ober
201
4